August 4th, 2026 by Roy W. Spencer, Ph. D.
https://www.drroyspencer.com/2026/08/uah-v6-1-global-temperature-update-for-july-2026-0-48-deg-c/
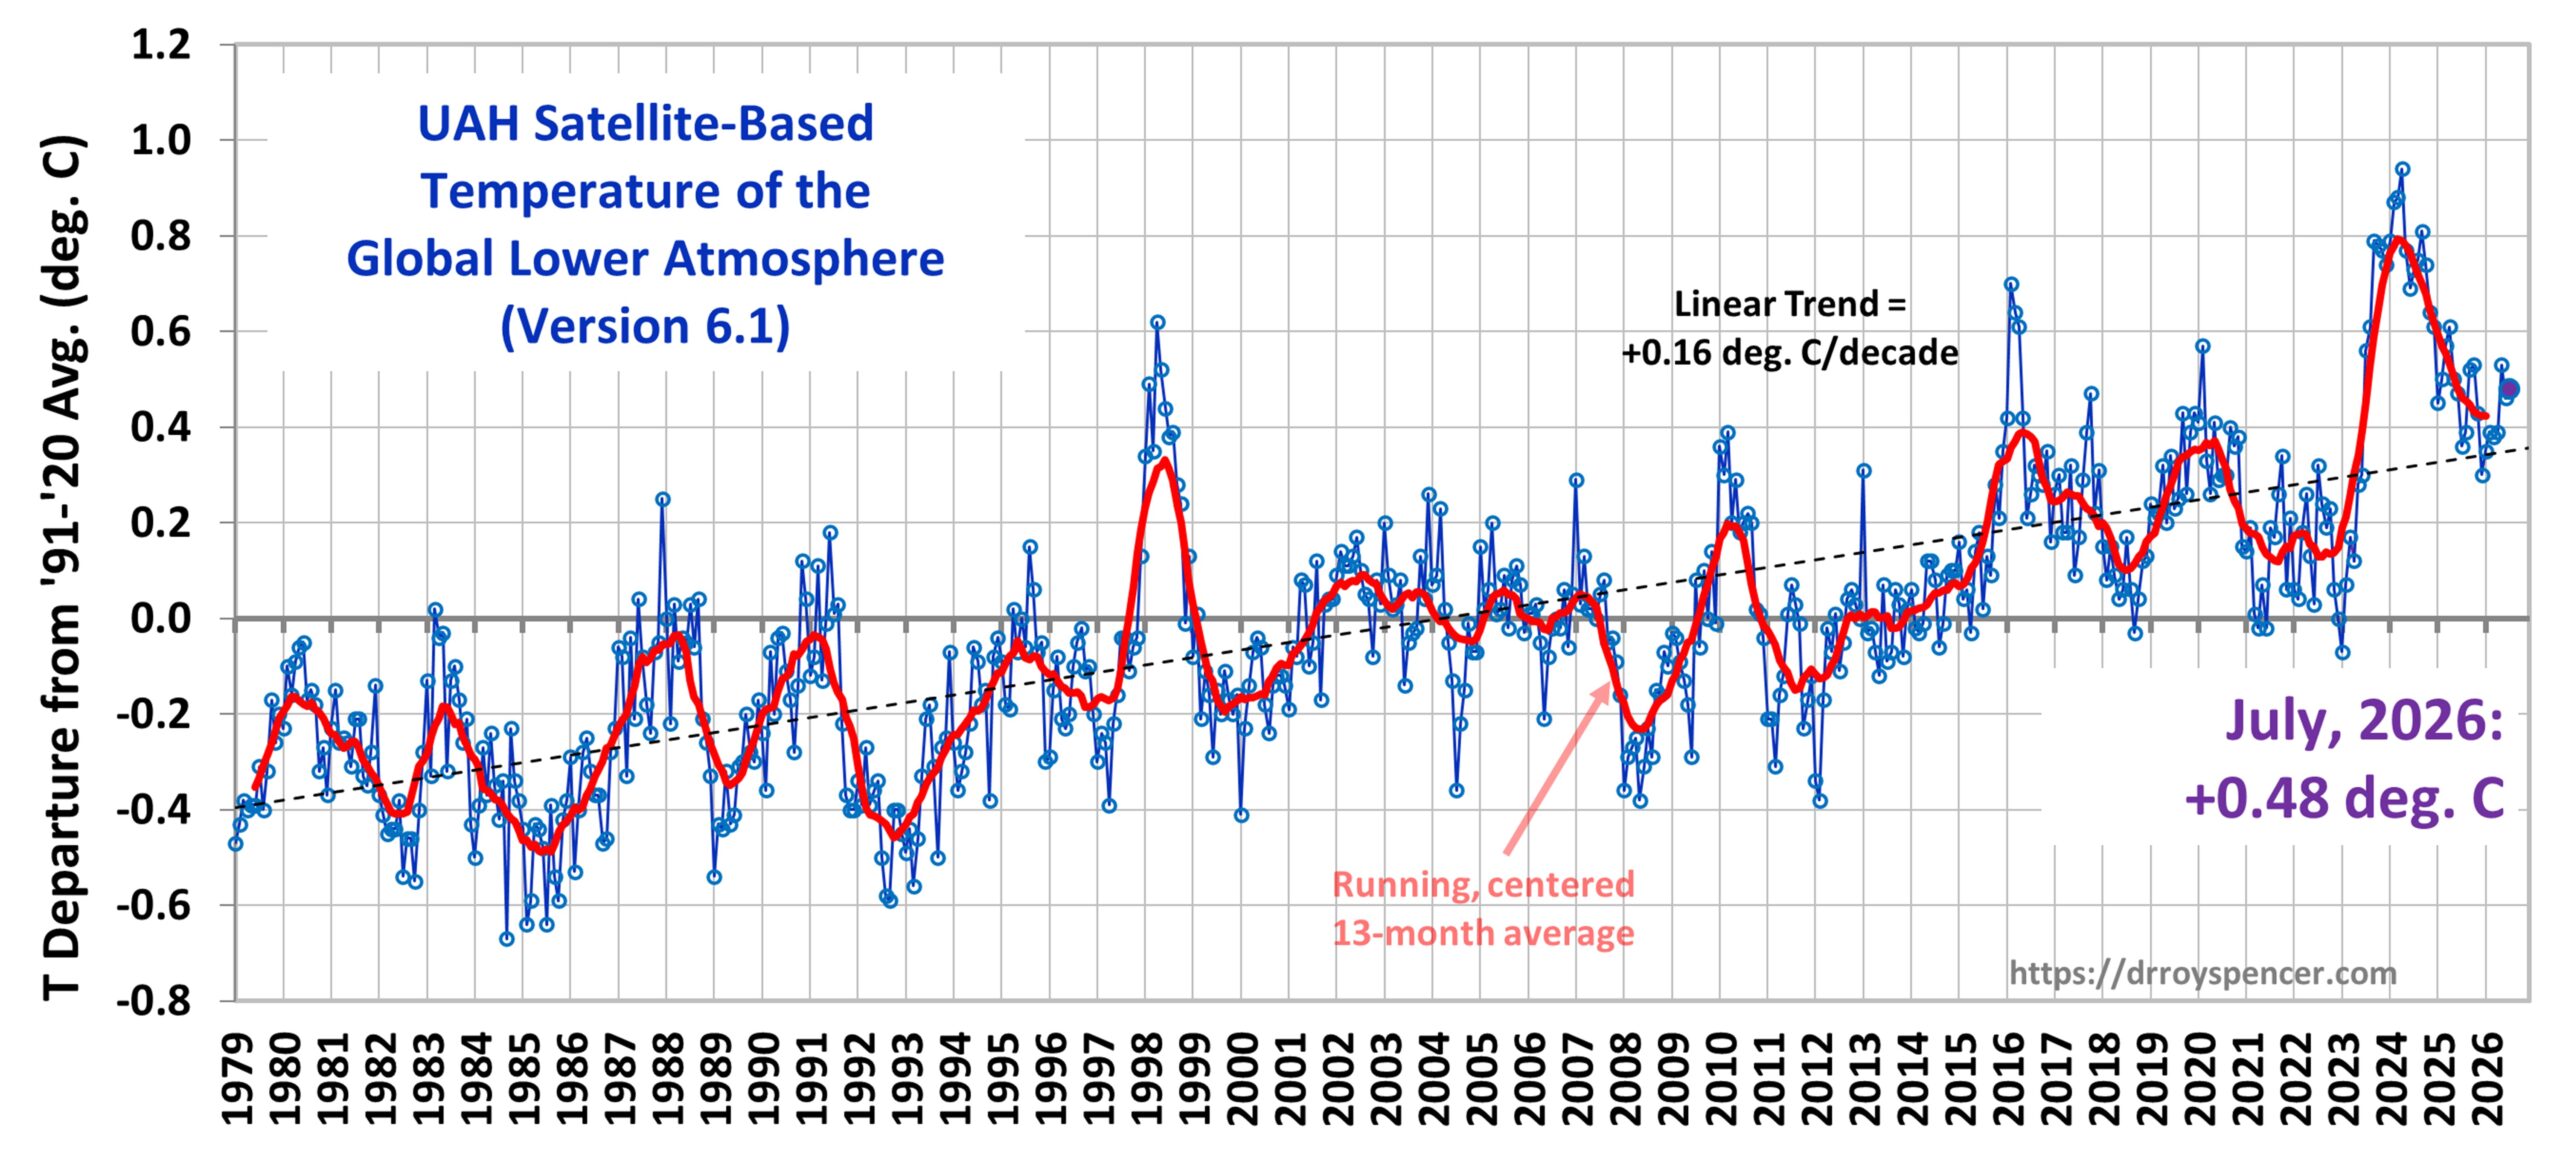
The Version 6.1 global area-averaged linear temperature trend (January 1979 through July 2026) remains at +0.16 deg/ C/decade (+0.22 C/decade over land, +0.13 C/decade over oceans).
Denise Chow
The United States sweltered through its hottest July ever recorded last month, the National Oceanic and Atmospheric Administration confirmed Monday.
Warmer-than-normal temperatures affected the entire contiguous U.S., averaging 76.9 degrees for the month, which was 3.3 degrees above the 20th-century average, according to NOAA.
NOAA's report said July 2026 was not only the warmest July but also the warmest month in the agency's 132 years of record-keeping.
For much of the country, it was a hot and dry month. At the end of July, around 40% of the U.S. and Puerto Rico was in the grips of drought.
The Copernicus report also said that average sea surface temperatures reached their highest levels for July across extrapolar oceans — the bodies of water between latitudes 60 degrees south and 60 degrees north that are free of seasonal sea ice.
https://www.yahoo.com/news/weather-news/articles/u-just-had-hottest-month-201325441.html
Thanks very much, Larry!
This made the headlines everywhere but completely missing were some key elements that make July 1936 MUCH, MUCH MORE extreme. The record was broken because of warmer night time temperatures (drier air cools and heats more). If we did a HEAT INDEX value, then 2026 was closer but still got blown away by 1936.
Here's the authentic data to support that:
This index defines a heat wave as a period lasting at least four days with an average temperature thatwould only be expected to occur once every 10 years, based on the historical record. The index valuefor a given year depends on how often heat waves occur and how widespread they are.
https://ourworldindata.org/grapher/heat-wave-index-usa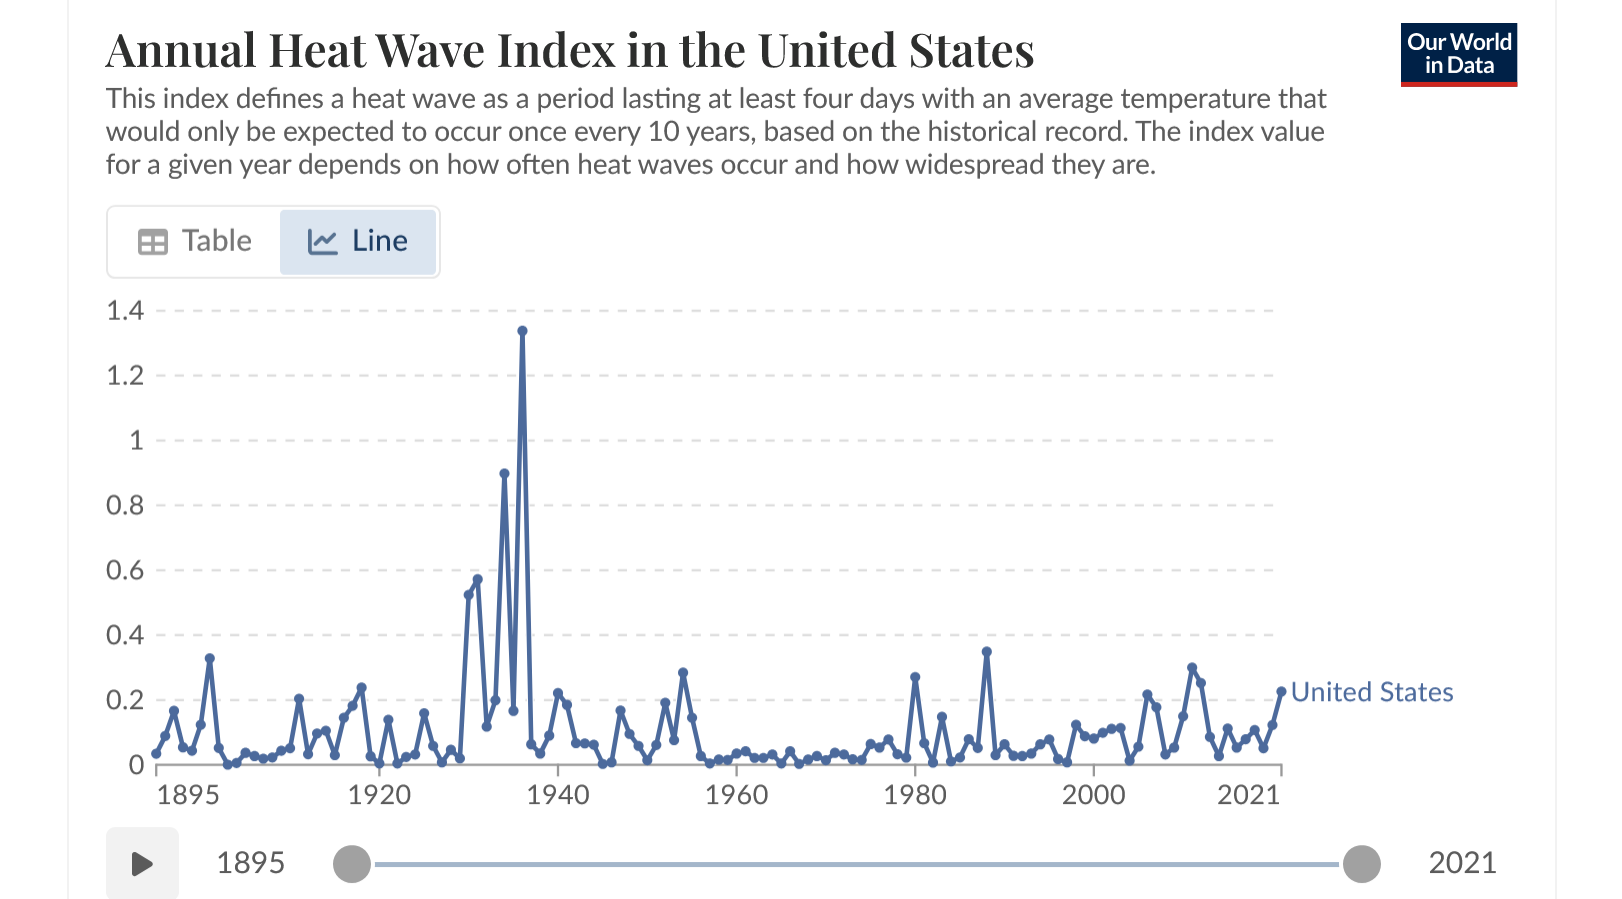
++++++++++++++++++++
https://www.wunderground.com/cat6/North-Americas-Most-Intense-Heat-Wave-July-and-August-1936

Interestingly, February 1936 remains the coldest February on record for the contiguous U.S., with an average nationwide temperature of 25.2°F. (The single coldest month on record was January 1977, with a 21.9°F average.) Temperatures fell as low as –60°F in North Dakota, an all-time state record. Turtle Lake, North Dakota averaged –19.4°F for the entire month, the coldest average temperature ever recorded in the contiguous United States for any month. One town in North Dakota, Langdon, stayed below 0°F for 41 consecutive days (from January 11 to February 20), the longest stretch below zero (including maximum temperatures) ever endured at any site in the lower 48.
With this in mind, it is truly astonishing what occurred the following summer. In North Dakota, where temperatures had dipped to –60°F on February 15, 1936, at Parshall, it hit 121°F at Steele by July 6. The two towns are just 110 miles from one another!
++++++++++++++
d͏e͏t͏s͏p͏S͏n͏o͏o͏r͏l͏1͏9͏o͏b͏l͏i͏8͏c͏8͏9͏ ͏5͏8͏,͏3͏m͏t͏0͏9͏r͏6͏9͏u͏a͏m͏a͏5͏c͏4͏ ͏2͏3͏c͏O͏i͏2͏t͏5͏4͏0͏2͏1͏t͏3͏8͏h͏e͏f͏a͏ · US states that set their all time record high temperatures during the 1930s or priorShared post

+++++++++++++
How many all time hottest state temperature records were smashed in July 2026?
Zero!
A few individual cities had there hottest temperatures in history, however. during BRIEF heat waves that we covered here, including the other heat wave earlier in the month.
7-9-26 Brief/Intense Heat Wave Northern Plains next week
33 responses |
Started by metmike - July 9, 2026, 4:03 p.m.
https://www.marketforum.com/forum/topic/121451/
+++++++++++++
6-25-26 MAJOR heat(humidity) wave coming next week
41 responses
Started by metmike - June 25, 2026, 3:49 p.m.
https://www.marketforum.com/forum/topic/121123/
+++++++++++++++++
AI Overview
Now that we FIRST showed you the authentic facts which MATTER THE MOST about the significance of the historic July 1936 heat, let's reintroduce the same link from the previous page with additional graphics so that you can better appreciate THE BIG PICTURE:
https://www.wunderground.com/cat6/North-Americas-Most-Intense-Heat-Wave-July-and-August-1936

Compare that to the previous map below that, instead of average temperatures above, is a comprehensive map that evaluates actual HEAT WAVES. Heat waves and extreme weather in July 2026 were MUCH less by a wide margin compared to July

How can BOTH these graphs be true at the same time, one might ask?
2 things that seem to completely contradict each other can be true at the same time.
The question then would be "which July do you think had the most extreme heat and extreme adversity based purely on the weather?" (not considering technology like air conditioning?
Which one is the media/information gatekeepers proclaiming to be the NEW hottest ever to a vast, vast majority of people that have no clue about the difference above.
The NOAA global has July tied with July 2024 as the hottest month ever.
Full report:
https://www.ncei.noaa.gov/access/monitoring/monthly-report/global/202607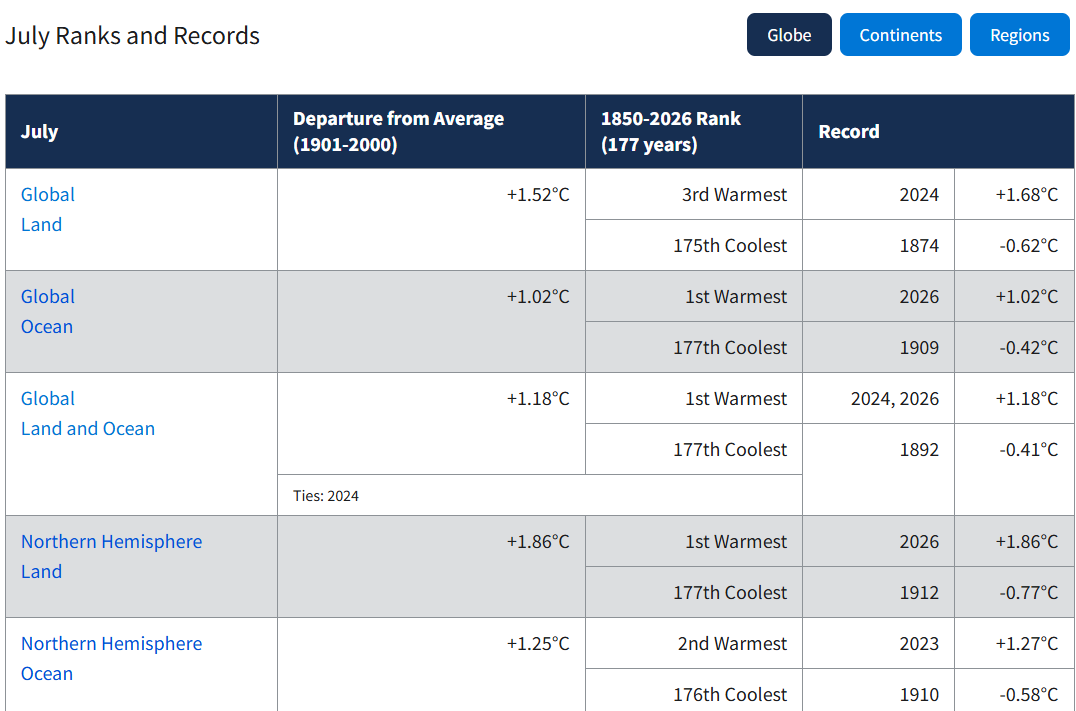
Thanks, patrick,
With the SUPER El Nino burping heat from the east/central Pacific Ocean into the atmosphere later this year, new record warm temperatures are inevitable.
Bill Weir, CNN's extreme climate crisis cheerleader just now: "July 2026 just blew away every month during the Dust Bowl for heat!"
This guy makes me cringe every time he's on because he uses the ANTI Golden Rule of extreme weather/climate.
https://cliffmass.blogspot.com/2016/03/the-golden-rule-of-climate-extremes.html
The GoldenRule
Considering the substantial confusion in the media about this critical issue, let me provide the GOLDENRULE OF CLIMATE EXTREMES. Here it is:
The more extreme a climate or weather record is, the greater the contribution of natural variability.
Or to put it a different way, the larger or more unusual an extreme, the higher proportion of the extreme is due to natural variability.
+++++++++++++
The Bill Weir Golden Rule for reporting on weather/climate:
The more extreme a climate or weather record is, the greater the contribution of natural variability climate change.
Or to put it a different way, the larger or more unusual an extreme, the higher proportion of the extreme is due to natural variabilityclimate change.
++++++++++++
FYI, I have some disagreements with Cliff's recent posts on wildfires in the West(that I believe, increasing CO2 is making worse), despite considering him a sold source overall.
Sadly, Bill represents the majority of the media and gatekeepers of information on this topic. Make no mistake, the planet has warmed by ~2 deg. F because of human emissions of CO2 from burning fossil fuels and there are negatives (and positives) related to that. However, the biggest contribution from CO2, by an extremely wide margin has been to the realm defined by the indisputable law of photosynthesis.........AS A BENEFICIAL GAS!
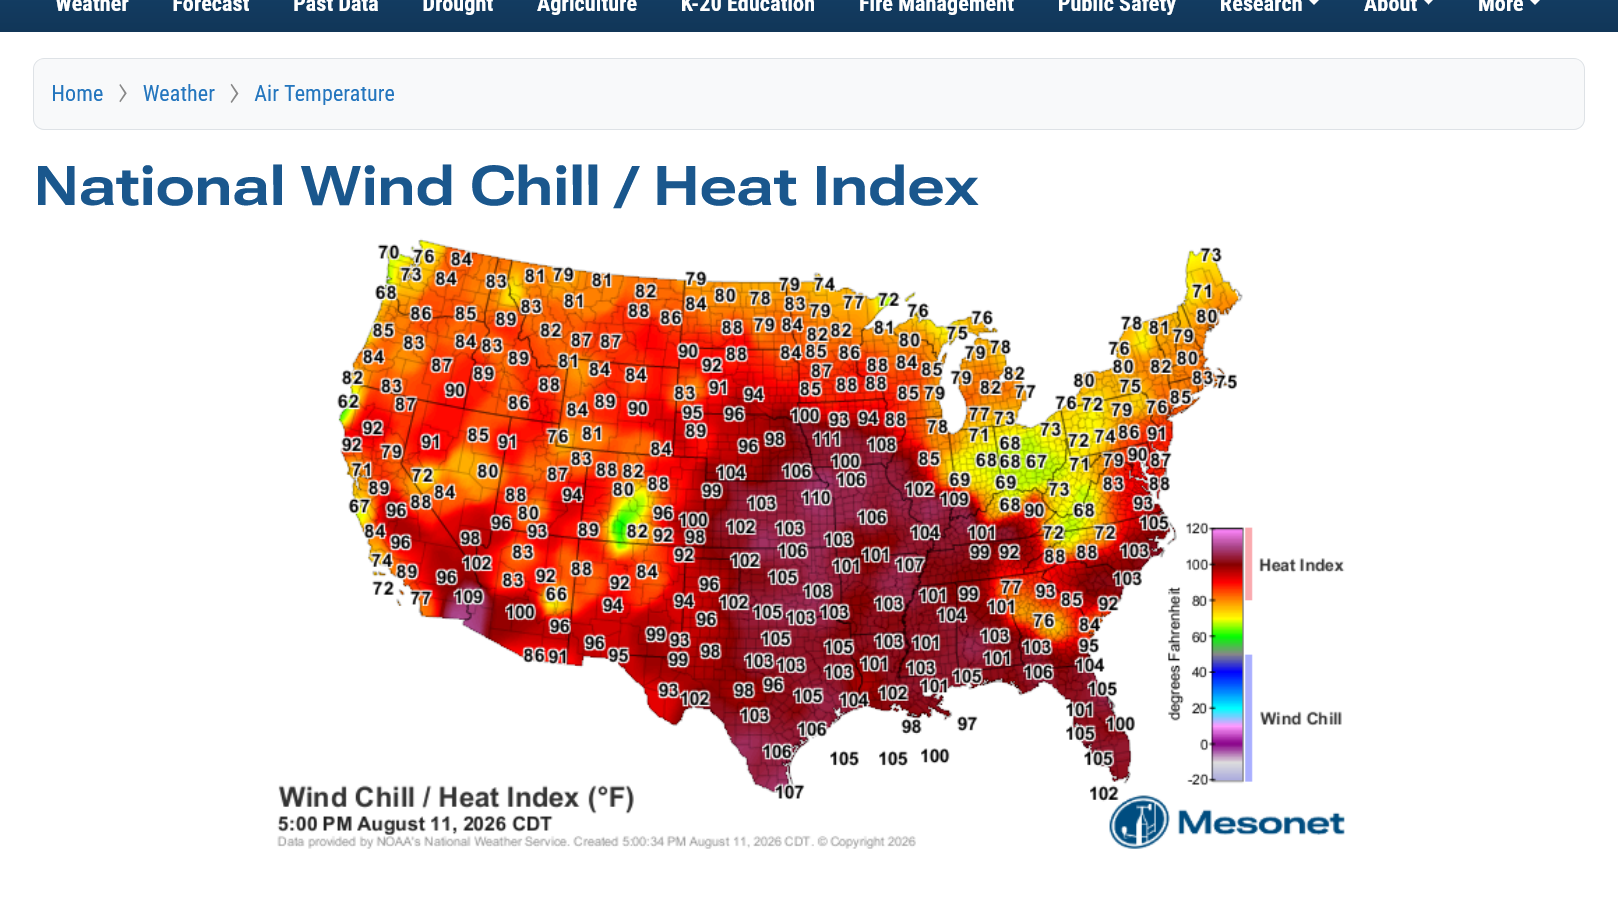
We're having another heat wave right now! This time in the SouthCentral part of the country!
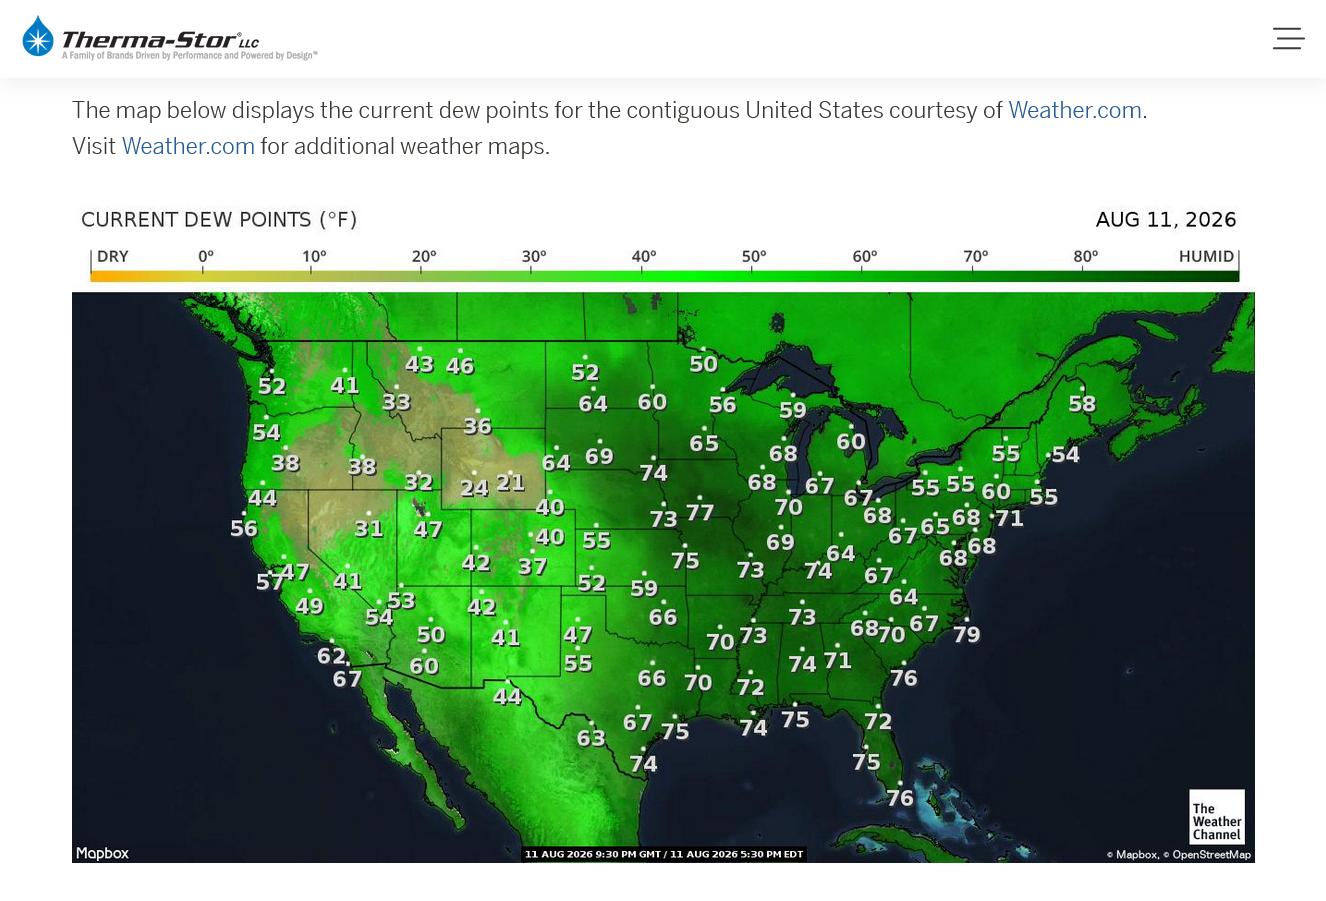
These were the 5pm CDT readings. Evansville, IN tied our hottest temperature of the Summer with a high of 96 degrees F earlier this afternoon!
https://www.mesonet.org/weather/air-temperature/national-air-temperature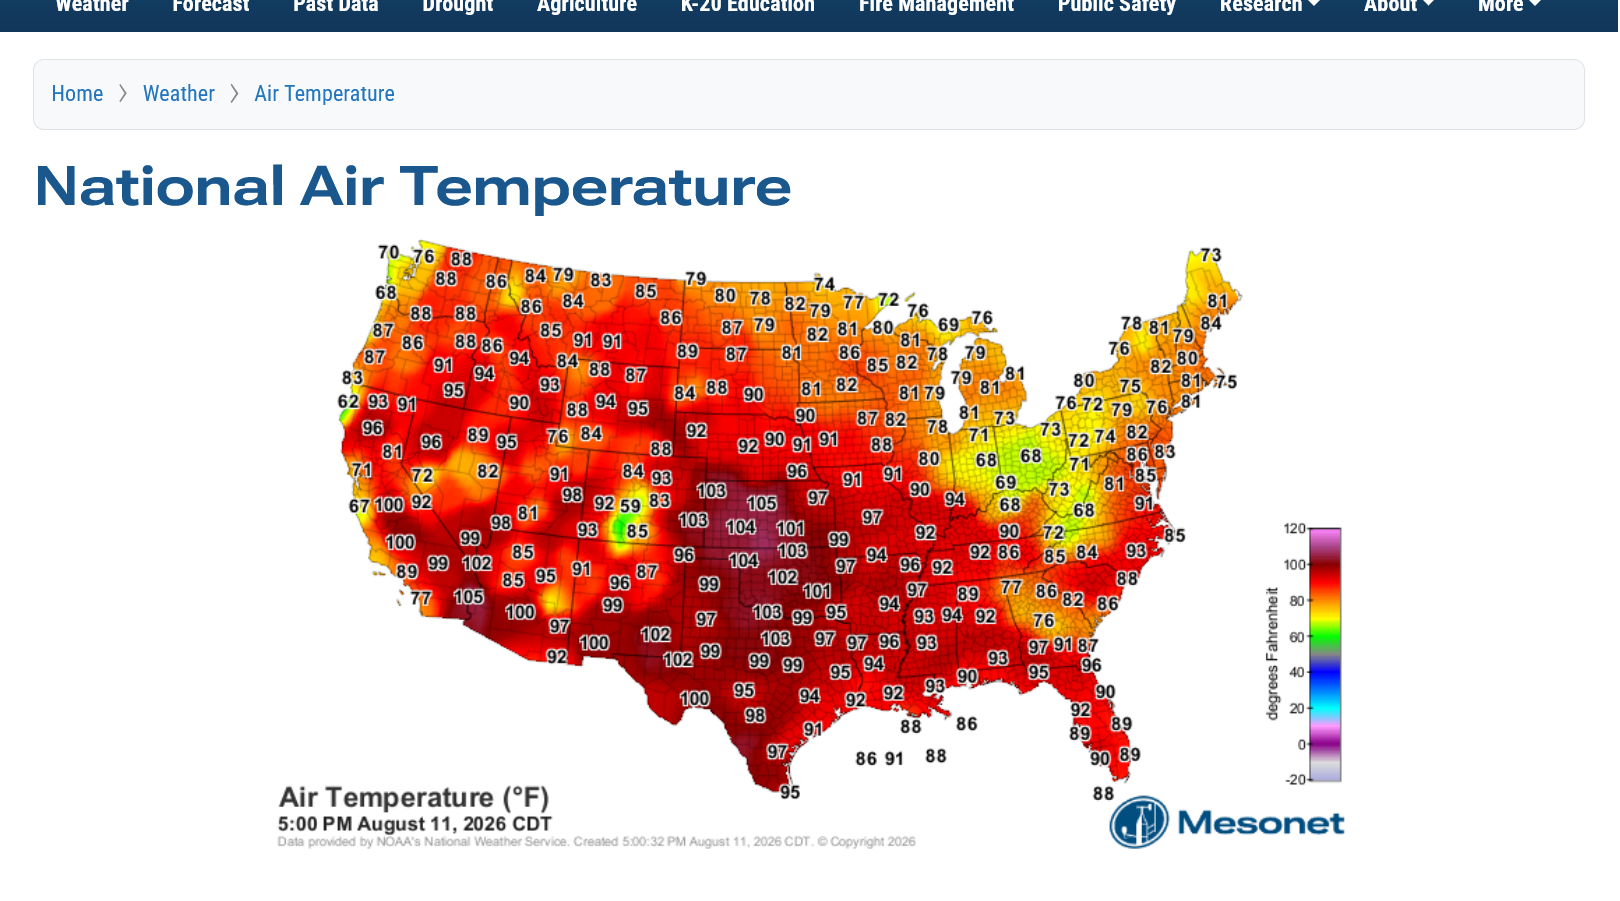
https://www.mesonet.org/weather/air-temperature/national-wind-chill-heat-index
Eric shows us that 2026 was in 6th place for hottest maximum temperatures just after 5 minutes.
Aug 12, 2026: July 2026 - Hottest on Record (Let’s Chat About This) | Tuesday’s Derecho + LARGE HAIL
https://www.youtube.com/watch?v=xMd6NayGMSc
Hottest months by maximum's(extremes)
1. 1936
2. 1934
3. 1901
4. 2012
5. 2006
6. 2026-This past July
7. 1931
8. 1980
9. 1952
10. 2022
As explained here before:
1. Global warming is warming the coldest places, during the coldest times of year and coldest times of day/night the most, partly because the radiation absorption bands of H2O overlap with CO2. The more H2O there is in the air, the less radiation absorption band width left for CO2 to absorb.
2. July in the Northern Hemisphere is the hottest, most humid month of the year. Global warming's impact is the LEAST in July of the 12 months!
3. The record warmest ever occurred in July 2026 because LOW TEMPERATURES were record warm this past month by a huge margin that caused both highs/lows combined to be the warmest.
++++++++++++++
Added: The data above is for the United States only.
AI Overview
The land area of the United States is about 9.15 million square kilometers (3.53 million square miles). This makes up roughly 6.15% of the total land surface area on Earth, or about 1.87% of the planet's absolute total surface area (including oceans).
Also, start Eric's video at the 4 minute mark to get the full explanation!
Thanks, Mike and Patrick. Great discussion.
Just to clarify for the readers, July of 2026 is officially the hottest month on record for the CONUS. It was hotter than it was in July of 1936 in the CONUS.
Thanks, Larry!
I made a clarification to dial that in for you but its a great point. The United States has some extreme anomalies that often contrast with the rest of the world because of our unique geography and crop areas during the growing season that mean everything to the specific climate.
This is just 1 state, Illinois in the middle of the country(along with a dozen more that had similar conditions) but it's also part of the most productive crop growing region in the world and crop production is impacted massively by the weather.
The heat and drought of July 1936(when people didn't have air conditioning was 10+ times more impactful than the heat of July 2026!!!
https://www.weather.gov/ilx/july1936heat
Peoria:
++++++++++++++
That amount of heat is difficult to comprehend/imagine for people with no AC and trying to grow a crop.
All the headlines the past week are about how 2026 was HOTTER than 1936.
Who in their right mind would pick having July 1936 weather over last month? Even if you lived in the Northeast US, that wasn't as hot in 1936, no way that you would want the current crops in the Midwest/Plains to be destroyed by the July 1936 weather.
The USDA came out with the latest crop production estimate yesterday. This last July did cause some adversity that reduced the crop size a bit but we still have one of the biggest crops in history on the way this Fall!
And we can thank photosynthesis, where CO2 plays a key role.
In 1936, CO2 was around 310 parts per million and its around 430 ppm now. For every +5ppm increase,on average plants grow 1% bigger. Adding another 120 ppm equates to +24% increase in the growth of our crops(each plant is different).
More CO2 also increases a plants drought tolerance(water efficiency) since they don't need to open their stomato as wide to get CO2, which causes water loss from their roots.
So the crops in 1936 would have done MUCH BETTER if the CO2 was the same as today, even without the better technology of 2026.
Crops=food.
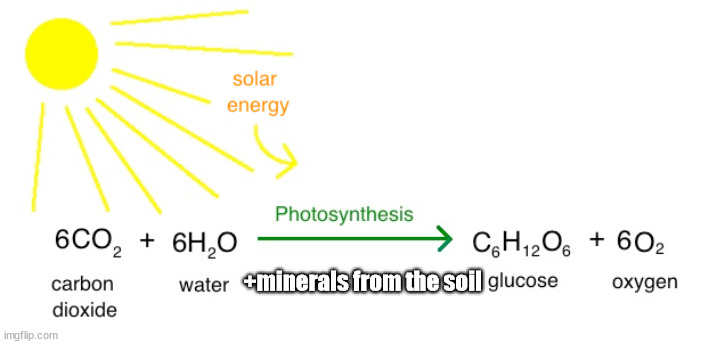
Let's look at the real world that doesn't react to news stories but instead, reacts to science, biology and agronomy that includes the fact that CO2 is still LESS THAN HALF the optimal level and the increase of this BENEFICIAL GAS is doing much more good than harm to life on planet earth.
The USDA, yesterday dialed in that July weather that impacted crop conditions/ratings to the August crop production estimate.
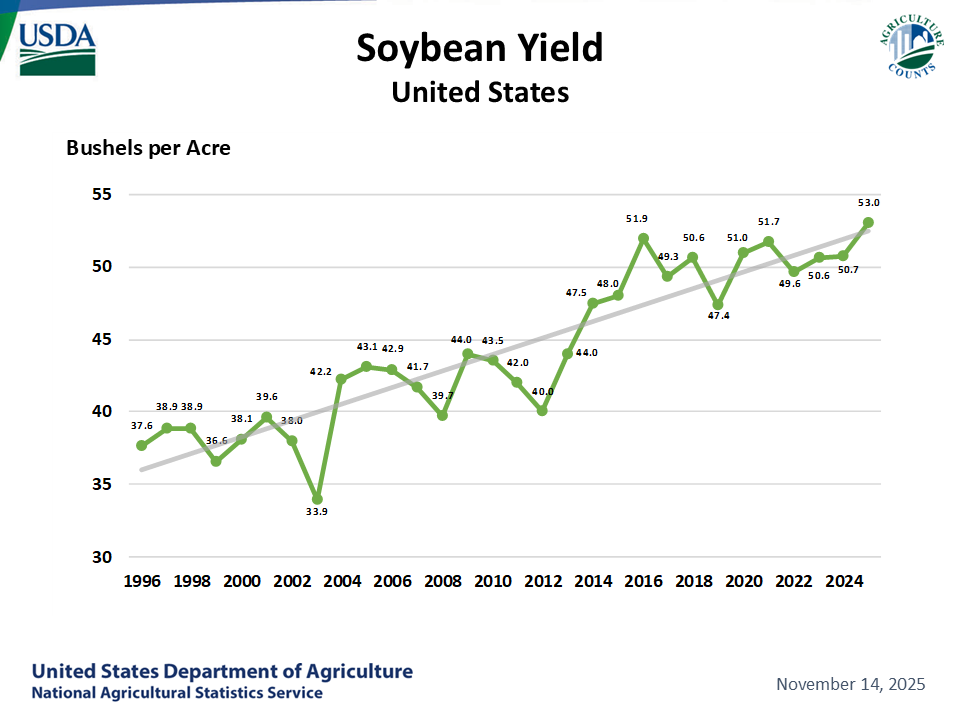
Soybean yields were lowered by .1 bushels/acre! .1 bushel/acre from the record in 2024 and 2nd highest in history.
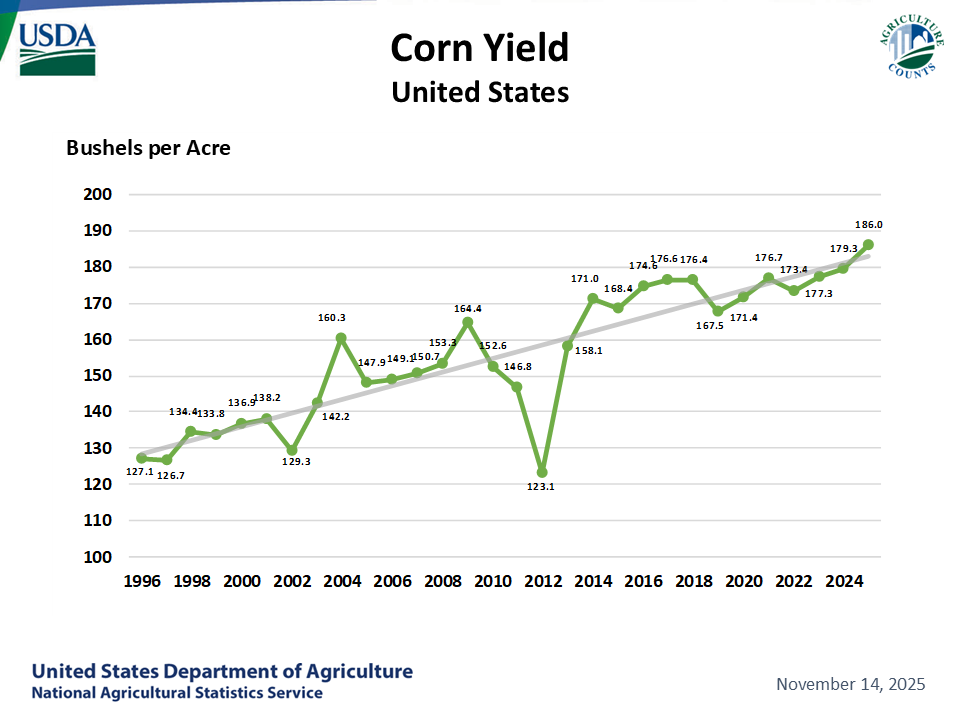
Corn yields were lowered by .5 bushels/acre! At 182.4 bushels/acre this is the 2nd highest in history.
https://www.marketforum.com/forum/topic/122062/#122205
https://www.nass.usda.gov/Charts_and_Maps/Field_Crops/soyyld.php
+++++++++
We've been told for the past 3 decades that the hot Summers and drought from the climate crisis would greatly reduce food production. Now that we've had the hottest July in history here in 2026 (from a weather anomaly) one would think that massive damage should have happened, coinciding with the predicted huge drop in food production finally coming to pass(outside of the 1 year anomaly-2012).
The hot/dry weather for sure dropped yields.........a bit but just enough to keep us from having another record high in yields.
When you dial in the benefits from increasing CO2(drought tolerance to all plants/crops) and huge boost in photosynthesis (~28% on average but varies by plant/crop) it turns out that instead of a climate crisis, the added CO2 is part of the climate OPTIMUM for most life on this planet.
The graphs above don't lie. The real world doesn't lie.
8-13-26 MORE Heat wave in the South but shifts west in week 2!
Started by metmike - Aug. 13, 2026, 4:07 p.m.
AI Overview
++++++++++++++++++
AI Overview
AI Overview
+++++++++++++++
So 5,000 killed by the heat in 1936 is the equivalent of 14,000 dead from heat in 2026.
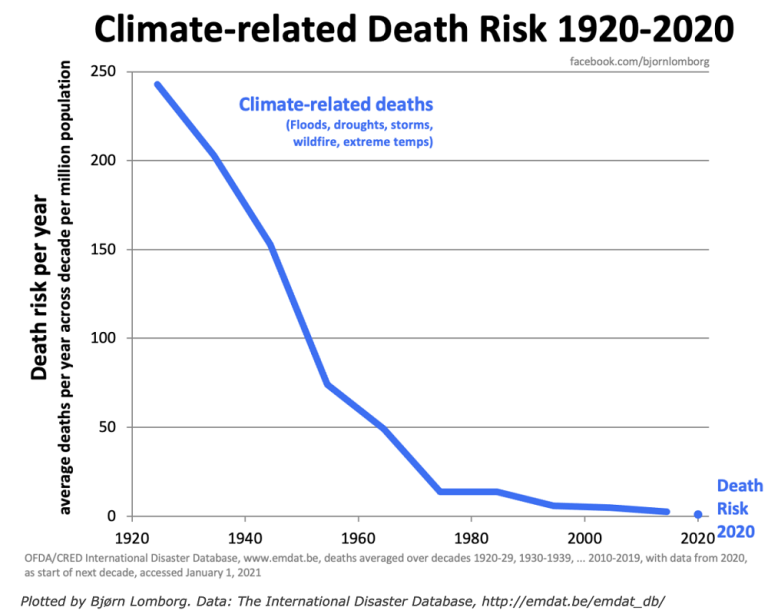
The stats are not final yet but the 70 that died from the July 2026 year was 20 times less than those that died from 1936 heat wave based on population.
Very consistent with the other stats on the graph below.
No question that earth has warmed up ~2 deg. F the past century because of the physics of greenhouse gas warming caused by humans burning fossil fuels with MASSIVE CO2 emissions.
CO2 is up from under 300 ppm(with the planet suffering CO2 starvation) at the time of the Industrial Revolution to around 430 ppm in 2026...........with the optimal level for life being 900 ppm.
That is massively INCREASING crop production NOT reducing it!
And technology is allowing humans to ADAPT to the heat as well as other weather elements. Plants and animals on the other hand are doing better from the increase in CO2 and slight warming.
8-13-26 MORE Heat in the South but shifts west in week 2!
Started by metmike - Aug. 13, 2026, 4:07 p.m.

++++++++++++
https://www.sciencedaily.com/releases/2026/08/260814235845.htm
+++++++++++++
This may appear to be alarming. However, there are numerous factors at play, not limited by my list below.
1. The current level of CO2 is around 430 parts per million. The optimal level for life is more than double this at ~900 ppm, depending on the plant/life form.
2. Typical levels of CO2 indoors can get close to 1,000 ppm. People are spending much more time indoors, including during this study. During the time frame of the study, ambient atmospheric CO2 went from 369 ppm to 420 ppm and increase of +51 ppm.
a. That amount of increase is only around +10% compared to the increase indoors vs outdoors.
b. So that increase would add an ADDITIONAL +10%
3. This increase may not be harmful but in fact be evidence of our bodies to quickly acclimate to the increase in CO2.
4. On the other hand, there may be a subtle, long term negative impact that isn't clear right now.
5. This would likely impact other animals.
6. We are not even half of the OPTIMAL level of CO2 for plants that are growing 28% faster and bigger, just from the increase in CO2 from ~290 ppm = CO2 starvation to 430 ppm.
Death by GREENING!
55 responses |
Started by metmike - May 11, 2021, 2:31 p.m.
https://www.marketforum.com/forum/topic/69258/
+++++++++++++
https://pmc.ncbi.nlm.nih.gov/articles/PMC7701242/
++++++++++
So here's one of the things for me. We already have massive, real world experiments with billions of people taking place on planet earth, comparing people that spend most of their lives OUTDOORS, where the CO2 levels are the lowest with people that spend most of their lives INDOORS. Some of those humans, as in TEACHERS spend much of the work day in an environment with elevated CO2 levels(classrooms packed with dozens of students). The difference between those 2 environments and the massive number of people have certainly provided us with a huge sample size and very long time frame to gather the data.
I have seen no studies or correlation to human health related to that, DESPITE the optimal environment to detect it. With that being the case, it seems unlikely that the slow incremental increase in CO2 is having a significant impact on human health.
Yes, it's having a very small and measurable impact, as we would expect and as detected in these studies. So far, no indication of negatives but you can bet that in the current environment of fake climate crisis advocacy, biased studies will emerge that tell us bad things.
Re: Re: Scientific Laws and Theories you...might want to know-dirty tricks/violations
By metmike - Aug. 18, 2026, 12:42 p.m.
++++++++++++++++++++
Here is the biggest reason for why this will run its course and never be a huge deal!
Fossil fuels are finite and they will start RUNNING OUT in a few decades! The highest that CO2 levels could possibly get is 600 ppm and we will likely peak closer to 500 ppm!!!!
CO2 & Climate discussion July 2026
By metmike - July 10, 2026, 7:30 p.m.
+++++++++++++
CO2 & Climate discussion July 2026
By metmike - July 10, 2026, 7:26 p.m.
++++++++++++++++
Re: Re: Re: Global temperature anomaly for June 2026-UAH/CO2 & Climate discussion By metmike - July 12, 2026, 4:02 p.m.
But hold on now, fossil fuels running out WILL BE the huge problem NOT THE END OF THE PROBLEM!!!
Not just fossil fuels but most other natural resources ARE FINITE!
There are well over 8 billion humans on the planet and potentially headed to 10 billion. We consume massive amounts of natural resources. We will NOT be able to consume many of them at the current rate for the next 100 years because they will be running out.
Forget the climate crisis, we have an OVER CONSUMPTION CRISIS!!!!
The real environmental crisis's
32 responses |
Started by metmike - April 10, 2019, 7:11 p.m.
August 18, 2026
Extreme weather is making Americans feel powerless
The same people affected by extreme weather are also likely to worry that they will face a future disaster, according to a new poll
++++++++
I had a constant subscription with Scientific American for 2 decades but discontinued when they turned into climate crisis prostitutes.
I would be fine if they covered stories like this with perspective and objectivity. Not just exaggeration, sensationalism and cherry picking.
That is NOT science. It's extremely dishonest political advocacy and very one sided at that.
For starters:
People reading the article above are led to believe that the plunging line above must be going in the complete opposite direction. ......up.
+++++++++++++
There absolutely has been global warming of around 2 Deg. F and most of it from the CO2 emissions from burning fossil fuels. There have been numerous NEGATIVES from that, as well as the biggest benefit from the role of CO2 as a beneficial gas in photosynthesis.
And most of the plunging deaths above have come from technological advancements and adaptation NOT better weather(although in some realms, like violent tornadoes that has decreased by 50%) but there are 2 extremely critical elements that actually TRUMP all that.
There really are extremely serious ENVIRONMENTAL ISSUES that we should be addressing.
The real environmental crisis's
32 responses |
Started by metmike - April 10, 2019, 7:11 p.m.