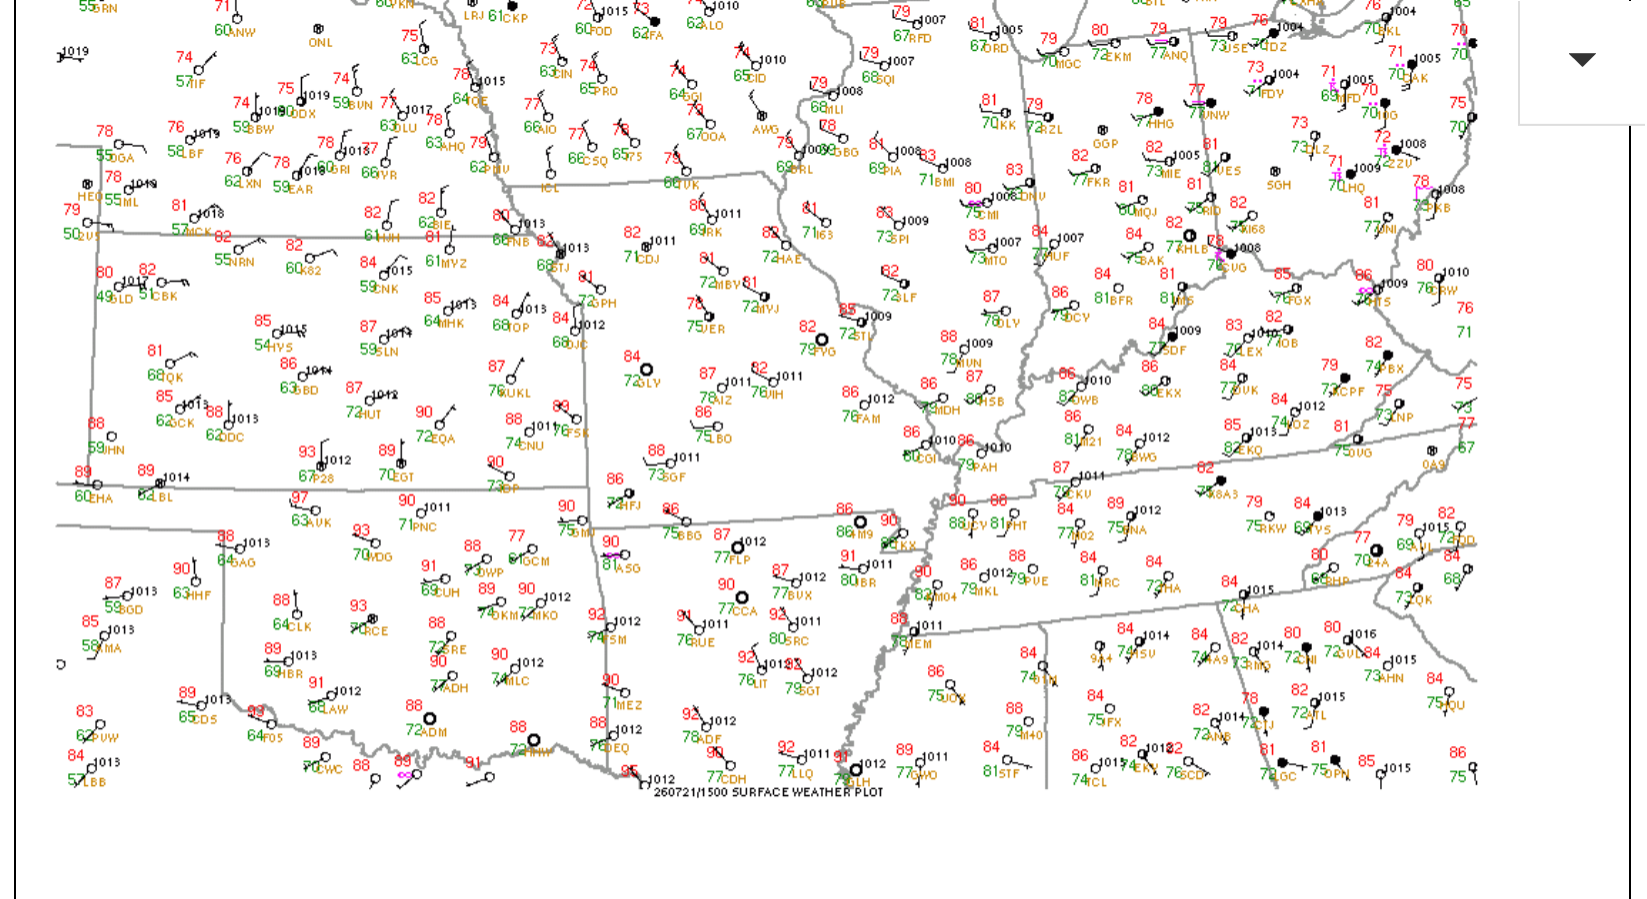
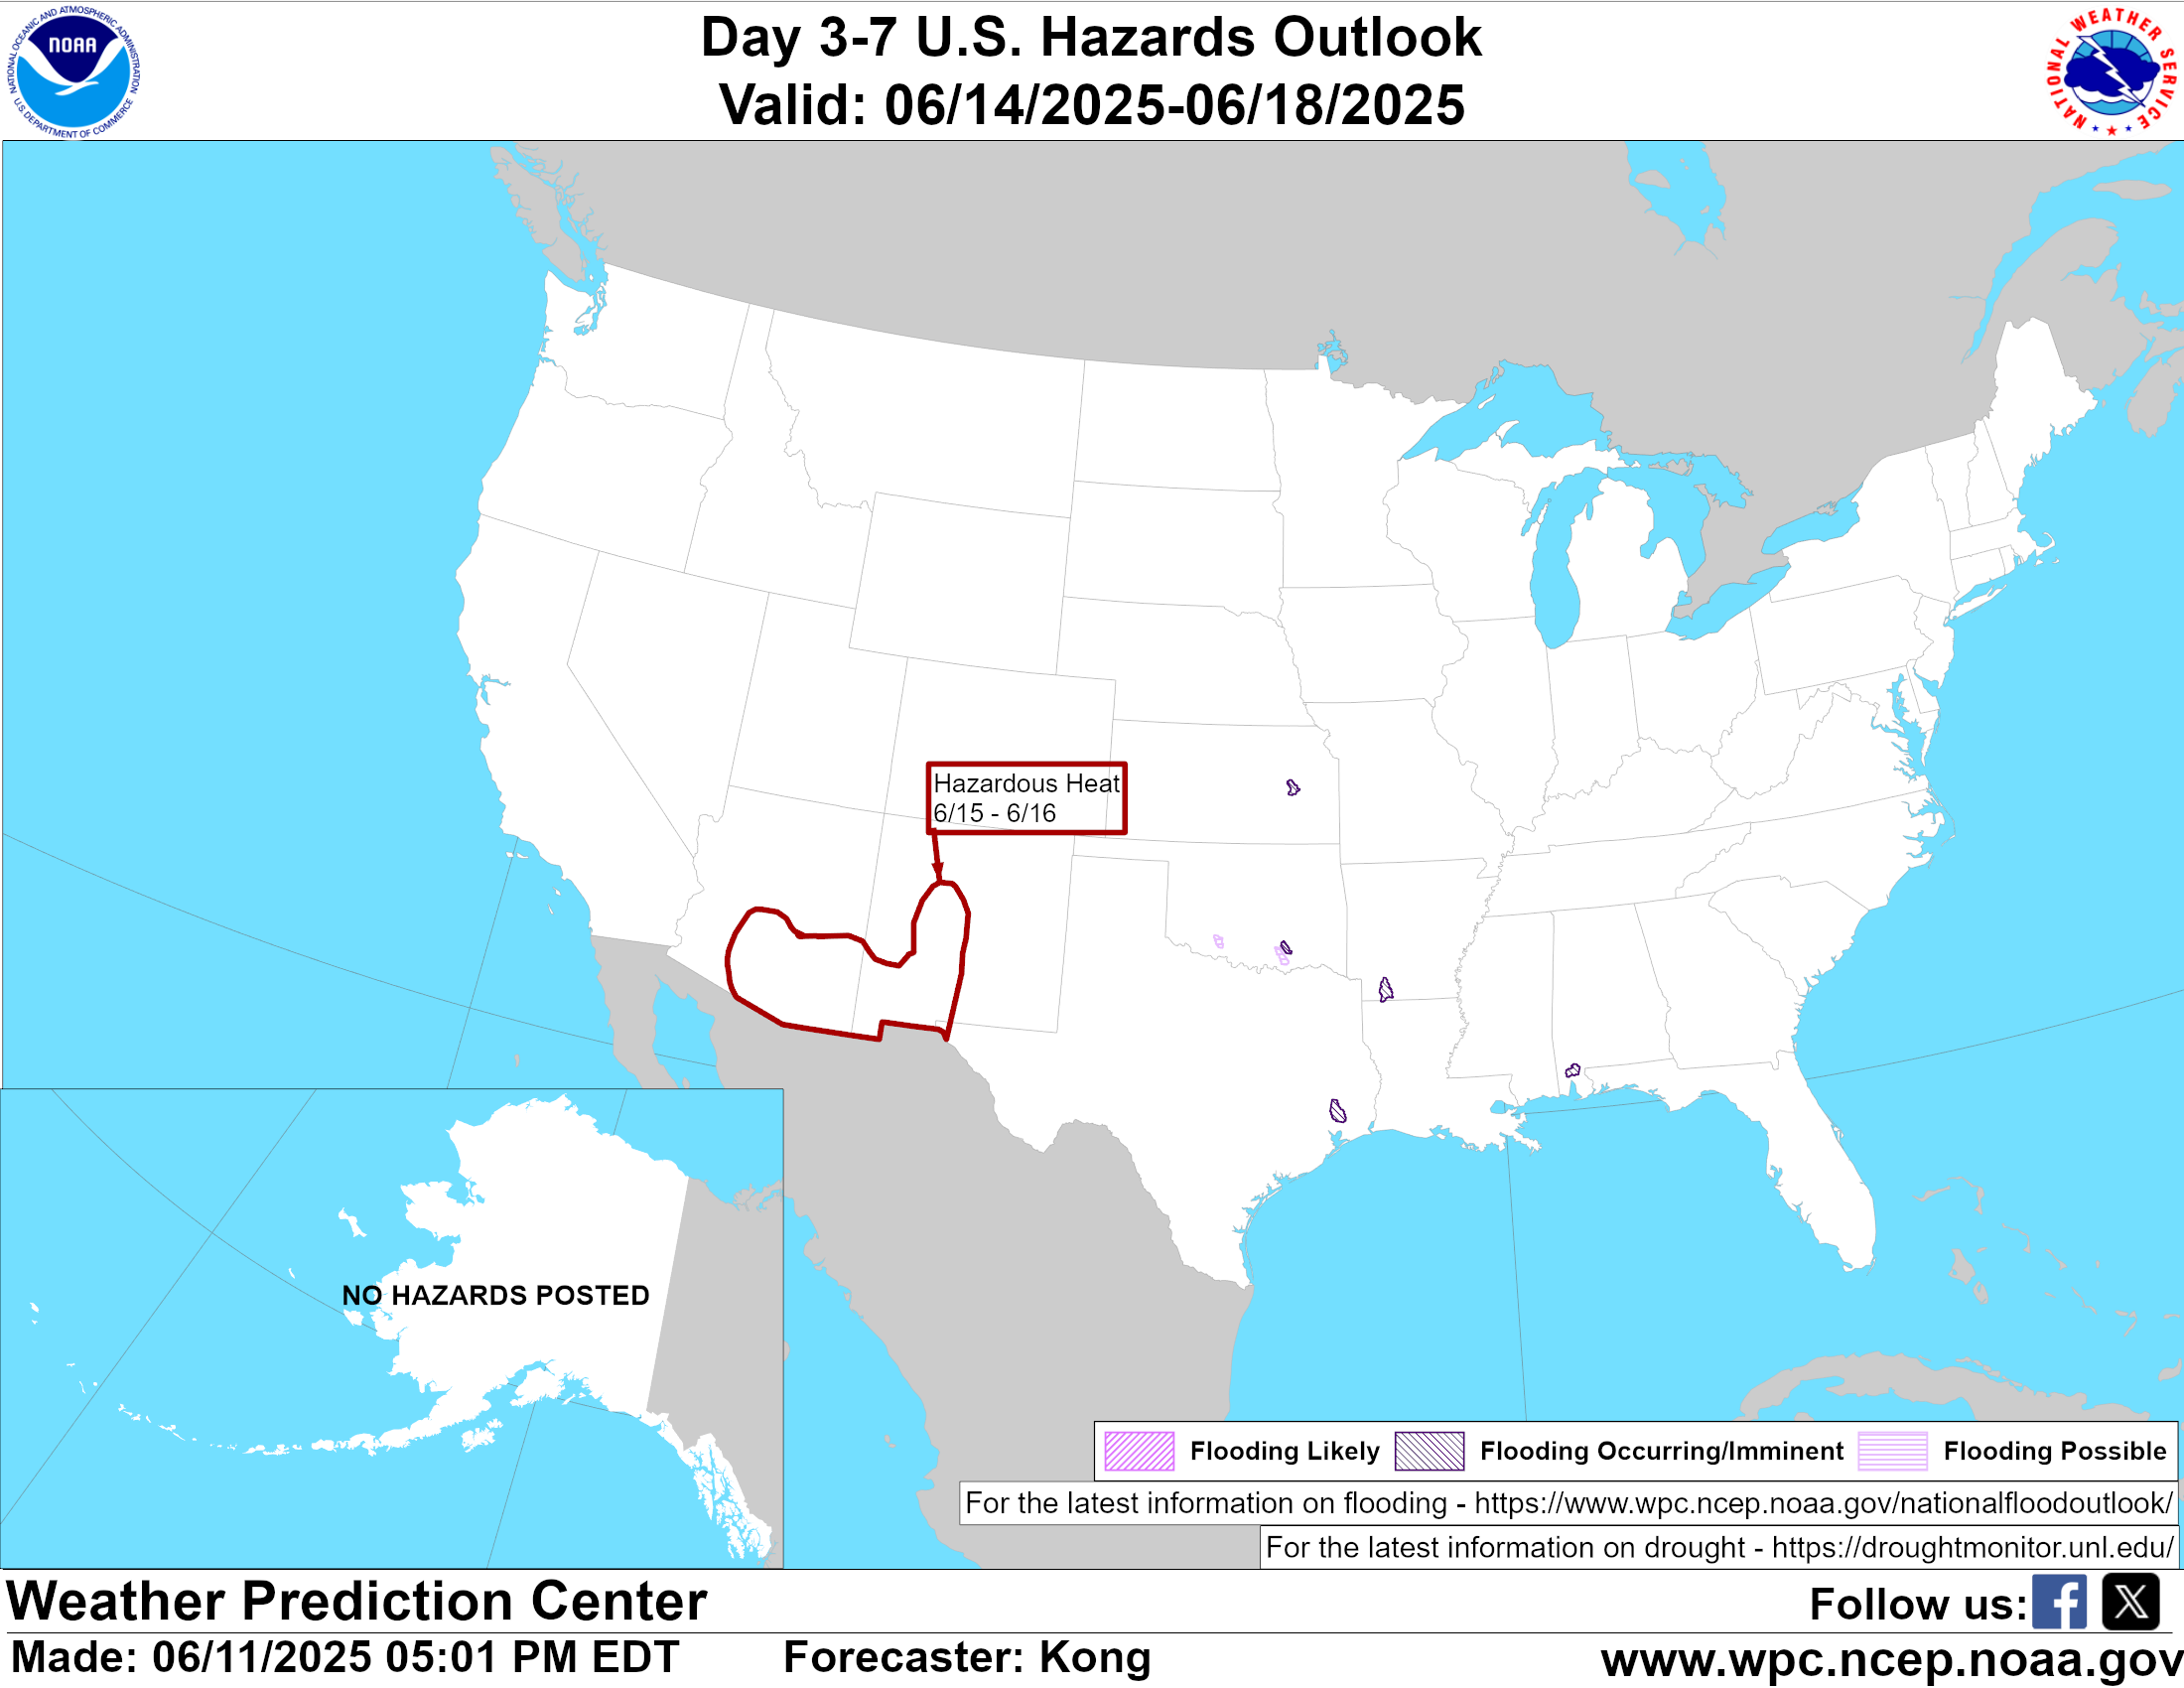
This was the heat wave last week much farther east:
6-25-26 MAJOR heat(humidity) wave coming next week
Started by metmike - June 25, 2026, 3:49 p.m.
https://www.marketforum.com/forum/topic/121123/
+++++++++++++++++++++++++++++++++++=
Get all the comprehensive weather here:
https://www.marketforum.com/forum/topic/83844/
This is what spiked the C and S market on Sunday Night. It also helped natural gas a bit early in the week.
Re: Re: : Grains--post breakout of July 6
By metmike - July 8, 2026, 4:40 p.m.
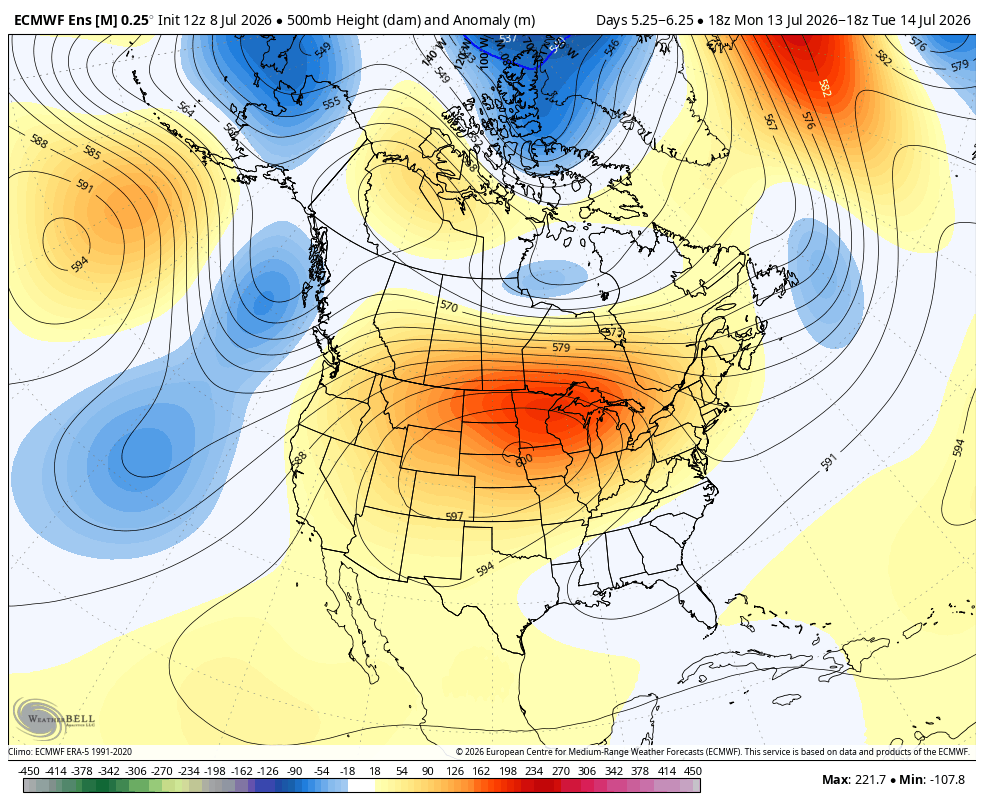
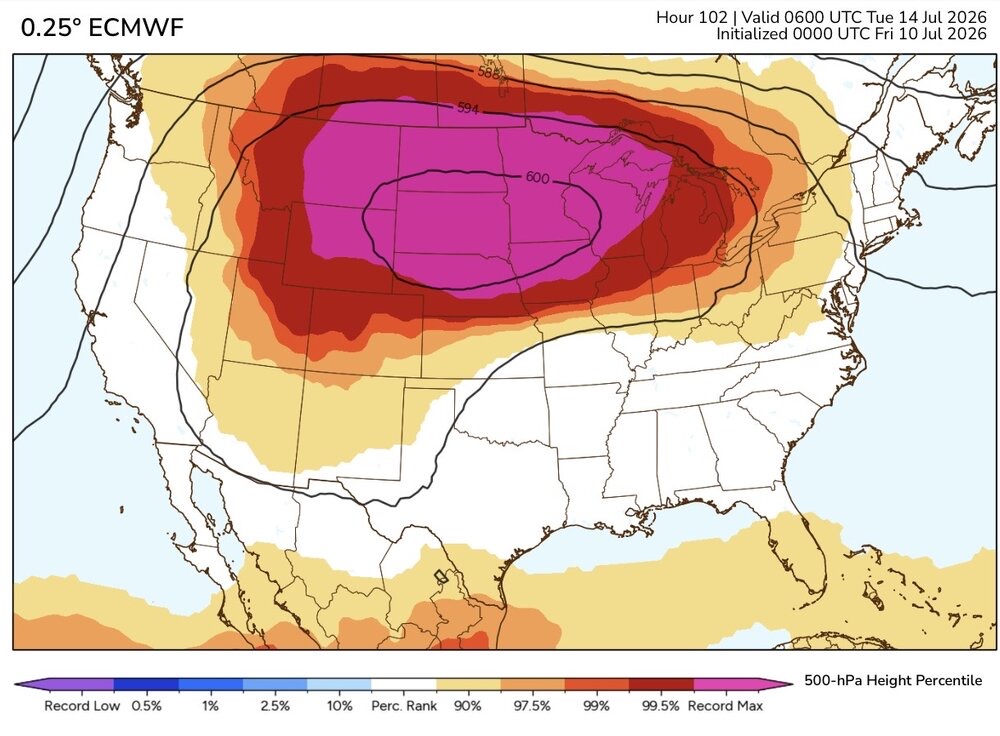
This is the peak in the dome next Tuesday, July 14th from the just out 12z European Ensemble model prediction.
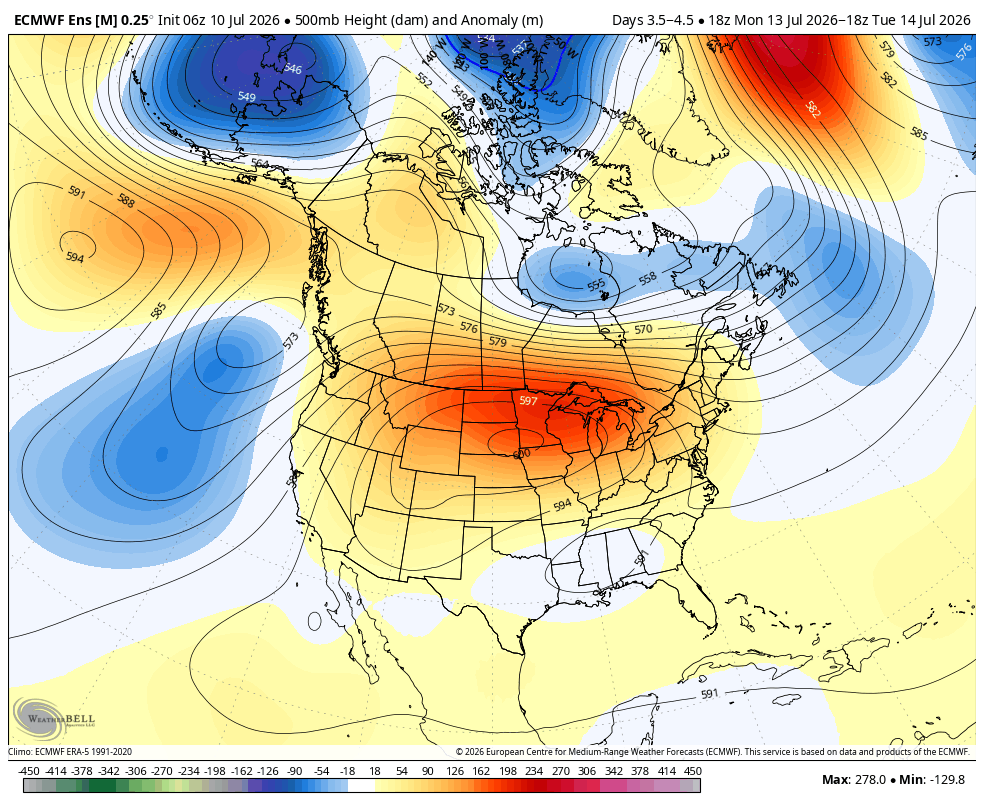
Extremely impressive 600 dm center at 500 mb! However, the market has known this for 3 days now and that dome only lasts for several days next week before the center shifts southwest.
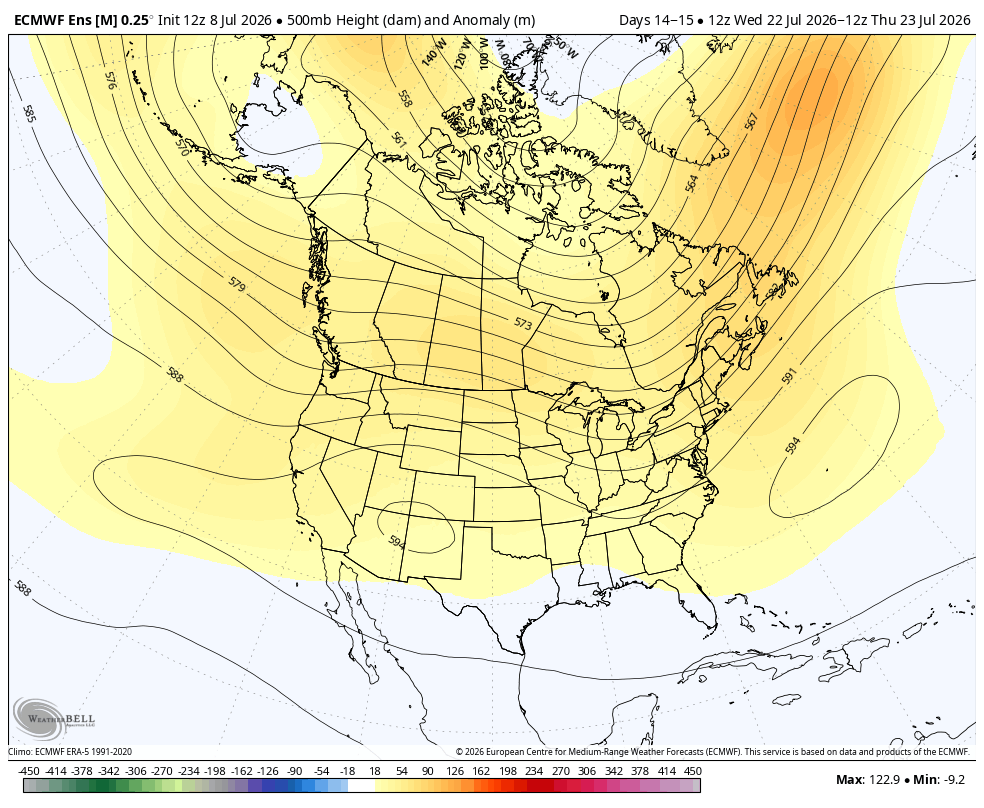
This is what the same 500 mb forecast looks like on July 23rd, 9 days later. This too has been the exact same forecast since Sunday for the end of the 2 week period, so for now it's dialed into market expectations.
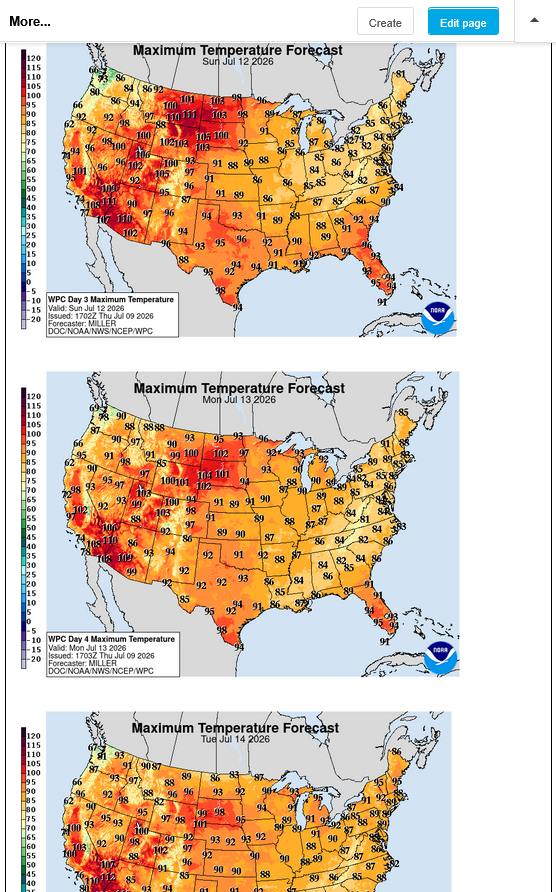
These are the 3 hottest days in next weeks heat wave, July 12-14, 2026. Actually, Saturday, July 11, 2026 will be on the hot side too(approaching 100).
The 12th and 13th
A couple of 100+ day in the Dakota's.
If soils were much drier in that area, the temperatures would be able to get much higher.
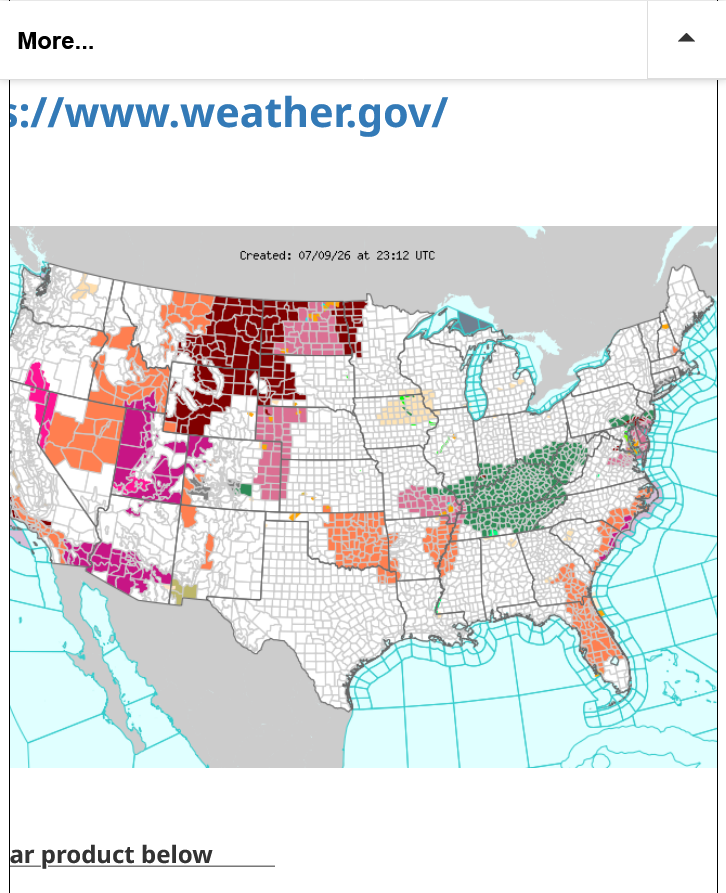
Excessive heat warnings/watches and advisories already up for many of these areas below.
Current Hazards at the link below.
For your NWS and county, go to the link below.
Then you can hit any spot on the map, including where you live and it will go to that NWS with all the comprehensive local weather information for that/your county.
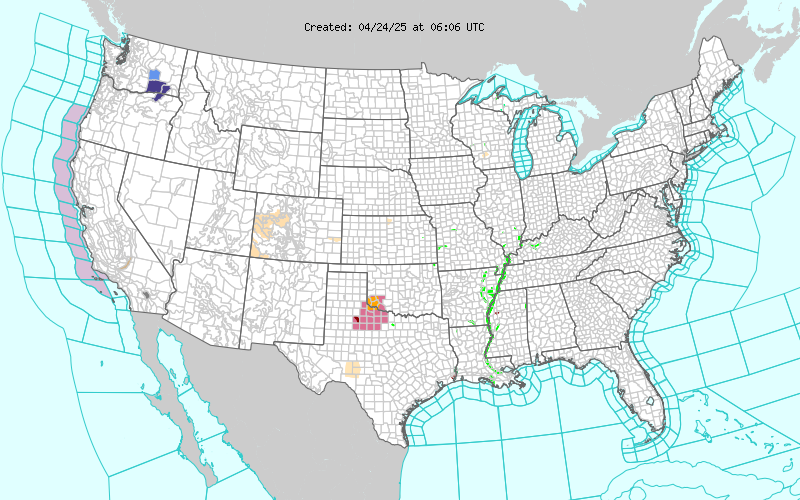
6pm, 7-9-26 below frozen image below.
The 0Z Euro July 10th operational run has record breaking high 500 mb heights centered on the N Plains July 14th! Other models, including ensemble means, are similar and thus are supportive of this with July 14th and 13th both having extremely high heights:
Thanks very much, Larry. Extremely impressive!
This was the just updated 6z run of the European ensemble model for the same feature at its peak 24 hour forecast magnitude next Mon/Tue:
+++++++++++
This was the prior 0z run at the PEAK of the dome from the EE:
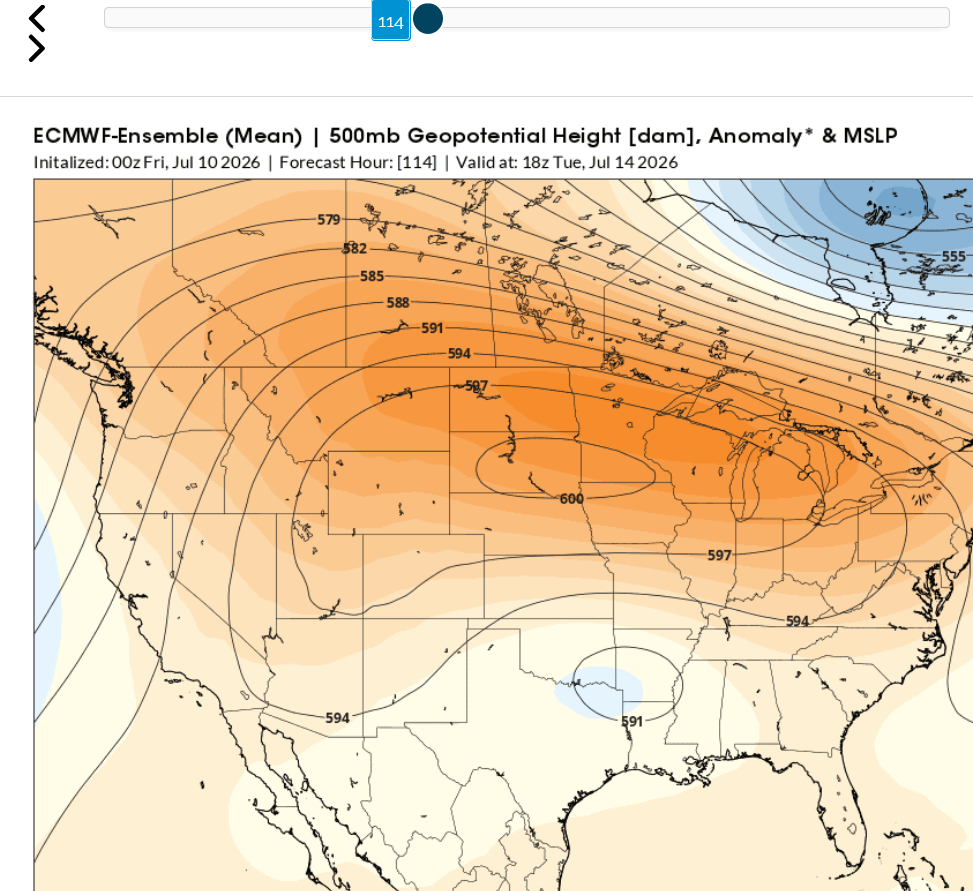
We should note that the European model on the previous page is by far the most bullish of the models in forecasting the 600+ decameter height high for a pressure of 500 mb (This is equal to 6,000 meters above the surface) which is around halfway up in the atmosphere. In this case, that's almost 20,000 feet up!
This just out Canadian model includes the individual ensembles for next Monday evening(84 hours). Most of them peak out right at 600 dm. The average at the top is a smidgen less than 600 dm because a couple of ensembles below 600 dm, dragged down the mean to 599.9 or so. The blue dots at the top are the locations for the center of the DOME.
084h GZ 500 forecast valid on Jul 14, 2026 00UTC


Forecasts for global GEM, control (GEM 0) and the 20 ensemble members
More on the 500mb level and charts for readers that want to learn some meteorology from a wonderful teacher:
| FORECASTING USING THE 500 MILLIBAR CHART |
METEOROLOGIST JEFF HABY
https://www.theweatherprediction.com/habyhints/25/
https://www.theweatherprediction.com/charts/500/basics/
+++++++++++++
| HABY'S WEATHER FORECASTING HINTS |

https://www.theweatherprediction.com/habyhints/
++++++++++++++++++++
AI Overview
This heat wave will not be NEARLY has oppressive as the one in the East earlier this month because dew points will be MUCH lower. The heat index, as a result will be MUCH lower. In fact, in some spots in MT for instance, the heat index will be LOWER than the temperature!
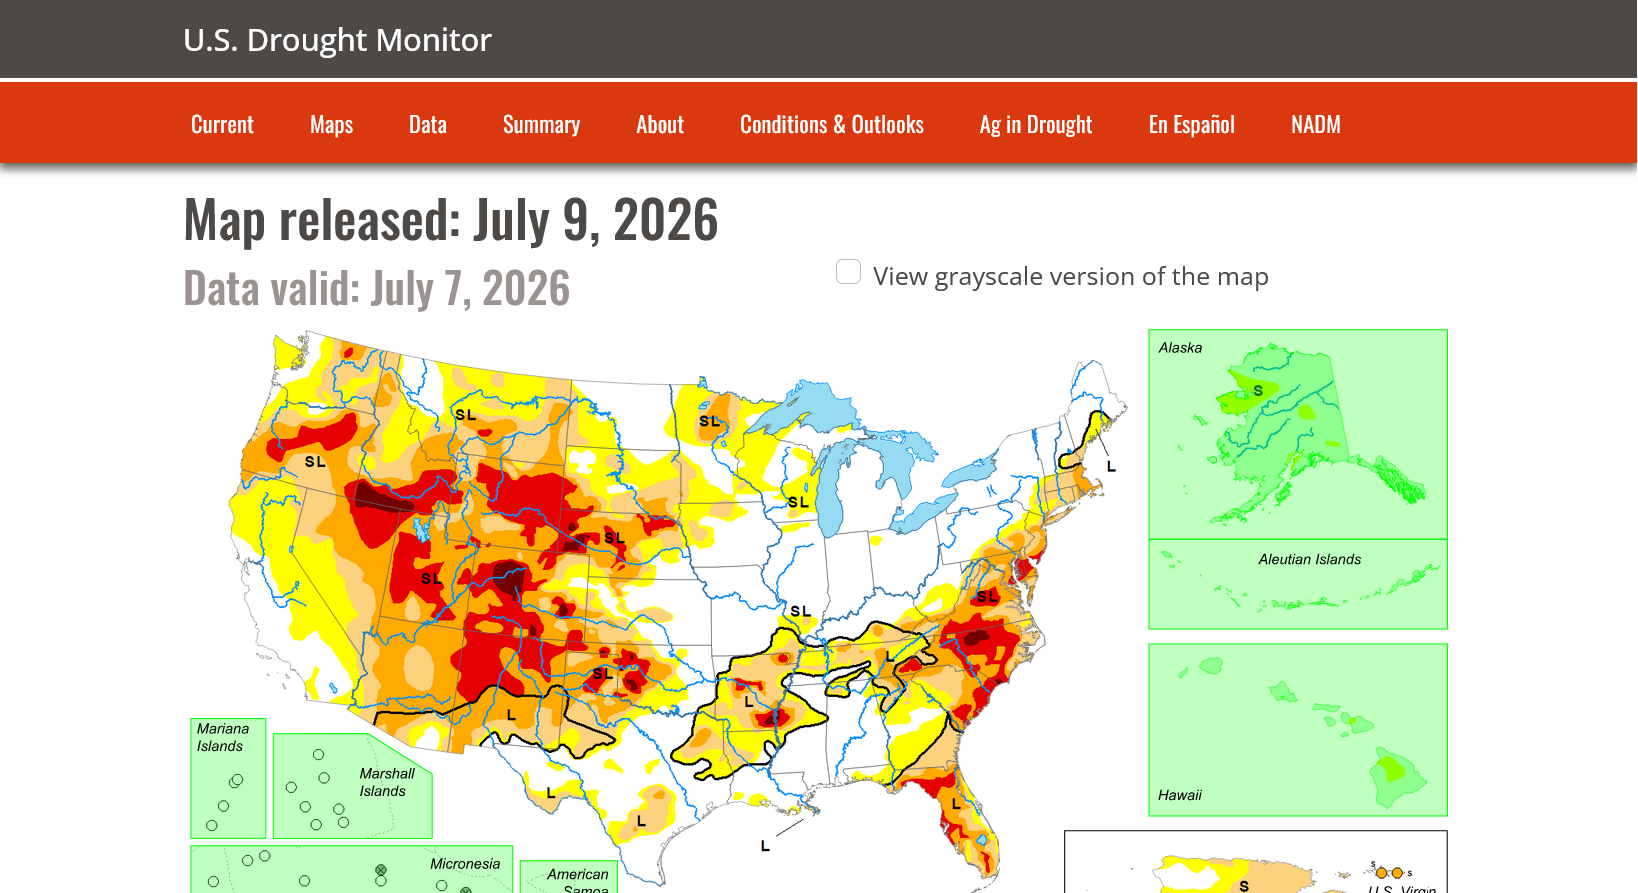
Current Hazards at the link below. Oranges are the counties with a Heat Advisory. Purple's an Extreme Heat Warning.
For your NWS and county, go to the link below.
Then you can hit any spot on the map, including where you live and it will go to that NWS with all the comprehensive local weather information for that/your county.
Large corn fields with tightly packed rows of corn that are evaportranspiring tons of moisture can add 5+ deg. F to the dew point to that spot.
It especially makes sense close to the Gulf of Mexico!
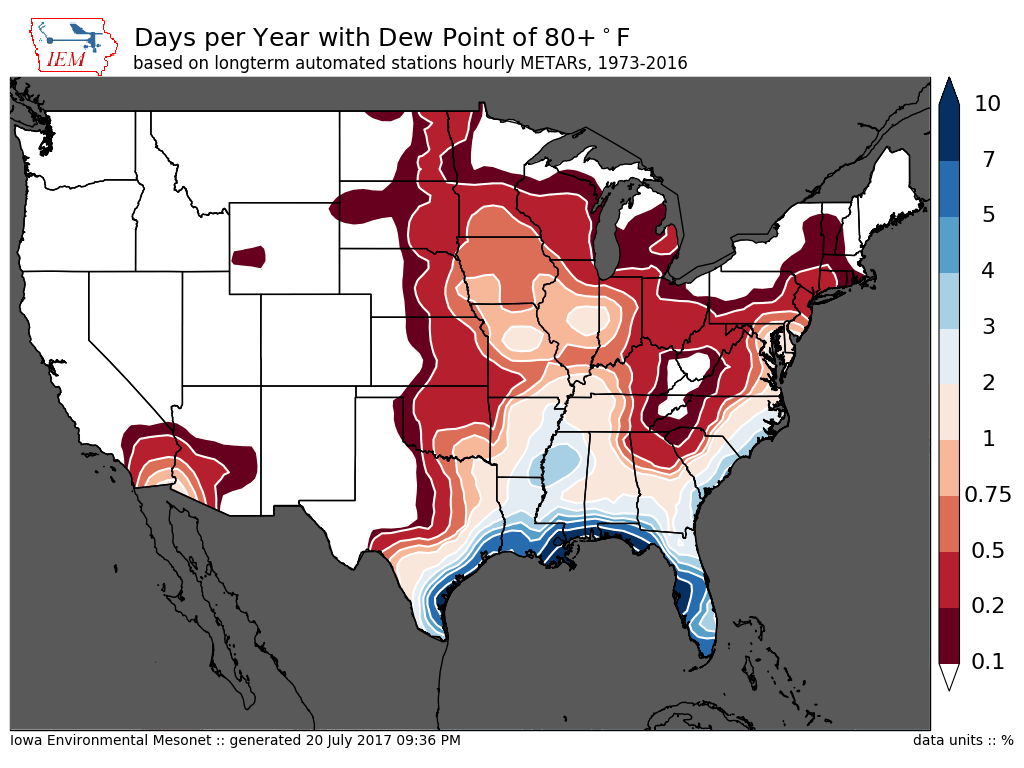
This has created a micro climate for around 4 months of the year in this area.
The same impact is happening in other agricultural areas. Also, most places with natural vegetation that’s been greatly greening up with the greater foliage transpiring more, just not the same magnitude as the Cornbelt.
Summer Climate Change in the Midwest and Great Plains due to Agricultural Development during the Twentieth Century
https://journals.ametsoc.org/view/journals/clim/32/17/jcli-d-19-0096.1.xml
Americans Have Planted So Much Corn That It’s Changing the Weather
https://www.atlasobscura.com/articles/corn-belt-weather
The Corn Belt is making it rain.++++++++++
WEATHER LAB | What is corn sweat?
https://www.weareiowa.com/article/weather/weather-lab/science-of-weather-corn-sweat-evapotranspiration-water-vapor/524-de12a91b-35cd-4b48-9b21-c0ec6e11f794
An acre of corn can add up to 4,000 gallons of water vapor to the atmosphere per day!
‘Corn sweat’ in the Midwest can cause some of the most oppressive humidity in the US
Can you imagine stepping outside to a 90-degree dew point?
https://www.foxweather.com/learn/corn-sweat-midwest-most-oppressive-humidity-united-states
Climate Change Impacts in the Corn Belt
Why is the humidity so high? The answer is pretty corny.
https://addins.wrex.com/blogs/weather/2011/07/why-is-the-humidity-so-high-the-answer-is-pretty-corny
The United States’s Corn Belt is making its own weather Plentiful crops are changing rainfall and temperature trends
https://www.science.org/content/article/america-s-corn-belt-making-its-own-weather
++++++++++
https://www.13abc.com/2025/07/16/weather-word-week-dew-point/
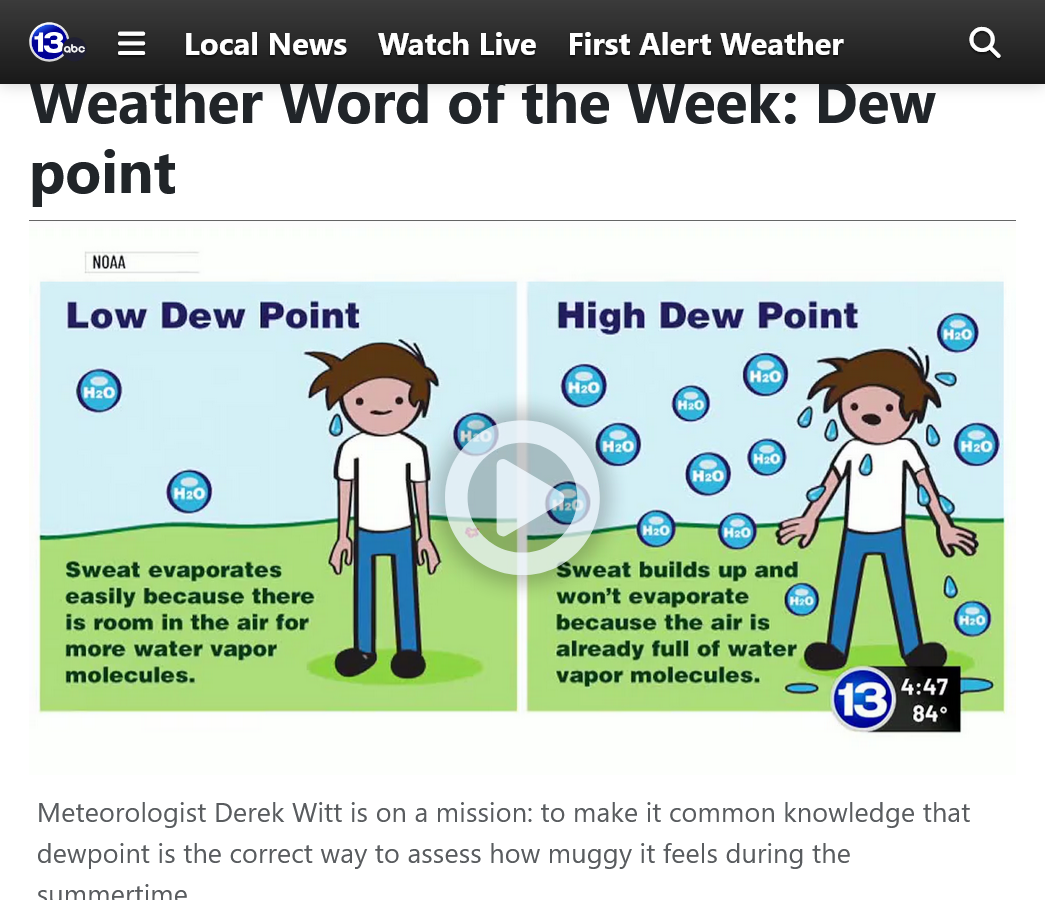
The dew point covered up by the logo on the right/bottom should be 74 Deg. F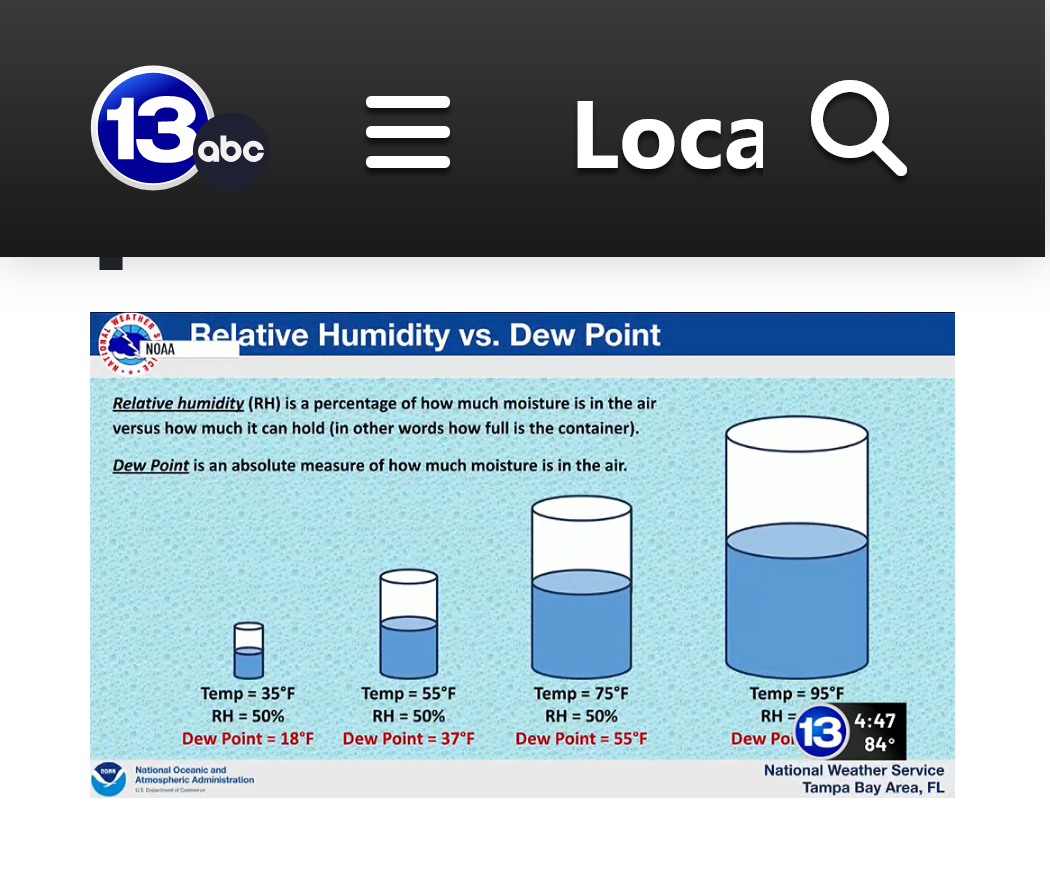
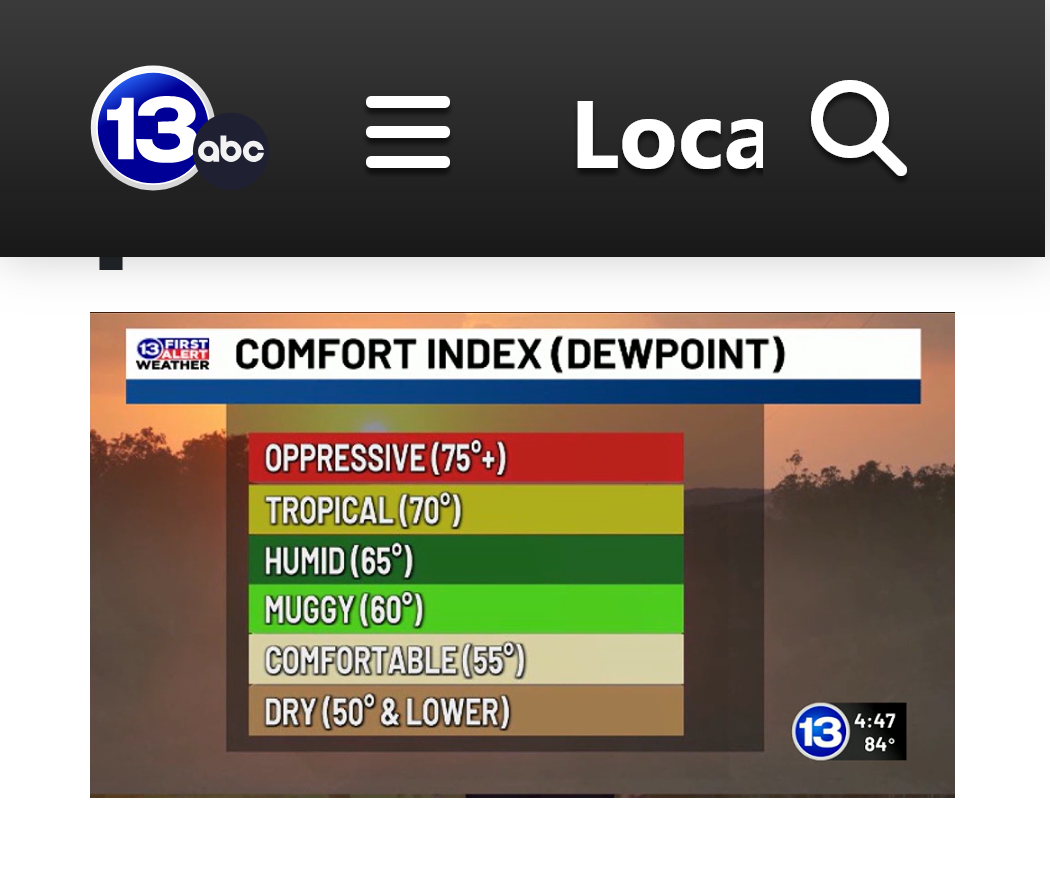
https://www.mesonet.org/weather/air-temperature/national-wind-chill-heat-index
https://thermastor.com/dew-point-and-weather-maps/

There have been numerous sources this past week that predicted this upcoming heat wave in the Northern Plains/Rockies might break all time temperature records.
We'll just have to see about that:
science/weather-explainers
https://www.facebook.com/photo/?fbid=1286600839489433&set=a.232272598255601


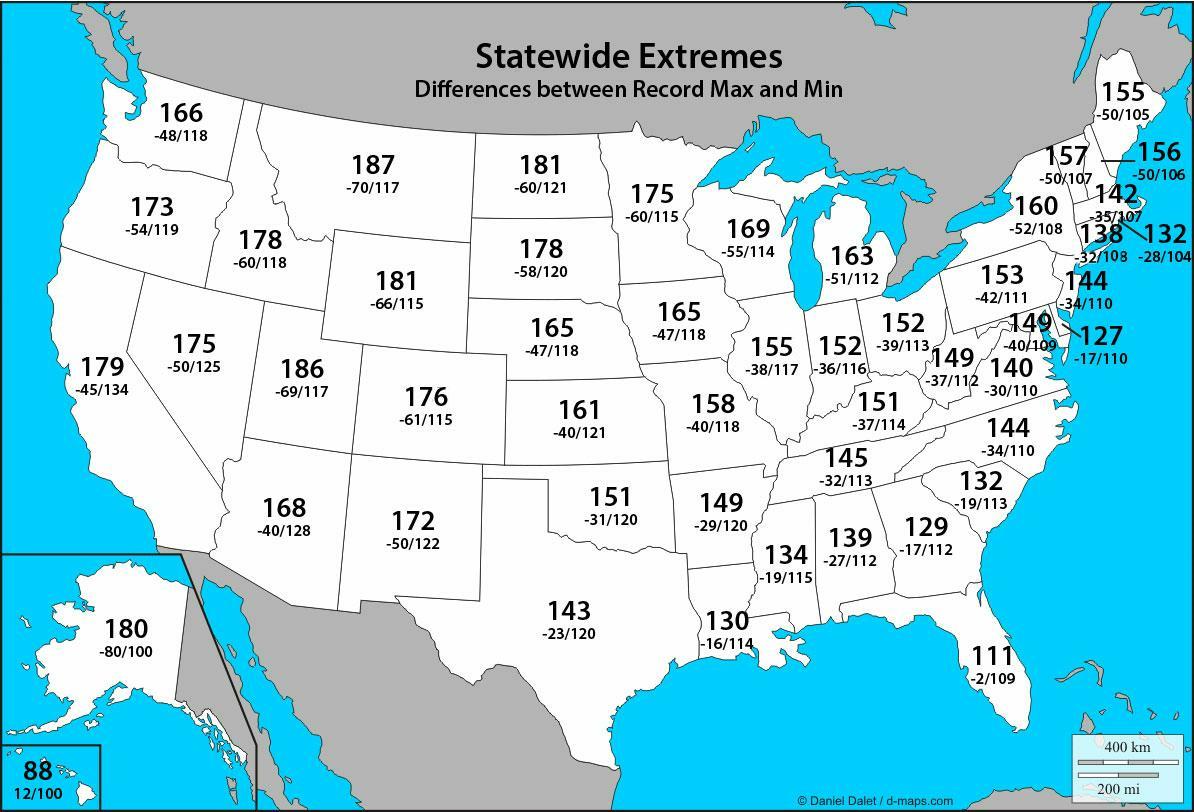
https://en.wikipedia.org/wiki/U.S._state_and_territory_temperature_extremes
++++++++++++++
UNITED STATES EXTREME RECORD TEMPERATURES & DIFFERENCES
https://ggweather.com/climate/extremes_us.htm
This 3 day intense heat wave would not have been that unusual during the 1930's when much of the Summers featured 100+ heat for consecutive stretches, many times longer in an area MANY times greater than this heat wave.
From the EPA
Figure 3. U.S. Annual HeatWaveIndex, 1895–2021
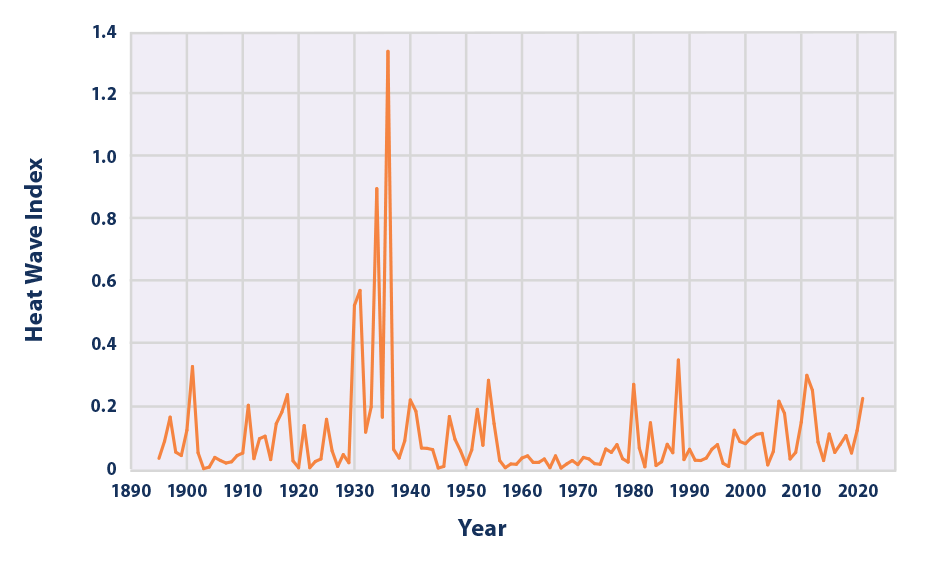
Despite global warming increasing the average temperature of the planet by almost 2 degrees(mostly the higher latitudes of the Northern Hemisphere) the hottest(driest) Summer in the center of the United States, by a very wide margin was 1936. (The West, because there's less H2O in the air has more of a greenhouse gas effect from the increase in CO2).
The length of time, lasting 3+ months and the massive geographical location blows all other heat waves away. Happening during the hottest time of year made it especially devastating.
And worst of all is that this is the most productive agricultural region on the planet. Record heat in a desert, like Arizona where not much grows in March is a bad thing. Record heat and record dry where we grow crops DURING THE ENTIRE GROWING SEASON is a bad thing X 100!
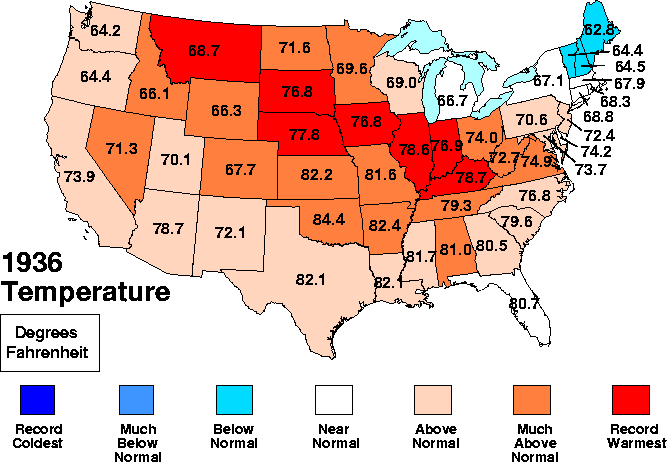
Summer (June–August) 1936 average temperature, in degrees Fahrenheit. Record warmest and coldest is based on a 112-year period of records (1895–2006)
++++++++++++++++

Summer (June–August) 1936 precipitation, in inches. Record wettest and driest is based on a 112-year period of records (from 1895 until 2006).
+++++++++++++++
https://www.wunderground.com/cat6/North-Americas-Most-Intense-Heat-Wave-July-and-August-1936

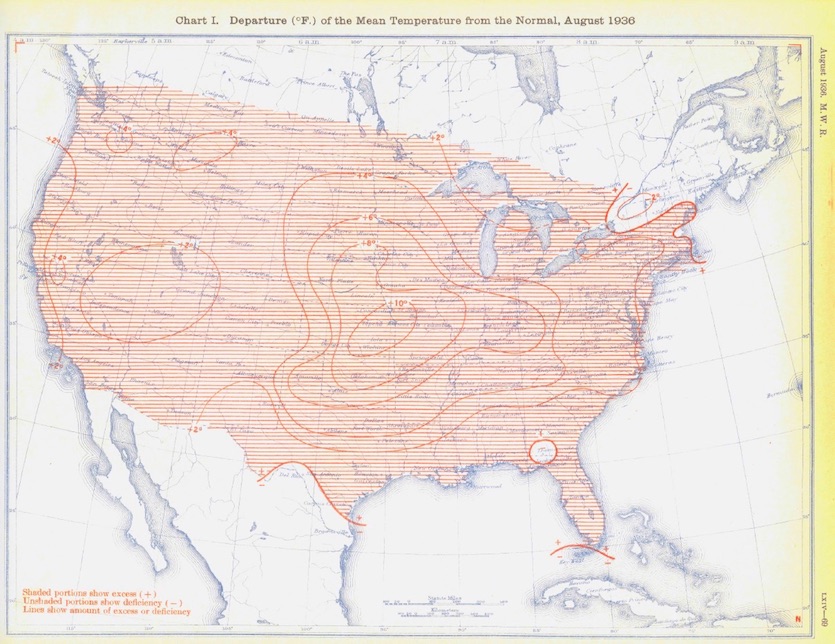
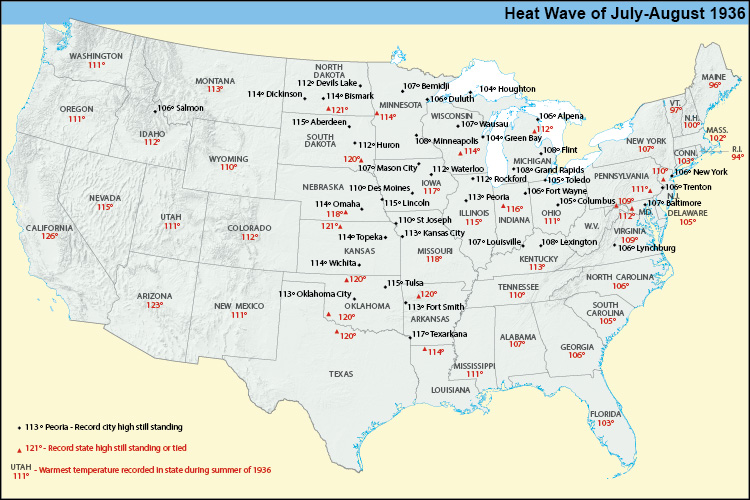
https://wattsupwiththat.com/2026/04/03/us-heatwaves-much-worse-in-past/


https://wonderingmaps.com/us-hottest-days/
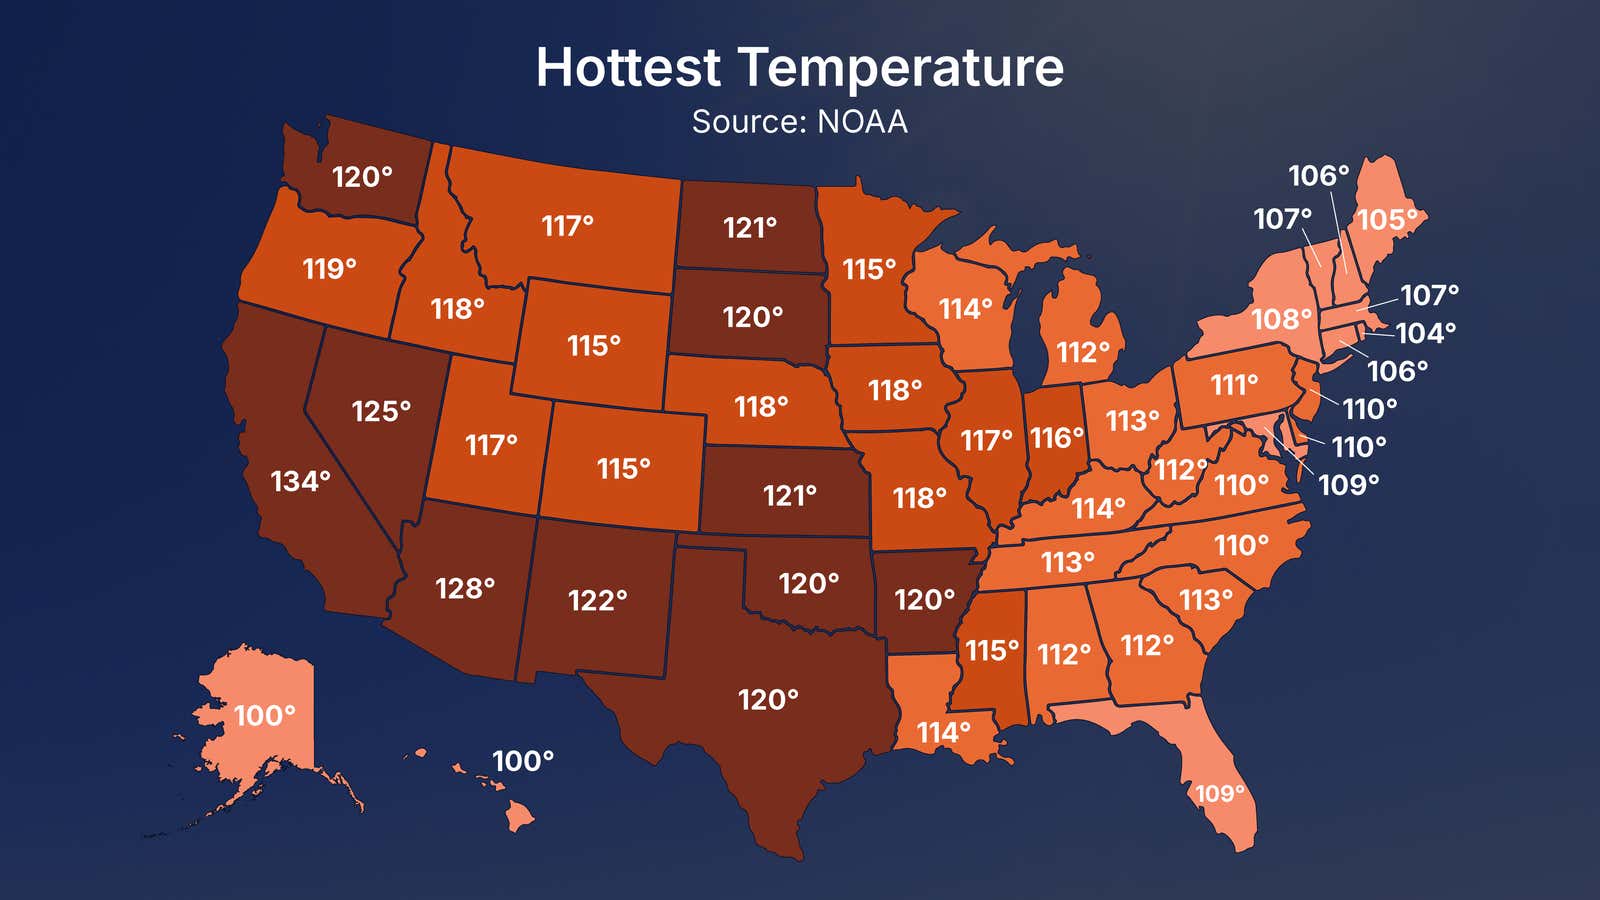
Note that half the state high temp records were in the 1930's!
And that only a few states have set their all time highs since 2000.
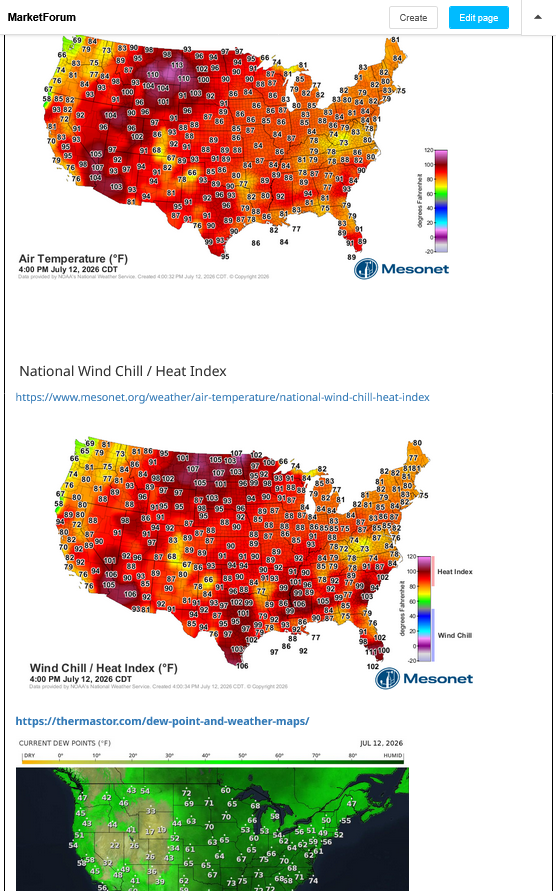
Note a key difference between this heat wave and the heat wave earlier this month in the East.
The Heat Index in the East was up to 10+ degrees higher than the temperature because of the high dew points/humidity.
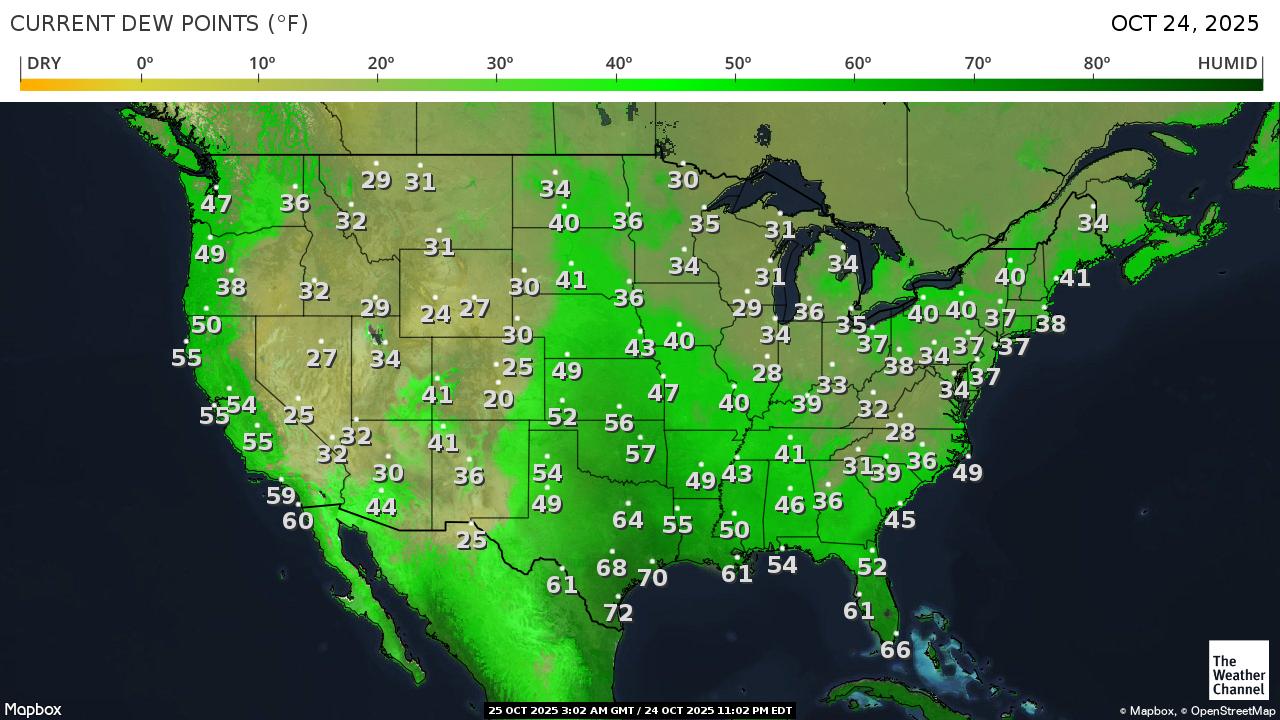
The Heat Index in the Plains depends on the location. Note on the bottom map the incredible dew point contrast from west to east in a state like SD, for instance.
In the eastern part of SD and ND dew points around 70 are making it feel much hotter, like 100+!
In the western part of SD, the dew points are in the 40's and its doing the opposite. The Heat Index is LOWER than the temperature.
That can't happen with the Wind Chill Factor. The lowest the wind can go is 0 mph and that's where the temperature and wind combined feel like the temperature.
With the Heat Index, the lower the dew point, the cooler it feels!
National Air Temperature
https://www.mesonet.org/weather/air-temperature/national-wind-chill-heat-index
https://thermastor.com/dew-point-and-weather-maps/
++++++++++++
This is western ND. Temp 100 deg. F but feels like 96 deg. F because of the dew point of just 48.
Current conditions at
100°F
38°C
| Humidity | 17% |
| Wind Speed | S 21 mph |
| Barometer | 29.95 in |
| Dewpoint | 48°F (9°C) |
| Visibility | 10.00 mi |
| Heat Index | 96°F (36°C) |
| Last update | 11 Jul 1:35 pm MDT |
++++++++++++++++++=
Below is northeast ND. Temp is just 91 deg. F at the same time(9 degrees cooler than the above location. However, the dew point is a STEAMY 77 deg. F so the Heat Index is 104 deg. F. It feels 8 degrees hotter than the drier place even though it's 9 degrees cooler on the thermometer. If the place above at 100 had the same dew point, 77 deg. the heat index would be 116. Making it feel 20 degrees hotter than it feels right now with the dew point of 48. deg. F.
Current conditions at
91°F
33°C
| Humidity | 63% |
| Wind Speed | S 7 G 16 mph |
| Barometer | 29.98 in |
| Dewpoint | 77°F (25°C) |
| Visibility | 10.00 mi |
| Heat Index | 104°F (40°C) |
| Last update | 11 Jul 2:35 pm CDT |
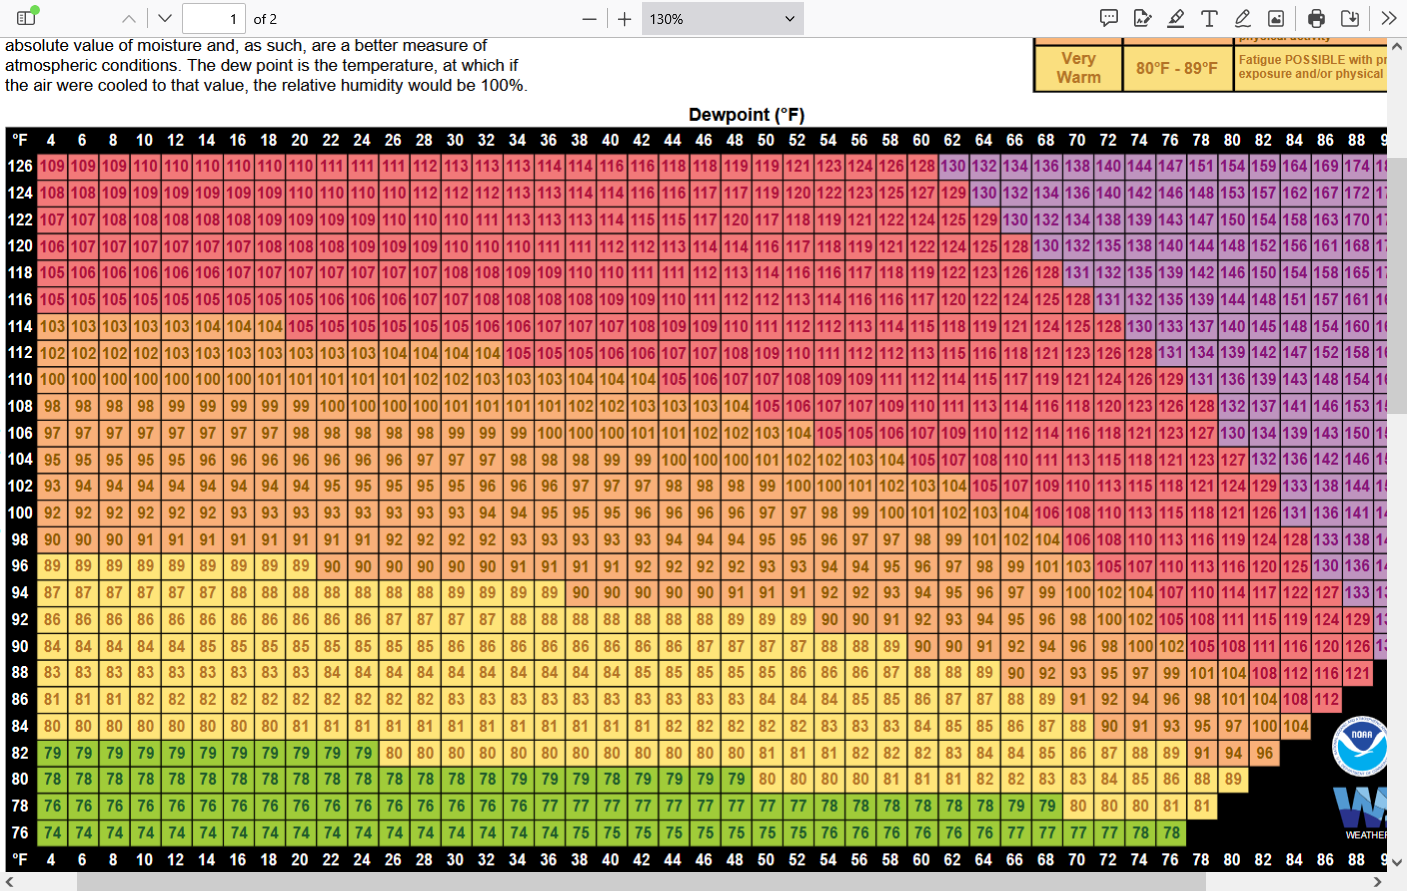
https://www.noaa.gov/sites/default/files/2022-05/heatindex_chart_dp.pdf
++++++++++
As it turns out, really humid air over wet soils is extremely hard to heat up, very fortunately.
It's very dry air with very low dew points (like in the deserts) that can heat up to the most extreme absolute temperature readings.
Sunday, tomorrow will be HOTTER than today in the hottest locations above.
Sunday will be the hottest day in the hottest place tomorrow, Billings
Note something lacking in this forecast:
Sunday
Sunny and hot, with a high near 111. Light and variable wind becoming south 15 to 20 mph in the morning.
++++++++++
NO Heat Index like we always have in our forecast.
Look how low the dew point is there right now at 31 deg. F and a humidity of 8%!!!
Making the current Heat Index 6 degrees LESS THAN the actual temperature. This dry air, over very dry soils is also the reason they will be getting so much hotter than places farther southeast, for instance that are more directly underneath the center/core of the heat dome. Very similar to the impact that bone dry air masses like this have under heat domes over the Southwest Deserts.
The heat dome doesn't need a 600 dm high at 500 mb in those bone dry air/soil locations for the temperature to hit 110 deg. F!
102°F
39°C
| Humidity | 8% |
| Wind Speed | SSW 8 MPH |
| Barometer | 29.9 in (1012.53 mb) |
| Dewpoint | 31°F (-1°C) |
| Visibility | 10.00 mi |
| Heat Index | 96°F (36°C) |
| Last update | 11 Jul 07:00 PM MDT |
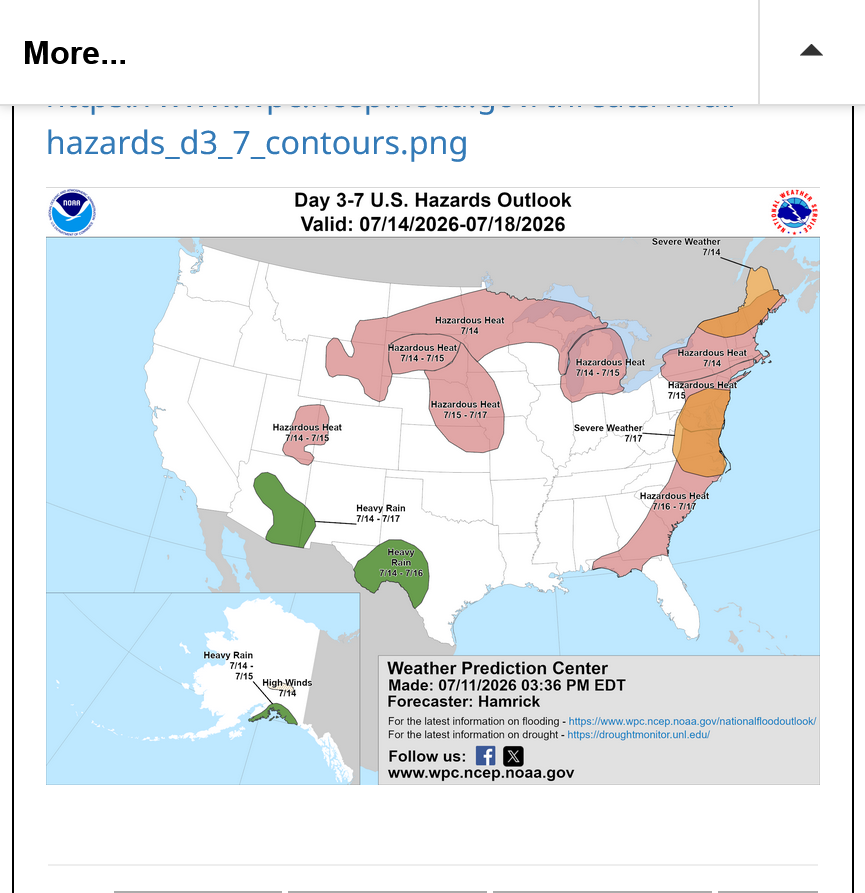
Looks like this is how long the heat will last this week before greatly moderating and shifting westward in week 2.
https://www.wpc.ncep.noaa.gov/threats/final/hazards_d3_7_contours.png
4pm Sunday snapshot: This is close to the highs in the hot spots
+++++++++++++
Looks like Billings, MT hit 111 deg. F today, smashing the old high by several degrees.
https://www.weather.gov/wrh/timeseries?site=KBIL
Get this. When they hit that record temperature, the dew point was 26 deg. F and the relative humidity was 5%!!!!
This made their Heat Index 103 deg. F. So it felt 8 degrees COOLER!
Because the air is so extremely dry in Northeast MT right now, look at what they have in the forecast:
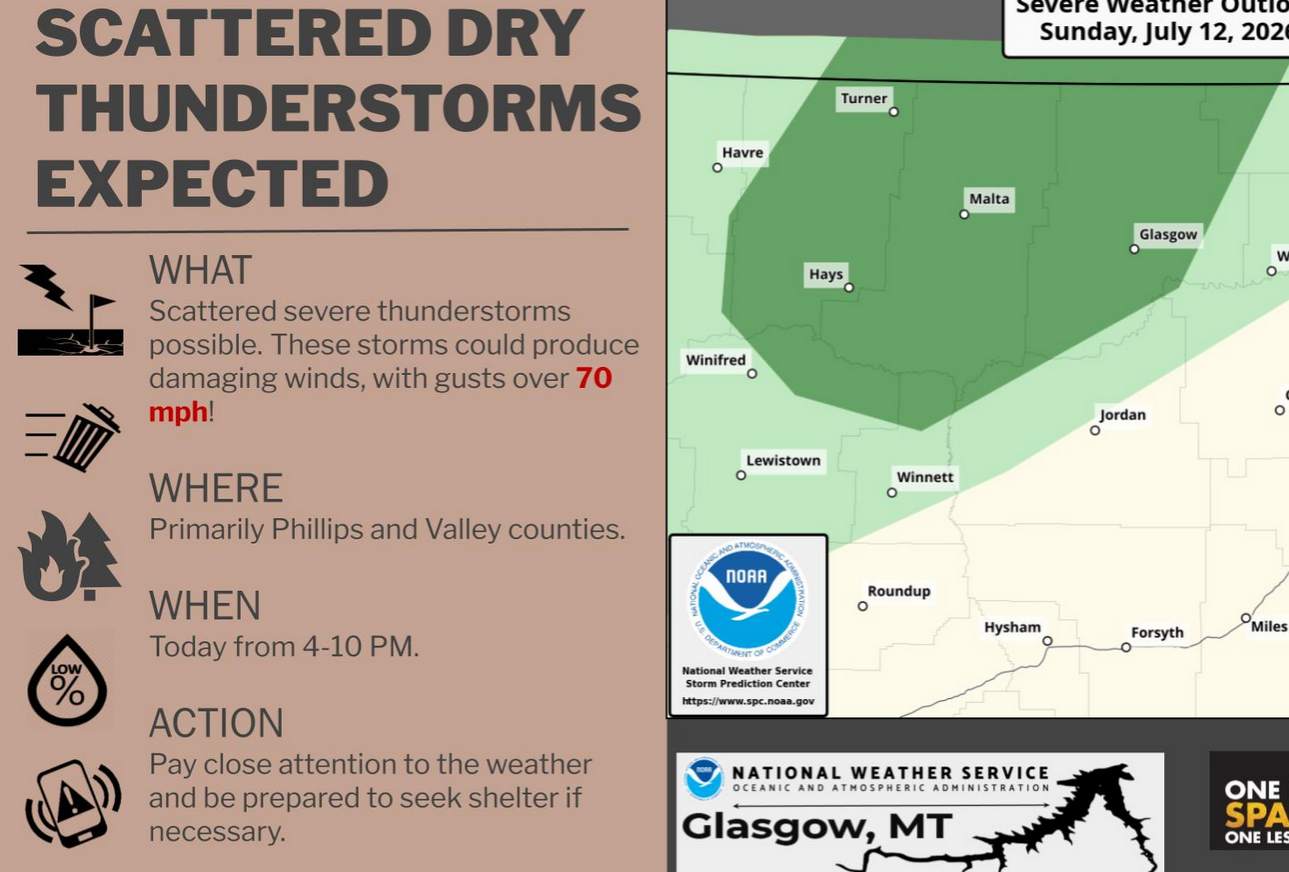
When was the last time we had that in an Indiana forecast? NEVER!!!! Out West, in the very dry air, dry thunderstorms are pretty common in the Summer.........unfortunately! Not only do those locations MISS all the rain, the lightning often starts wildfires And the wind can fan wildfire flames |
Sunday 7/12/26: all-time records were broken or tied in at least these places:
1) Wide stretch of S MT (450 miles long):
ALL-TIME RECORDS TIED OR BROKEN
SITE HIGH TEMP PREVIOUS ALL-TIME RECORD PERIOD OF RECORD BEGINS
BILLINGS 111 108 (7/14/2002) 1934
LIVINGSTON 105 105 (8/5/1961) 1948
MILES CITY 115 111 (6/26/2012) 1937
SHERIDAN 109 107 (7/27/2021) 1907
BAKER 110 109 (7/25/2024) 1998
2) N UT
..ALL-TIME RECORD HIGH TEMPERATURE SET AT SALT LAKE CITY UT
A RECORD HIGH TEMPERATURE OF 109 DEGREES WAS SAT AT SALT LAKE CITY,
UT TODAY. THIS BREAKS THE OLD DAILY RECORD OF 105 DEGREES SET IN
2002. THIS IS ALSO A NEW MONTHLY AND ALL-TIME HIGH TEMPERATURE
RECORD FOR THE SITE. THE PREVIOUS RECORD WAS 107, SET IN 1960, 2002,
2021, AND 2022.
3) E ID:
THE IDAHO FALLS FANNING FIELD AIRPORT RECORDED A HIGH TEMPERATURE OF 103 DEGREES
TODAY. THIS NOT ONLY BREAKS THE PREVIOUS RECORD FOR JULY 12 OF 100
DEGREES SET IN 2002, BUT BREAKS THE ALL-TIME RECORD FOR FANNING FIELD OF 102 SINCE RECORD KEEPING STARTED IN 1948.
Thanks very much, Larry!
When you break a high temperature record at the hottest time of year, there's a decent chance for it to be an all time high compared to other months.
YW. Indeed, Mike.
Regardless, Bilings breaking their 92 year long record for all dates by 3F and Miles City breaking their 89 year long record for all dates by 4F are quite amazing!
But if that weren’t enough, how about Salt Lake City breaking their 152 year long record for all dates by 2F?
But if that weren’t enough, how about Salt Lake City breaking their 152 year long record for all dates by 2F?
Pretty impressive for sure but I think of it a different way too.
152 years ago was 1874. The increase in population has gone from 20,000 to over 200,000 in Salt Lake City so the urban heat island effect might be significant from that impact here in 2026.
So the record temperature set in 1874 that was just 2 degrees less than this, in a location that is heating up faster than much of the planet (Salt Lake City has warmed up close to 4 Deg. F) and with no UHI at the time seems much, MUCH more impressive to me!
With global warming imposed for decades, I'm surprised that it took 154 years to break that record!
Salt Lake City
https://en.wikipedia.org/wiki/Salt_Lake_City
| Ce |
|---|
| Census | Pop. | Note | %± |
|---|---|---|---|
| 1850 | 6,157 | — | |
| 1860 | 8,236 | 33.8% | |
| 1870 | 12,854 | 56.1% | |
| 1880 | 20,768 | 61.6% | |
| 1890 | 44,843 | 115.9% | |
| 1900 | 53,531 | 19.4% | |
| 1910 | 92,777 | 73.3% | |
| 1920 | 116,110 | 25.1% | |
| 1930 | 140,267 | 20.8% | |
| 1940 | 149,934 | 6.9% | |
| 1950 | 182,121 | 21.5% | |
| 1960 | 189,454 | 4.0% | |
| 1970 | 175,885 | −7.2% | |
| 1980 | 163,034 | −7.3% | |
| 1990 | 159,936 | −1.9% | |
| 2000 | 181,743 | 13.6% | |
| 2010 | 186,440 | 2.6% | |
| 2020 | 199,723 | 7.1% | |
| 2024 (est.) | 217,783 | 9.0% | |
| Source:[125] U.S. Decennial Census[126] 2023 Estimate[127] | |||
Thanks, Mike
SLC: THE PREVIOUS RECORD WAS 107, SET IN 1960, 2002, 2021, AND 2022.
POP: from your data, it rose only 15% 1960-2024. How much difference would a 15% pop. increase cause? Thus, I feel that the warming since 1960 is likely heavily influenced by CC and little from UHI increases.
| 1960 | 189,454 | 4.0% | |
| 1970 | 175,885 | −7.2% | |
| 1980 | 163,034 | −7.3% | |
| 1990 | 159,936 | −1.9% | |
| 2000 | 181,743 | 13.6% | |
| 2010 | 186,440 | 2.6% | |
| 2020 | 199,723 | 7.1% | |
| 2024 (est.) | 217,783 | 9.0% |
Check out Miles City pop: still small with only 17% increase since 1930 with records starting in 1937. Thus, UHI factor is close to nil. Yet, they set their new all time record by 4F! So, do you think that’s much more impressive than SLC beating their 152 year long record by 2?
| 1930 | 7,175 | −9.6% | |
|---|---|---|---|
| 1940 | 7,313 | 1.9% | |
| 1950 | 9,243 | 26.4% | |
| 1960 | 9,665 | 4.6% | |
| 1970 | 9,023 | −6.6% | |
| 1980 | 9,602 | 6.4% | |
| 1990 | 8,461 | −11.9% | |
| 2000 | 8,487 | 0.3% | |
| 2010 | 8,410 | −0.9% | |
| 2020 | 8,354 | −0.7% |
Thanks, Larry!
Again, I agree that was impressive. This is why I started the thread and have been giving it so much coverage and especially appreciate your wonderful contributions.
Let me repeat the points differently. Please don't let the urban heat island effect confuse you. That's NOT my main point, just a small part of it for that 1 place.
1. This area of the world has warmed MUCH more than most places, up to 5 deg. F because of the extremely dry air which allows CO2 to absorb more heat that H2O is already absorbing at absorption bands that over lap in the humid places. Same thing is happening in the highest latitudes of North America.
AI Overview
The Western US is among the fastest-warming regions in the country. Since 1970, average temperatures in the Southwest have increased by roughly 3.5°F [

 ]. Localized areas, particularly in parts of California and Nevada, have seen summer temperatures rise by more than 5°F [

 ]. This acceleration is primarily driven by greenhouse gas emissions, like CO₂, which trap heat in the atmosphere.
+++++++++++++++
With that being the case, it's VERY surprising to me that we are not seeing even MORE all time highs and that an all time high stood for 152 years in this region before being broken by 2 Deg. F.
I really would not have guessed that so many all time state record highs still stand, including this last mega extreme, brief heat wave that still was not able to break all time state highs.
https://www.facebook.com/photo/?fbid=1286600839489433&set=a.232272598255601
So global warming is NOT impacting the most extreme heat waves with the same magnitude that it is with all other temperature regimes. The hotter it is, the less the added heat/temperature from additional CO2. The colder it is, the more the added heat/temperature.
A huge part of this in most places is that warmer air holds more H2O which is 95% of the greenhouse gas impact on the planet. Cold air holds much less H2O.
Even the hottest air masses in the West often lack much H2O. Note the extraordinarily low dew points today in those record high places. This is also why the warming rate IN THE DRY WEST has been double than elsewhere.
However, even there, the all time state record highs, as seen on the map above are the most UNDER performing global warming metric.
Does that make sense?
“500mb geopotential height above 600dm last night is a first for central Minnesota/Wisconsin, according to ERA5. All-time record (1950-present).”
Thanks extremely much, Larry!
I meant to capture that but missed it. That actually was the most astounding record of all with this heat wave.
We didn't have upper level weather data from weather balloons to measure the 1930's, hottest decade but we should note that there is much more going on with surface heat(dry air/dry soils) than just an upper level 600+ dm dome over top of you.
We should also note that the highest temperatures were NOT directily under the center of the record dome.
Regardless, at least going back to the weather balloon age, that heat dome is mind boggling type record level.
I will guess that it could have smashed the record for domes in the 1930s heat waves but that would really be something.
+++++++++++++
4:30 pm. Let me elaborate on that last statement. This record breaking heat dome will, fortunately, just last several days in a relatively small location as heat domes go.
The one in the Summer of 1936 lasted for much of 3 months and was locked in place over an area numerous times larger than this one.
With regards to this heat dome. For others here, we typically use this 500 mb level because it's around halfway up in the atmosphere(mass wise, not distance).
Did global warming play a role in the incredible magnitude of this record smashing heat dome?
For sure it did!
That 600 is in decameters which is the same as 19,685 feet. The greater the number, the hotter the air mass is because air expands with temperature. So that 600 decameters represents where the 500 mb pressure level is in the atmosphere. Which is as high up as its ever been.
In the Winter, with a polar vortex, the 500 mb levels are the complete opposite. That really cold air is heavy/dense so instead of a fat, expanded hot atmosphere like we have at 600 dm with this heat dome/upper level high pressure, we have a cold, contracted atmosphere with deep LOW pressure that might only be 520 dm or even lower, which is just above 17,000 feet.
So the atmosphere is fat/expanded/less dense in the Summer and lean/heavy/contracted in the Winter.
The weight of all the air right now below this dome at 20,000 feet is the same weight of the air from 17,000 feet down in a strong polar vortex. So the difference between them is 3,000 feet.
AI Overview
Yes, global warming is heating the air at 20,000 feet, where the atmosphere is warming at a similar rate to the Earth's surface. This altitude is located in the middle-to-upper troposphere, the layer of the atmosphere closest to the ground, which expands and warms as greenhouse gases trap heat. You can review the atmospheric changes across different altitudes using the NASA Climate Lab Book or learn about structural changes in the atmosphere through NCAR & UCAR News.
+++++++++
Maybe this tutorial helps with the explanation for those that want to understand it better:
+++++++++++
I can't resist reminding everybody of this:
It really boils down to this, once again(Cliff Mass can be counted on as an elite source for using objective, authentic science)
https://cliffmass.blogspot.com/2016/03/the-golden-rule-of-climate-extremes.html
The GoldenRule
Considering the substantial confusion in the media about this critical issue, let me provide the GOLDENRULE OF CLIMATE EXTREMES. Here it is:
The more extreme a climate or weather record is, the greater the contribution of natural variability.
Or to put it a different way, the larger or more unusual an extreme, the higher proportion of the extreme is due to natural variability.
+++++++++++
Applying the amount that global warming is impacting any one place is extremely independent, depending on numerous variables. The colder/drier or just drier in the Summer a climate is, the more heat its getting from CO2 radiation absorption bands. Not so much warm humid places. That's with regards to surface temperatures.
But what about 500 mb heat domes based on the heights at that level?
AI Overview
++++++++++++
So let's say the 500 mb pressure level has risen by 20 meters from global warming in the past century. This is only +2 decameters more which is nothing for a 600+ decameter heat dome, which surprises me. I was thinking more.
If that is the case, this heat dome would have smashed the all time record without the help of global warming.
Billings, MT will likely break their all-time record of 108 tomorrow, possibly getting to 112°F (NBM guidance). You can see where it lies on the temperature distribution below. The record breaking heat dome responsible for this is in the thread. #heatwave #Montana (the 108 is the spike you see right under the dot for 112)
·
111°F forecast Sunday for Billings, Montana compared to the most extreme July days on record. #heatwave #extremeheat #climatechange
++++++++++++
Jeff gets busted again. Why did he not use the data on his graph above that showed the 3 hottest temperatures prior to 1934?
Why are all of his errors/mistakes in the too hot direction???
I actually copy some of this stuff here because he has great graphics and much of it is accurate. However, I constantly have to fact check him for accuracy when it comes to climate change!
+++++++++++++++++++++++
The hottest temperature in Billings, Montana history is 112 °F which happened on Wednesday, July 31, 1901.
As you can see from the list below, 3 of the top 4 hottest temperatures occurred BEFORE 1930.
Also, 13 out of the hottest 21 days in Billings, Montana history occurred BEFORE 1940!
The other 8 have occurred just since 2000.
https://www.extremeweatherwatch.com/cities/billings/highest-temperatures
| Rank | Temperature | Date |
|---|---|---|
| 1 | 112 °F | July 31, 1901 |
| 2 | 111 °F | July 12, 2026 |
| 3 | 110 °F | July 20, 1921 |
| 3 | 110 °F | July 31, 1900 |
| 5 | 108 °F | July 14, 2002 |
| 5 | 108 °F | July 4, 1937 |
| 5 | 108 °F | July 25, 1933 |
| 5 | 108 °F | June 21, 1900 |
| 9 | 107 °F | July 19, 2021 |
| 9 | 107 °F | July 23, 2003 |
| 9 | 107 °F | July 12, 2002 |
| 9 | 107 °F | August 3, 1934 |
| 9 | 107 °F | July 26, 1933 |
| 9 | 107 °F | July 21, 1931 |
| 15 | 106 °F | July 27, 2021 |
| 15 | 106 °F | July 13, 2005 |
| 15 | 106 °F | July 13, 2002 |
| 15 | 106 °F | June 27, 1919 |
| 15 | 106 °F | June 14, 1918 |
| 15 | 106 °F | July 13, 1910 |
| 15 | 106 °F | June 22, 1900 |
Fake climate crisis alarmists like Jeff Beradelli will SOMETIMES, only tell you about the 8 hottest temperatures since 2000 (which made the top 21) at Billings, MT and pretend the past never existed.............and are extremely effective because:
1. Their followers don't have their own weather records at home.
2. Their followers are not meteorologists, nor do they understand climate science. They follow, believe in/trust and rely on experts like Jeff to tell them everything they know about the climate crisis.
3. It's the perfect environment to recruit followers of fake climate crisis religion which sadly is their mission instead of sincerely educating people with OBJECTIVE facts about the overall big picture when it comes to the impact of CO2 on planet earth and the creatures living here, especially humans.
4. Again, we ARE experiencing sustained global warming from the physics of increasing CO2 that have resulted from burning fossil fuels. This is having an impact on the climate. But just telling us all the bad things, then greatly exaggerating those bad things every time they happen to the point of charlatanism while completely ignoring the 10 times greater good things is dishonest science.
5. Whether this is intentional or not (or just cognitive bias/activism) doesn't change the impact. They are practicing the ANTI scientific method and I will speak out against it, using the scientific method and authentic facts/empirical data, while at the same time embracing the LEGIT science they present from their sites. Many of these people are brilliant scientists that make good points at times. Unfortunately, there is a side that opposes their good points and denies the REAL warming and we have ended up with 2 extremely biased, tunnel vision, opposing sides, both practicing bad science and behaving like its politics.
6. For additional perspective on why every one of these people predicting a catastrophe in the year 2100 because of an amount of CO2 in the atmosphere (that barely reaches 2/3rds of the optimal level before crashing lower) will be profoundly wrong, read here:
CO2 & Climate discussion July 2026
By metmike - July 10, 2026, 7:26 p.m.
+++++++++++
CO2 & Climate discussion July 2026
By metmike - July 10, 2026, 7:30 p.m.
++++++++++++
CO2 & Climate discussion July 2026
By metmike - July 10, 2026, 9:49 p.m.
+++++++++++
Re: Re: Re: Global temperature anomaly for June 2026-UAH/CO2 & Climate discussion
By metmike - July 12, 2026, 4:02 p.m.
Mike,
Would you please provide a link to the Chris Martz Tweet that you quoted regarding Billings? TIA
The Billings debate could be looked at in different ways as it isn’t clear cut from my perspective. I can explain better if you can provide the link so I know exactly how this debate evolved.
One thing to keep in mind is that the official Billings station is the airport, which started 8/23/1934. That in itself is not a conspiracy:
“Period of record: 1934-08-23 to 2026-07-14”
https://www.weather.gov/wrh/Climate?wfo=byz
Thus, anyone quoting the official Billings record can actually only go back to 8/23/1934. As you and other pro Mets know quite well, the official Billings record is just like the official record for other locations that the NWS uses when it refers to any “all-time record”, which is what I quoted earlier ITT. The lower elevation Billings water plant isn’t the official Billings station as you must know.
I think this is being taken out of context.
Now if we were talking exclusively about the water plant readings, that’s a different story. But again, that’s not the official station.
Point well taken, Larry! That could explain some of the extreme highs in the past.
I'm happy to give people the benefit of the doubt and in fact, it would be absurd for me to have a battle over something that trivial about something that happened a century ago at 1 place.
Regardless, I do like to use a composite of ALL the trivial data at ALL the places and ALL time time frames in ALL the realms, that includes both positive and negative for the increase in CO2, using an objective mind and scientific method to see the BIG picture.
Of course this is a thread that was started to discuss the intense, record breaking heat dome that we just experienced and not a photosynthesis thread, so I get that too. So my comments are only intended to offset the mindset of some of the well known sources about this heat wave, that provide great information (some that I use) but they also use it for 1 sided ammo for climate crisis activism. This is NOT you. All your contributions here are wonderful and I encourage you to challenge me.......to help me to see how you views things because of my great respect for your views.
I don't have time to try to find the exact link of that tweet that I copied off of X but as you know, I'm usually a stickler for putting links up for everything posted here.
1pm: I just bumped into the link that was saved on a tab: https://x.com/DonSuth89069583/status/2077069168554151970
Thanks, Mike.
Ok, that was Don Sutherland. So, Don has the same thought about why the older records from the Billings water plant shouldn’t be combined into one record with the higher elevation airport readings since Aug of 1934. So, we agree on that and assume you do, too.
That makes good sense to me, Larry!
You'll like his latest tweet:
Don Sutherland@DonSuth89069583
·
https://en.wikipedia.org/wiki/Heat_dome

+++++++++++++++++
Here's a term that I have used numerous times in the past when a heat dome PARKS over the Cornbelt, like it did in 2012. "Dome of Death".
Chris Martz is doubling-down in misinformation
Dear fellow meteorologists, stop calling it a “heat dome.”It’s an upper tropospheric ridge / warm-core high-pressure area.That’s what it is by textbook definition. Stick to that and quit using sensationalistic garbage.
https://x.com/ChrisMartzWX/status/2077250207767515167?ref_src=twsrc%
——————
Wxfollower commentary: I’m neither Eric Sevareid nor Paul Harvey <G>…I’m just Larry. So, fwiw:
Martz is doing it again and he’s either quite ignorant or he’s being willfully obnoxious. I first learned about this term way back in 1998 courtesy of pro met. Charlie Notis talking about intense heat forecasts for the Midwest that would be bad for C/S. This usage had zero to do with emphasizing GW. It’s what strong H5 highs are commonly called!
Yes, very bad place or reason to pick a battle over.
I just checked and I've used the term "dome of death" dozens of times but very often to tell readers that we DON'T have a dome of death.
Re: Re: Drought/weather of 2012 vs 2021
By metmike - May 20, 2021, 11:45 p.m.
++++++++++++++++
It just occurred to me that I borrowed that expression, "dome of death" from Mark Kinoff(local on MarketForum) who was a great friend in the early/mid 2000s.
In July 2002, greenman got me and local together to form a 3 man trade information sharing group via email.
Every morning, we shared our thoughts about the markets we traded with each other for several months.
July 2002 was also when I traded over 10,000 round turns of C and S, most active ever.
Lind Waldock was assessing me 150% of the margin on contracts of orders over 200 lot corn and 100 lot soybeans.
greenman referred to me as "The world's best weather trader". At the time, it was probably true but NOT today.
Funny thing is that we all shared our extensive thoughts and trades for months but they almost never overlapped each others personal trading. In other words, I never even considered taking a greenman or local trade and they didn't take mine.
However, I learned the expression, "gap and crap" and the meaning of that term from greenman and have used that hundreds of times here. Several things from local too, especially about market psychology. local was so incredibly expressive and I loved his "dome of death" expression for heat domes. He used to say that once the grain market kills the crop, it doesn't matter how much hotter and drier the weather forecast gets......there's nobody left to buy! So true!
Both those guys were 2 of the sharpest I've ever known. greenman actually called me on the phone dozens of times because he was so fascinated with my massively successful trading and he wanted to pick my brain. He was all about learning more and using that knowledge.
greenman actually picked what he thought were the 2 smartest traders on MarketForum, contacted us and formed a personal relationship to learn as much as he could(while sharing everything that he knew), in 2002/2003!
Both those guyswere elite technical/chart analysts.
+++++++++++
3:15pm: I just looked up local and found this which is quite old, I believe:
https://www.moneyshow.com/expert/cd7c14430fc84ef0ac61d457d3aff1b3/
He picked the handle "local" on Marketforum because he was a trader on the bond floor in the 1990's. Boy this business has changed since then!
Larry, you go back to the earliest days and have the same memories of posters here, although the ones I just shared were off the forum.
Anyways, thank you, local for gifting me with your "dome of death" expression!
#Toronto#TorontoWeather#HeatWave#TorontoCulture
%20Toronto%20Culture%20-%20Toronto%20recorded%20one%20of%20its%20hottest%20days%20ever%20on...%20Facebook.png)
There's that Summer of 1936 again. Not just parts of the United States and Canada but MOST of the United States also into Canada. Not just less than a week of intense heat at most locations but almost all of July/August.
Re: Grains--post breakout of July 6
By metmike - July 21, 2026, 11:30 a.m.
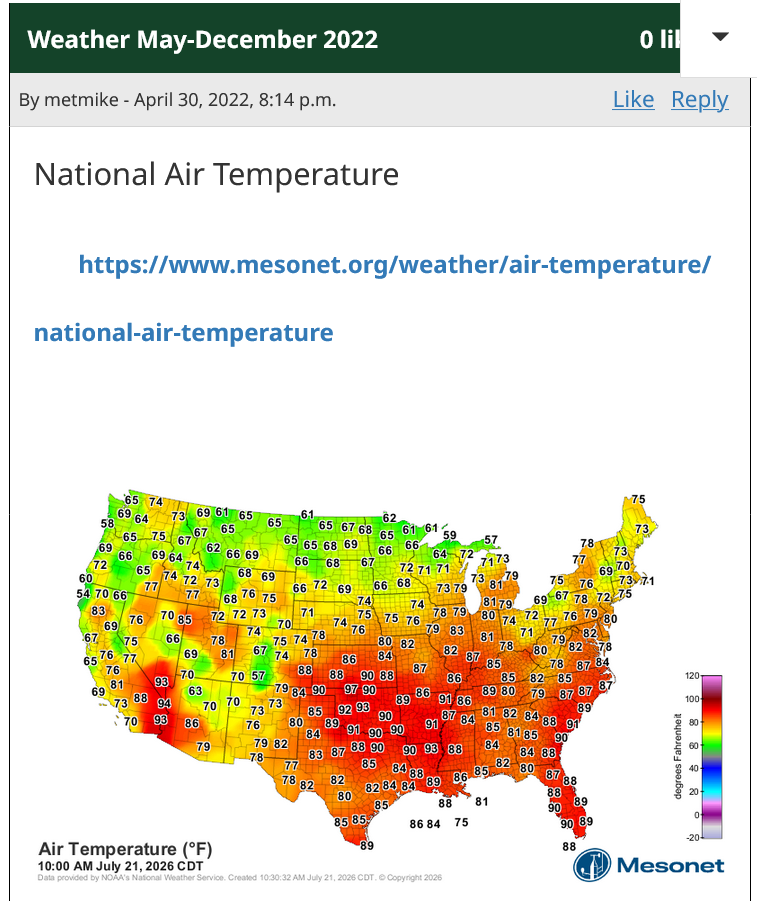
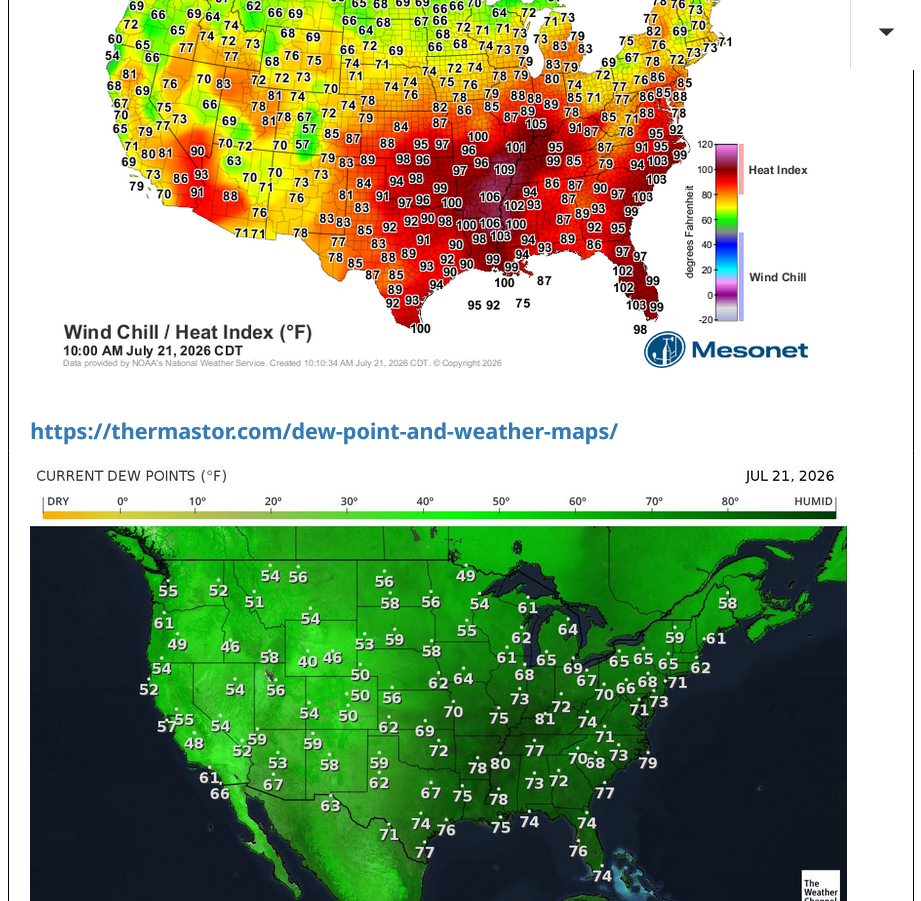
We have a shot for rain the next 7 hours here in southwest, IN until this cold front goes thru late afternoon. Some extremely steamy dew points ahead of the front in this air mass, a few at 80+ are pretty impressive just after 10am.
That's the feature causing the Heat Index to soar higher today. The next 3 frames are frozen images.
1. Air temp-10am Central
2. Heat Index-20 deg, higher in spots from humidity
3. Dew Point-75 Deg+ in most places ahead of front
+++++++++++=
Constant updates below:
https://www.marketforum.com/forum/topic/83844/#83845
https://thermastor.com/dew-point-and-weather-maps/