
Great site for getting rainfall data. Just put in your zip code!
https://www.raindrop.farm/rainfall-totals/zipcode
++++++++++++
https://www.wunderground.com/maps/radar/current
Recent rain amounts:
https://weather.us/precipitation/usa/us-preciptotal-72h-in/20260402-1200z.html
weathernet.com/total-rainfall-map-24-hours-to-72-hours
+++++++++++++++
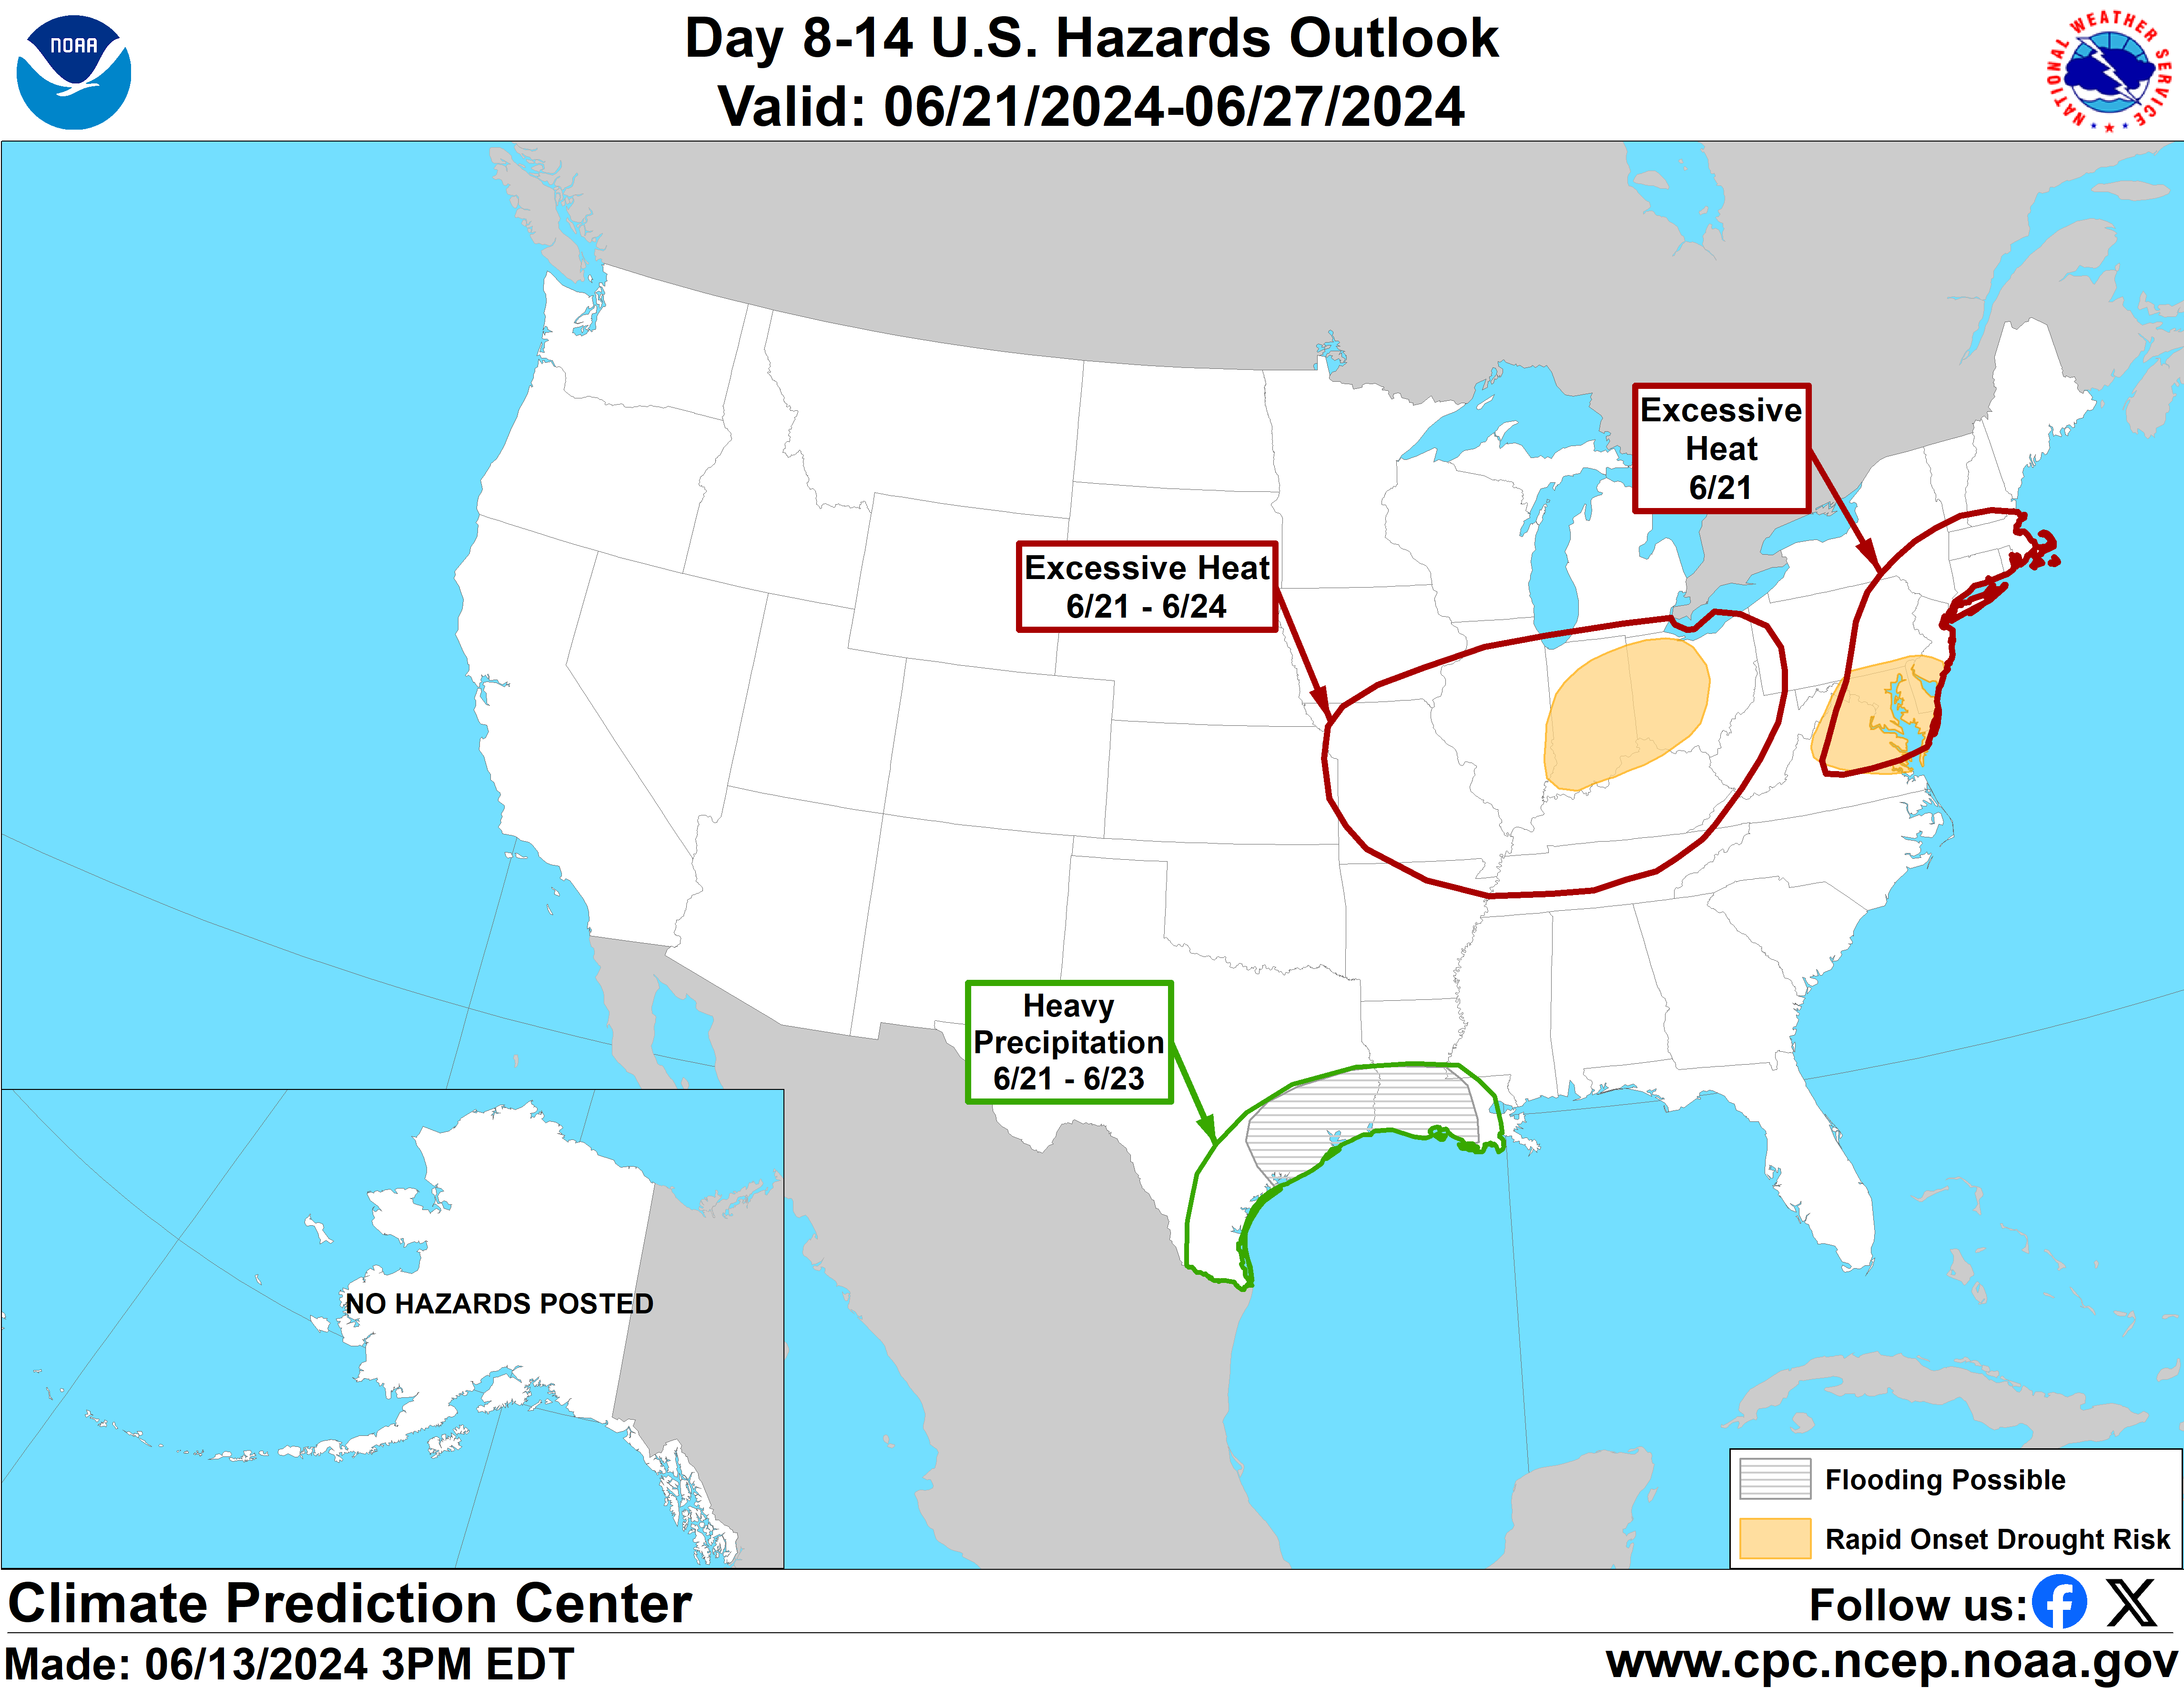
Current Hazards at the link below.
For your NWS and county, go to the link below.
Then you can hit any spot on the map, including where you live and it will go to that NWS with all the comprehensive local weather information for that/your county.

New radar product below
Go to: "Select View" then "Local Radar"
Hit the purple circle to see that local radar site
+++++++++++++++++++++++
This link below provides some great data. After going to the link, hit "Mesoanalysis" then, the center of any box for the area that you want, then go to observation on the far left, then surface observations to get constantly updated surface observations or hit another of the dozens of choices.

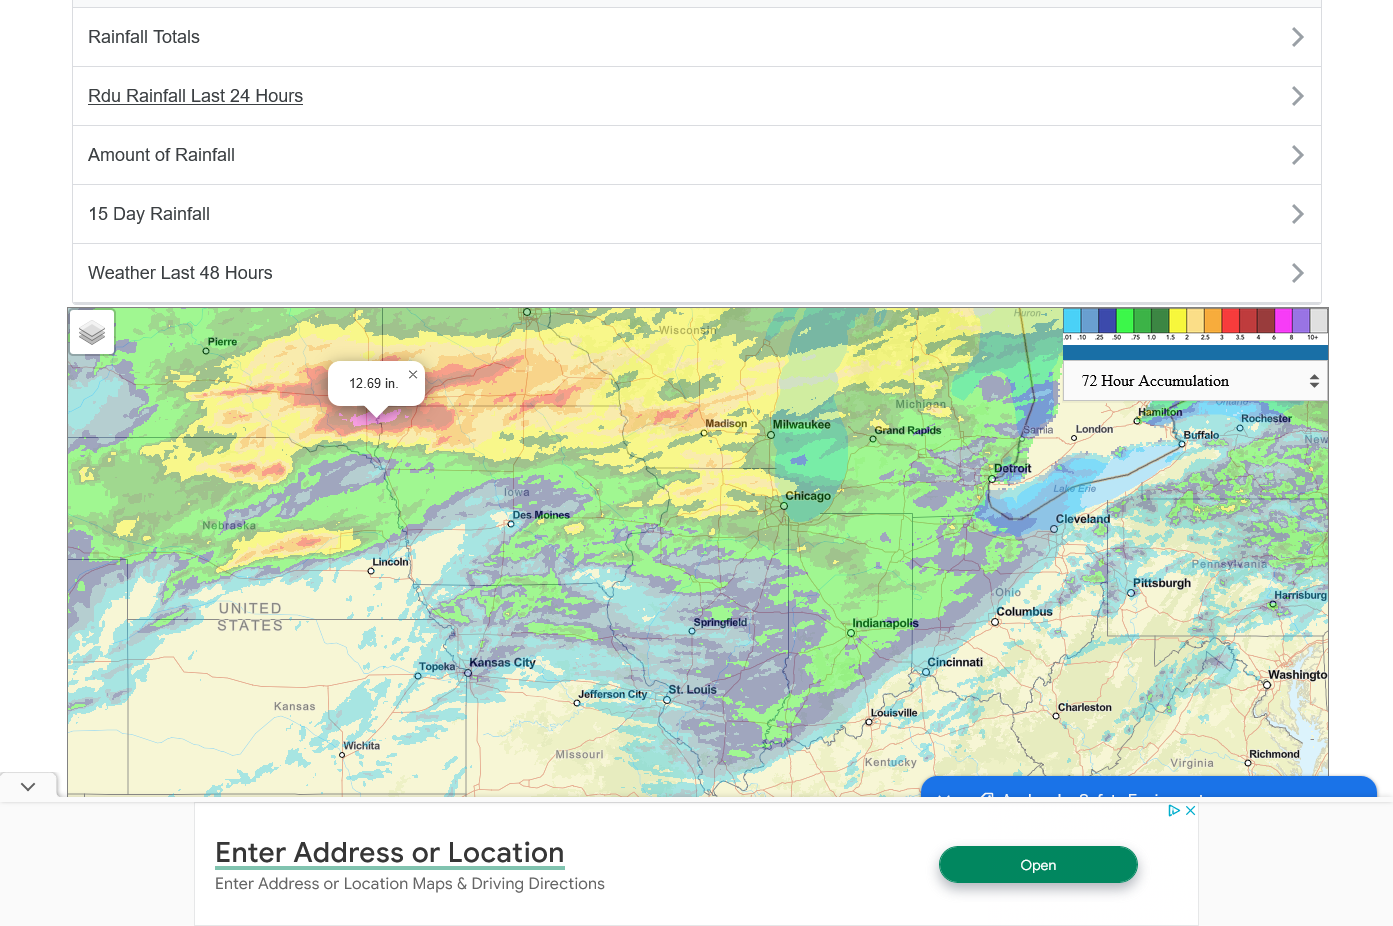
Found a great new link/site that shows us how much precip fell(from 1 hr to 72 hours) for different periods to share with you.
https://www.iweathernet.com/total-rainfall-map-24-hours-to-72-hours
Data Update Cycle: The 1-hr mosaic is updated every 5 min (approx). All other mosaics are now updated hourly, including the 48h and 72h maps.
The site does not allow me to copy the actual images/data here, as we do with all the other links above..........so just go to the link!
https://www.mesonet.org/weather/air-temperature/national-wind-chill-heat-index
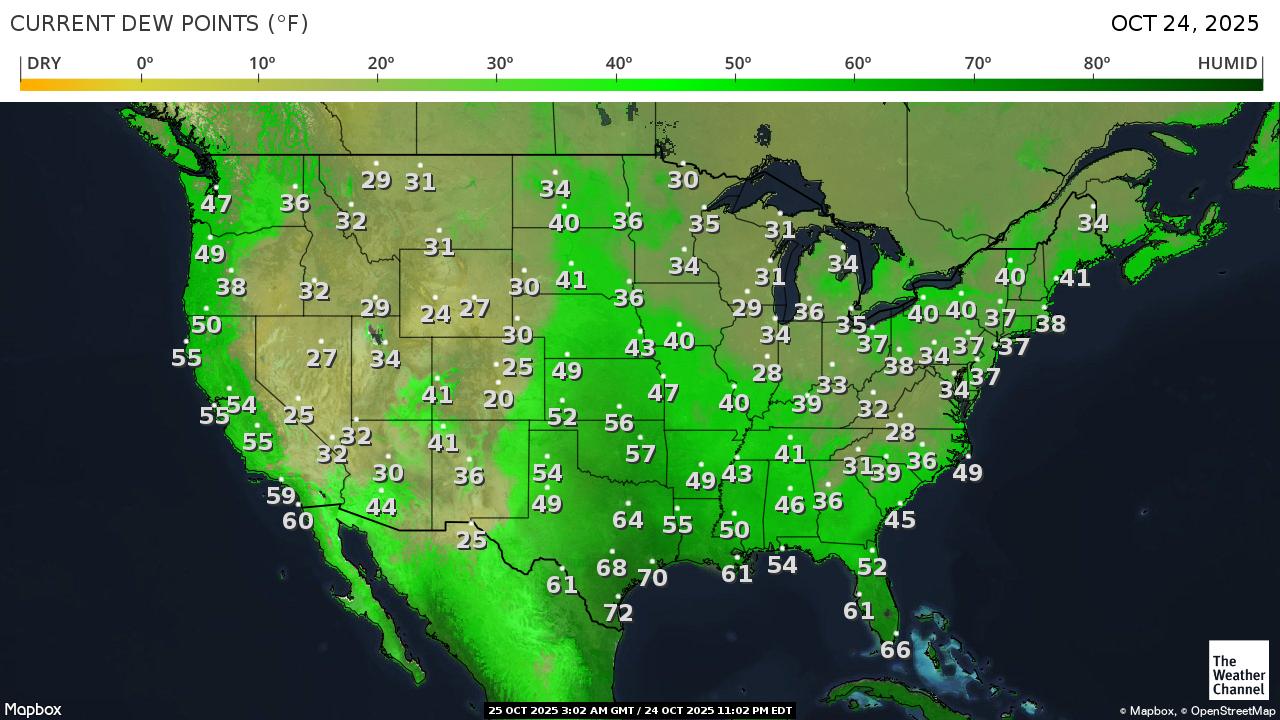
https://thermastor.com/dew-point-and-weather-maps/
Current Conditions below updated every few minutes.
https://www.spc.noaa.gov/exper/mesoanalysis/new/viewsector.php?sector=19

UPPER MIDWEST
https://www.spc.noaa.gov/exper/mesoanalysis/new/viewsector.php?sector=13#


https://www.spc.noaa.gov/exper/mesoanalysis/new/viewsector.php?sector=13#
LOWER MIDWEST
https://www.spc.noaa.gov/exper/mesoanalysis/new/viewsector.php?sector=20

https://www.spc.noaa.gov/exper/mesoanalysis/new/viewsector.php?sector=20#

https://www.spc.noaa.gov/exper/mesoanalysis/new/viewsector.php?sector=20# 
SOUTHCENTRAL
https://www.spc.noaa.gov/exper/mesoanalysis/new/viewsector.php?sector=15#
SOUTHEAST
https://www.spc.noaa.gov/exper/mesoanalysis/new/viewsector.php?sector=18#

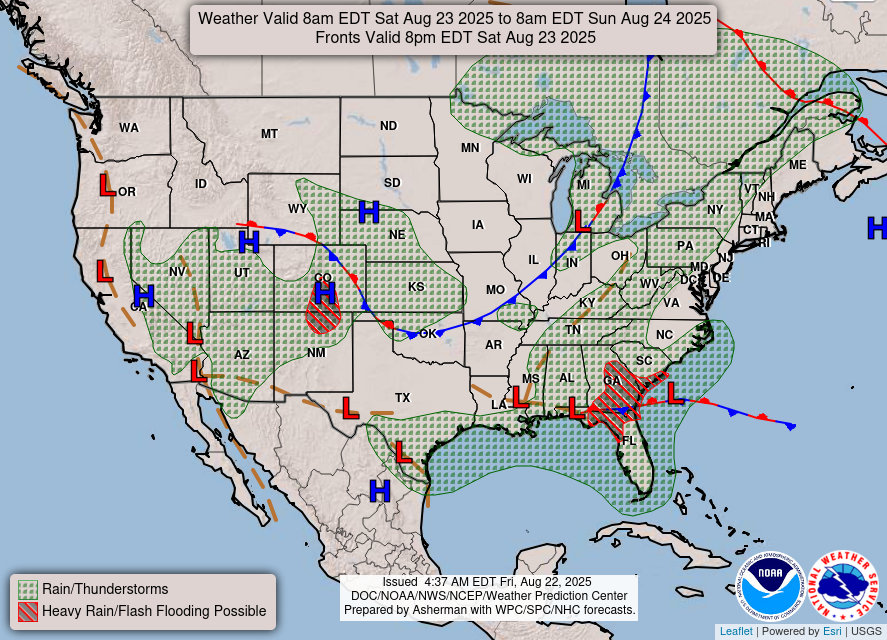
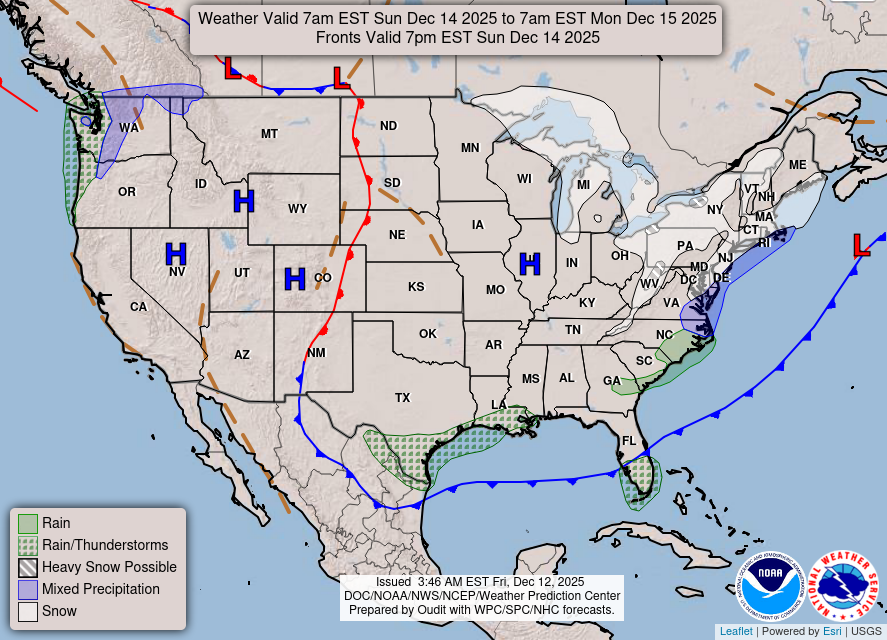
1. Weather map now.
2. In 24 hours and
3. In 48 hours.
https://www.wpc.ncep.noaa.gov/#

+++++++++++++++++++++++++++++++++++++++++++++++++
Surface Weather maps for days 3-7 below:
https://www.wpc.ncep.noaa.gov/medr/medr.shtml

+++++++++++++++++++++++++++++++++++++++++++
The latest 7 day precip forecasts are below.
Day 1 below:
http://www.wpc.ncep.noaa.gov/qpf/fill_94qwbg.gif?1526306199054

Day 2 below:
http://www.wpc.ncep.noaa.gov/qpf/fill_98qwbg.gif?1528293750112

Day 3 below:
http://www.wpc.ncep.noaa.gov/qpf/fill_99qwbg.gif?1528293842764

Days 4-5 below:
http://www.wpc.ncep.noaa.gov/qpf/95ep48iwbg_fill.gif?1526306162

Days 6-7 below:
http://www.wpc.ncep.noaa.gov/qpf/97ep48iwbg_fill.gif?1526306162

7 Day Total precipitation below:
http://www.wpc.ncep.noaa.govcdx /qpf/p168i.gif?1530796126

Winter Weather Forecasts
Excessive rain threat.
https://www.wpc.ncep.noaa.gov/qpf/excess_rain.shtml
Current Day 1 Forecast
Day 1 Threat Area in Text Format
Current Day 2 Forecast |
Day 3 outlook

| Excessive Rainfall Outlook Day 4 Static Image |
|---|
 |
| Excessive Rainfall Outlook Day 5 Static Image |
|---|
 |
Severe Storm Risk......updated daily(days 1 and 2 twice daily).
https://www.spc.noaa.gov/products/outlook/
Current Day 1 Outlook | |
Current Day 2 Outlook | |
Current Day 3 Outlook | |
Current Day 4-8 Outlook |
Highs for upcoming week: Days 3-7.
https://www.wpc.ncep.noaa.gov/medr/medr_max.shtml


+++++++++++++++++++++++++++++++++++++++++++++++
Lows for upcoming week below: Days 3-7
https://www.wpc.ncep.noaa.gov/medr/medr_min.shtml
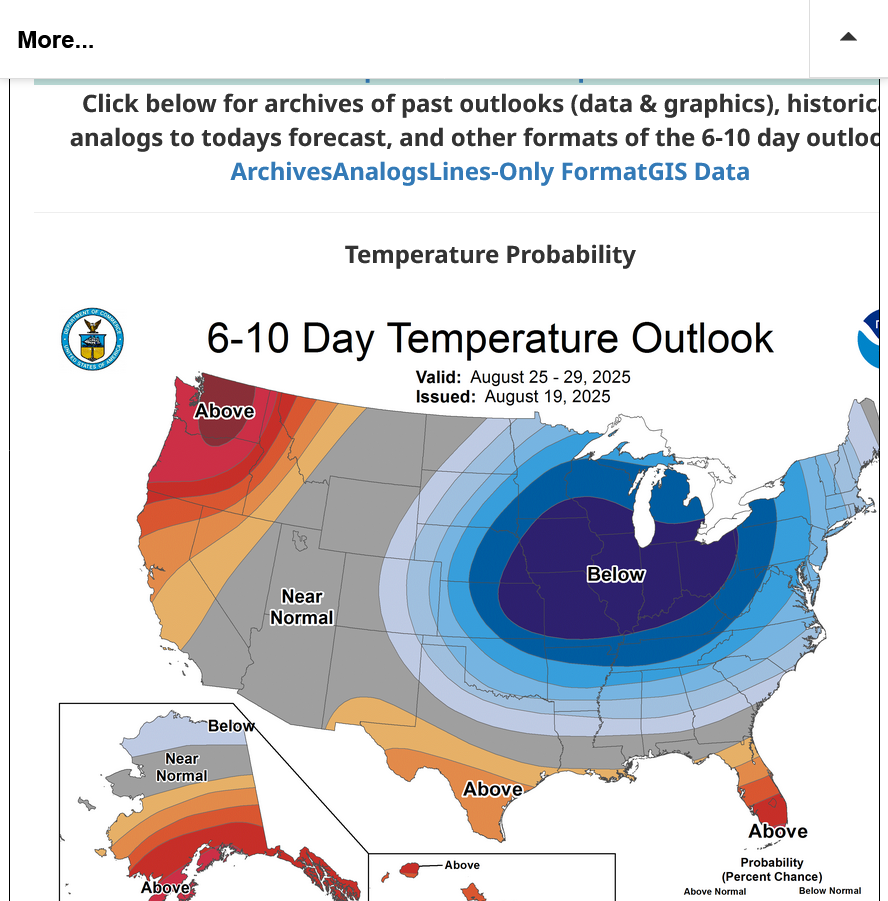
Extended weather.
https://www.cpc.ncep.noaa.gov/products/predictions/610day/ | |||||||||
| 6 to 10 day outlooks | |||||||||
| Click below for information about how to read 6-10 day outlook maps Temperature Precipitation | |||||||||
| Click below for archives of past outlooks (data & graphics), historical analogs to todays forecast, and other formats of the 6-10 day outlooks ArchivesAnalogsLines-Only FormatGIS Data | |||||||||
Temperature Probability | |||||||||
Precipitation Probability | |||||||||
Great site for getting rainfall data. Just put in your zip code!
https://www.raindrop.farm/rainfall-totals/zipcode
+++++++++++++++
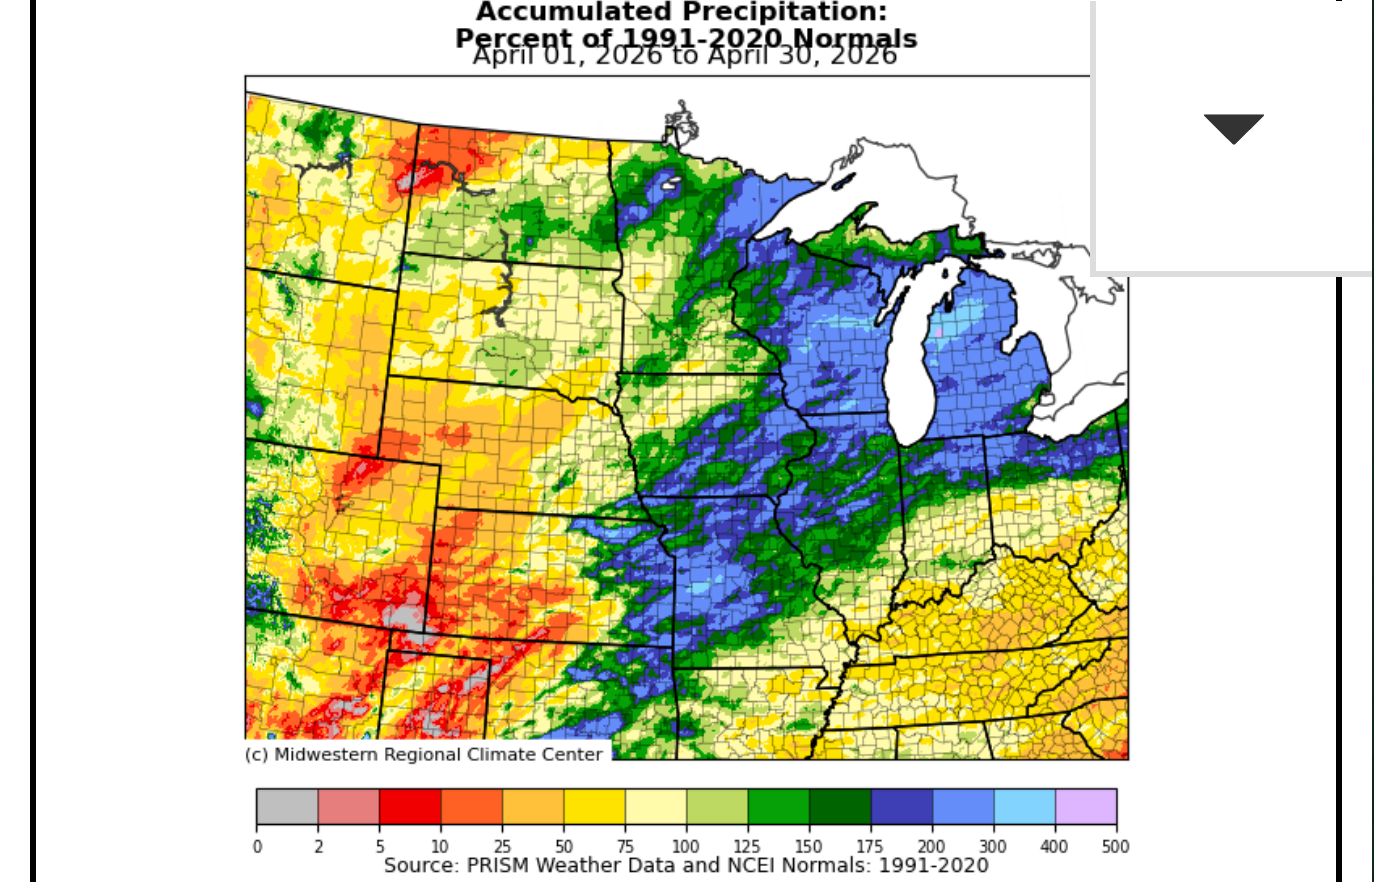
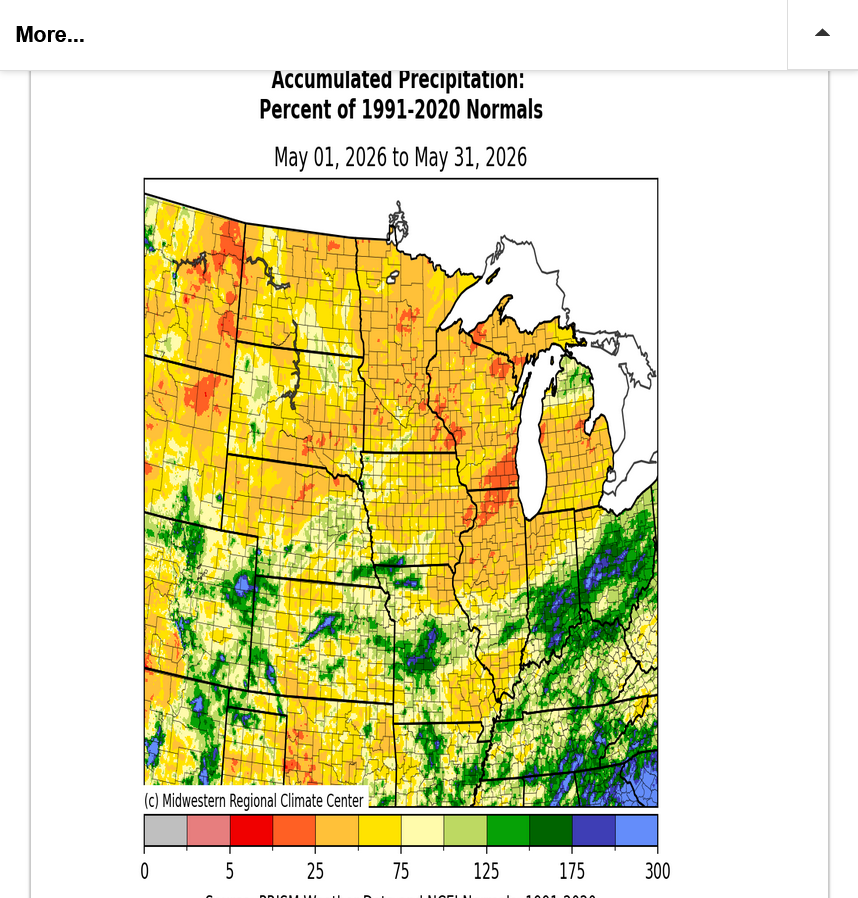
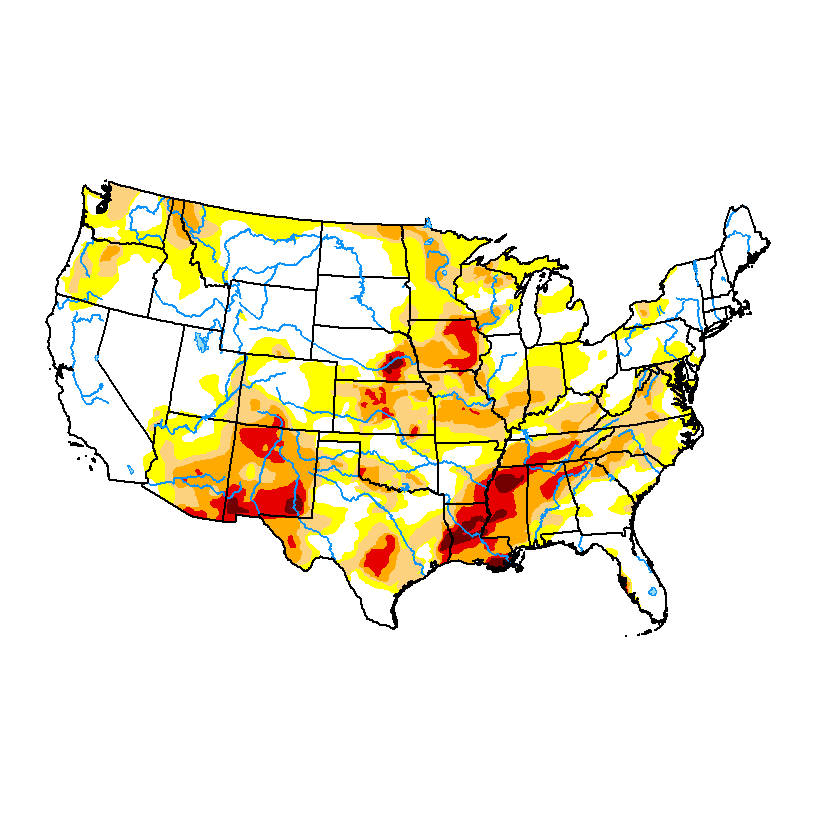
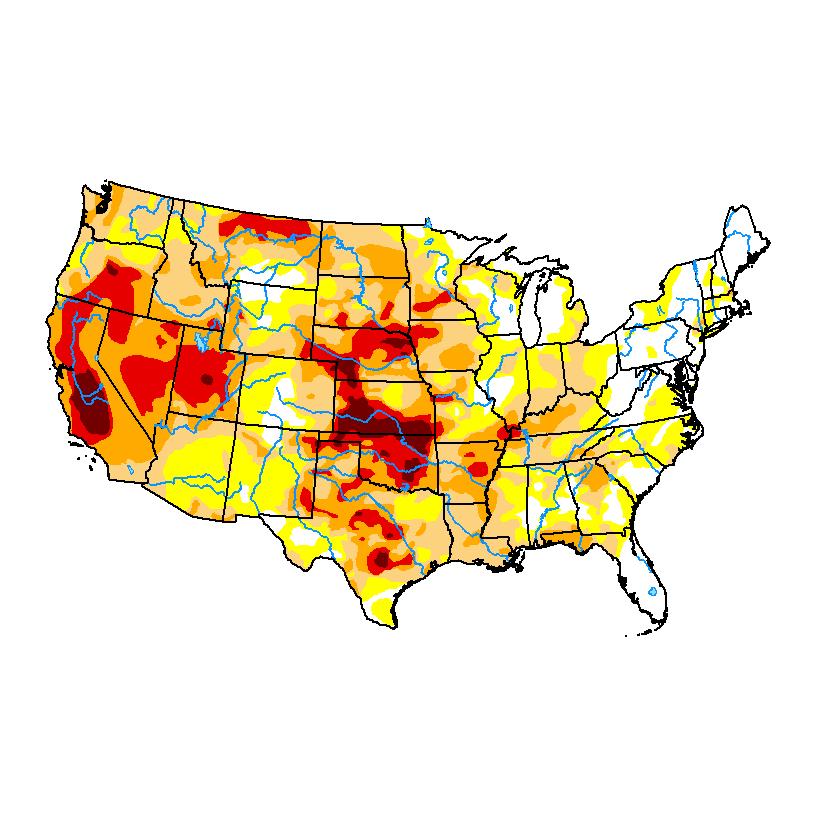
6-10-26:
Much of the Midwest and Great Lakes had their soil moisture recharged in April. Now much of the South saw the drought intensity greatly reduced in May/June.
+++++++++
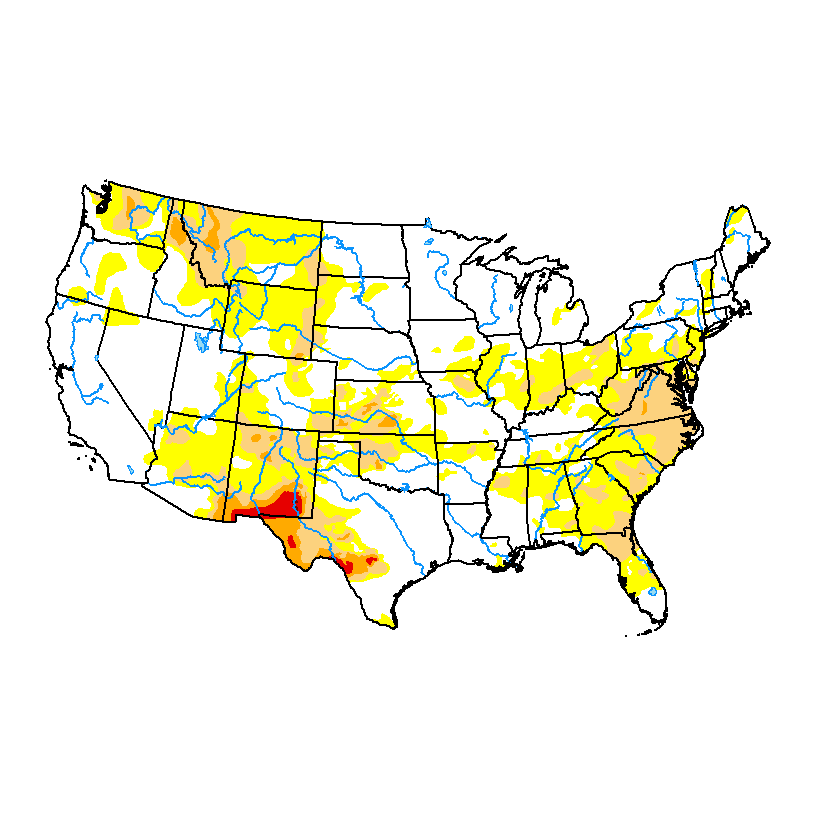
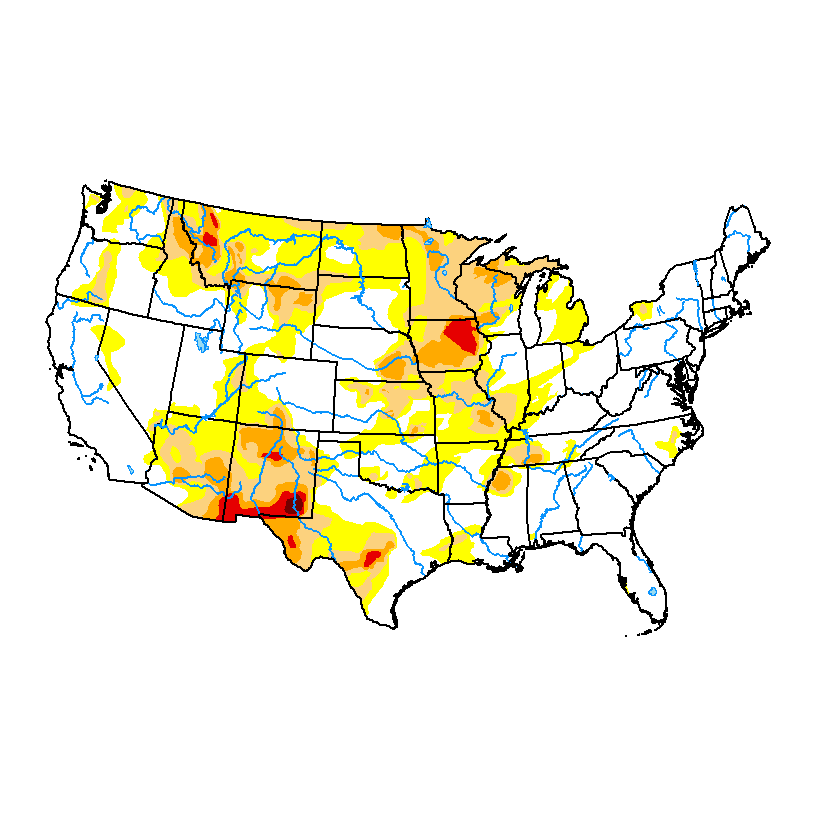
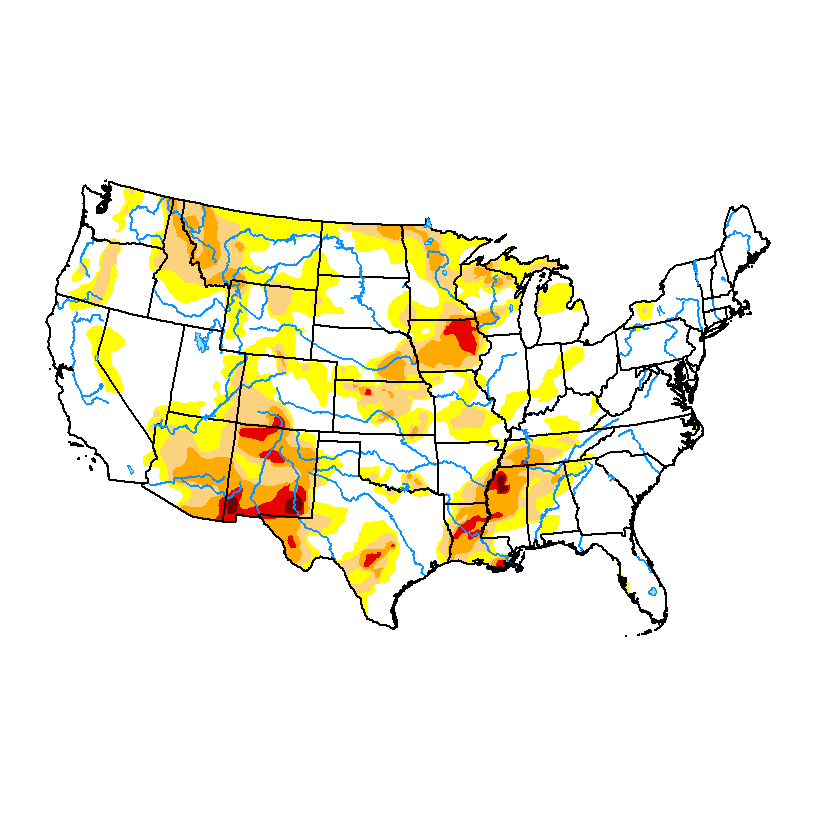
Soilmoisture anomaly:
These maps sometimes take a day to catch up to incorporate the latest data(the bottom map is only updated once a week).
https://www.cpc.ncep.noaa.gov/products/Soilmst_Monitoring/US/Soilmst/Soilmst.shtml#
![]()


++++++++++++++++++++++++++++
Main link:
https://mrcc.purdue.edu/ag-climate-dashboard
Updated daily below:
https://mrcc.purdue.edu/cliwatch/watch.htm#curMonths
Snapshot below:

NEW LINK:
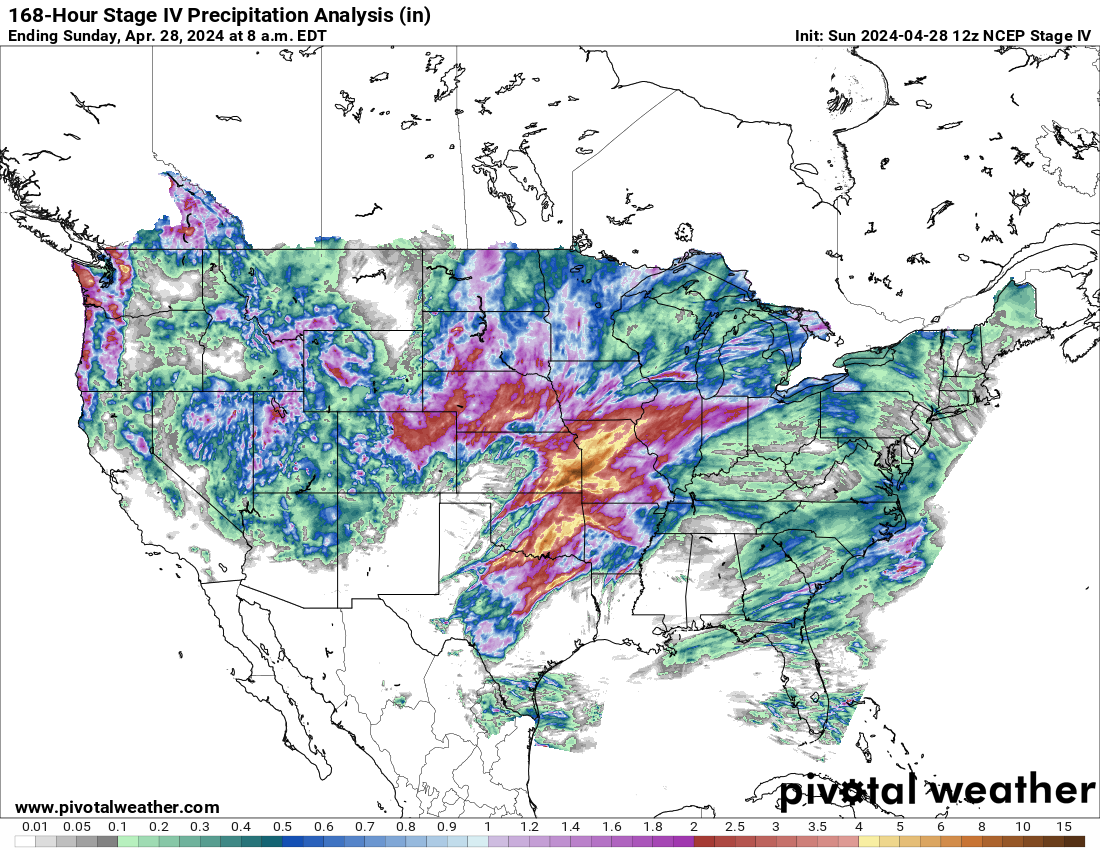
https://www.pivotalweather.com/maps.php?ds=stageiv&p=stageiv_qpe_168h_p&r=conus
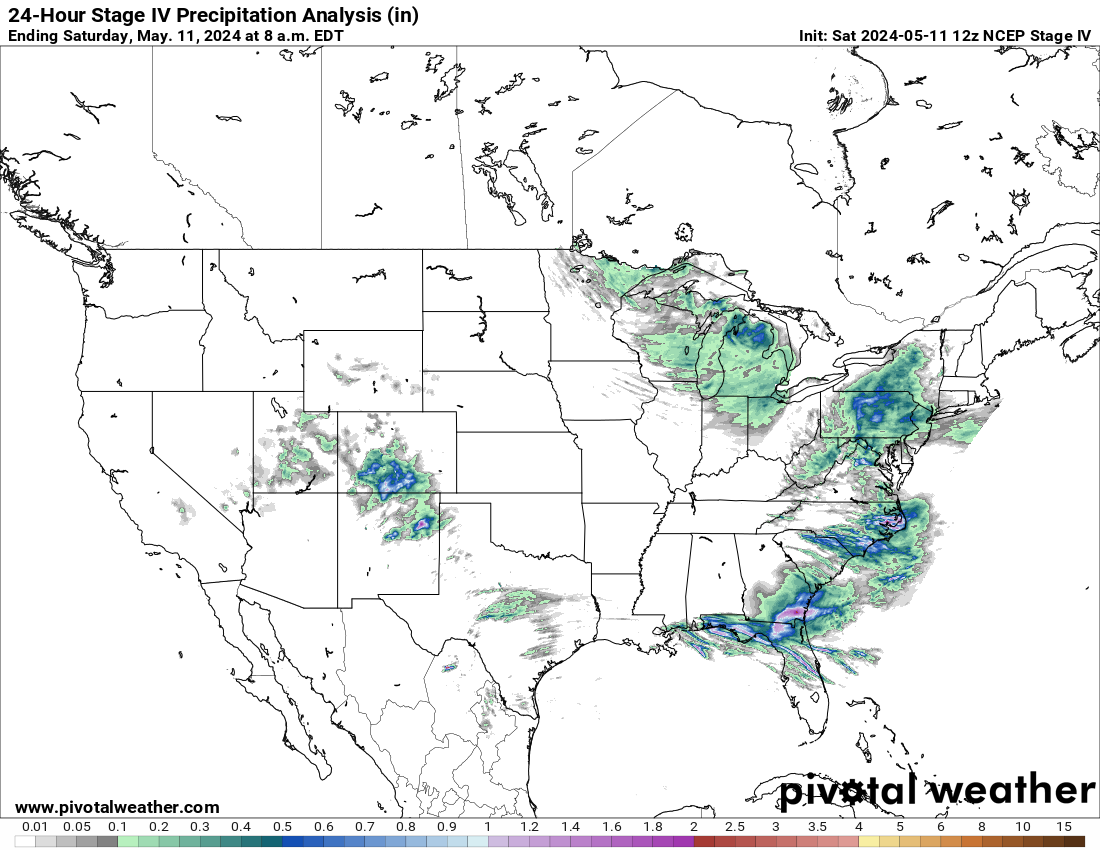
Last 24 hours
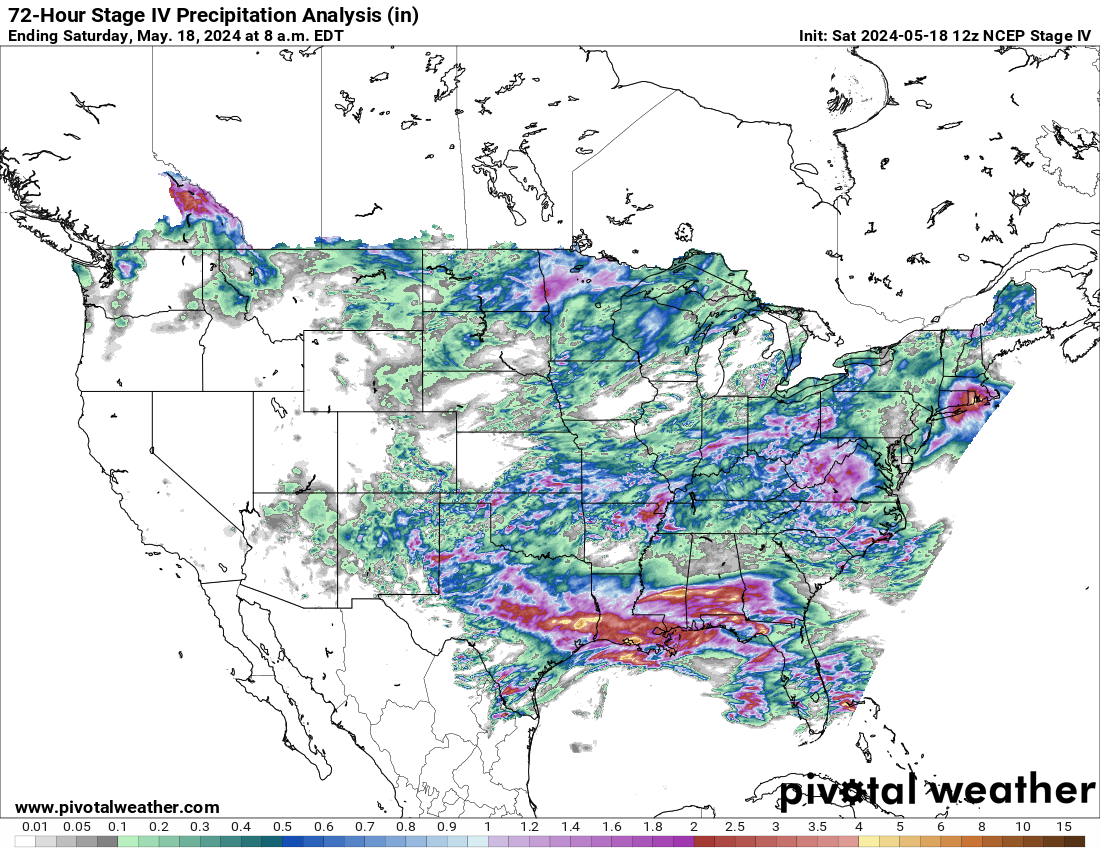
Last 72 hours
Last 7 days:
https://www.drought.gov/current-conditions
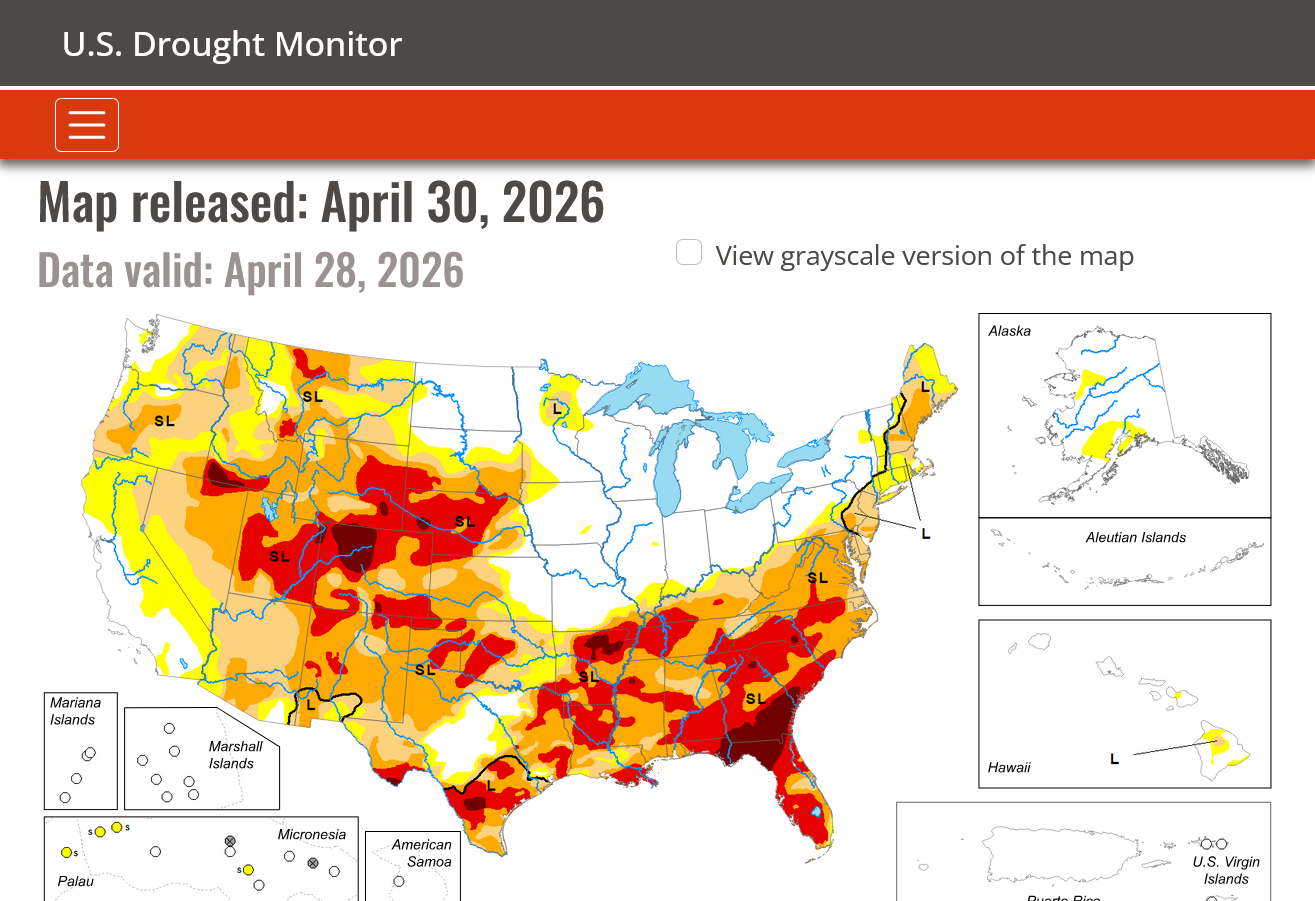
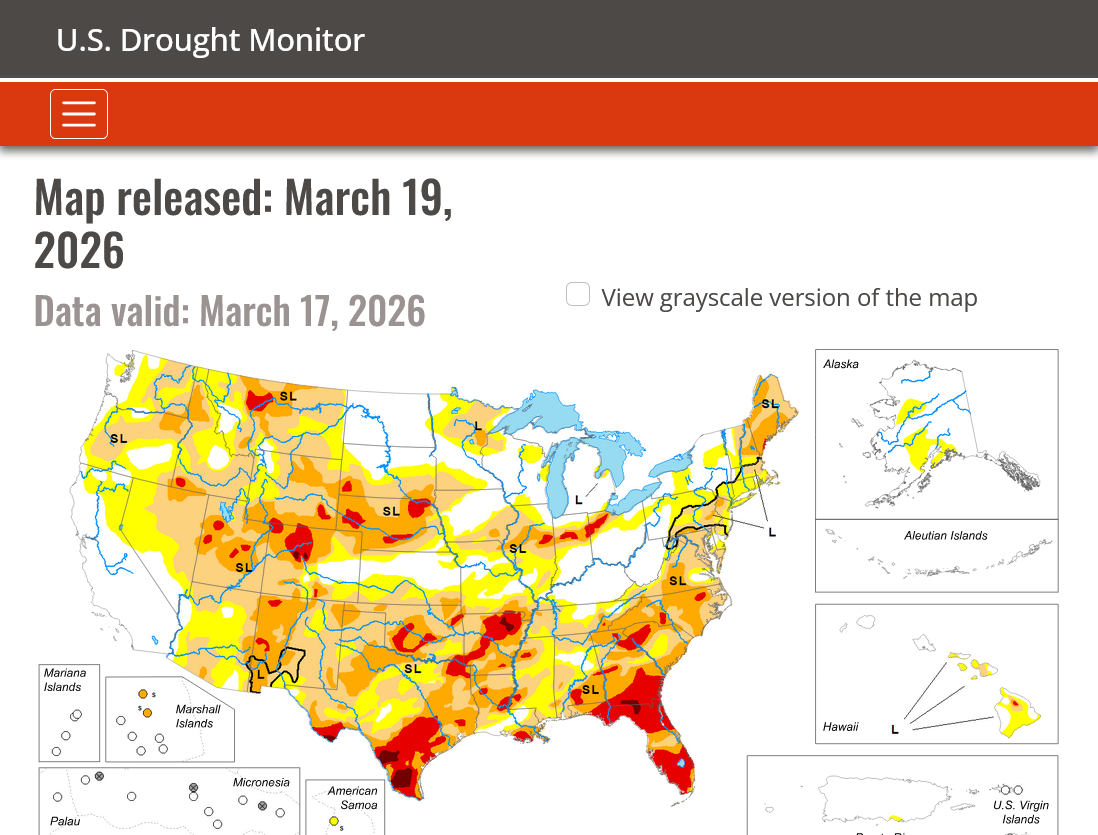
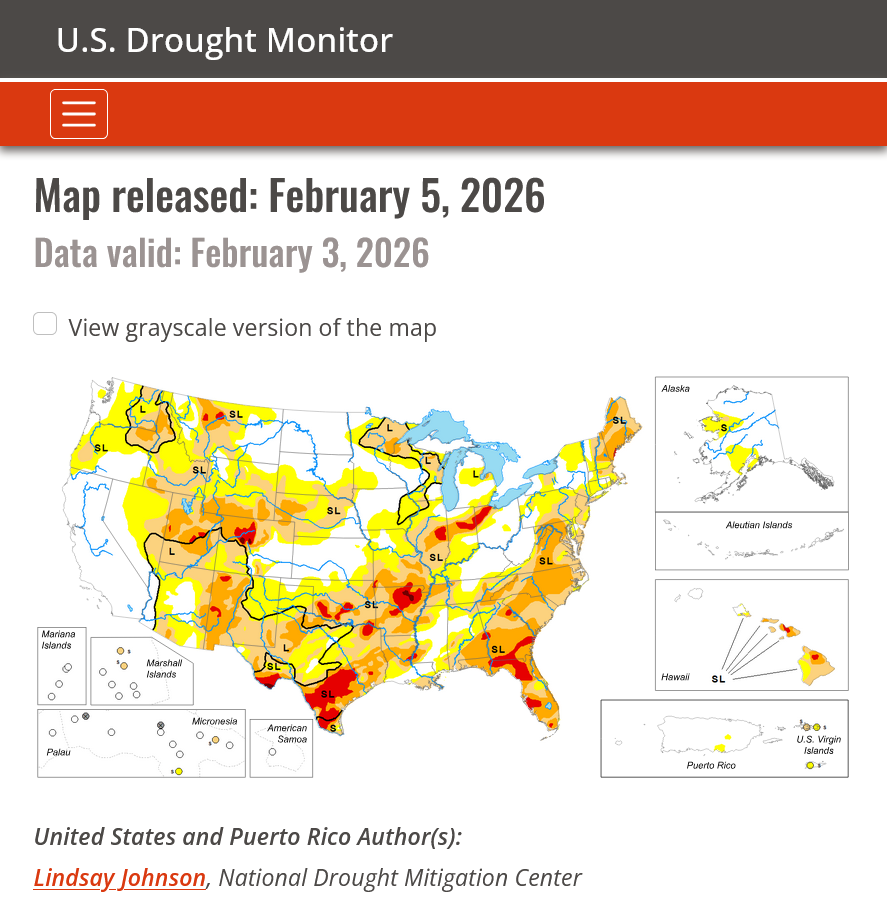
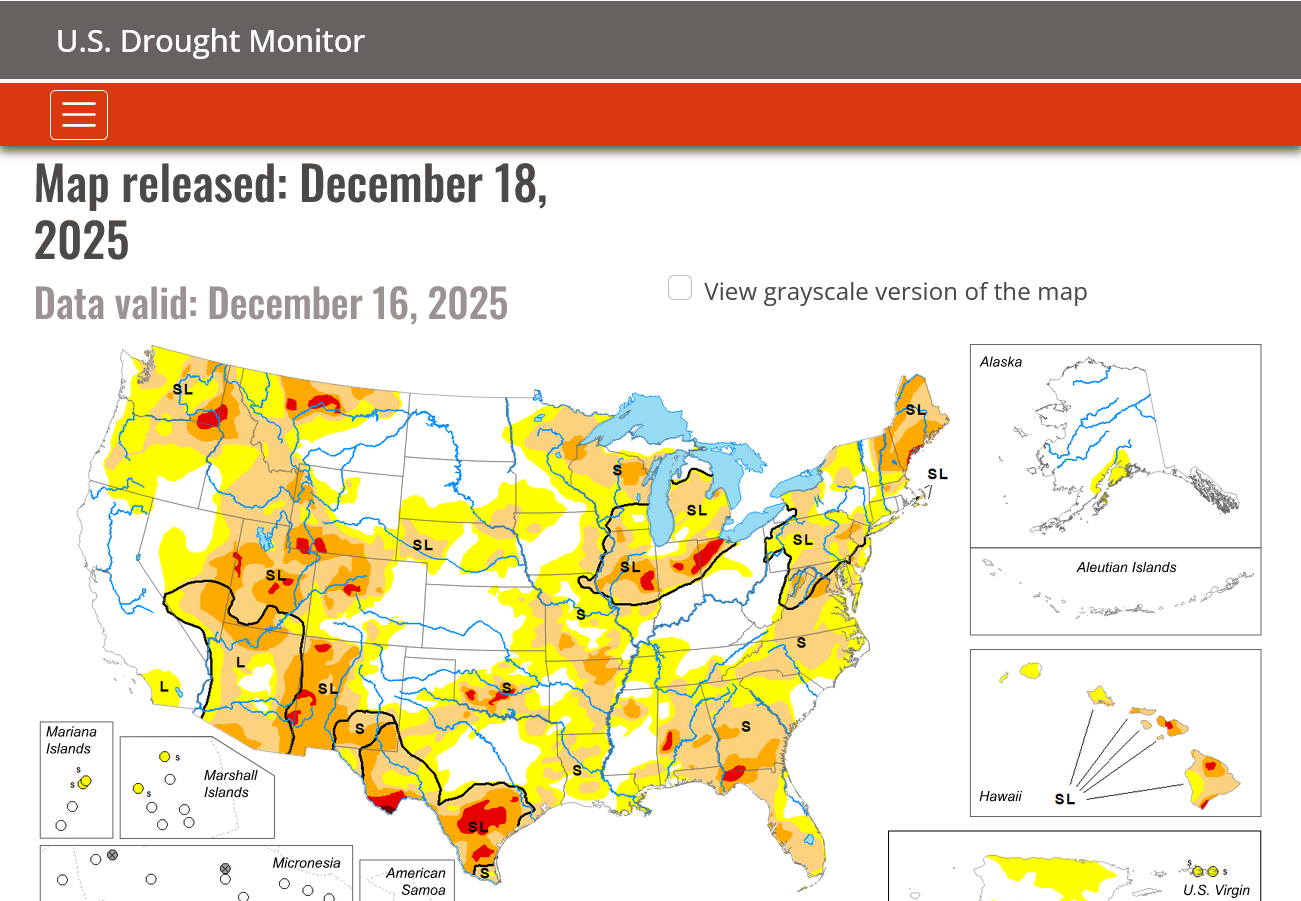
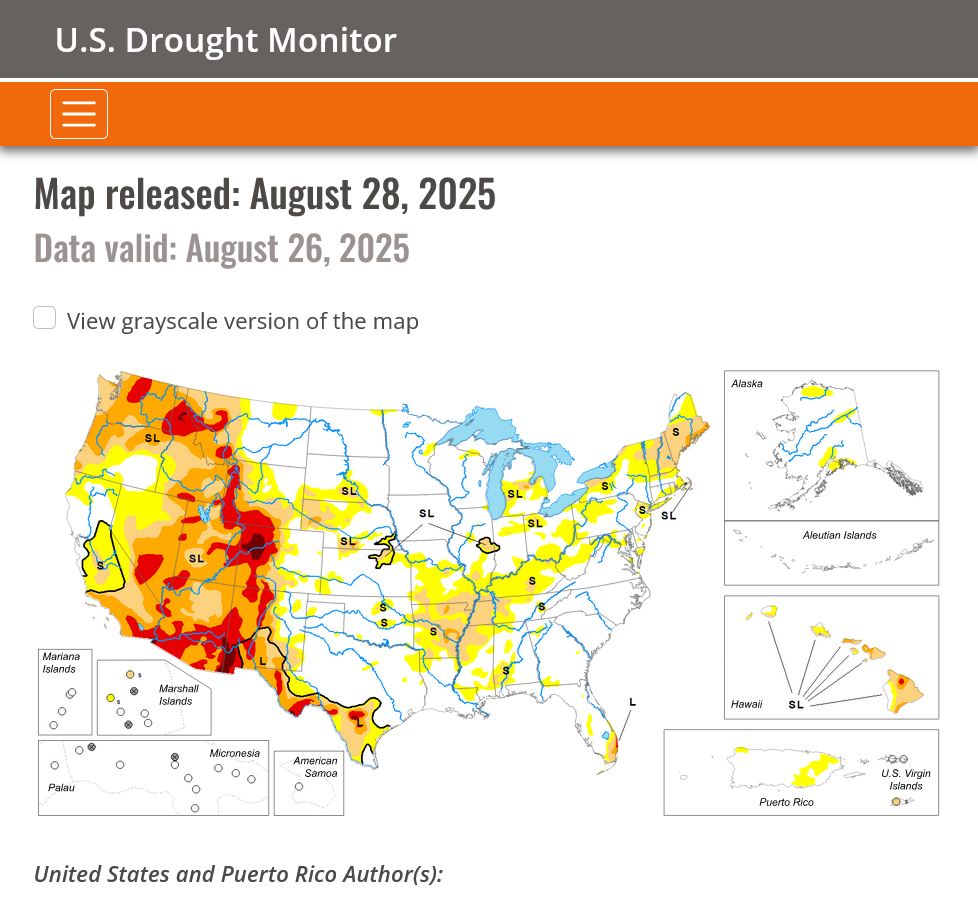
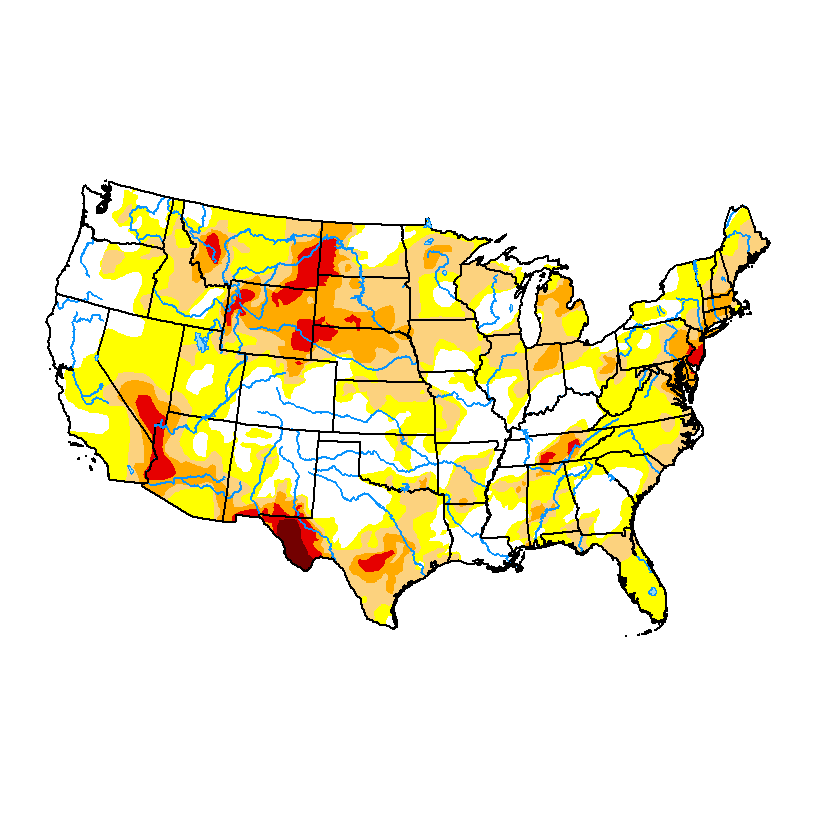
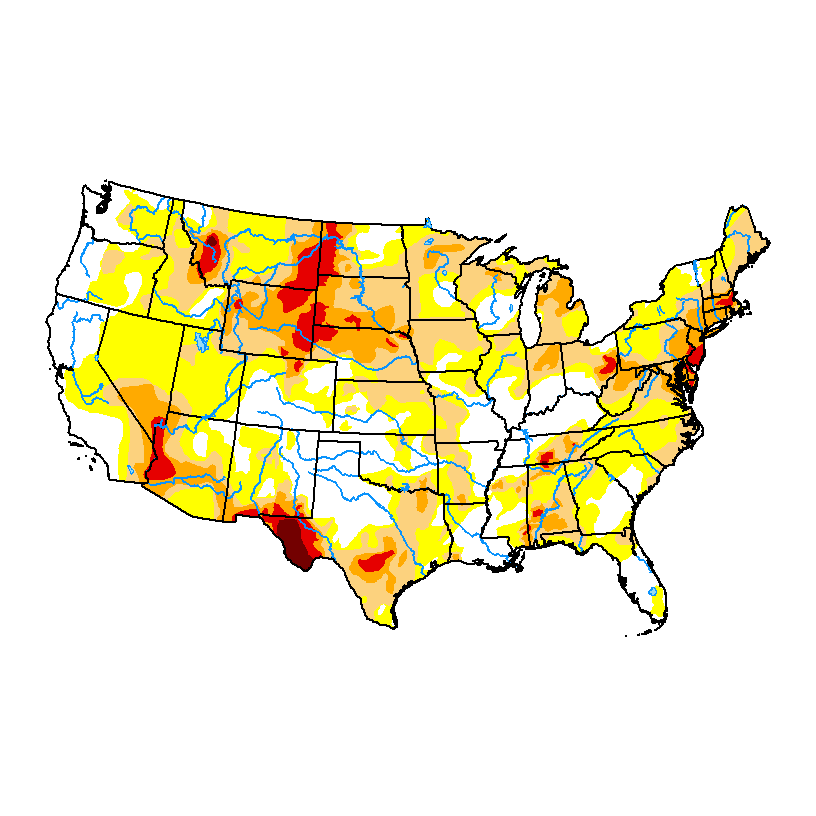
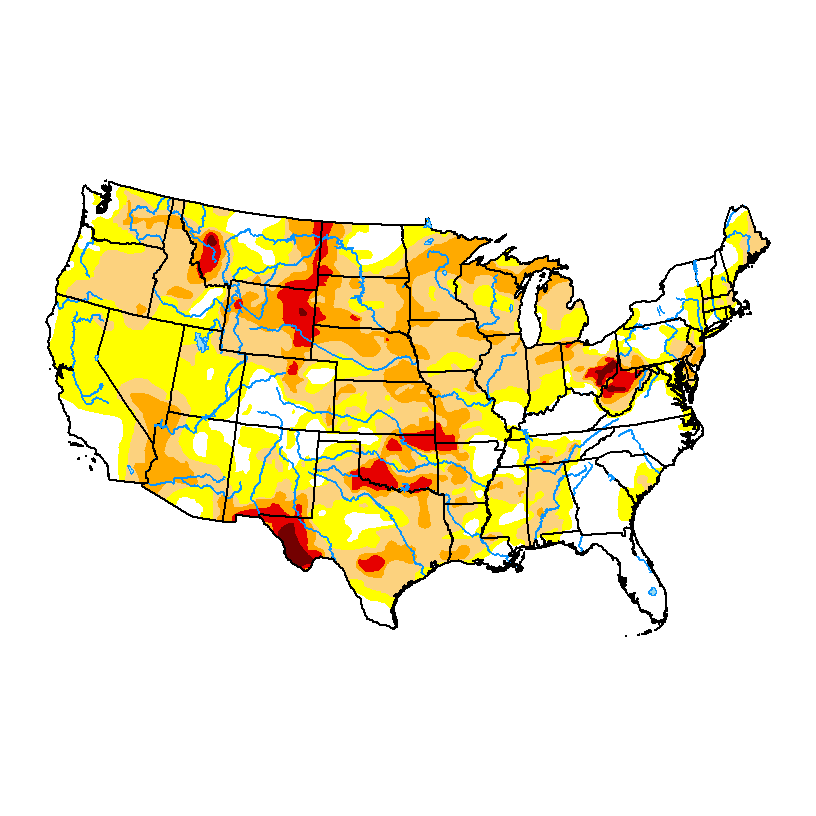
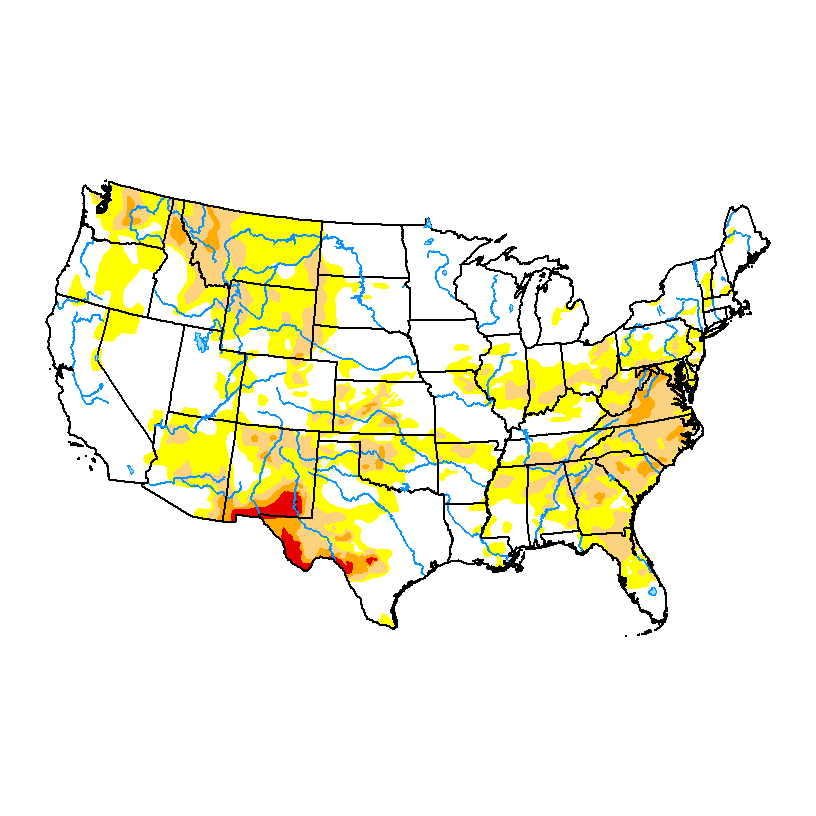
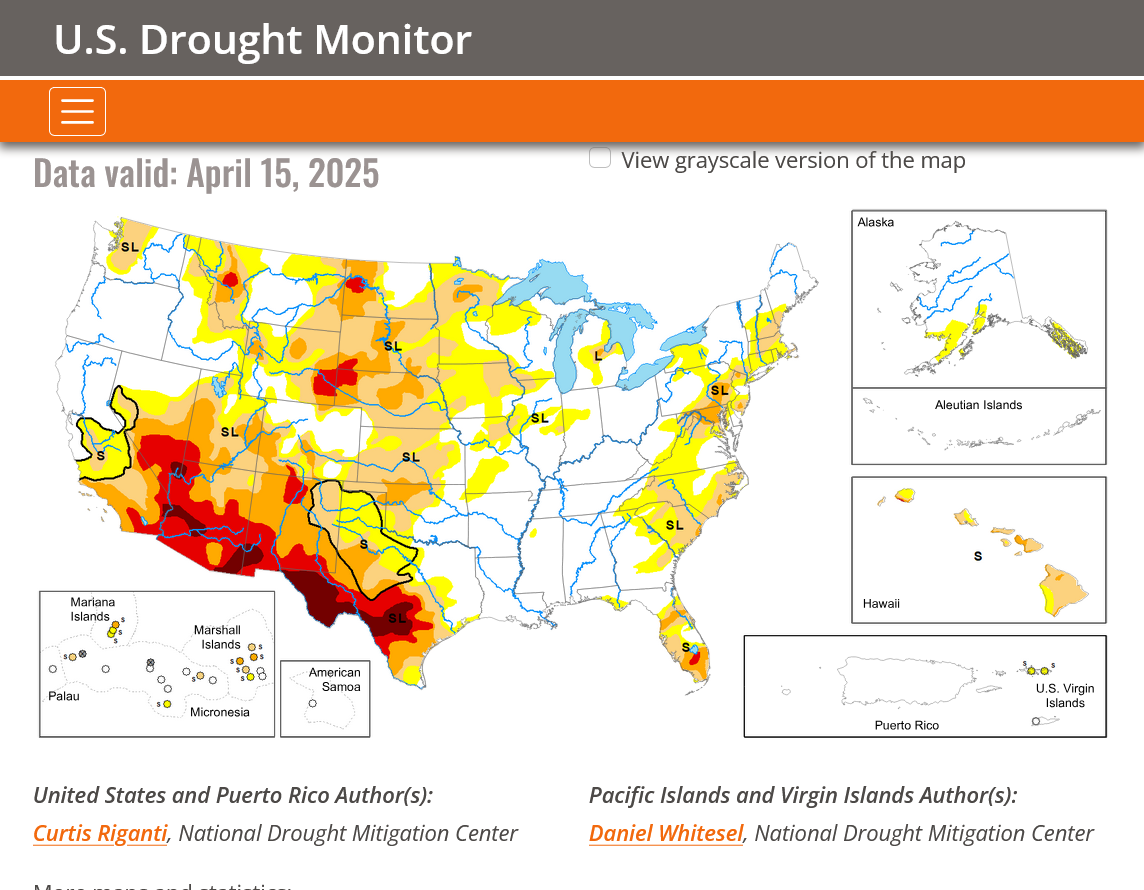
Thru June 16, 2026
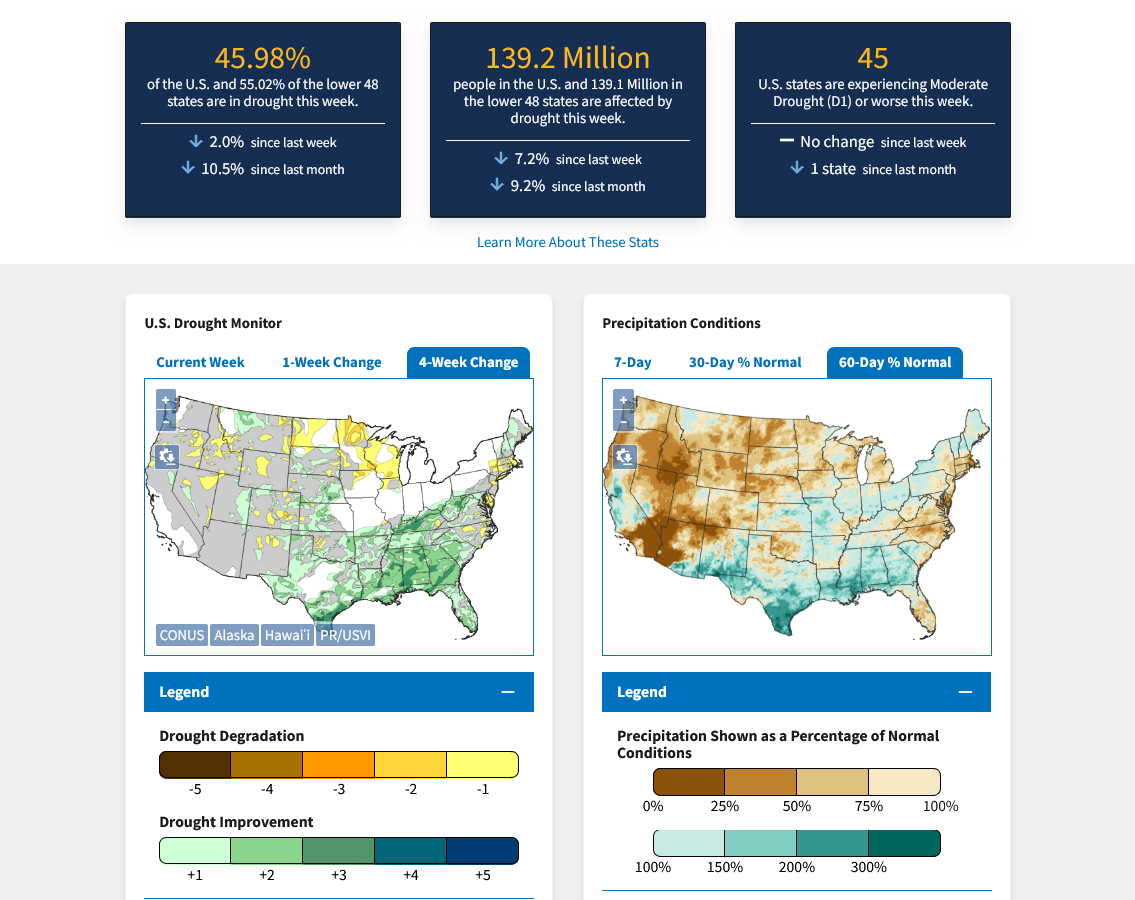
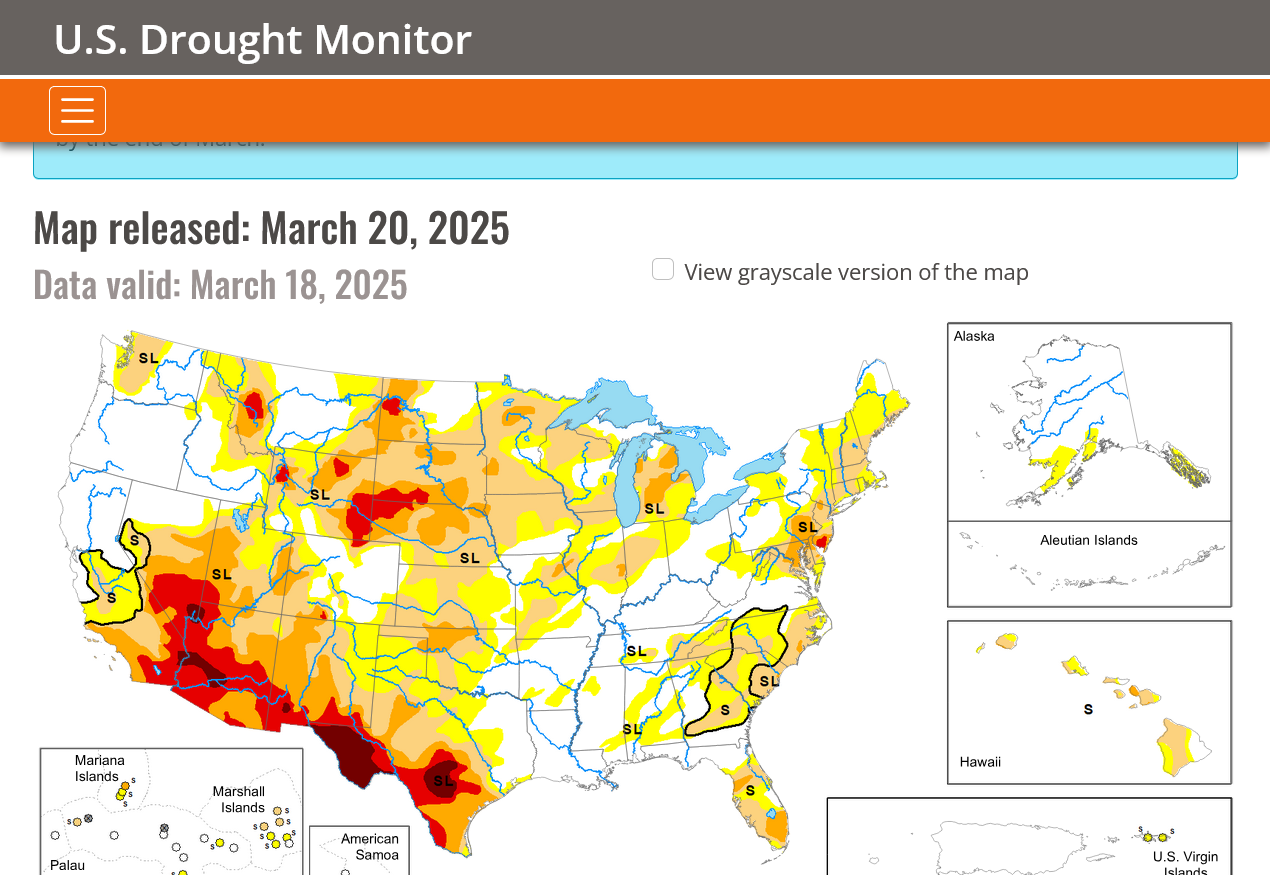
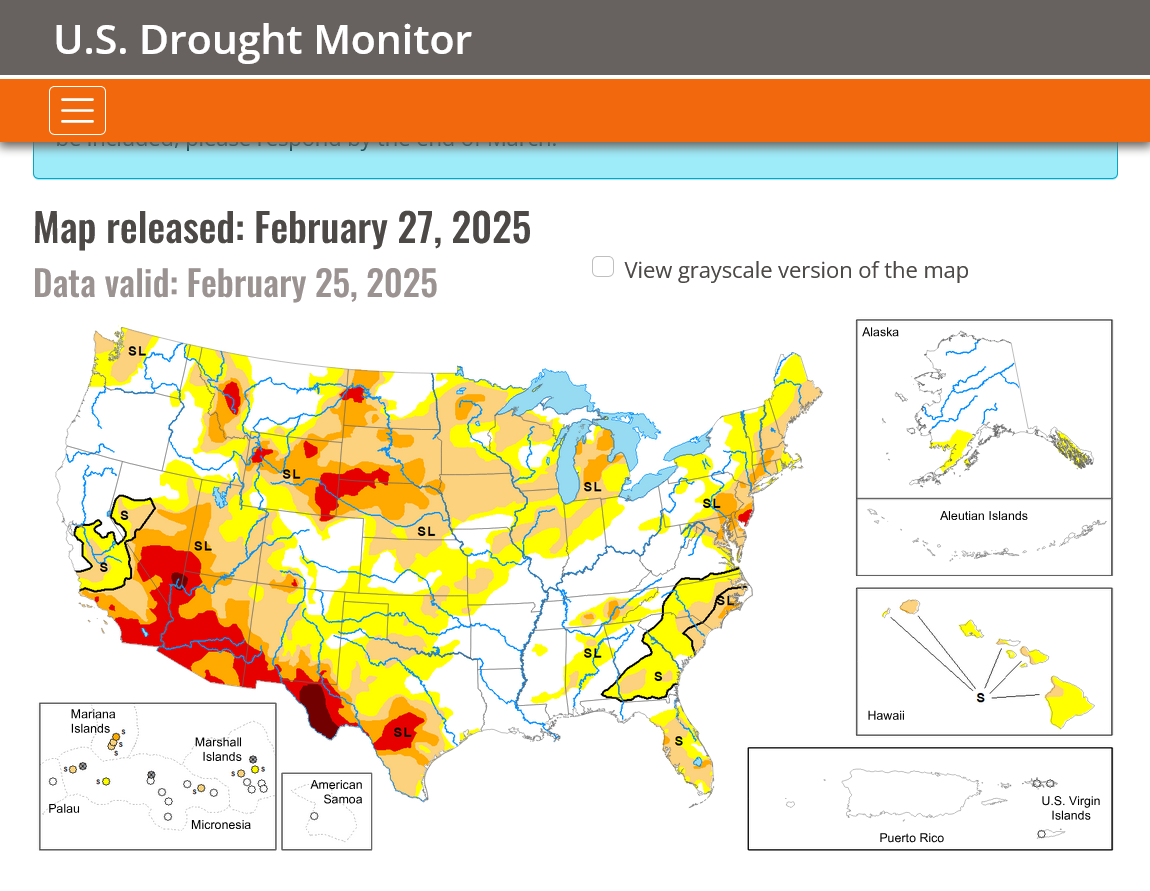
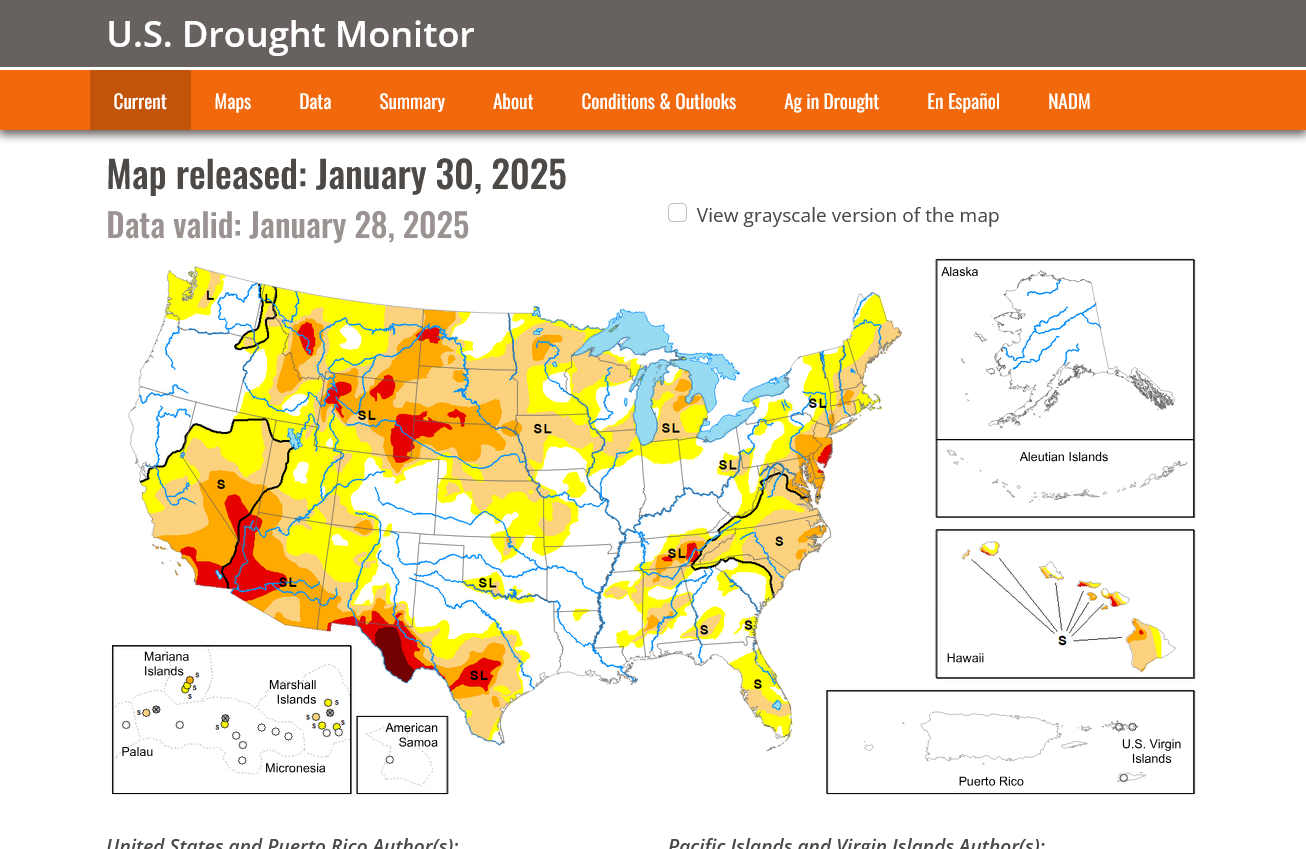
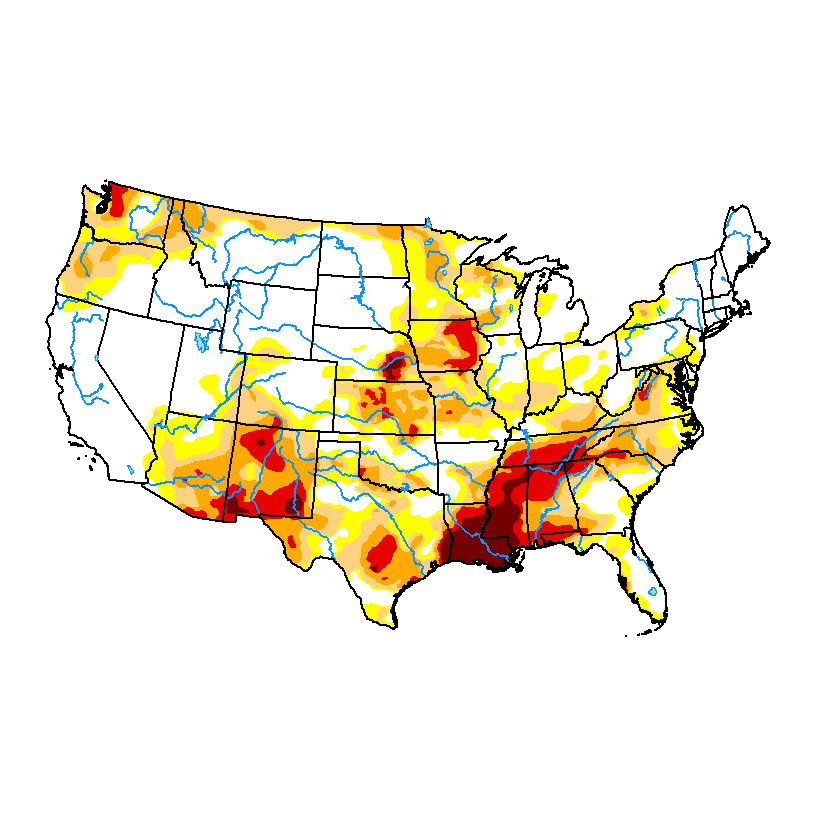
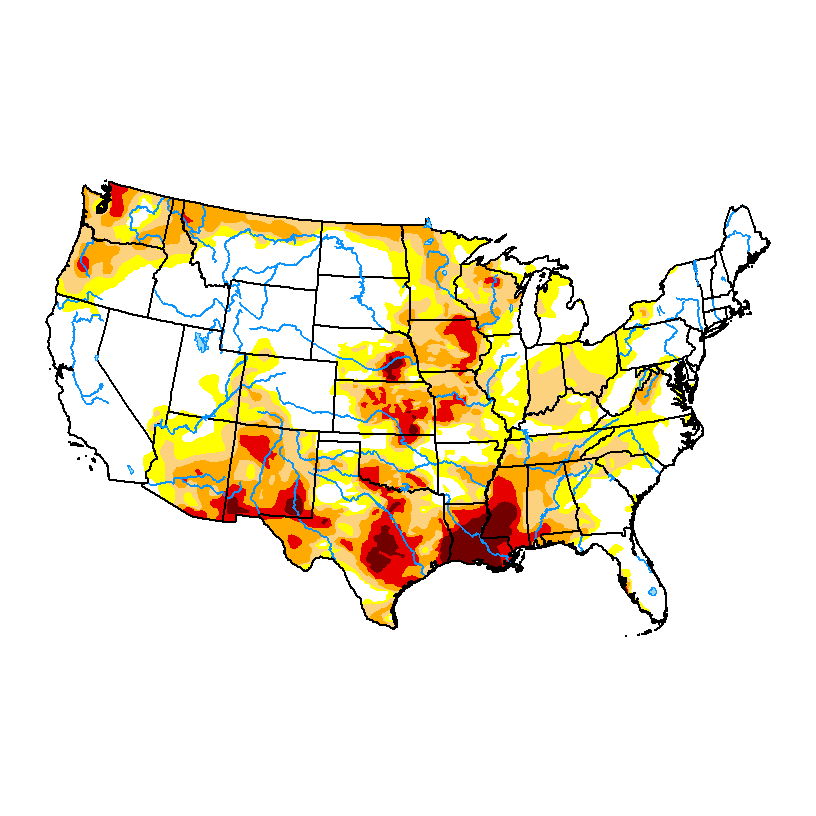
DROUGHT MONITOR
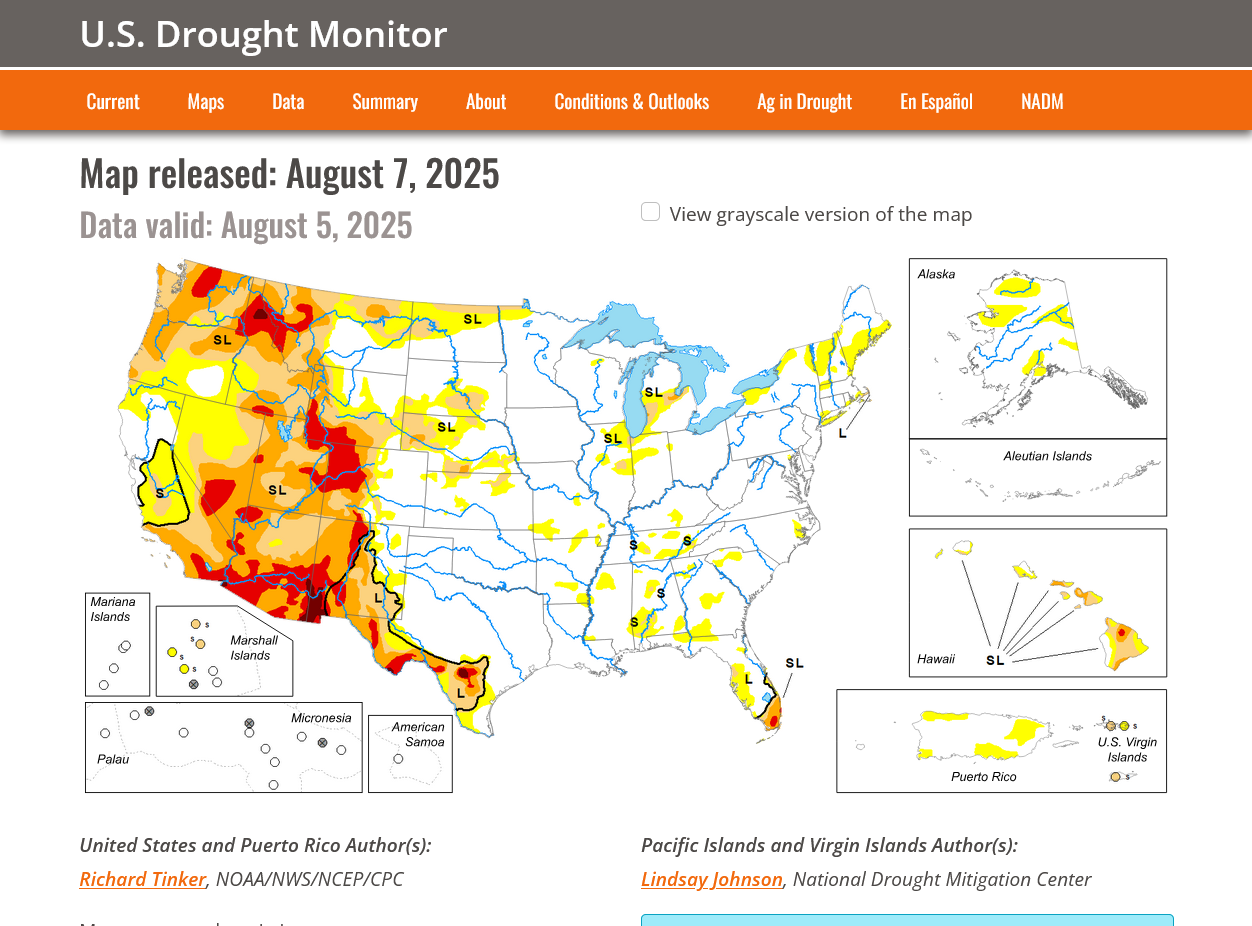
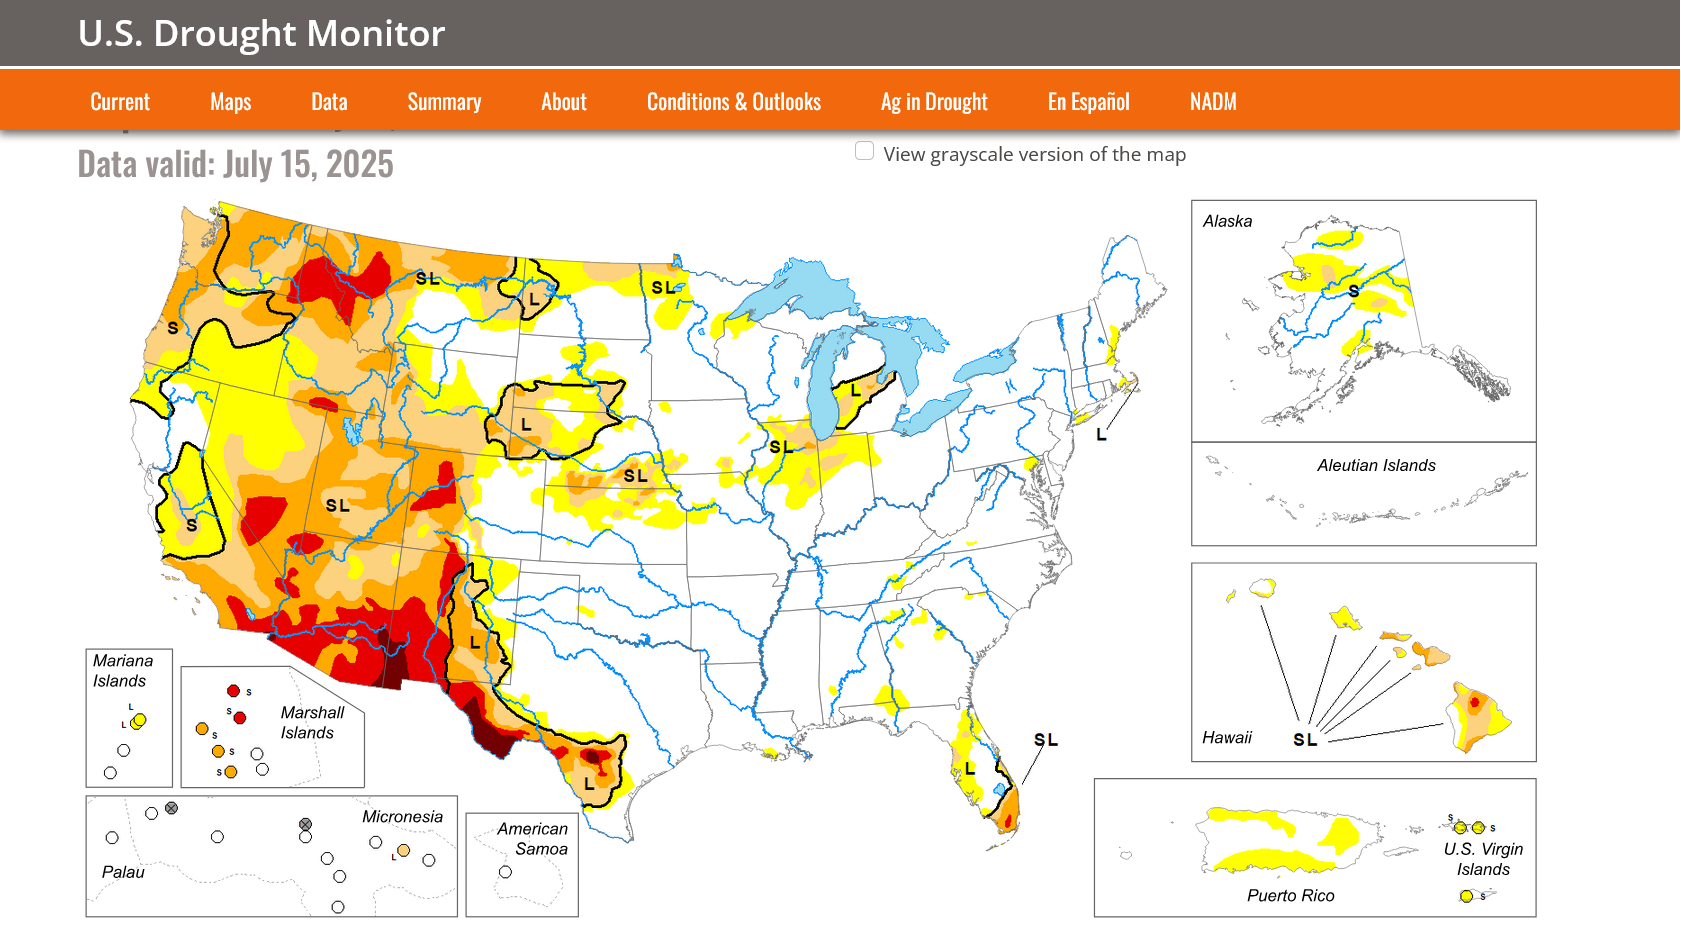
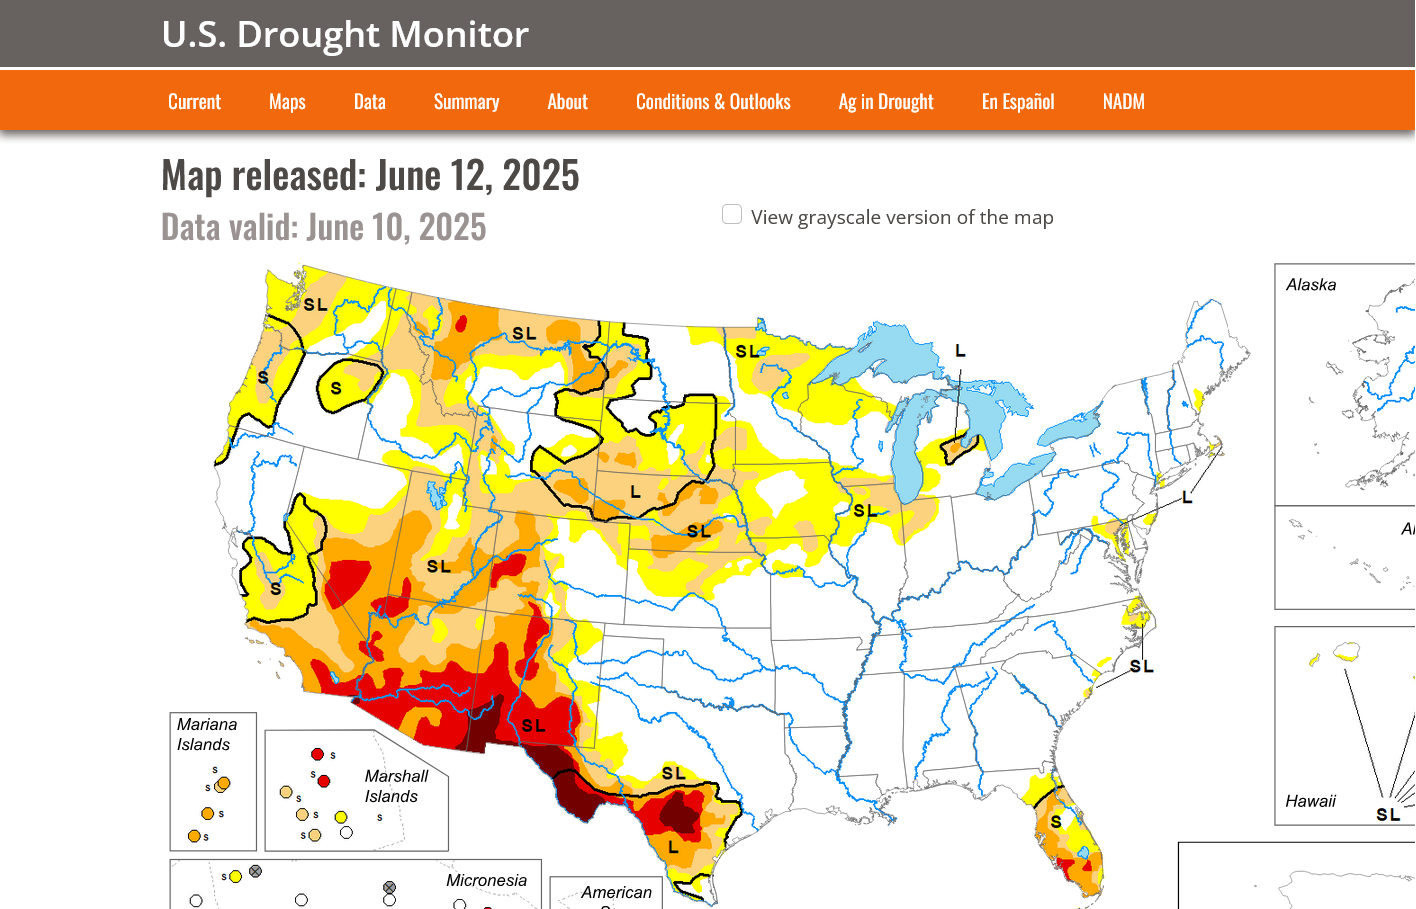
https://droughtmonitor.unl.edu/
Drought improved a great deal in the south the past month!
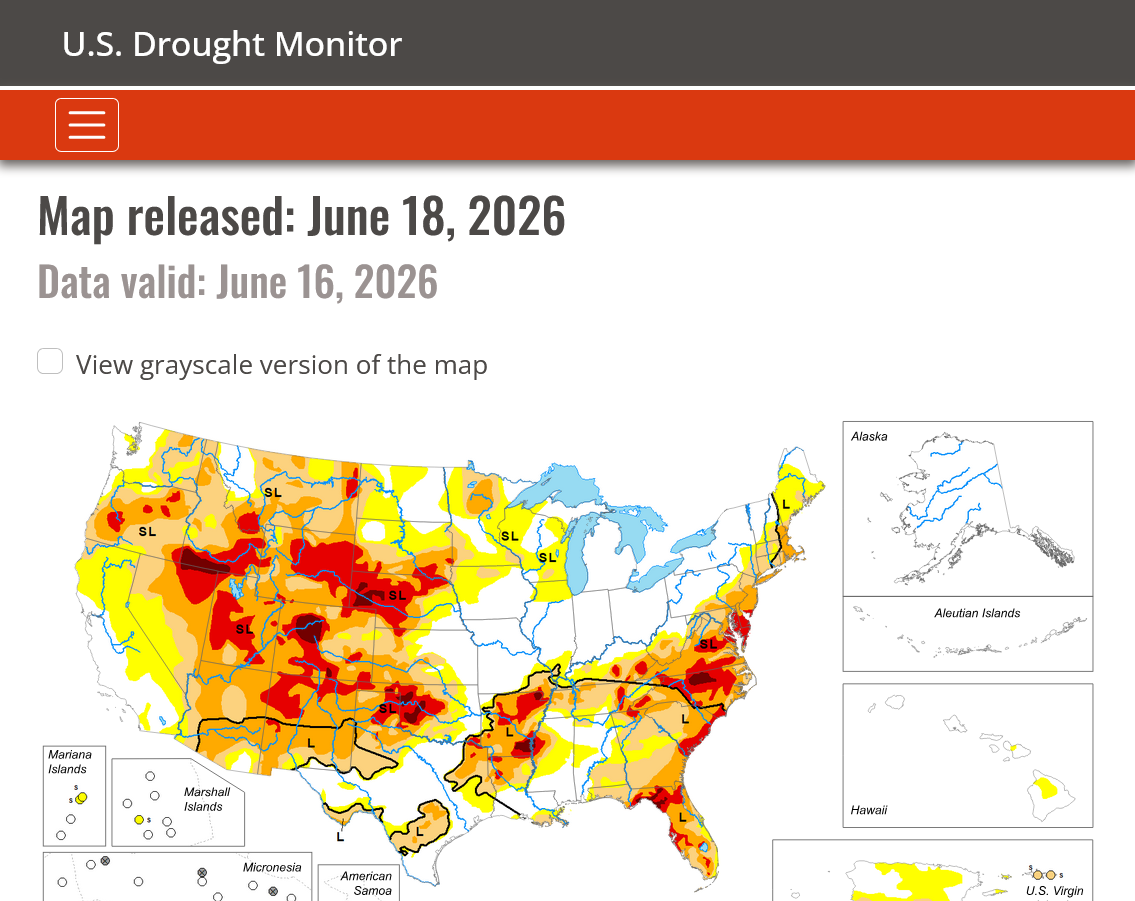
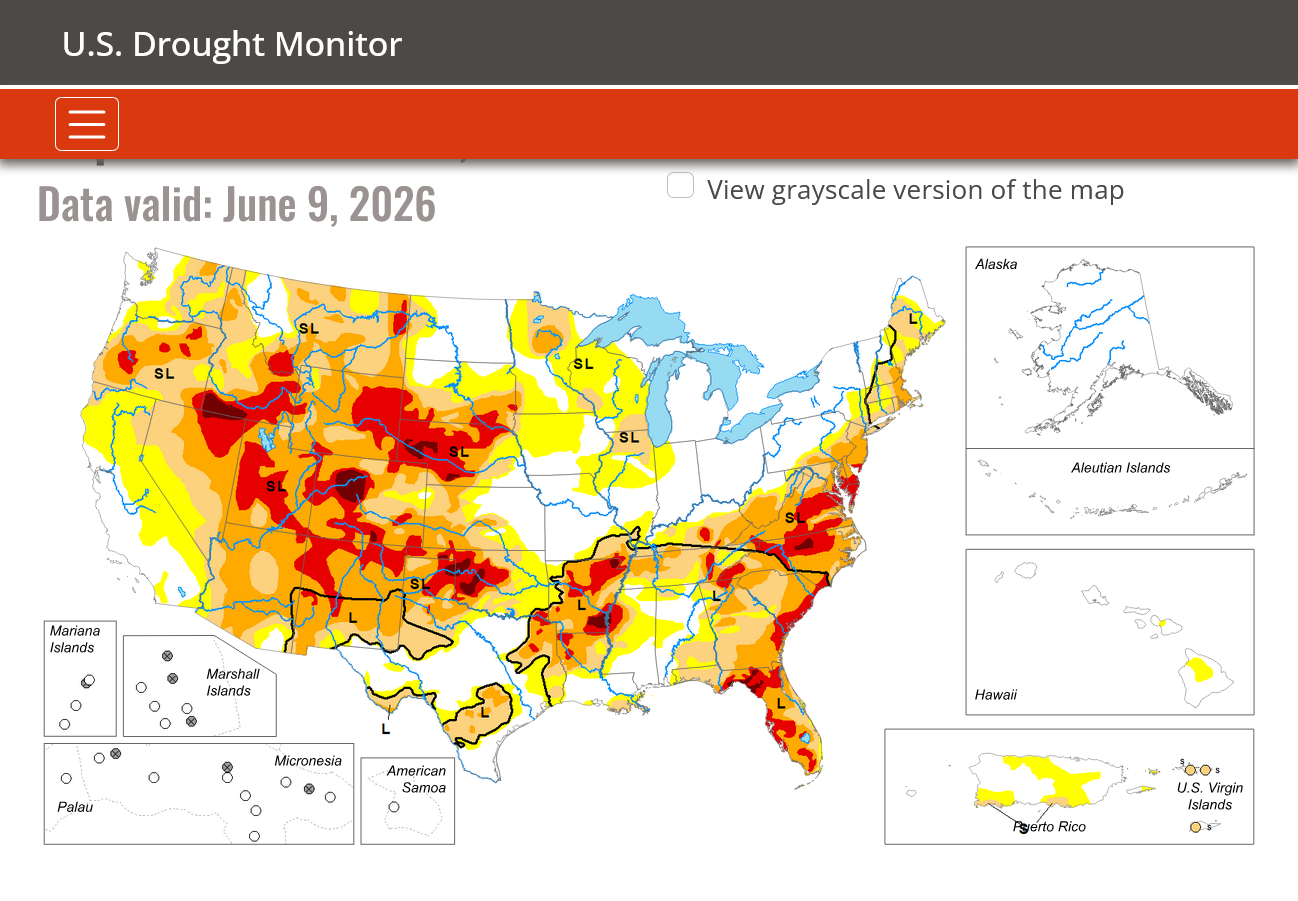
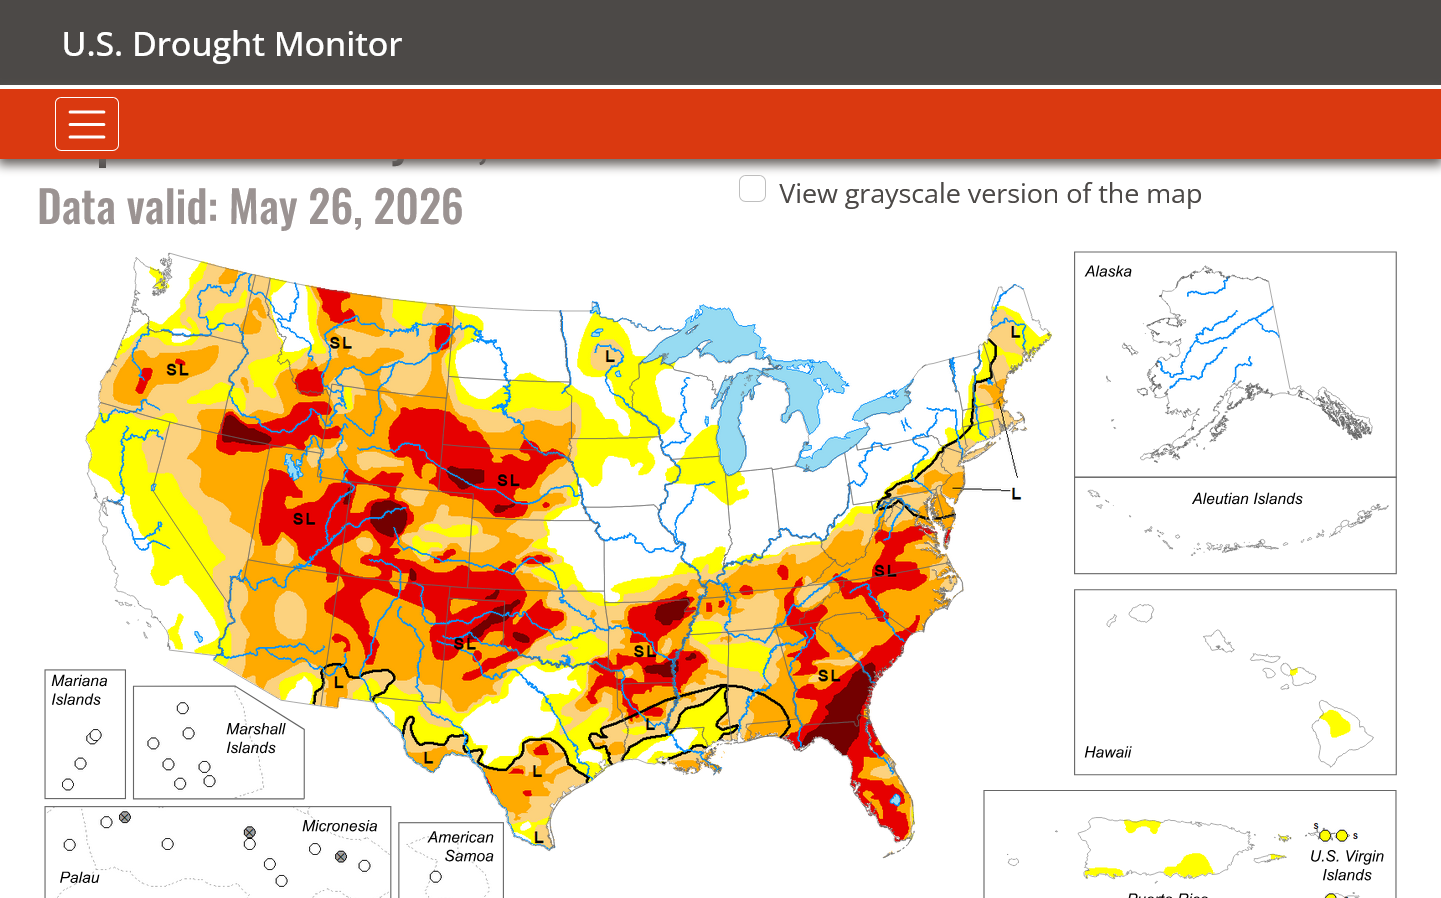
Drought gone in the Midwest. Much more rain needed elsewhere.
Drought expanding this Winter from Southern Plains, northeastward.
Drought out West has been improving from recent rains:
Drought ended along the Ohio River:
Flash Drought has worsened!
FLASH drought has spread rapidly!
FLASH DROUGHT!!
Drought area in the Cornbelt has been almost completely eliminated!!!
This is not much area in drought compared to many years and compared to earlier this year/last Fall. Scroll down to see the massive improvement! This is much less than predicted earlier this Spring!!!
Soil moisture replenished in the Eastern Cornbelt!

DECEMBER 17, 2024 BELOW:
November 26, 2024 below:
Drought reduction caused the Winter Wheat crop to improve 17 points, easily a new record!
https://www.marketforum.com/forum/topic/108473/#108781
November 5 below: Drought reduction in many places from S.Plains to Western Cornbelt!

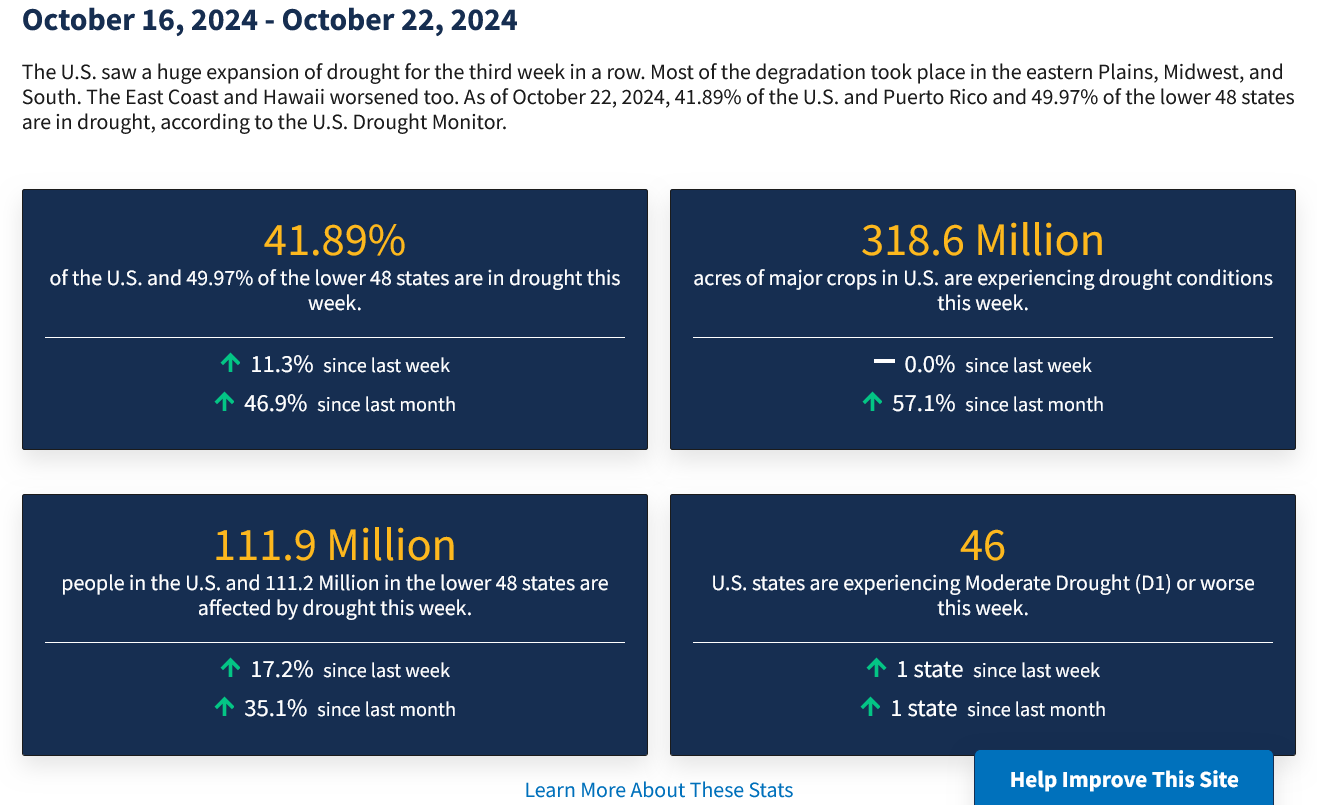
October 22 below:
Oct 8 below: Drought expanding, Plains/Upper Midwest!!!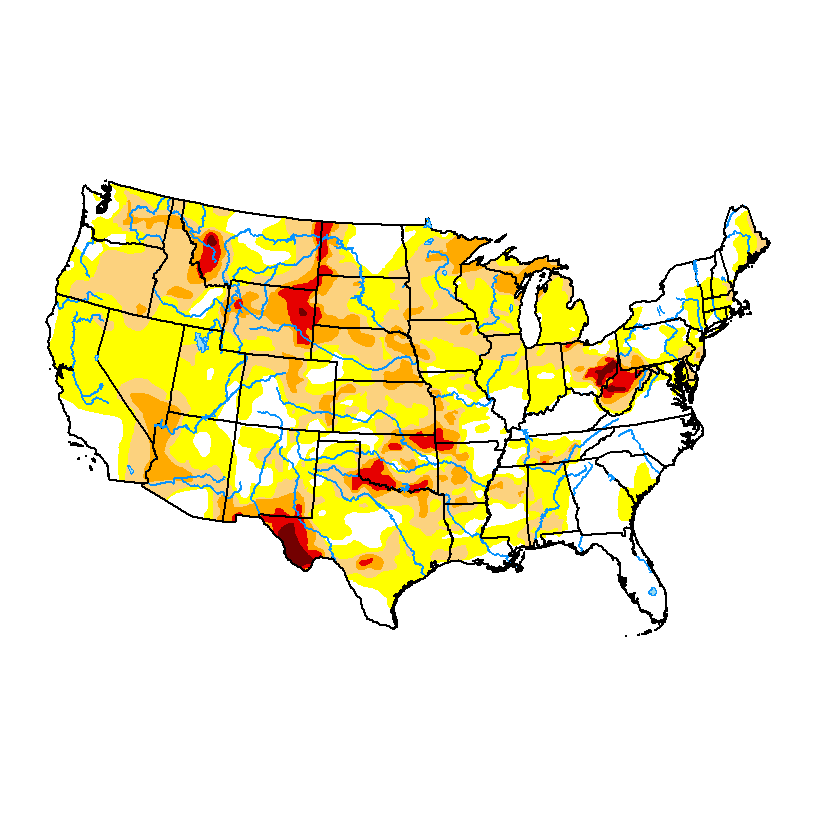 Karen Braun@kannbwx
Dryness has spread in the central USA over the last eight weeks. Some 66% of the Midwest (the most since mid-March) is now abnormally dry versus 13% in mid-July. Not sure that this has a huge impact on crop yields from here, but it is something to monitor.
Last map is from July 3, 2024
AS ON JUNE 26, 2024 below. FLASH DROUGHT! ECB and CCB. But some areas to get relief!
Last week as of June 17, 2024-FLASH DROUGHT DEVELOPING IN THE EASTERN CORNBELT BACK TO THE CENTRAL CORNBELT!!!

2 weeks earlier: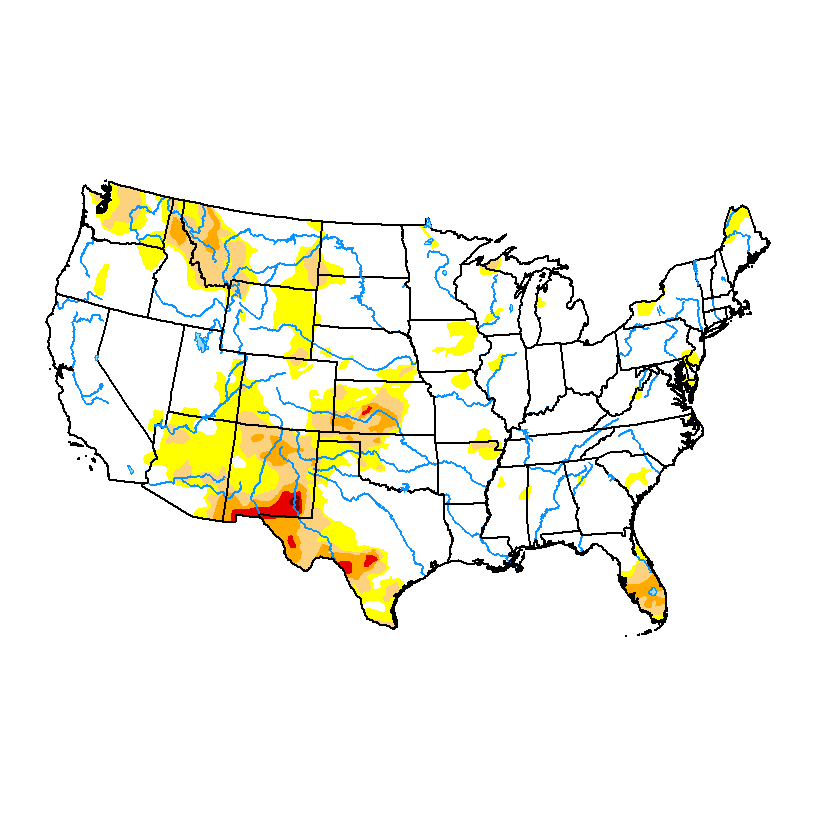
As of March 12, 2024: Drought in IA
January 30, 2024 below
DECEMBER 12, 2023 below
NOVEMBER 14, 2023
October 17, 2023
August, 2023, BELOW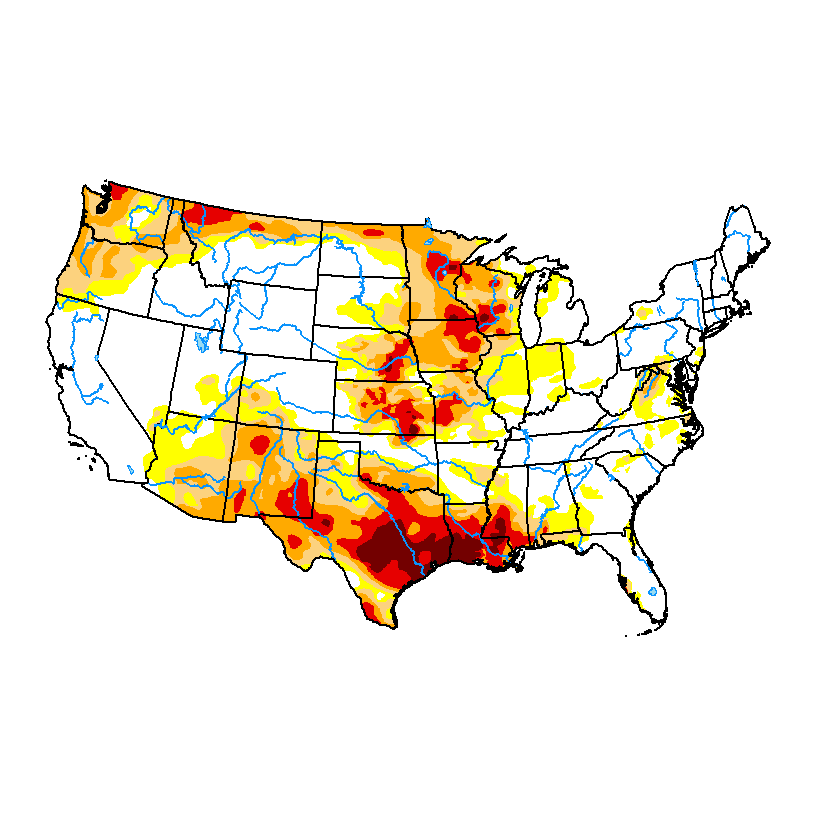
April 18, 2023-1 year ago:

DROUGHT MONITOR NOVEMBER 1, 2022-After a long lived La Nina-BEFORE EL NINO wiped out much of the drought OUT WEST the Winter of 2022/23!
Drought monitor previous years: You can see the natural La Niña, (cold water-in the tropical Pacific)causing the drought! Starting in 2020, then worsening for 2+ years!
Corn seed likes temperatures above 50 degrees for germination.
This map is updated daily(with previous days data).
https://mesonet.agron.iastate.edu/agclimate/soilt.php

https://www.pioneer.com/us/agronomy/soil_temp_corn_emergence.html
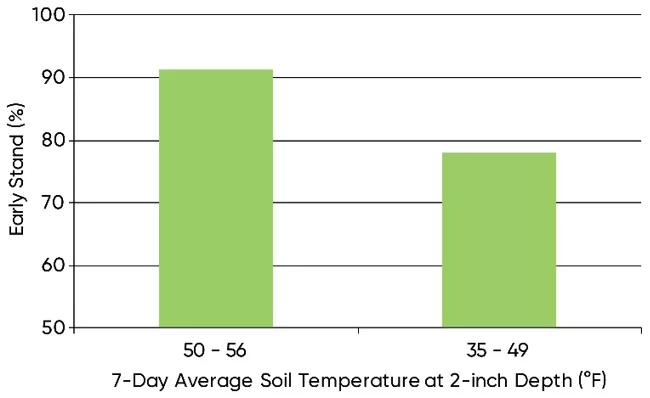
Figure 4. Relationship of soil temperature at planting depth (7-day average after planting) to final stand at stress emergence research locations in 2018.
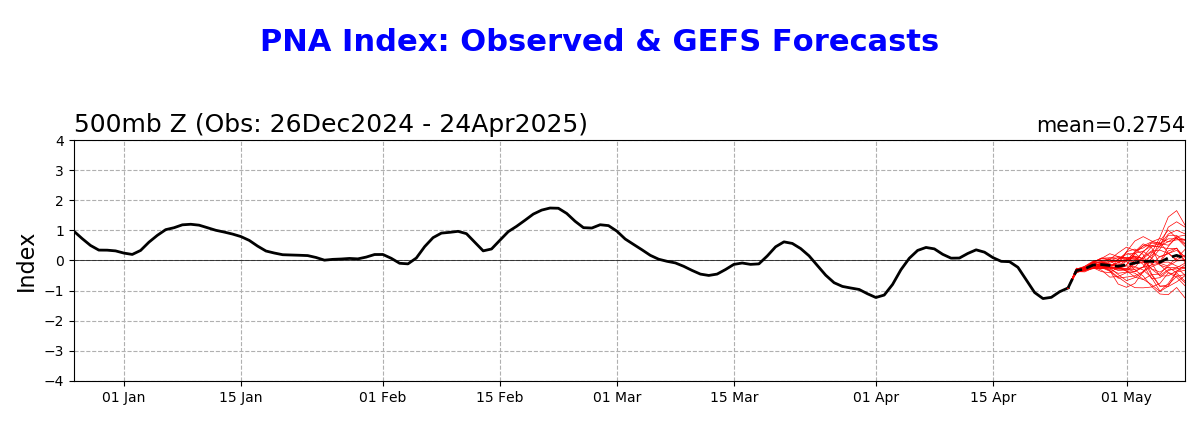
https://www.psl.noaa.gov/map/images/ens/ens.html#nh
NCEP Ensemble t = 360 hour forecast 
NCEP Ensemble t = 360 hour forecast 
Arctic Oscillation Index, North Atlantic Oscillation Index, Pacific North American Index.
https://www.cpc.ncep.noaa.gov/products/precip/CWlink/daily_ao_index/ao.shtml
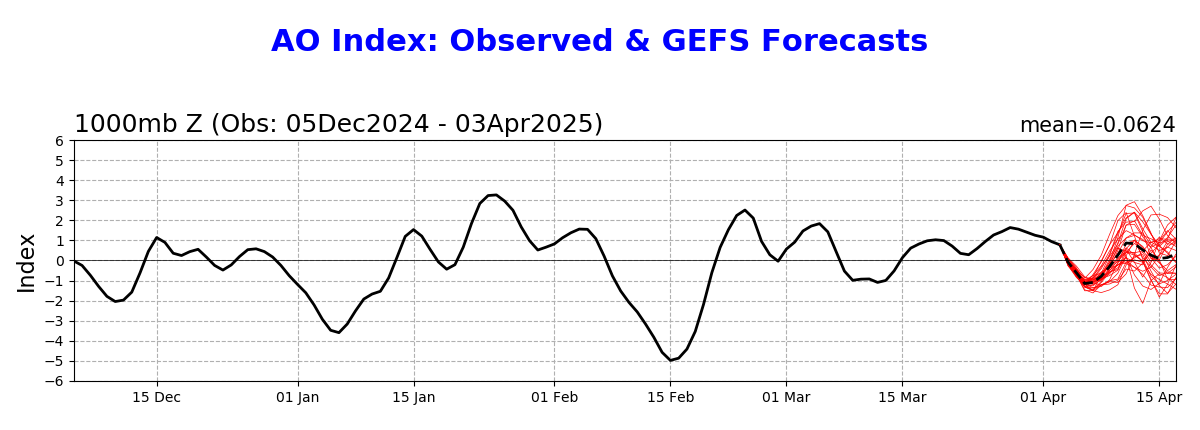
https://www.cpc.ncep.noaa.gov/products/precip/CWlink/pna/nao.shtml
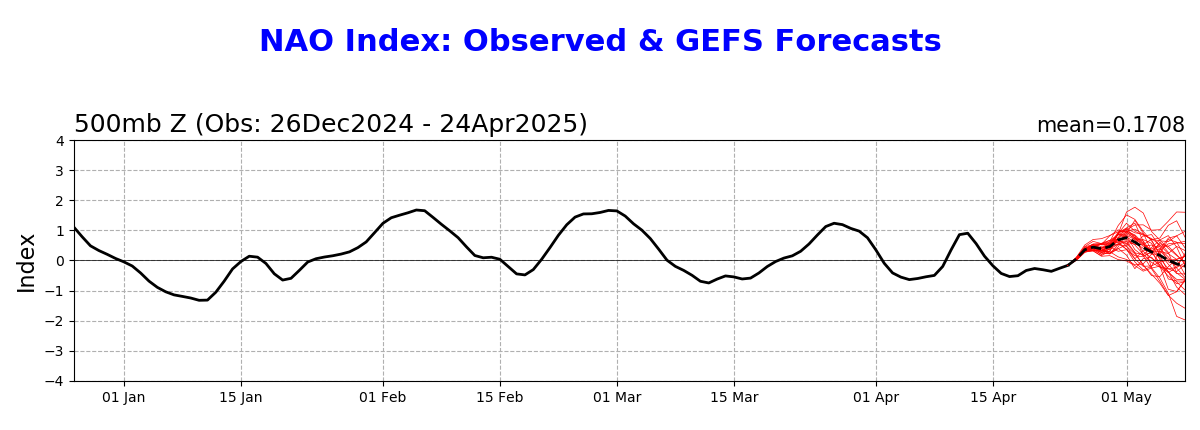
https://www.cpc.ncep.noaa.gov/products/precip/CWlink/pna/pna.shtml
Week 3-4 forecasts don't have a great deal of skill.
UPDATED LINK:
https://www.cpc.ncep.noaa.gov/products/CFSv2/weekly/
Temperatures below. These maps are 1 day old.

Precip below..

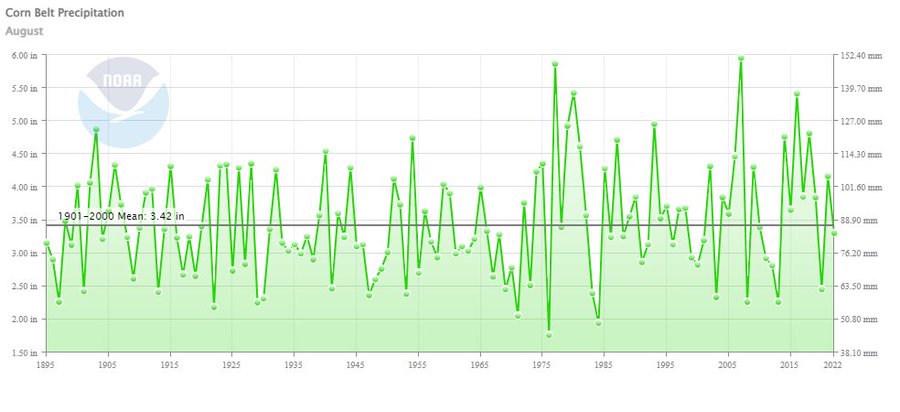
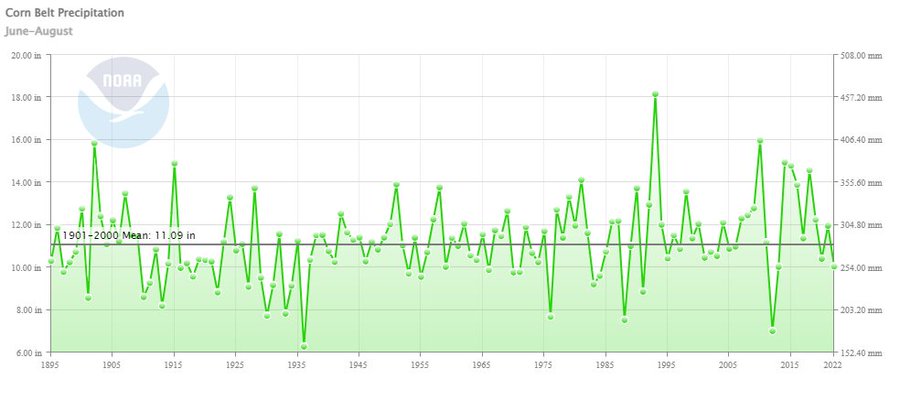
Corn Belt (productivity weighted) rainfall rain 0.11" below normal in August and 1.03" below normal for the summer (driest summer since 2013)
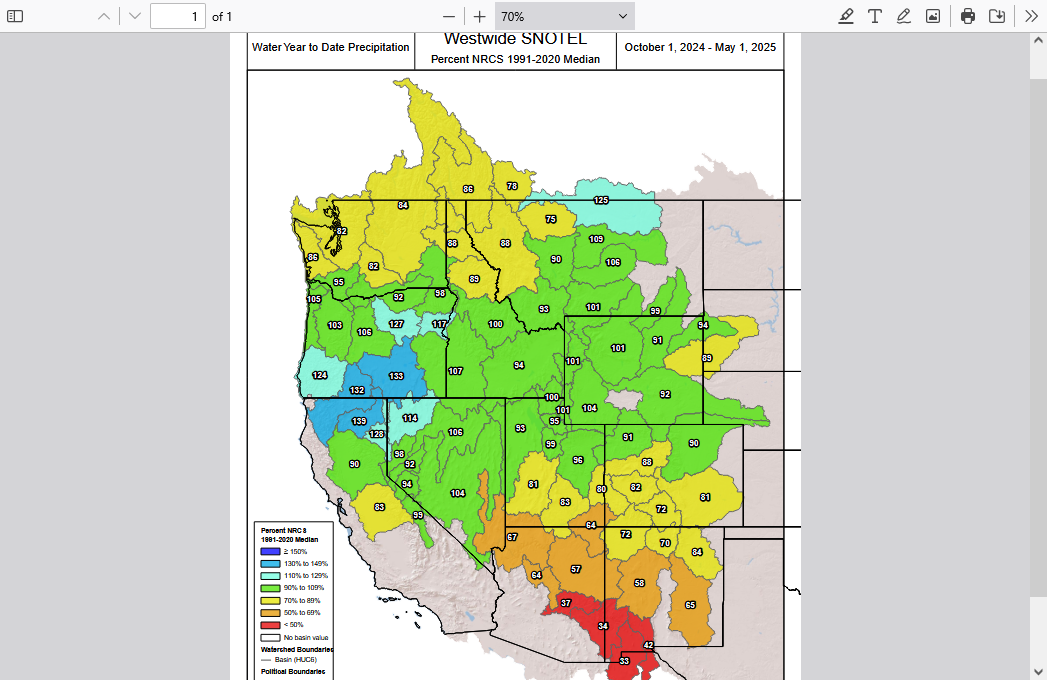
More welcome rain/snow to help completely eradicate the drought in some places out West.
https://www.marketforum.com/forum/topic/83844/
Funny how NO news/media are describing it that way.
https://droughtmonitor.unl.edu/Maps/CompareTwoWeeks.aspx

On the other side, that contradicts the truth, those sensationalizing to generate ratings and sell newspapers know that good news doesn't sell.
Officials warned of inundated streets, overflowing rivers and more snow in the mountains. The National Weather Service issued a rare “high risk” warning for the Central Coast.
https://www.nytimes.com/2023/03/09/us/california-weather-rain-storm-flood.html
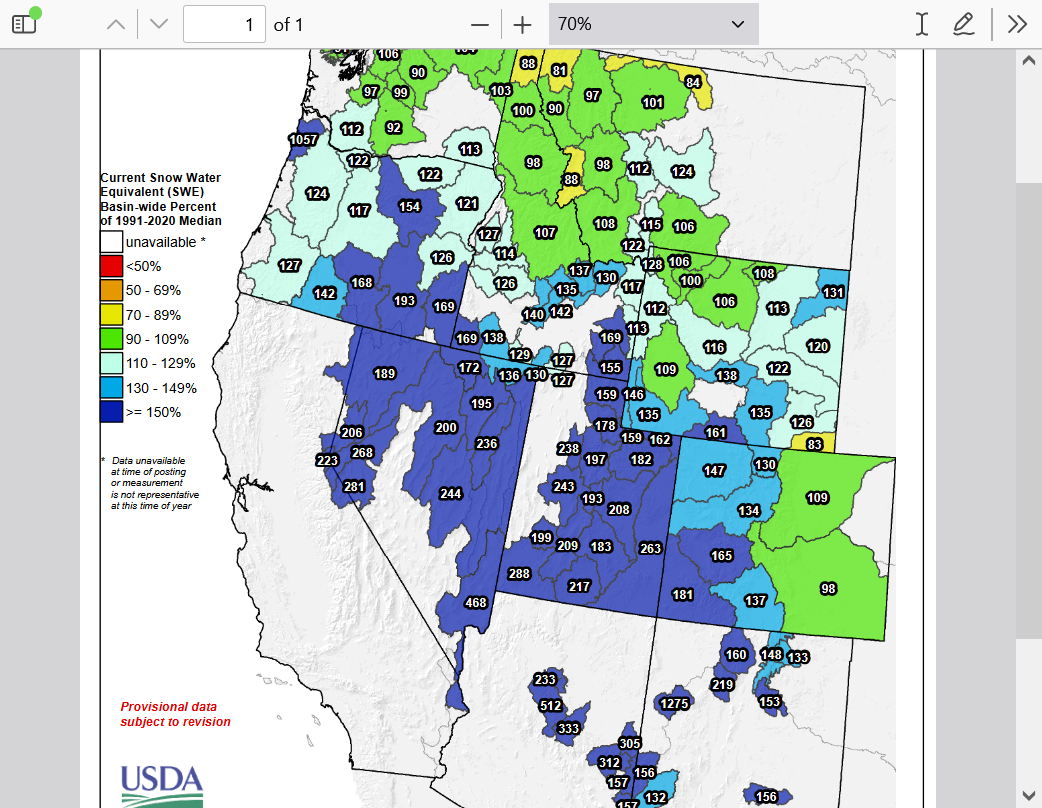
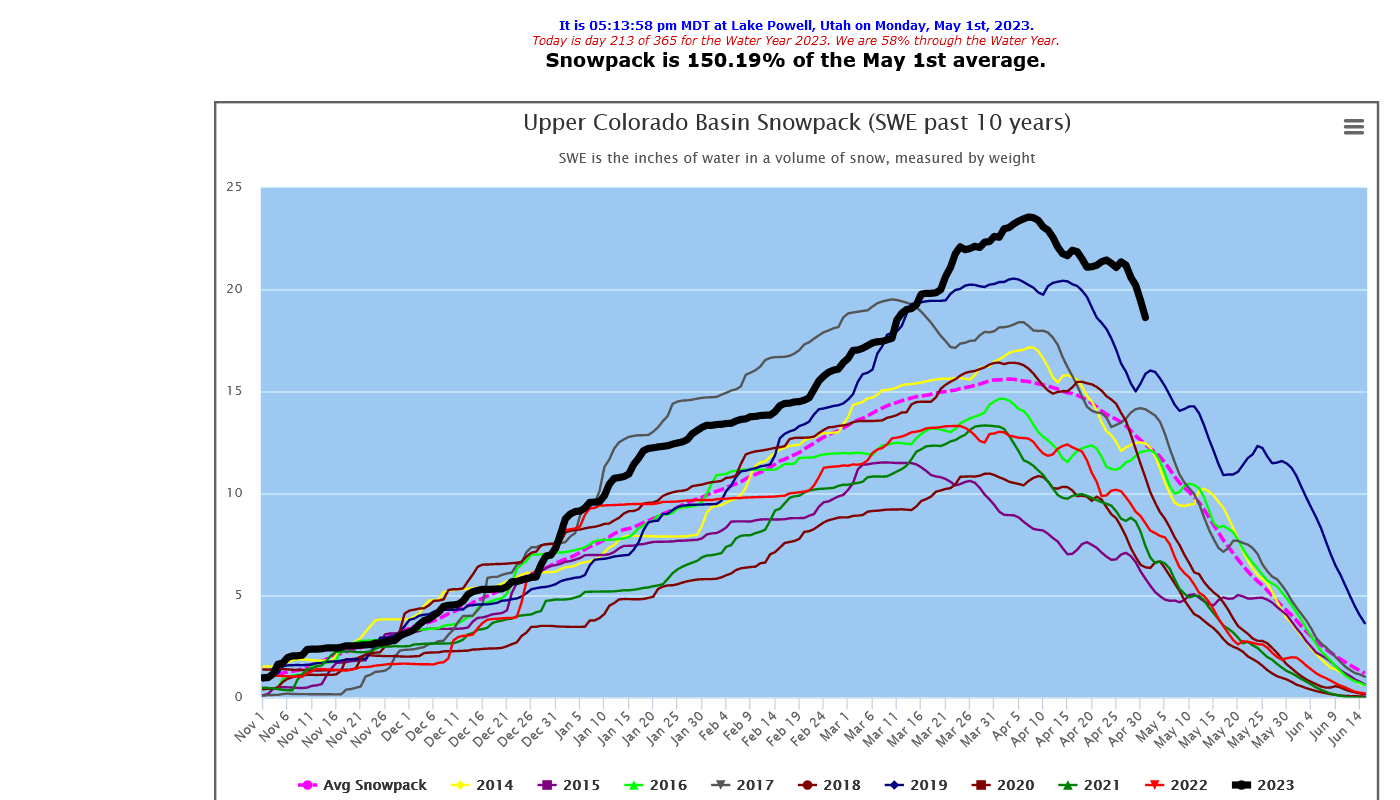
Highest snow pack in the last 10 years for the Southwest with more on the way.
This is astounding and just what the drought doctor ordered!
Why only reporting on how extreme and bad this is by media?
That doesn't sell!
This is mainly thanks to the global warming pattern/El Nino kicking in again in the Pacific after the pause caused by the La Nina(cold water in the tropical Pacific) which caused the drought....is over!
Climate change INCREASES precip!
https://www.wcc.nrcs.usda.gov/ftpref/data/water/wcs/gis/maps/west_swepctnormal_update.pdf
Thanks, Jean!
I remember talking with Jim Roemer a few times back in the early/mid 90's when he was part of the Freese-Notis, Trade-Winds commodity weather advising service. Craig Solberg too. I was mega impressed with their knowledge of how the weather impacted ag and energy markets, which was what I was making a killing doing in the 1990's from the get go.
This was before the internet and I had a satellite dish on the roof getting the weather information the same time the NWS did. Big funds used meteorologists that would take some time to update forecasts, then pass it on and I was already in before the market dialed in the updated forecast.
There were no algorithms jerking the markets around and they reacted much more predictably.
Today, they have in house models that are sometimes a few minutes faster than anything that I get.
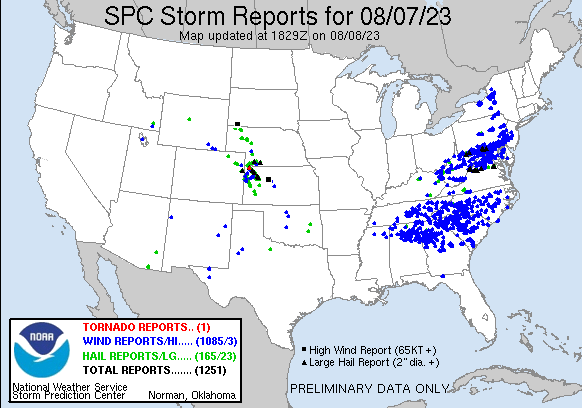
Over 1,000 severe storm reports yesterday/8-7-23
https://www.marketforum.com/forum/topic/98002/#98044
This is incredible for August which is NOT severe weather season!!! Just 1 weak tornado in KS.
Yesterday's Storm Reports (20230807 1200 UTC - 20230808 1159 UTC) (Print Version)
| < 230806 Reports 230808 Reports > |
| Note: All Reports Are Considered Preliminary |
https://www.spc.noaa.gov/climo/reports/yesterday.html
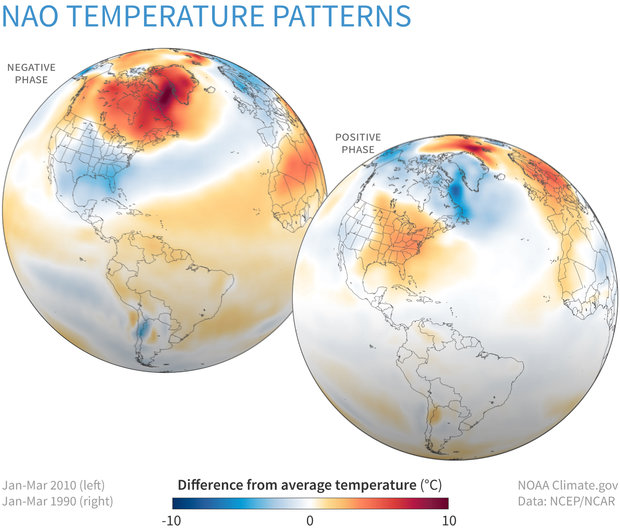
As long as the NAO stays this positive, cold air will find it very difficult to penetrate very far south and to stay very long!
https://www.cpc.ncep.noaa.gov/products/precip/CWlink/pna/nao.shtml
++++++++++++++++++
Major Sudden Strat. Warming: chance increasing in early Jan
Started by WxFollower - Dec. 20, 2023, 9:19 p.m.
https://www.marketforum.com/forum/topic/101402/
Although the models were milder overnight, the Greenland block type anomaly in 2 weeks suggests a very solid cold air connection by mid January.
https://www.marketforum.com/forum/topic/101402/#101515
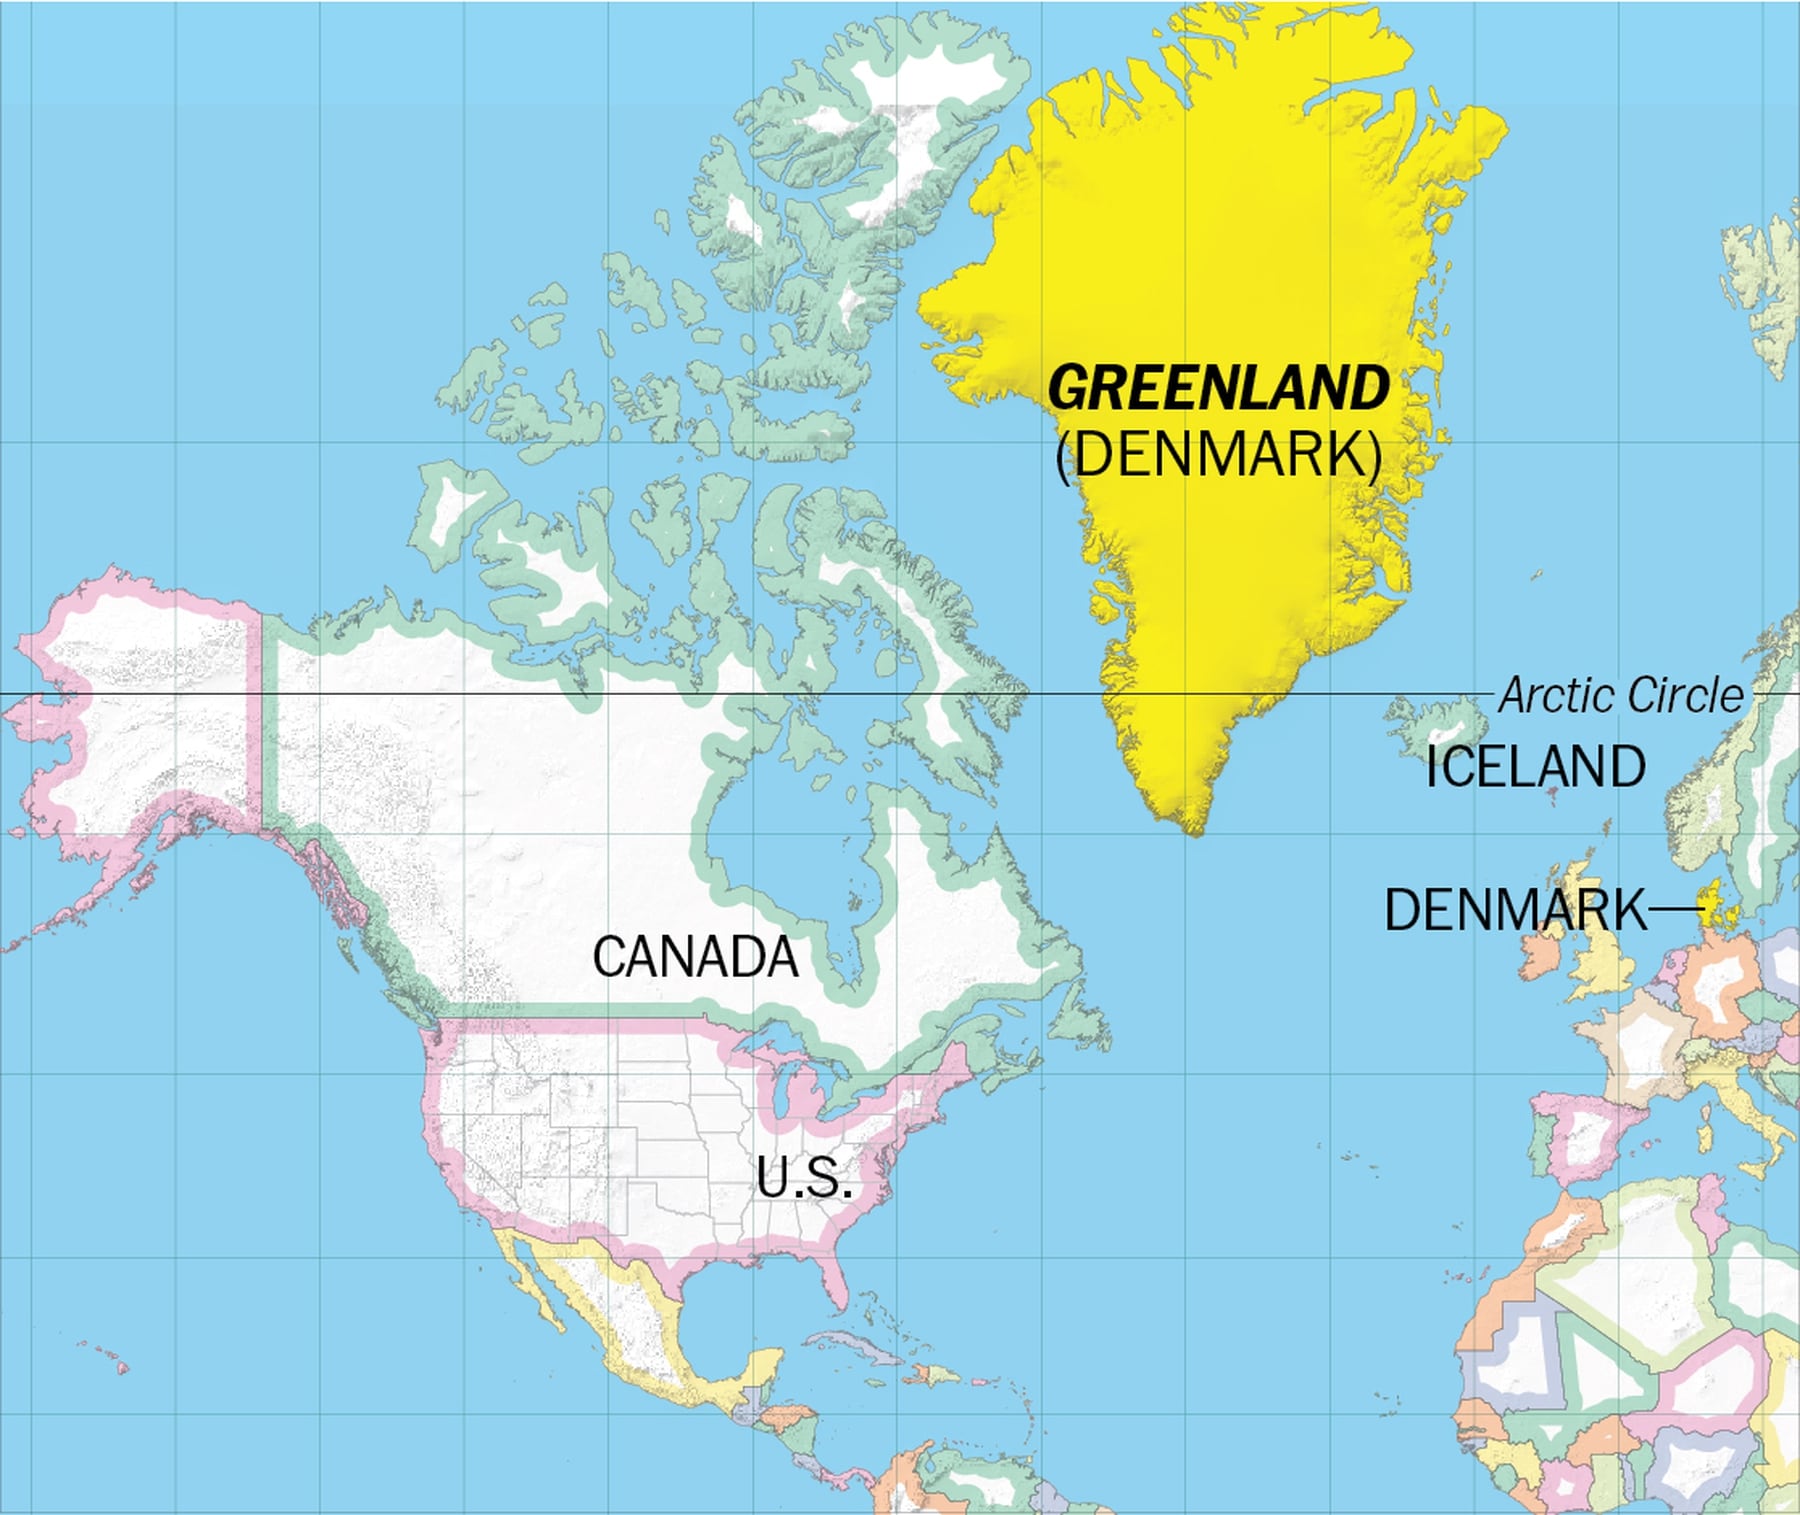
Supporting that is the NEGATIVE AO and NAO.
The much colder outlook described in late December continues to play out in the forecast:
https://www.marketforum.com/forum/topic/100525/#101558
Snow event 1-6-2024
Started by metmike - Jan. 2, 2024, 1:21 p.m.
We're focusing on the specific metrics of the extreme weather in this pattern here:
Winter Storms/COLD week of 1-7-24+
Started by metmike - Jan. 7, 2024, 9:57 p.m.
https://www.marketforum.com/forum/topic/101628/
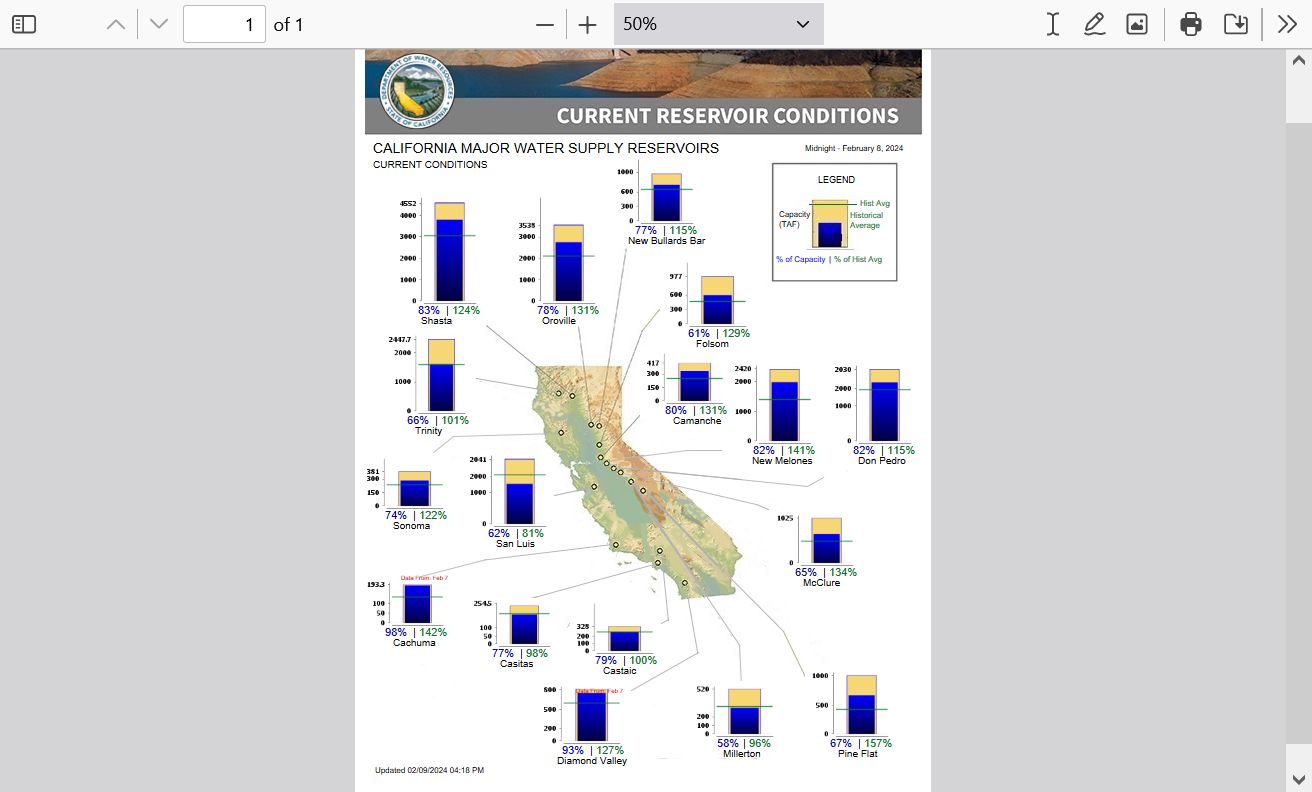
Millions in California face historic rain
Started by metmike - Feb. 5, 2024, 5:04 p.m.
https://www.marketforum.com/forum/topic/102099/
https://www.marketforum.com/forum/topic/102099/#102176
Outside of the fairly localized extreme event in the high population, Los Angeles area almost a week ago, these atmospheric river events from the Natural El Nino have blessed California with wonderful beneficial rains.
Most places will gladly take a bit more of the exact same events(absent the tiny % of area with the extreme rains) with only a very tiny reservoir close to capacity.
https://cdec.water.ca.gov/resapp/RescondMain
+++++++++++++
Early planting issues 3-20-24
12 responses |
Started by metmike - March 20, 2024, 12:22 p.m.
Tracking an early April snowstorm in the Northeast:
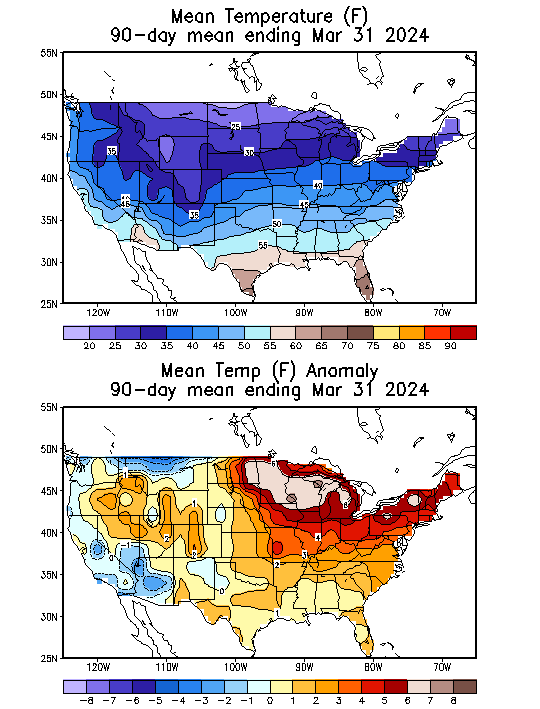
Historic -NAO intensity coming Mar 31 through early April
Started by WxFollower - March 29, 2024, 4:41 p.m.
Stormy weather April 1-5, 2024
14 responses |
Started by metmike - April 1, 2024, 6:34 p.m.
Total Solar Eclipse Day-April 8, 2024!!
16 responses |
Started by metmike - April 5, 2024, 3:38 p.m.
Severe wx week of 4-14-24
Started by metmike - April 13, 2024, 1:26 p.m.
Re: Re: UAH March-global temperature
By metmike - April 14, 2024, 3:01 p.m.
Temperatures this past Winter:
90 day periods-going backward
1. Jan-Feb-Mar
2. Dec-Jan-Feb
3. Nov-Dec-Jan
++++++++++
30 day periods-going forward
4. Nov 2023
5. Dec 2023
6. Jan 2024-only month to feature major cold
7. Feb 2024
8. March 2024
https://www.cpc.ncep.noaa.gov/products/tanal/temp_analyses.php
90 day periods
+++++++++++++++++++++++++++++++++++++++++++++++++++++++
30 day periods
Severe weather May 6-7, 2024+
https://www.marketforum.com/forum/topic/103789/
UPDATED:
Severe weather #2 May 7-8, 2024
https://www.marketforum.com/forum/topic/103838/
Weather Effects on Expected
Corn and Soybean Yields
https://www.ers.usda.gov/webdocs/outlooks/36651/39297_fds-13g-01.pdf?v=884.4
Flash Flood Emergency In South Florida
IN THE '70 ERA, WHILE I LIVING IN W.P.B. FL. ~ IT WAS A BIBLICAL RAIN EVENT. IT RAINED EVERY DAY, FOR 40 DAYS. THE ALLIGATORS WERE BEING TAKEN OFF THE HIGHWAYS... I HAD WALKING CATFISH IN MY CARPORT, BUT... THE SADDEST THING? THE CATTLE!! THEY WERE STUCK IN THE PASTURES!! SHARPSHOOTERS IN HELICOPTERS SHOT THEM... THERE WAS NO VIABLE WAY TO RESCUE THEM! UGH!!
NATURE CAN BE HORRIDLY CRUEL
There they go again in blaming climate change again for this fake "1 in 1,000 year" event.
Almost 4 inches of rain in 1 hour. An all time record for the amount of rain in just an hour............FOR THIS CITY.
Yes, that's a lot of rain and warmer global temperatures probably contributed at least +7% to that total but its not even close to a record for the United States.
Not even in the top 10. Probably in the top 100.
I'll start a new thread just on this tomorrow to show how absurd it is to call this a 1 in 1,000 year event.
++++++++++++
It really boils down to this, once again(Cliff Mass can be counted on as an elite source for using objective, authentic science)
https://cliffmass.blogspot.com/2016/03/the-golden-rule-of-climate-extremes.html
The GoldenRule
Considering the substantial confusion in the media about this critical issue, let me provide the GOLDENRULE OF CLIMATE EXTREMES. Here it is:
The more extreme a climate or weather record is, the greater the contribution of natural variability.
Or to put it a different way, the larger or more unusual an extreme, the higher proportion of the extreme is due to natural variability.
+++++++++++
These people cherry pick every extreme, as if there were no extremes in the past and tie them to climate change.
Another 1 in 1,000 year rain
Started by metmike - April 14, 2023, 2:55 p.m.
https://www.marketforum.com/forum/topic/94542/
FLASH DROUGHT COMING TO THE ECB AS I FEARED the last week+ and the NWS is picking up on.
https://www.cpc.ncep.noaa.gov/products/predictions/threats/threats.php
Thanks, Jim!
Latest weather updates here:
By metmike - June 20, 2024, 1:31 p.m.
Re: Re: Re: Grains May 28, 2024+
By metmike - June 21, 2024, 9:30 a.m.
Rainfall the last 72 hours.
Sorry you barely missed, cutworm )-:
It especially hurts when a rain event completely falls apart at your doorstep.
https://www.iweathernet.com/total-rainfall-map-24-hours-to-72-hours
Soon to be Hurricane Debby:
https://www.marketforum.com/forum/topic/106248/
https://www.youtube.com/watch?v=lubAmvimx-g
metmike: La Nina Winter!
New site/link for you (thanks, Eric):
U.S. Agricultural Commodities in Drought
| Commodity | % Area Affected by Drought |
|---|---|
| Barley production | 35 |
| Corn production | 6 |
| Cotton production | 22 |
| Durum Wheat production | 39 |
| Peanut production | 2 |
| Rice production | 2 |
| Sorghum production | 36 |
| Soybean production | 6 |
| Spring Wheat production | 21 |
| Sugarbeet production | 10 |
| Sugarcane production | 0 |
| Sunflower production | 7 |
| Winter Wheat production | 43 |
Thanks much, cutworm!
Yields WILL be dropping in the ECB and vicinity the next 2 weeks. This was total rain for the next 2 weeks from the just out 12 GEFS. Crop condition reports in early September will deteriorate a couple %, maybe a bit more.
NOT good for the last few weeks of pod filling for beans.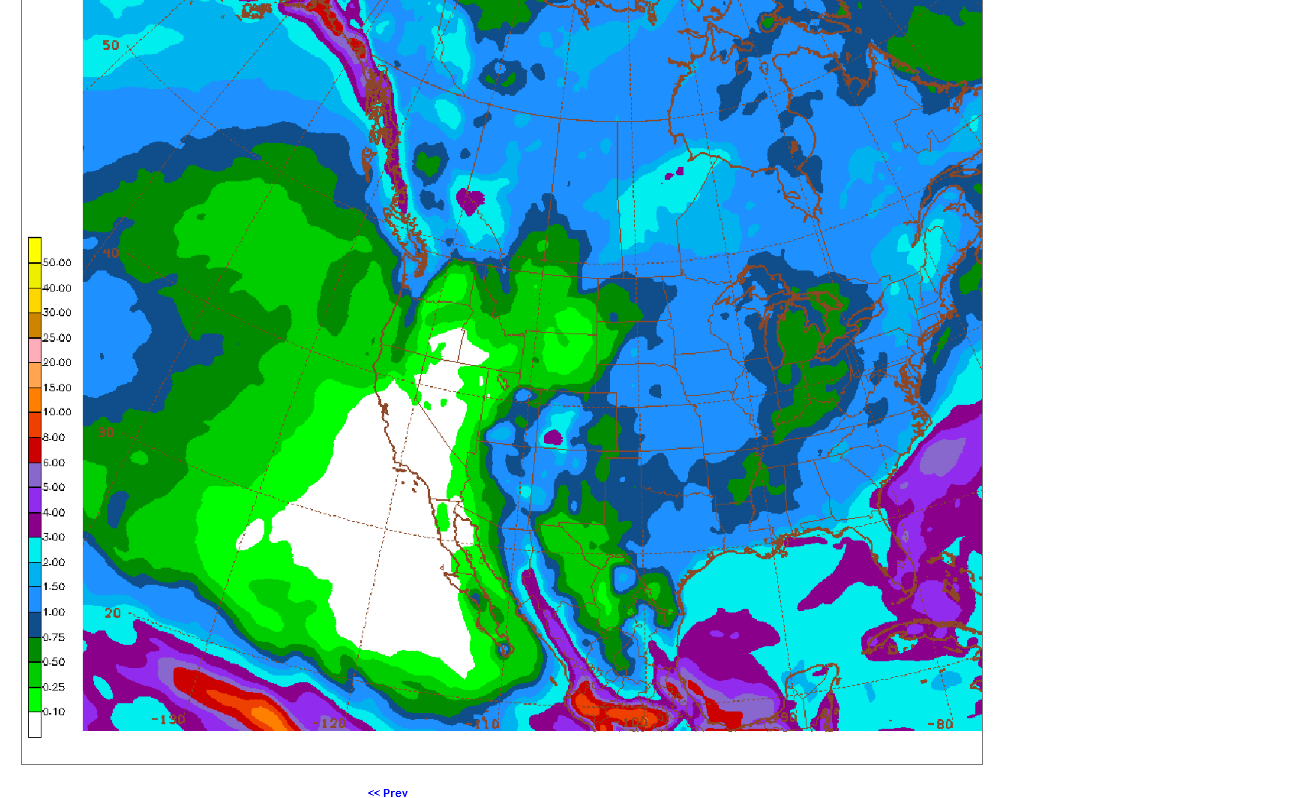
++++++++++++++++++++++++++++++++++++
8-31-24
Great discussion on the impact of weather on the current soybean crop here:
Beans
48 responses |
Started by baker - Aug. 8, 2024, 7:36 p.m.
After 29 days of NO RAIN here in Evansville, watching a nice rain event unfold SOUTH of here this afternoon is painful!
https://radar.weather.gov/station/kvwx/standard
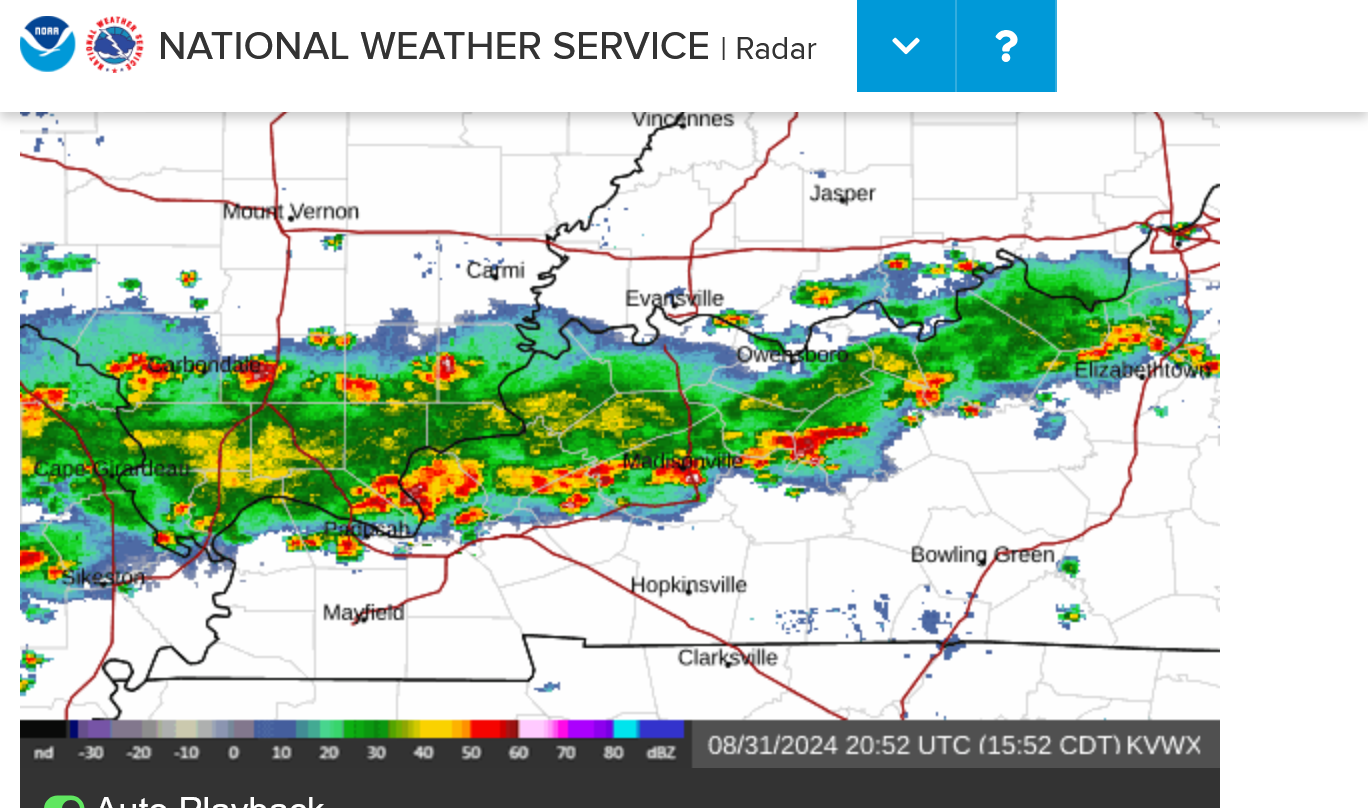
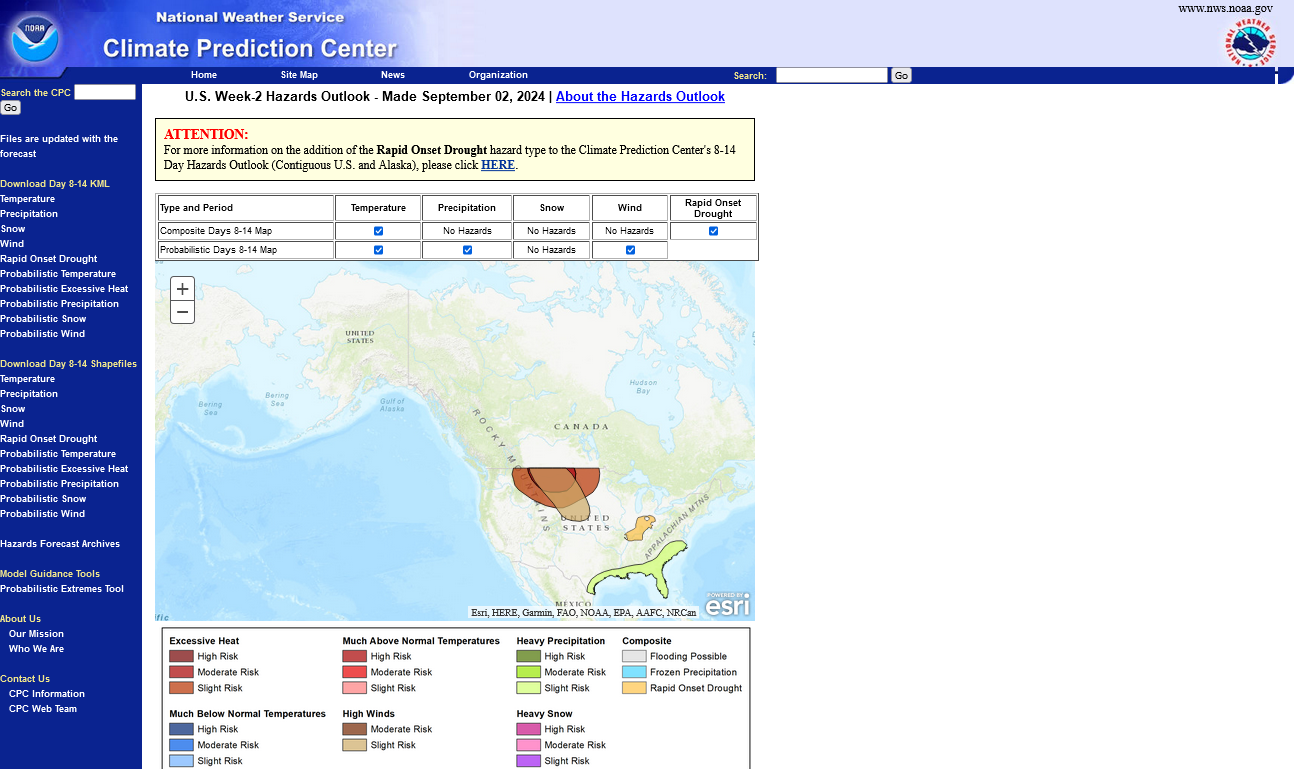
The NWS has rapid onset of drought in the 8-14 day outlook but we ALREADY HAVE A FLASH DROUGHT in southern IN!
https://www.cpc.ncep.noaa.gov/products/predictions/threats/threats.php
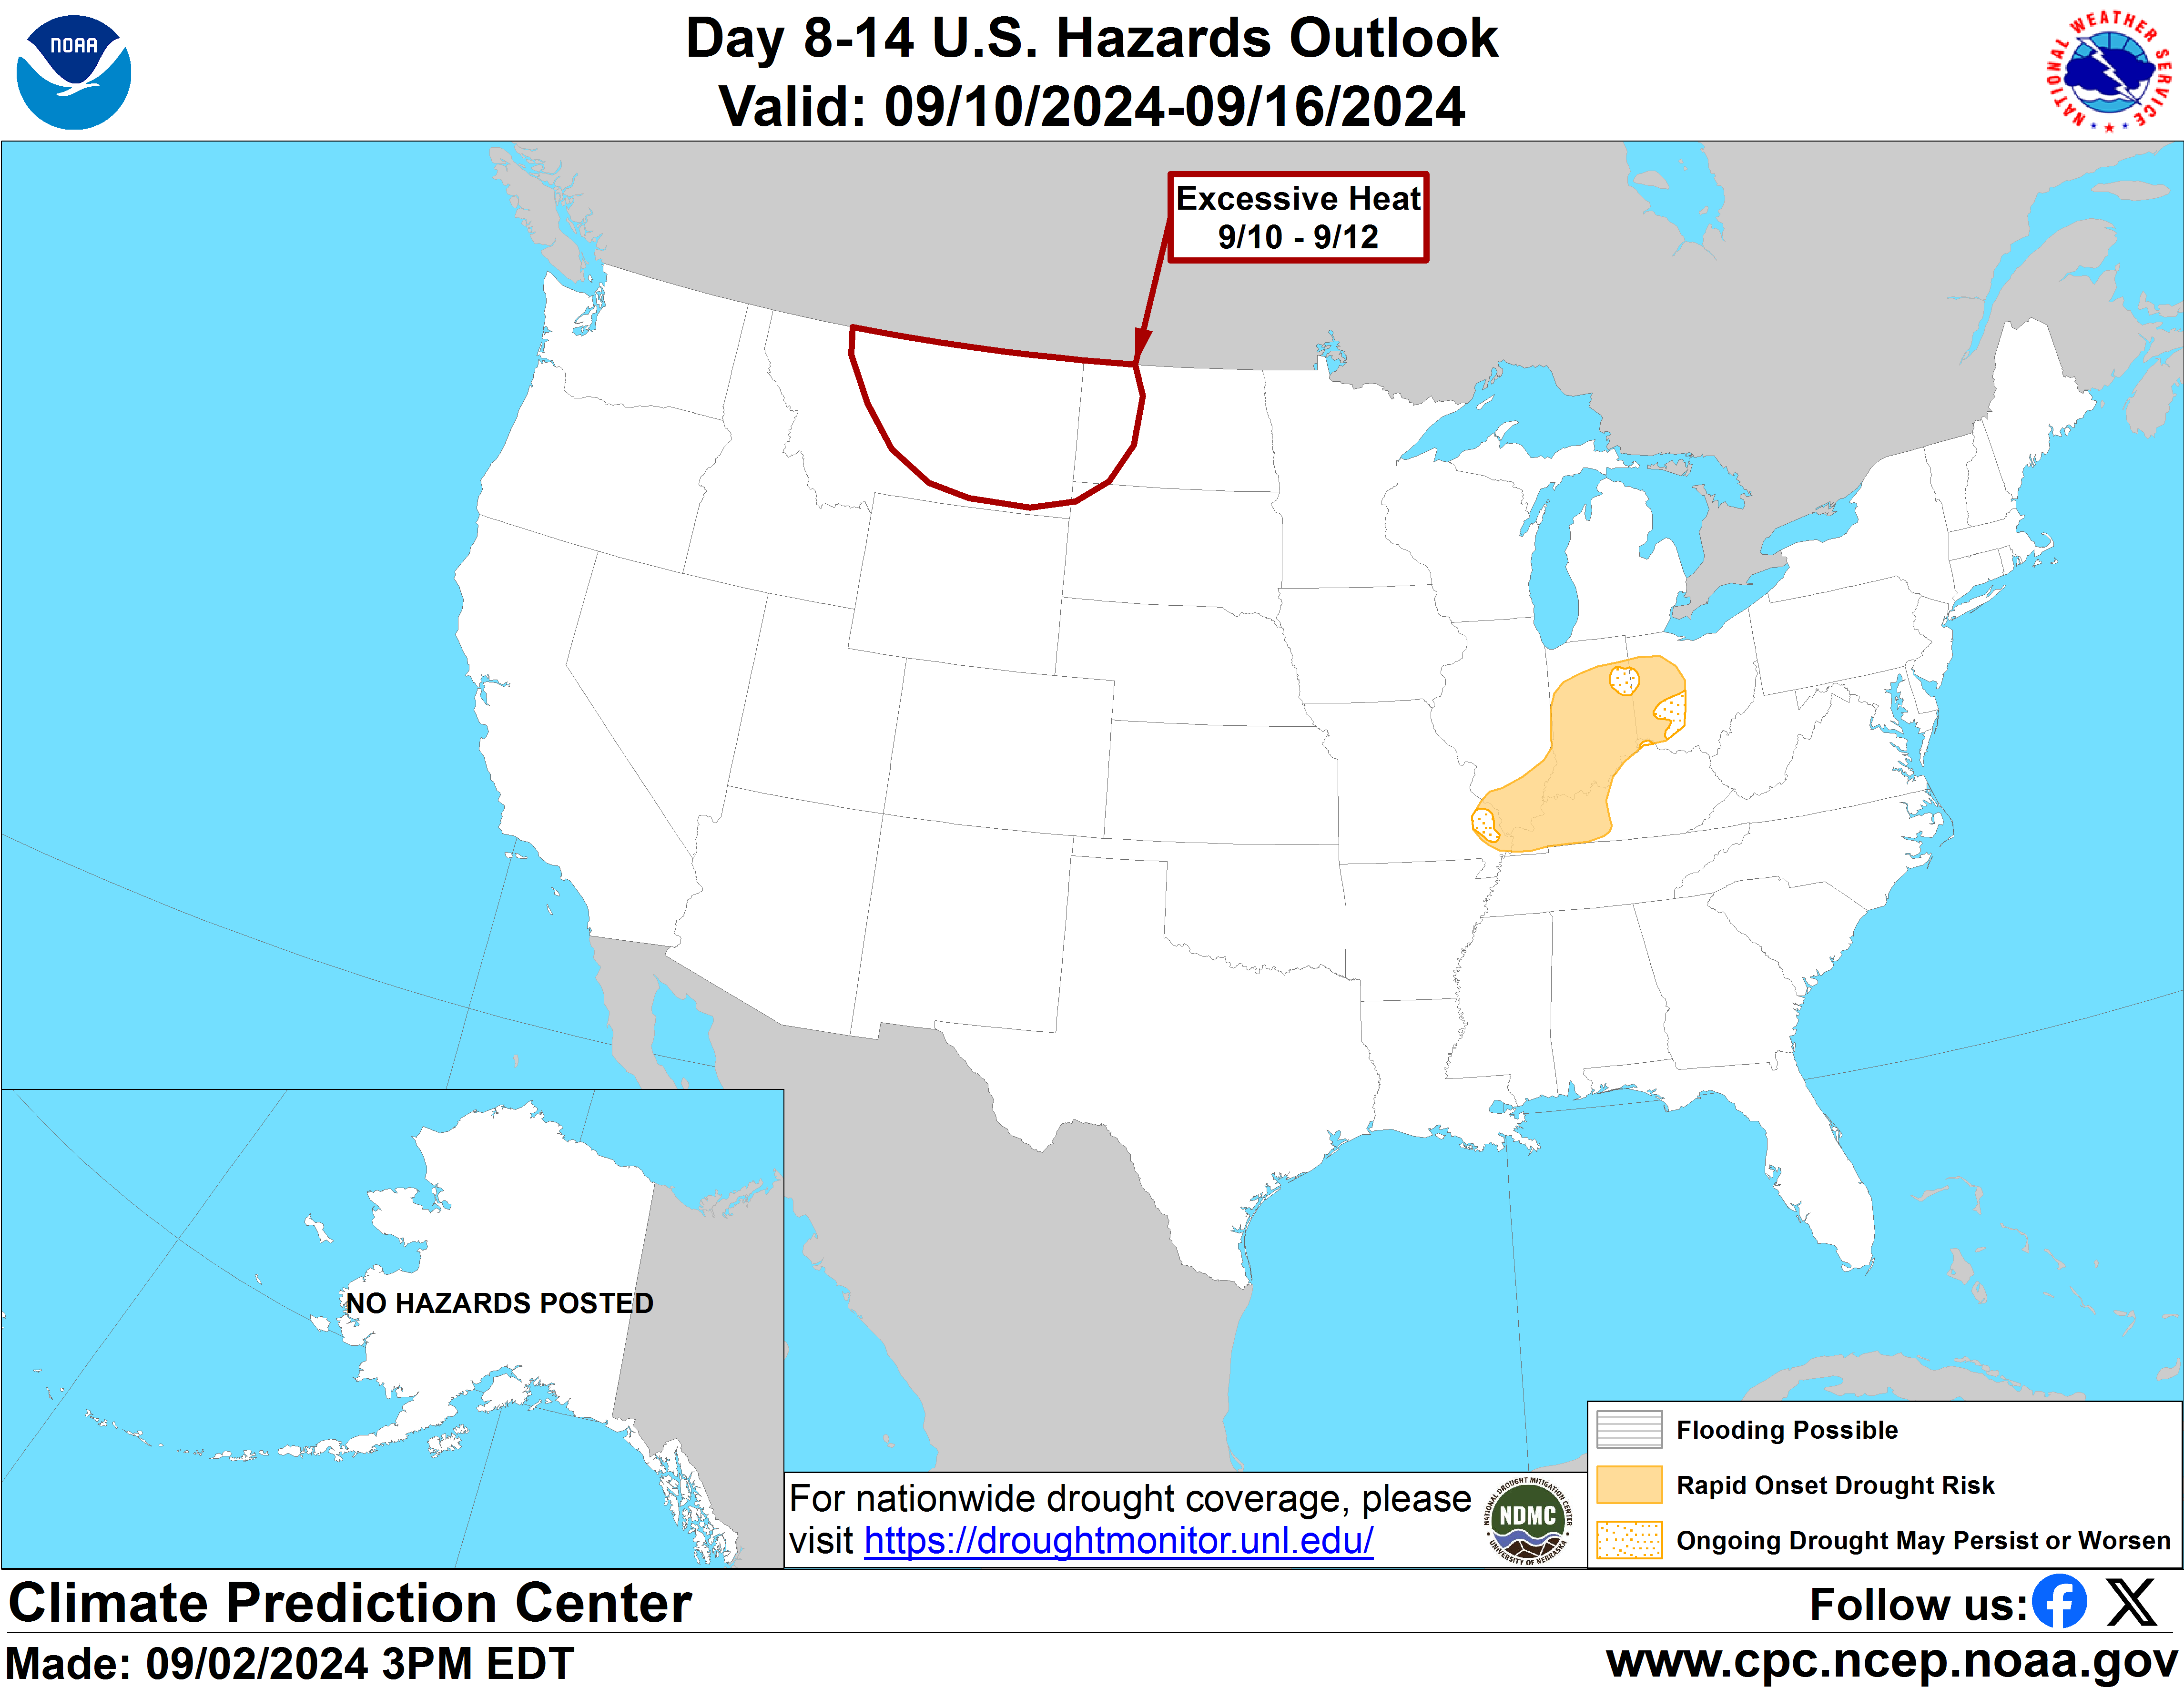
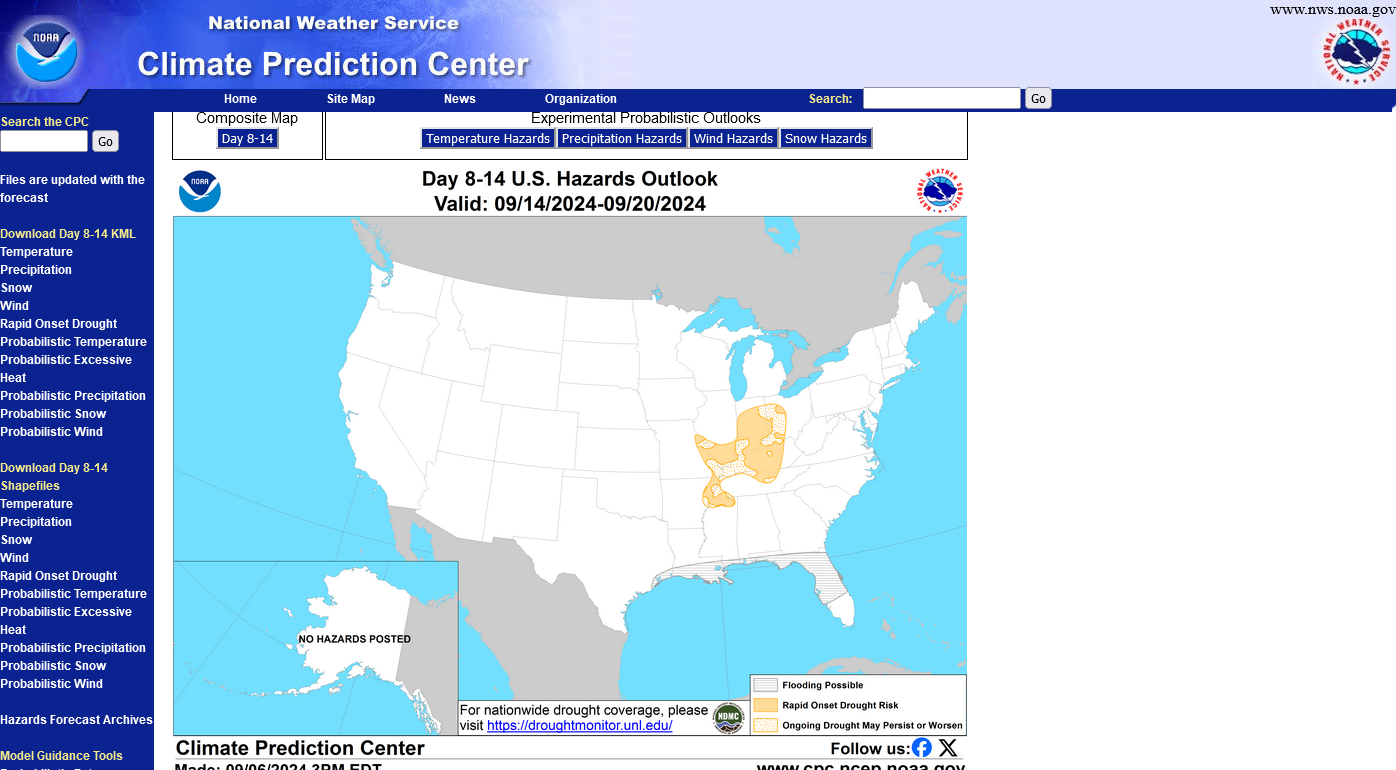
Watching the Western GOM with HIGH hopes that this system's robust tropical moisture can make it to the Ohio River towards the end of this work week!
https://www.cpc.ncep.noaa.gov/products/predictions/threats/threats.php
Re: Re: Re: Re: Re: AEW in E ATL could be next TC
By metmike - Sept. 8, 2024, 11:05 a.m.
7 Day Total precipitation below:
http://www.wpc.ncep.noaa.govcdx /qpf/p168i.gif?1530796126
Yeah, baby! Here comes our first real rain in over 5 weeks!
The dew point here in Evansville, IN yesterday morning was 29 degrees. I've never seen it close to that low in early September in 4 decades of living here. Extraordinarily dry air mass and extraordinarily dry soils making it worse.
Potential for HUGE extremely needed rain event!
Started by metmike - Sept. 9, 2024, 12:05 a.m.
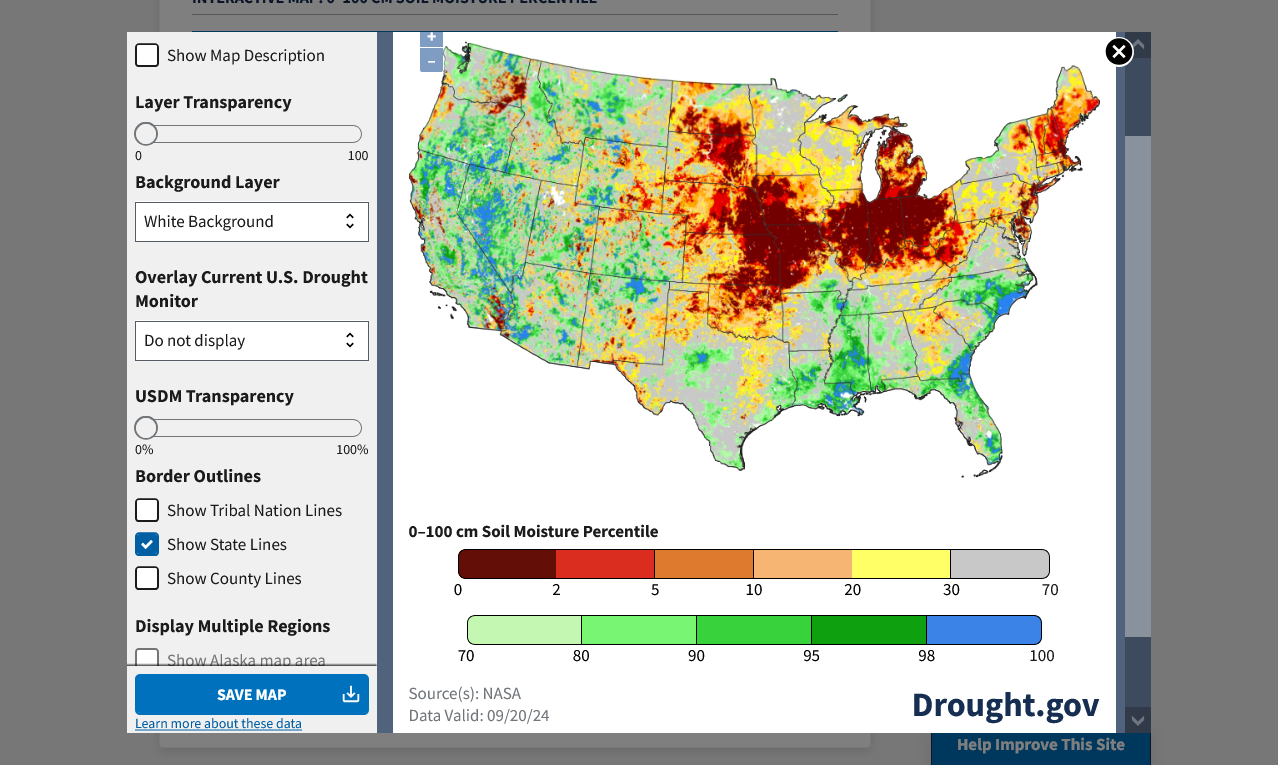
New product that shows how depleted our soil moisture is.
100 cm = 39 inches =just over 3 feet down. Evansville is in the darkest shade of red.
Basically, close to the lowest soil moisture ever in the top 3 feet. We can see how Francine greatly helped areas just barely south of us a week ago.
https://www.drought.gov/data-maps-tools/nasa-sport-lis-soil-moisture-products
Busy week with our weather and for SOME good reasons if you're in the path of some drought busting rains on the northern periphery of the rain shield.
NOT along the Gulf Coast, however with EXTREME life threatening weather.
And many drought areas will see too much of a good thing too fast.
Potential NW Caribbean/GOM TC formation next wk
Started by WxFollower - Sept. 19, 2024, 2:16 a.m.
https://www.marketforum.com/forum/topic/107518/
++++++++++++++
Re: Re: Re: Re: Potential for HUGE extremely needed rain event!
By metmike - Sept. 24, 2024, 3:35 p.m.
3.5 inches of rain here!
good thing because october is looking bone dry!
Warm forecasts for late October with zonal, DRY west to east flow. A decent shot of chilly air in the East for several days next week.
However, Milton is the big deal this week:
Invest 92L SW Gulf: threat to W FL mid-week!
Started by WxFollower - Oct. 5, 2024, 12:13 a.m.
Fire Weather Outlooks
https://www.spc.noaa.gov/products/fire_wx/
| Day 3-8 Fire Weather Outlooks (Product Info) | |
|---|---|
| Current Fire Weather Outlooks (Product Info) | |
Current Day 1 Fire Weather Outlook | Forecaster: WEINMAN Issued: 171657Z Valid: 171700Z - 181200Z Forecast Risk of Fire Weather: Critical Risk Note: Critical Fire Weather Criteria document in MS-Word or PDF. |
Current Day 2 Fire Weather Outlook | Forecaster: BENTLEY Issued: 170653Z Valid: 181200Z - 191200Z Forecast Risk of Fire Weather: Elevated Note: Critical Fire Weather Criteria document in MS-Word or PDF. |
Day 3-8 Fire Weather Outlook | Forecaster: WEINMAN Issued: 162159Z Valid: 18/1200Z-24/1200Z |
+++++++++++++++++++++++++
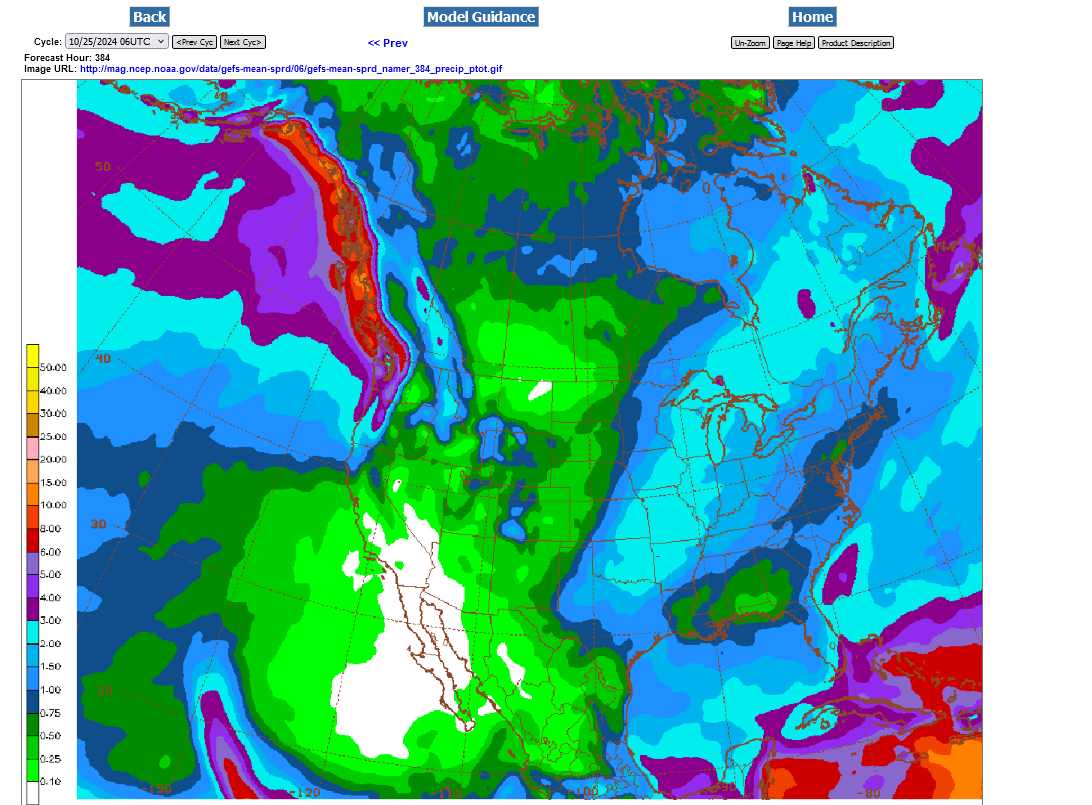
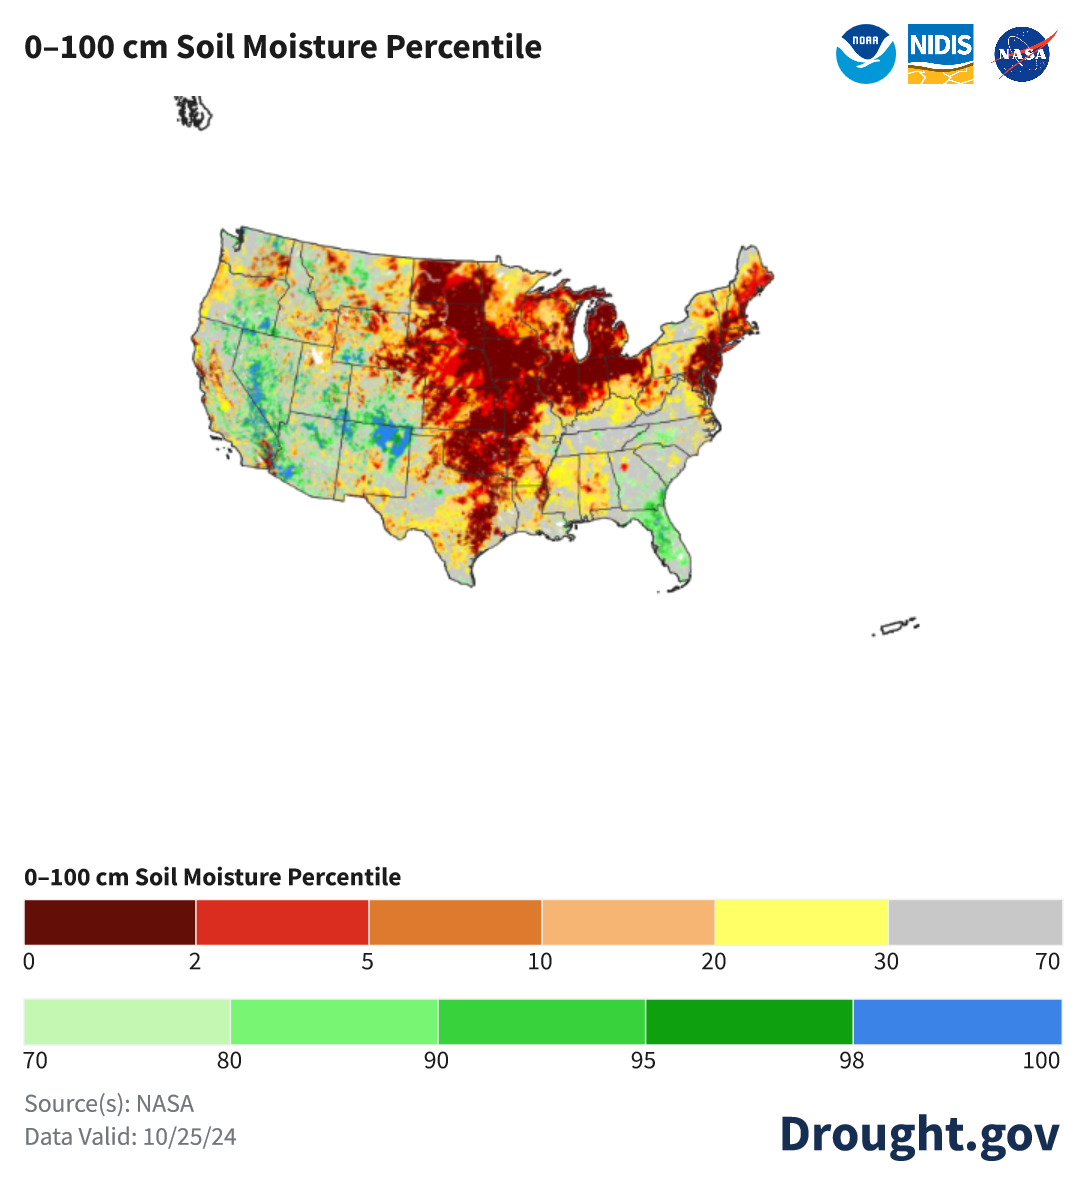
Drought expanding in October:
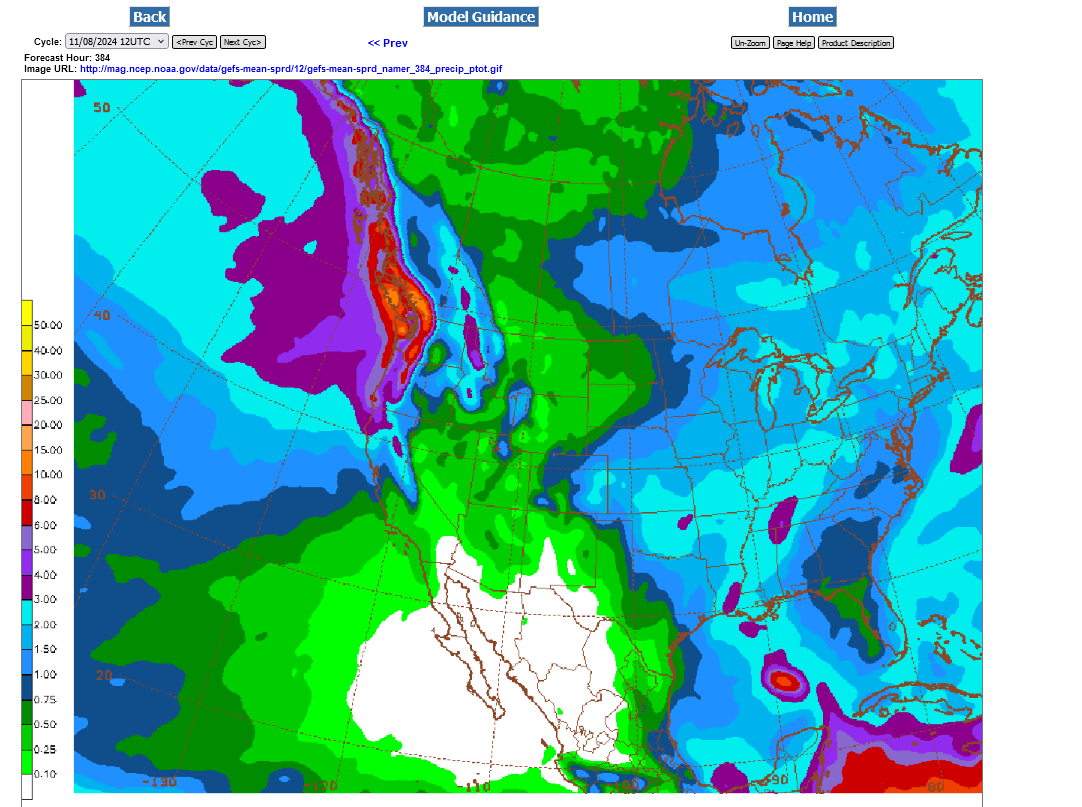
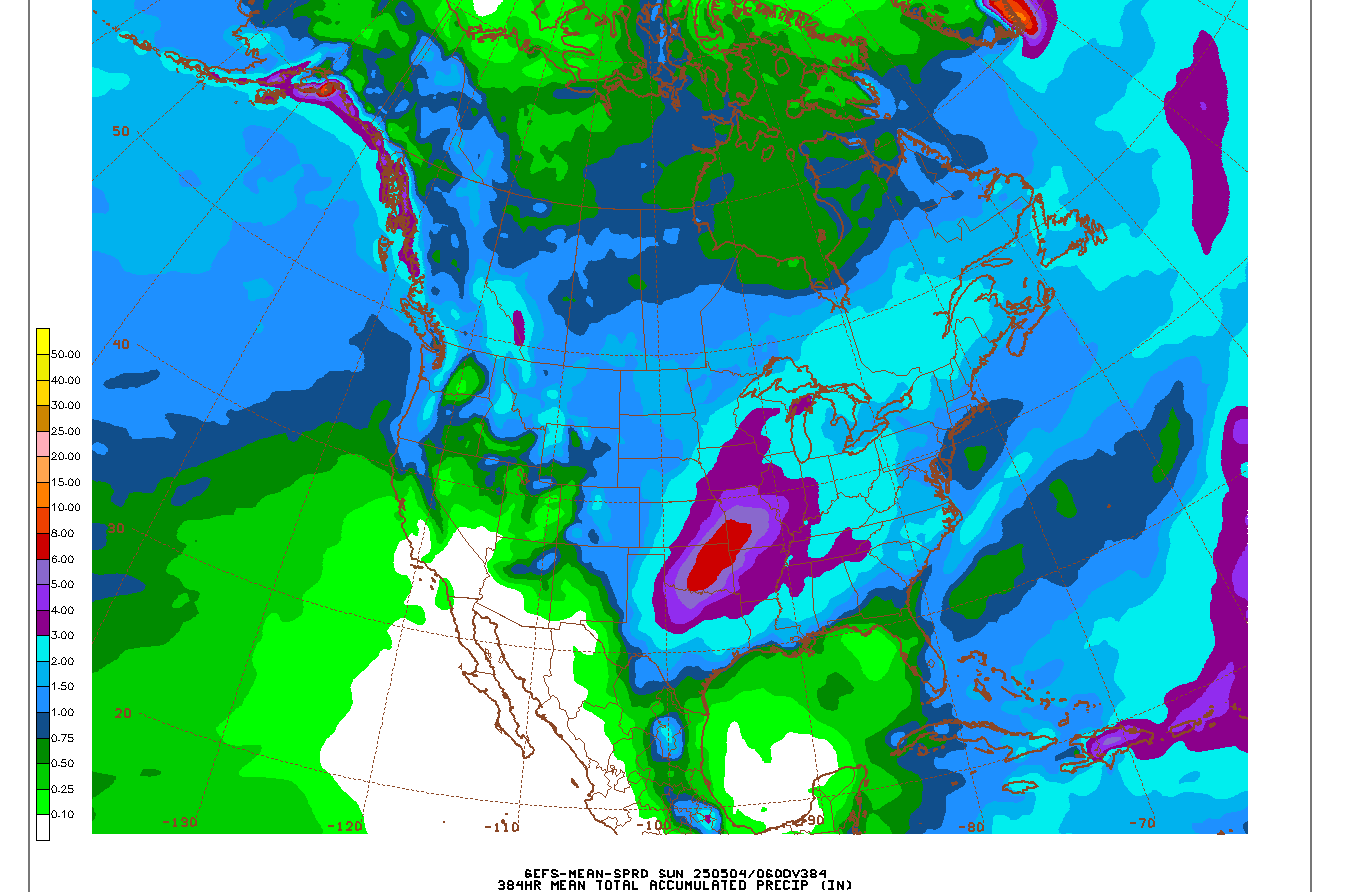
Rains boosted a bit on the last 6z GEFS for the next 384 hours but this is NOT drought busting. It looks like pattern after 2 weeks will go back to being dry.
https://www.marketforum.com/forum/topic/83844/#83853
https://www.drought.gov/current-conditions
Great discussion on drought here:
2 week rains from the last 12z GEFS model! This will make a big dent in the drought for many areas!
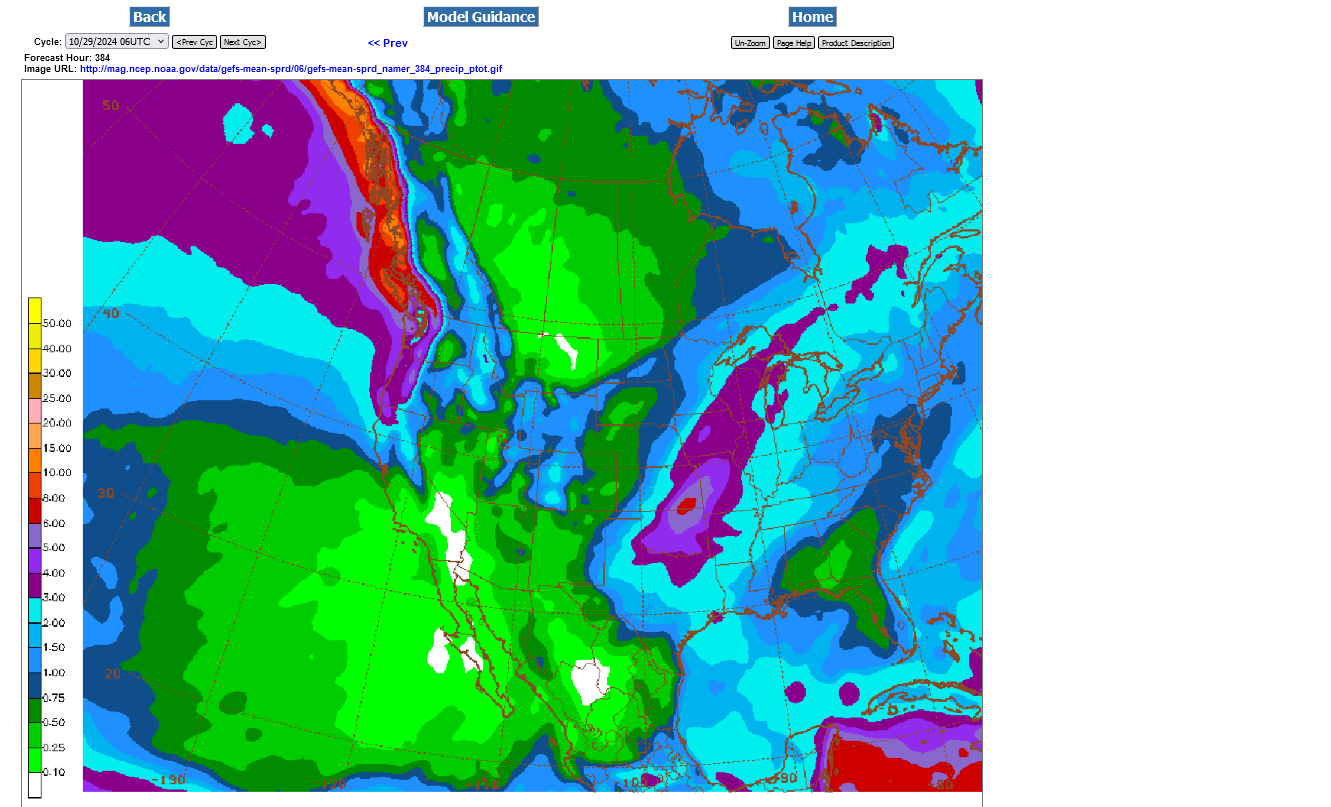
Rains have continued to increase in drought areas which will almost wipe out the drought in some spots. Just what the vegetation/crop doctor ordered.
Total 16 day amounts on this last 6Z GEFS. WOW! This is NOT like most La Nina's!
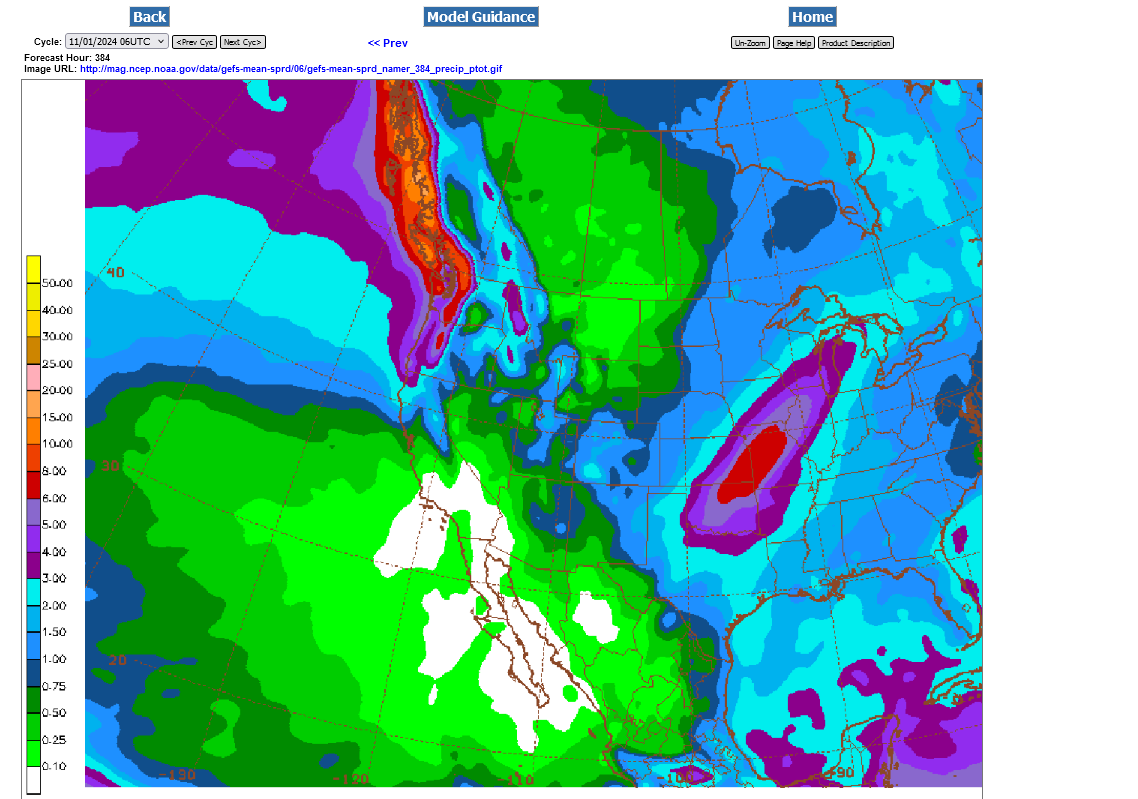
This will be a drought buster for many areas!!
384 total rains from the last 12z GEFS below.
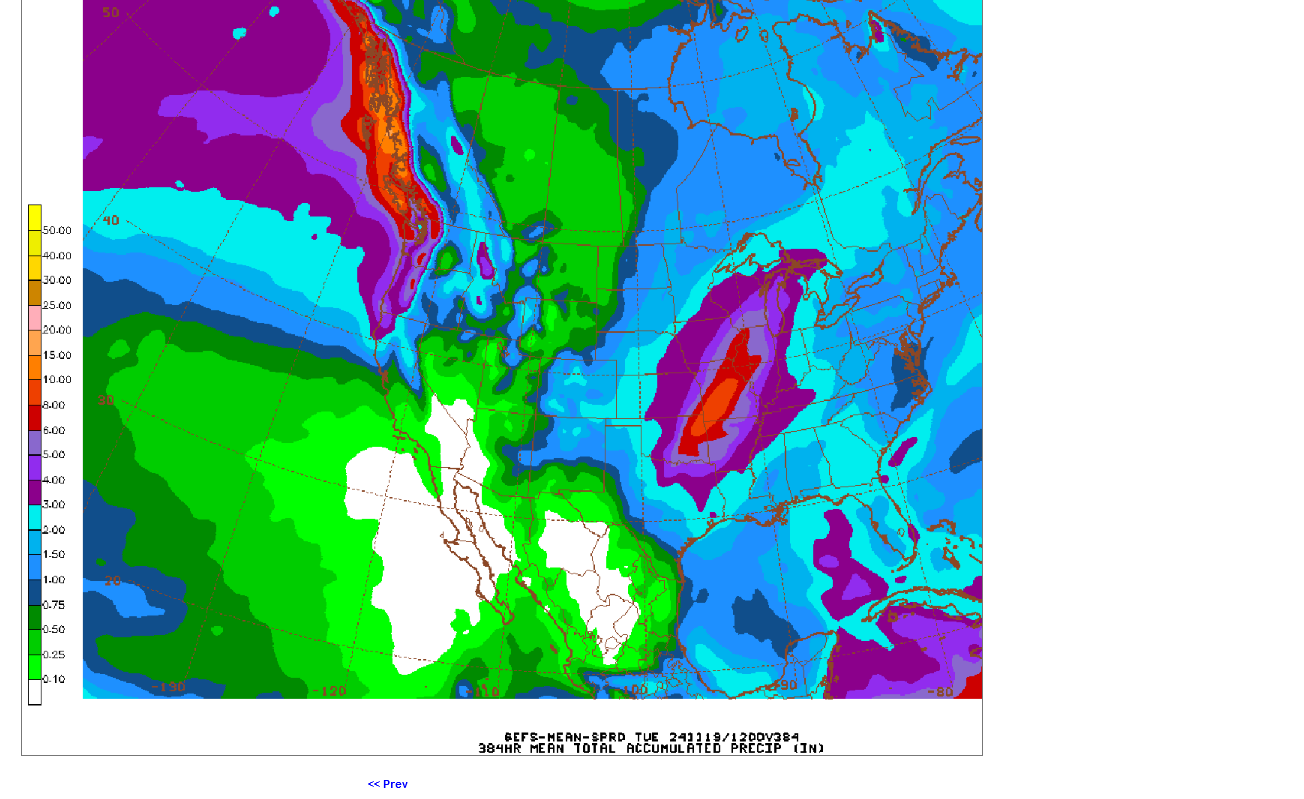
Still more rains to come the next 2 weeks. Especially southern and Eastern Midwest. Also C/S Plains.
Drought has been greatly improving!!
Bumping to the top.
Busy praying and singing hymns for my dad ahead of his soon to come death.
Added:
A tribute to our Dad, Frank Maguire 9-16-1925 to 11-21-2024
24 responses |
Started by metmike - Nov. 22, 2024, 2:04 p.m.
YOUR DAD HAS BEEN ON MY MIND, ALL WEEK.
PEACEFUL THOUGHTS & PRAYERS FOR A PEACEFUL PASSING TO THE PROMISE LAND.
BIG HUGS
Thanks very much, Jean!
January looking MUCH colder!
The Siberian express is on the way!
Winter weather ahead 12-30-24
Started by metmike - Dec. 30, 2024, 10:04 p.m.
We've been tracking the latest Winter Storm here:
New Winter Storm 1-6-25+
15 responses |
https://www.marketforum.com/forum/topic/109377/
All sorts of weather threads recently:
2025 growing season/Current La Nina
Started by metmike - Jan. 11, 2025, 1:03 p.m.
https://www.marketforum.com/forum/topic/109485/
+++++++++++
Widespread snow cover January 12, 2025
Started by metmike - Jan. 12, 2025, 10:26 a.m.
https://www.marketforum.com/forum/topic/109504/
++++++++++++++
New Winter Storm 1-6-25+
34 responses |
Started by metmike - Jan. 7, 2025, 12:34 a.m.
https://www.marketforum.com/forum/topic/109377/
++++++++++++++++++
Winter Storm in the North
Started by metmike - Jan. 10, 2025, 9:54 a.m.
https://www.marketforum.com/forum/topic/109442/
+++++++++++
Winter Storm in the South
Started by metmike - Jan. 10, 2025, 8:54 a.m.
More extreme weather coming up from natural variation with ZERO coming from the fake climate crisis.
Winter Storm in the DEEP South 1-19-25
Started by metmike - Jan. 19, 2025, 9:09 p.m.
https://www.marketforum.com/forum/topic/109603/
This will rev up more extremely strong Santa Ana winds again!!
Re: Re: Re: Re: Re: Re: California fires
By metmike - Jan. 19, 2025, 3:17 p.m.
New Winter Weather pattern 2-6-25
Started by metmike - Feb. 6, 2025, 10:23 p.m.
Latest in the parade of storms hitting the Midwest!
New weather thread on the NTR forum:
Blown Away
Started by mikempt - Feb. 16, 2025, 5:11 p.m.
Re: Re: Re: Re: Re: Grains…what’s going on
By metmike - Feb. 28, 2025, 2:38 p.m.
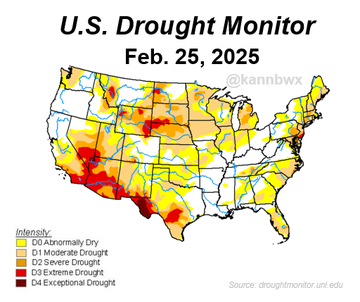
56% of U.S. #corn areas are currently experiencing drought conditions, up sharply from 45% a week ago. That is the week's third highest since 2000 and above the five-year average of 25%.
There's some good news: only 6% of corn areas are in severe or worse drought classification, the week's LOWEST in five years (year-ago was 15%). Also, per CPC's latest forecast, some of this could be alleviated this spring (more so in the east vs west).
See the drought monitor history here:
Tracking Severe Weather-3-14-25
Started by metmike - March 14, 2025, 10:58 a.m.
More severe weather outbreaks this week, along with excessive rain.
3-25-25 Severe weather for 3-30-25
Started by metmike - March 25, 2025, 10:51 p.m.
https://www.marketforum.com/forum/topic/110671/
3-30-25 Severe Storm/Tornado outbreak on 4-2-25
Started by metmike - March 30, 2025, 3:08 p.m.
Some heavy rains coming up in the SouthCentral parts of the country:
By metmike - April 18, 2025, 2:14 p.m.
Some heavy rains the next 2 weeks will keep some producers out of the fields until May. It's still early, though.
The rains will also be falling in some dry areas to help replenish soil moisture ahead of the growing season.
https://www.marketforum.com/forum/topic/83844/
https://www.marketforum.com/forum/topic/83844/#83848
7 Day Total precipitation below:
http://www.wpc.ncep.noaa.govcdx /qpf/p168i.gif?1530796126
2 week rains from the 6z GEFS run below:
Re: Re: Re: Re: Re: Weather May 2022
Soilmoisture anomaly:
These maps sometimes take a day to catch up to incorporate the latest data(the bottom map is only updated once a week).
https://www.cpc.ncep.noaa.gov/products/Soilmst_Monitoring/US/Soilmst/Soilmst.shtml#
![]()
++++++++++++++++++++++++++++
Updated daily below:
https://mrcc.purdue.edu/cliwatch/watch.htm#curMonths
Support for all MRCC-hosted products and services is currently suspended as of April 17, 2025, due to a lapse in federal funding from the Department of Commerce through NOAA.
++++++++++++++++
NEW LINK:
https://www.drought.gov/current-conditions
DROUGHT MONITOR
https://droughtmonitor.unl.edu/
Re: NWS/NOAA major cuts to efficient life saving org would be stupid/harmful
By WxFollower - April 21, 2025, 4:53 p.m.
Here’s some good news for a change:
The Southeast Regional Climate Center products and services have been restored as our
&
contract has been renewed. We very much appreciate the support we received from our many users.. :-)
What La Nina?? April 2025-Summer Outlook
Started by metmike - April 26, 2025, 4:15 p.m.
Severe Storms 4-28-25
Started by metmike - April 28, 2025, 5:22 a.m.
New severe weather thread, starting May 14, 2025:
A couple of stormy day's coming up, then a huge pattern change to intense heat:
Severe Weather threat June 17+, 2025
Started by metmike - June 17, 2025, 3:19 p.m.
https://www.marketforum.com/forum/topic/112614/
++++++++++++++++
Heat wave coming, June 17+ 2025
Started by metmike - June 17, 2025, 4:02 p.m.
Bumping to the top!
Huuuuge cooling off next week:
https://www.marketforum.com/forum/topic/83844/#83852
Updated daily below:
https://mrcc.purdue.edu/cliwatch/watch.htm#curMonths
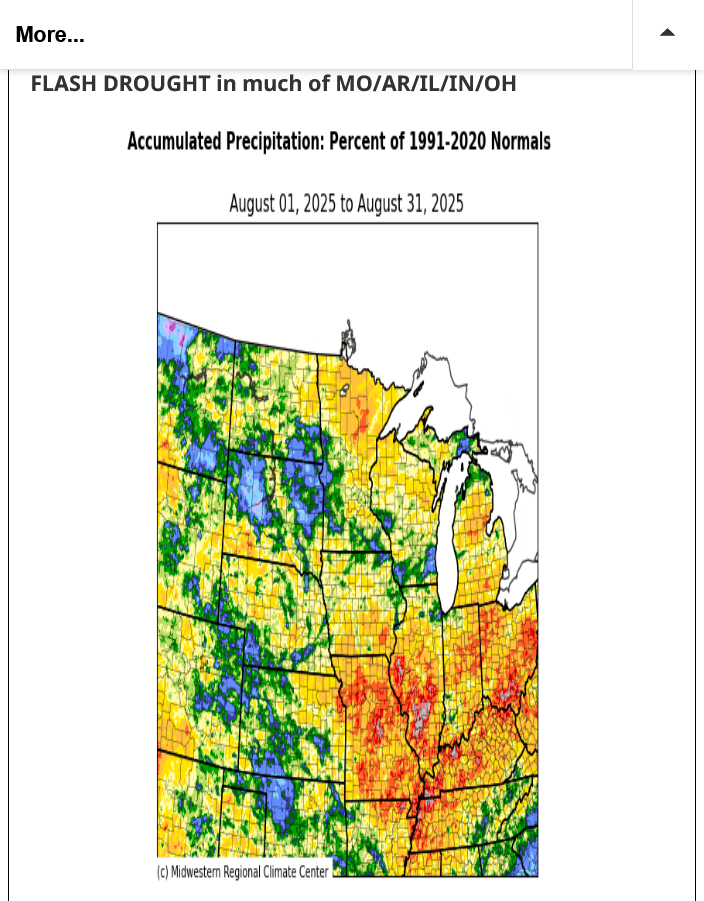
Almost flash drought in much of MO/AR/IL/IN/OH
https://www.marketforum.com/forum/topic/83844/#83853
Hoping for more rain here in southwest IN, than we have in the forecast because this IS a flash drought for much of us.
Week 2 is even drier
7 Day Total precipitation below:
http://www.wpc.ncep.noaa.govcdx /qpf/p168i.gif?1530796126
Updating the hot/dry weather and next potential chance of rain
Flash Drought/weather updates
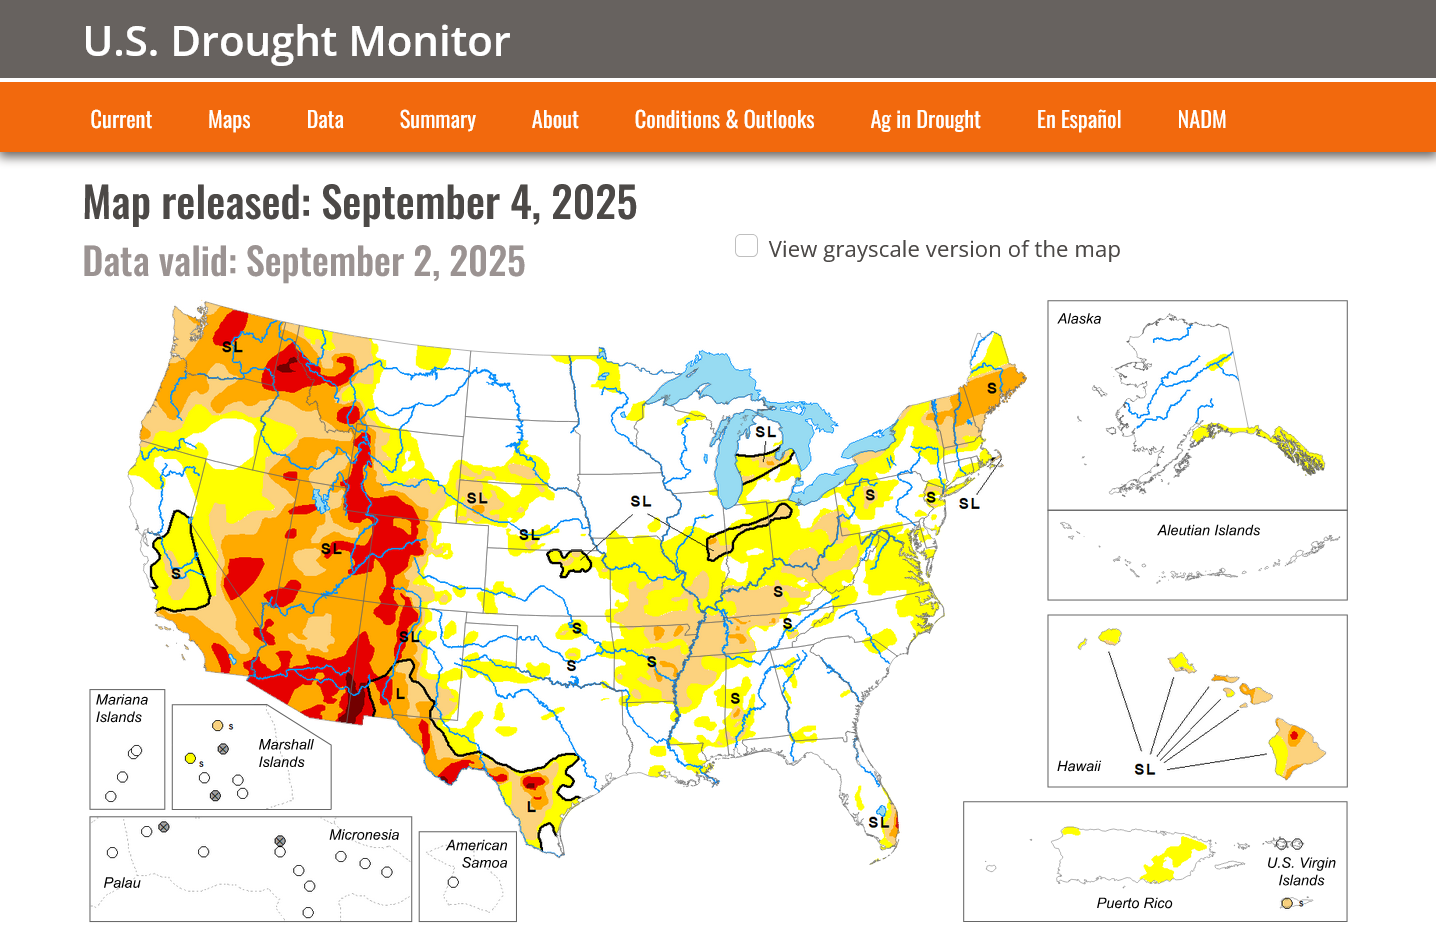
20 responses |
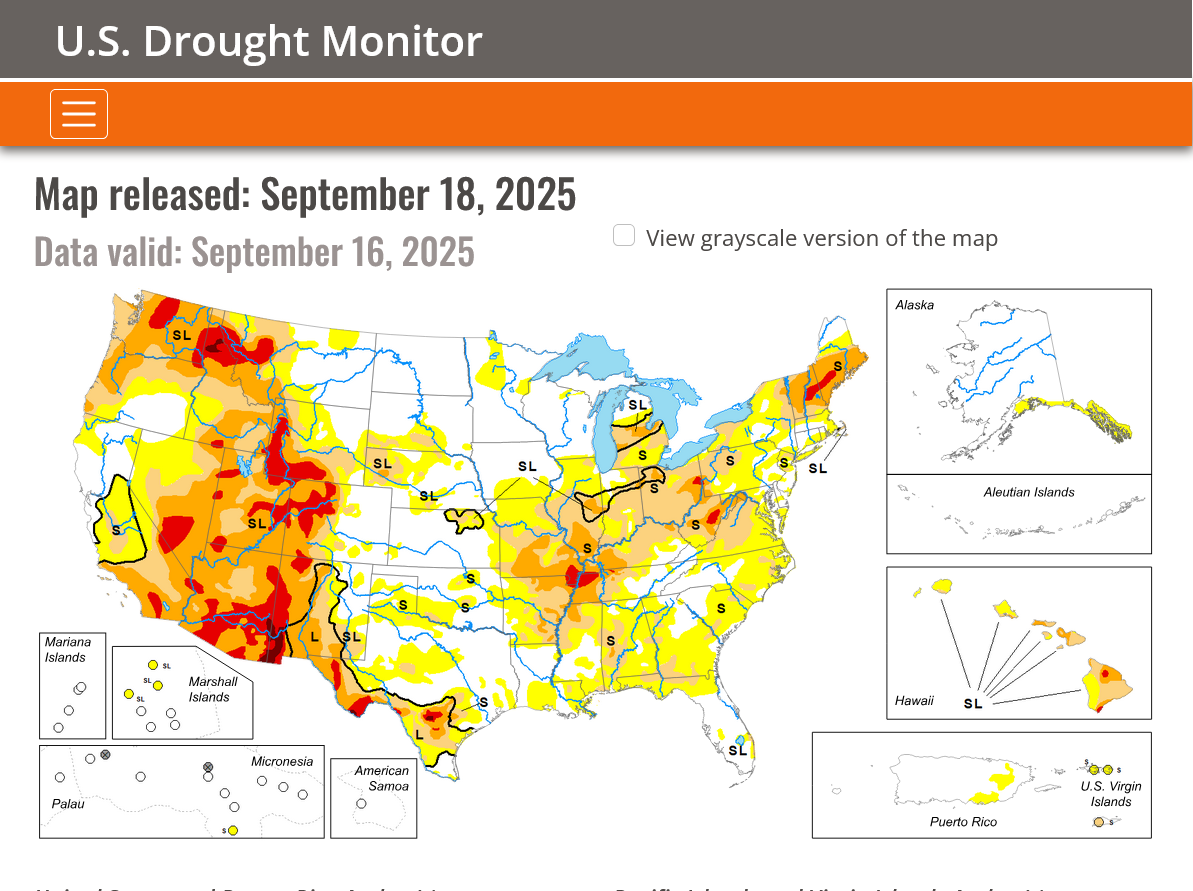
Started by metmike - Sept. 2, 2025, 9:39 a.m.
4.5 inches last 24 hours 40 miles NW Cincinnati
WOW!!!!!
That's more than a months worth of rain!!!
We got 2.7 inches, much of it in the last 2 hours of the event. This damaged the area on my steeply sloped front lawn that I recently reseeded.
Also, covered our long asphalt driveway with mud in the middle of my renovation project, 1st covering it with trowel patch, then sealing it(after finishing the trowel patch) but I can't wash it again until I finish the NEW project.
A huge tree fell on the front lawn. I've cut it up already but will need around 40 wheel barrow loads of cut up tree, going up the driveway to put in the woods behind our house and will leave tons of tracks on the driveway doing that. ….that will need another power washing before sealing.
I don't call going up the steep drive with heavy loads in the wheelbarrow work.
It's EXERCISE!
Next weeks brief cold blast will bring some snow with it:
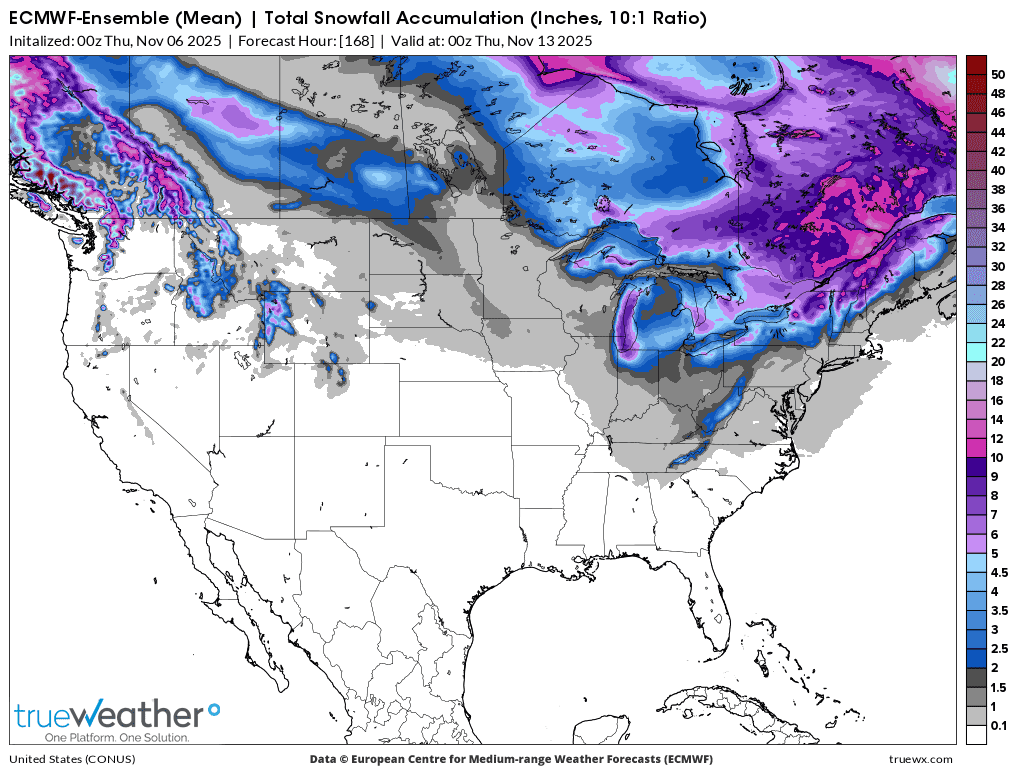
The pattern is extremely similar to the one we experienced in late August..........but now it's 2+ months later!
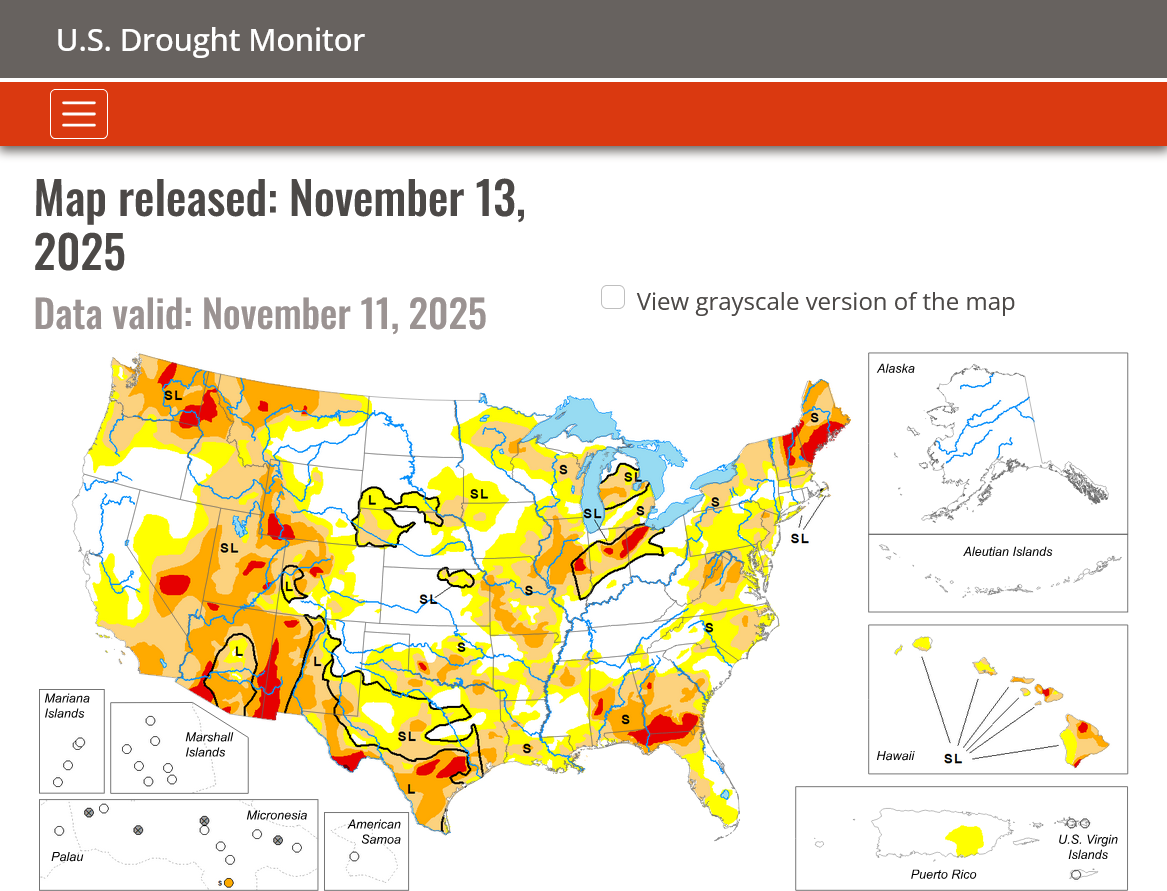
By metmike - Nov. 4, 2025, 1:38 p.m.
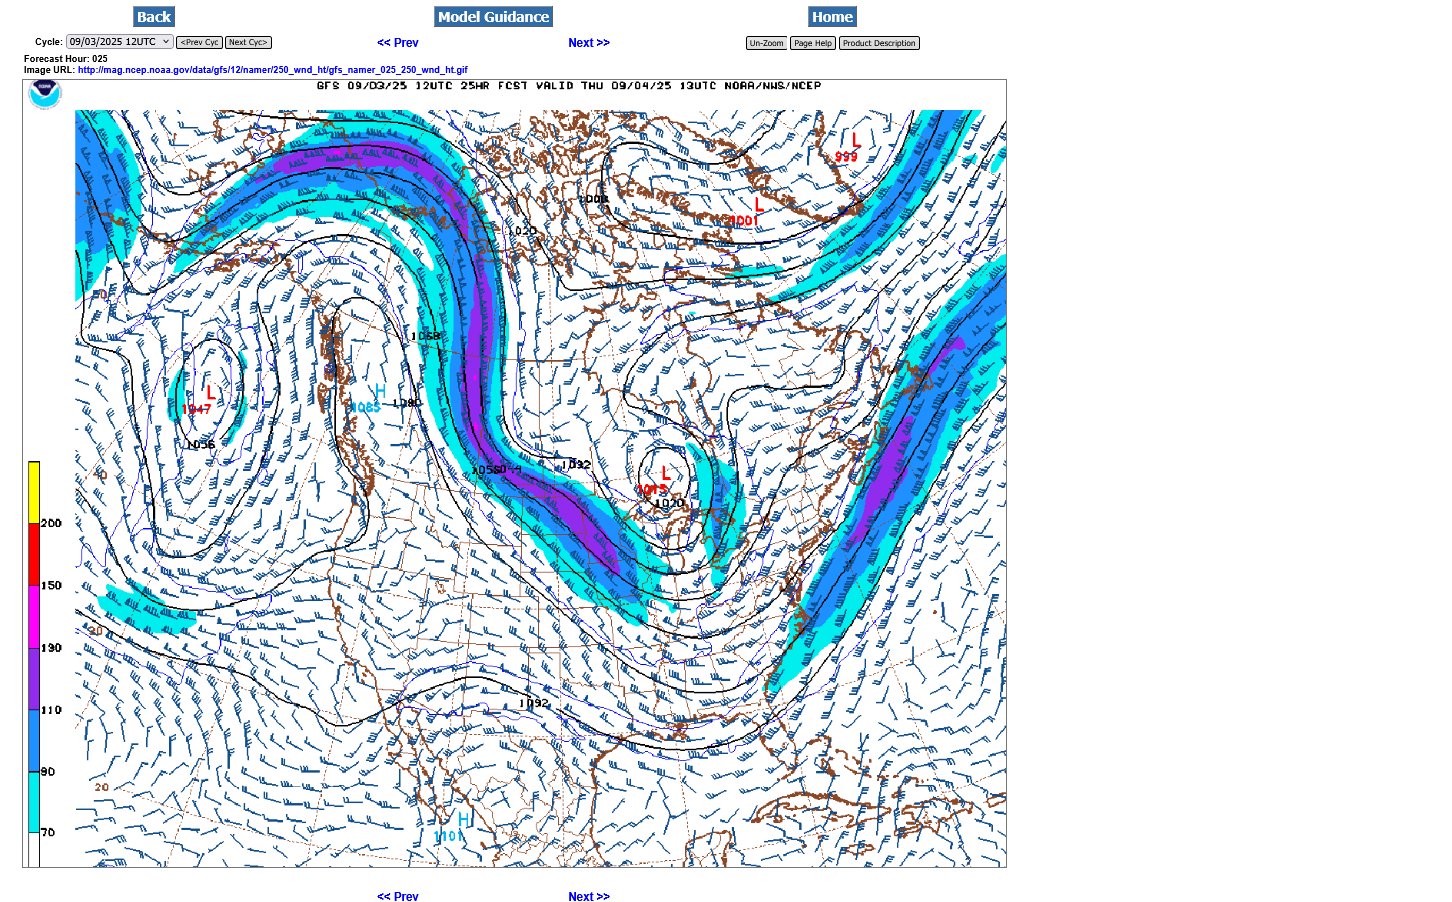
1, 250 mb for September 4, 2025-slightly more amplitude than now. Especially impressive for a jet stream in the warm(Summer) season.
2. 250 mb for November 9, 2025. Similar but with a more zonal flow in Canada vs the meridional (north to south) flow 2+ months ago that pulled down air from higher latitudes.
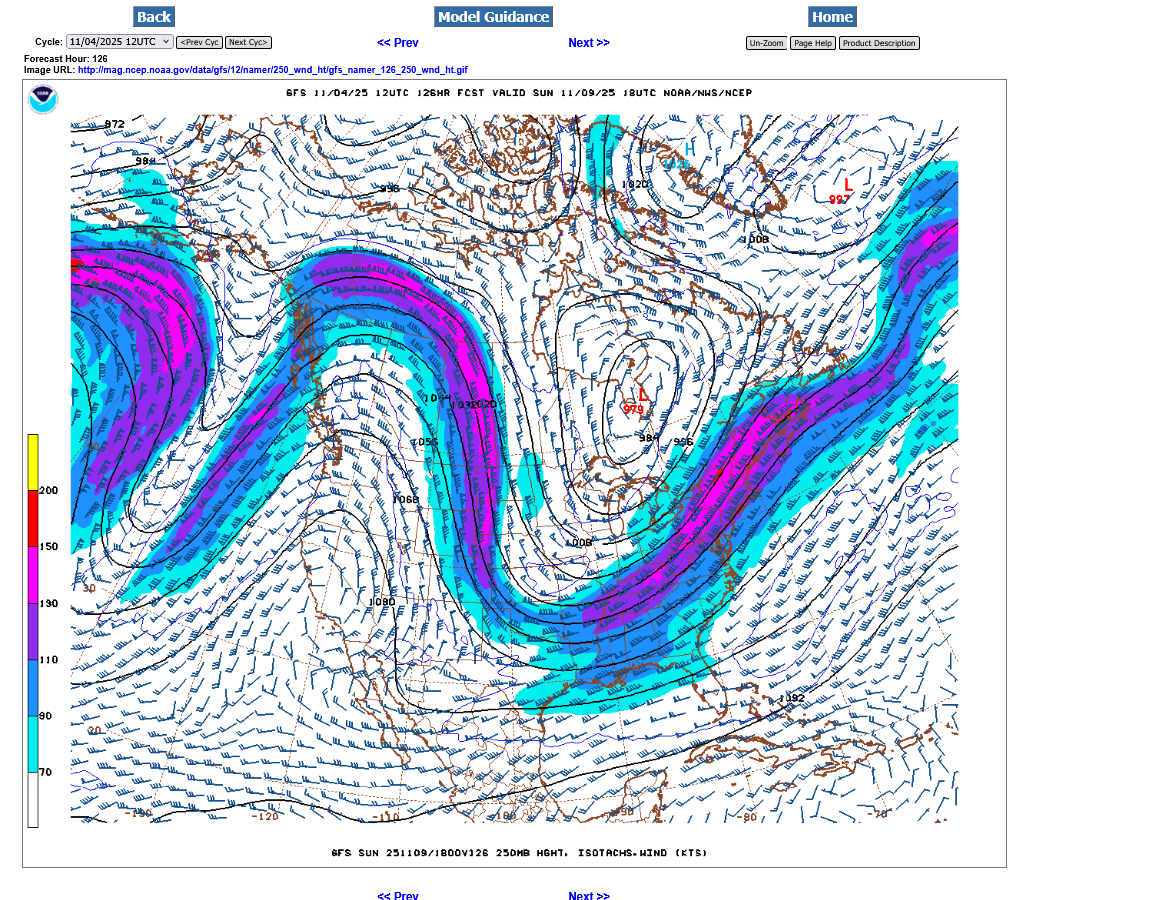
The light at the end of the cold/snowy tunnel!!
Cold tunnel threads below:
Snow event (light) December 1 & 2, 2025 27 responses |
Started by metmike - Nov. 29, 2025, 11:27 p.m. https://www.marketforum.com/forum/topic/116271/
++++++++++++++++++
Previous Winter weather thread:
11-21-25 Much colder pattern coming up! Started by metmike - Nov. 21, 2025, 3:17 p.m.
https://www.marketforum.com/forum/topic/116112/
+++++++++++++
Post of the week (WxFollower) and milder pattern coming up (metmike):
By WxFollower - Dec. 8, 2025, 11:32 a.m. ++++++++
By metmike - Dec. 8, 2025, 11:48 a.m.
Record Winter of 1917/18!
Started by metmike - Dec. 8, 2025, 7:21 p.m.
2025 weather year in review/Natural Gas
8 responses |
Started by metmike - Dec. 26, 2025, 12:29 p.m.
Historic snow/ice, late week of 1/18/26
17 responses |
Started by metmike - Jan. 18, 2026, 4:49 p.m.
https://www.marketforum.com/forum/topic/117294/
1-23-26+ Tracking the historic Winter Storm
20 responses |
Started by metmike - Jan. 24, 2026, 12:17 a.m.
New weather threads:
2-16-26 active weather week!
Started by metmike - Feb. 16, 2026, 7:04 p.m.
https://www.marketforum.com/forum/topic/117950/
++++++++++++
2-17-26 El Nino, here we come-FAST!
Started by metmike - Feb. 17, 2026, 11:54 a.m.
https://www.marketforum.com/forum/topic/117969/
+++++++++++++
Climate change:
Overturning the fradulent Endangerment Finding
Started by metmike - Feb. 13, 2026, 2:26 p.m.
https://www.marketforum.com/forum/topic/117904/
+++++++++++
CO2 Finally Exonerated!!
17 responses |
Started by metmike - March 2, 2025, 8:56 p.m.
https://www.marketforum.com/forum/topic/110244/
Re: Re: CO2 Finally Exonerated!!
By metmike - Feb. 12, 2026, 3:36 p.m.
Historic snowstorm/blizzard in the Northeast!
Nor'Easter
Started by mikempt - Feb. 22, 2026, 12:53 p.m.
we are waiting here in ValleyForge,pa. I will give you the final report tomorrow morning! This is Coast Guard dream weather!!
Rain/Drought thread May 2026
https://www.marketforum.com/forum/topic/120018/
+++++++++++++
2-17-26 El Nino, here we come-FAST!
Started by metmike - Feb. 17, 2026, 11:54 a.m.
https://www.marketforum.com/forum/topic/117969/
++++++++++++++
April 2026 climate stats
Started by metmike - May 4, 2026, 2:08 p.m.
Tracking the impact on grains this week!
Grains 5-19-26
Started by metmike - May 19, 2026, 10:49 p.m.
Rain/Drought thread June 2026
Started by metmike - June 1, 2026, 7:51 a.m.
GRAINS June 14,
29 responses |
Started by tjc - June 14, 2026, 11:38 a.m.


