Previous thread:
Natural Gas 9-5-23
62 responses |
Started by metmike - Sept. 5, 2023, 7:22 p.m.
https://www.marketforum.com/forum/topic/98739/
+++++++++++++
Weather models are not as mild in week 2 here on Sunday vs Friday, so natural gas opened higher and is +$660 vs the daytime close on Friday.
The EIA report this Thursday will be for 2 weeks! That means more potential for a number different than expected.
+++++++++++++++++
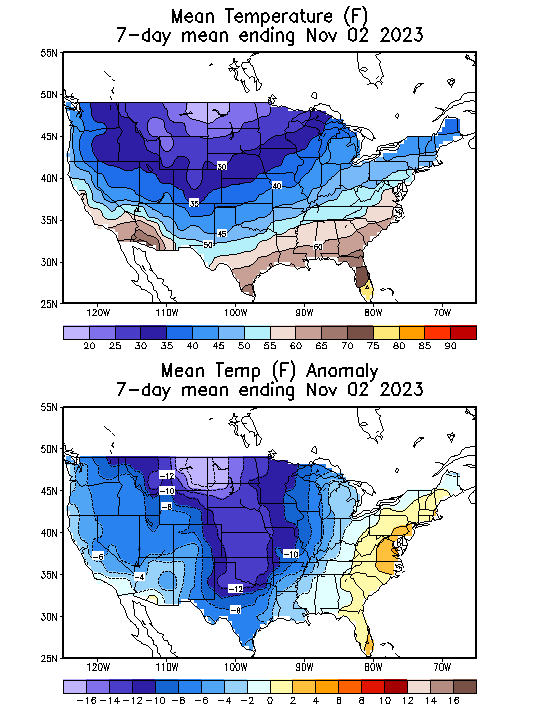
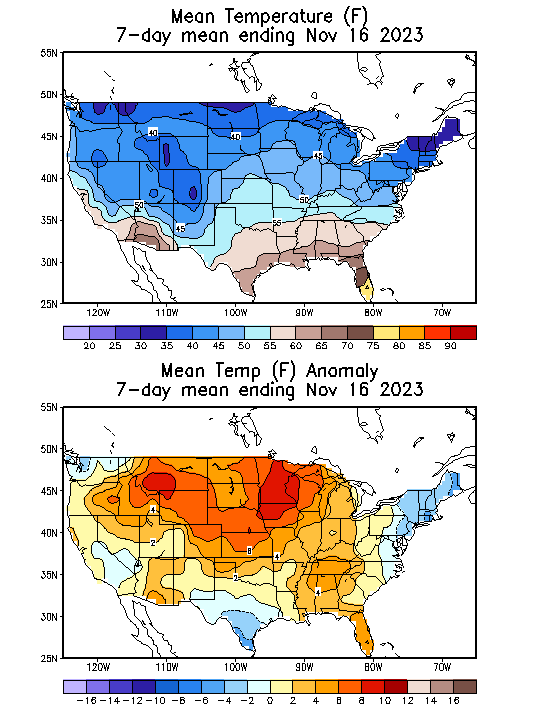
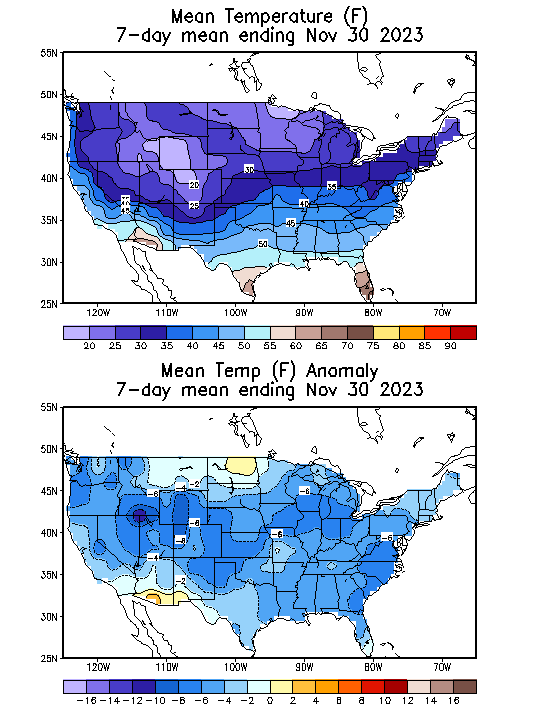
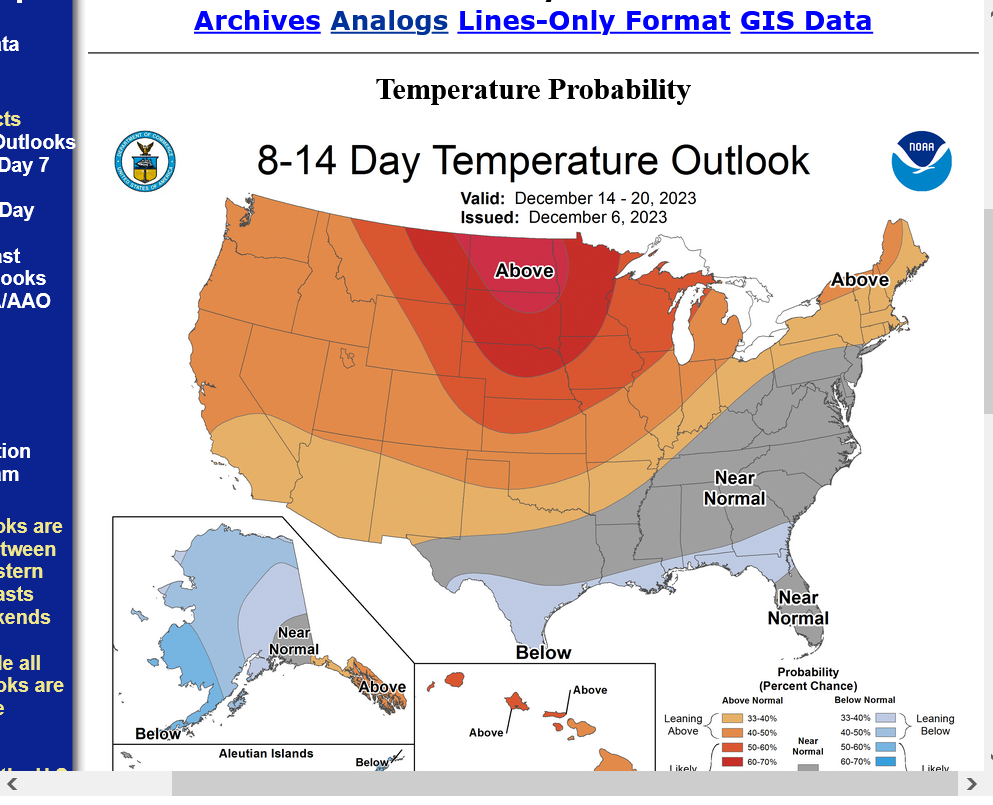
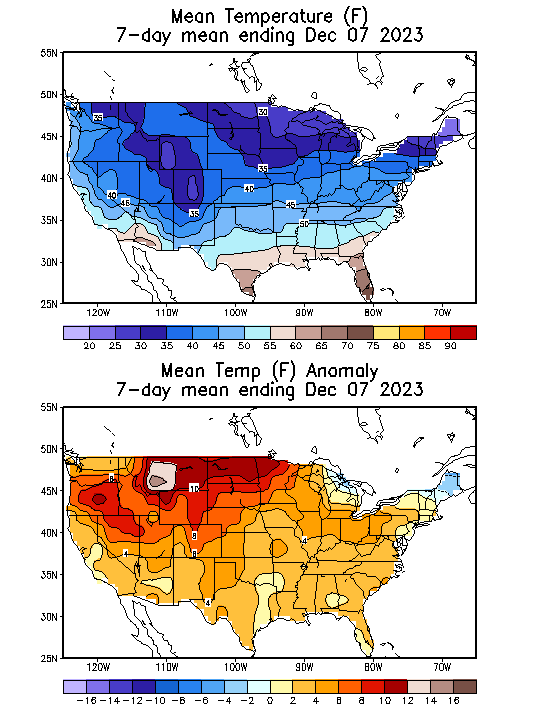
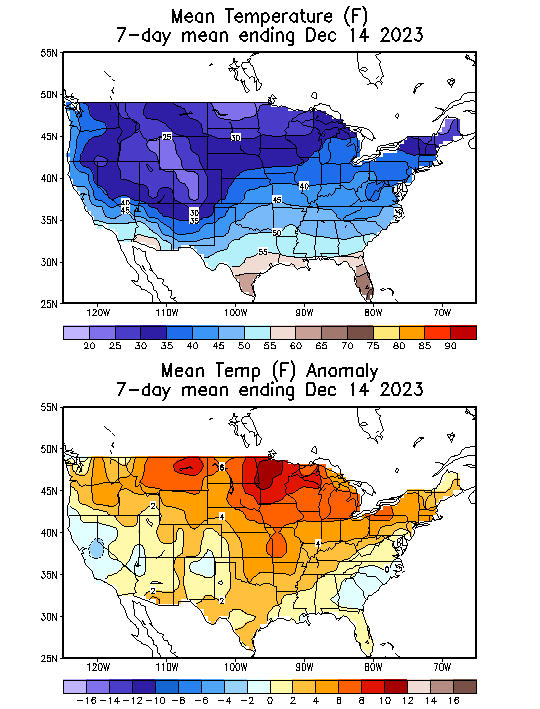
This was the temp map vs average for week 1. Extremely cold vs average in the middle of the country.
https://www.cpc.ncep.noaa.gov/products/tanal/temp_analyses.php
+++++++++++
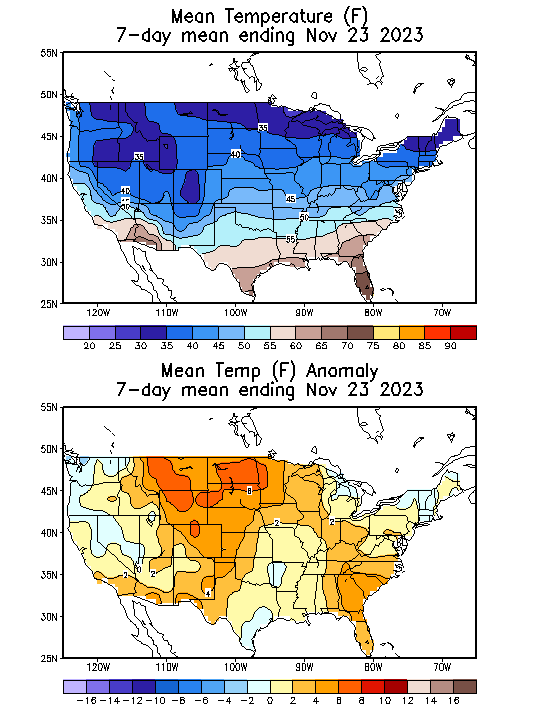
Here it is for week 2. Extremely mild, just the opposite of the first week!
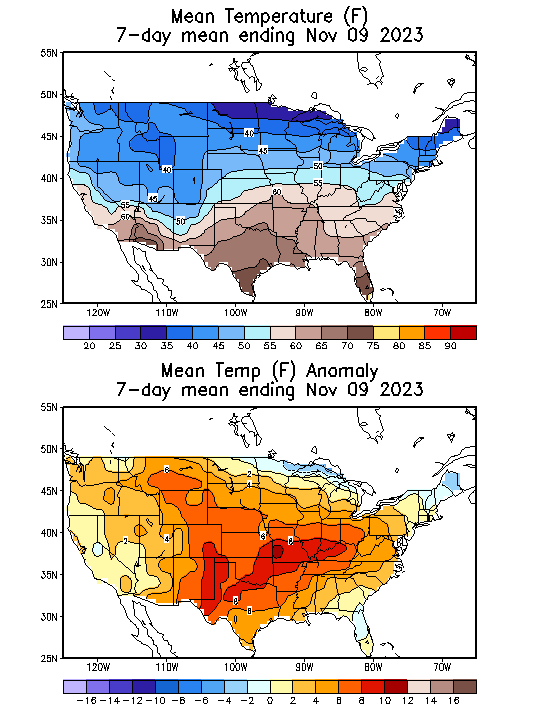
+++++++++++++
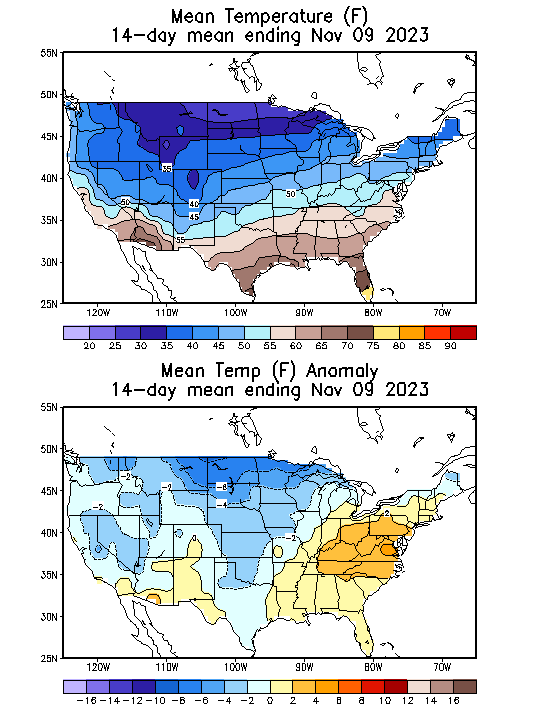
2 weeks combined for this Thursday's report. Chilly in the Middle, mild in the East.
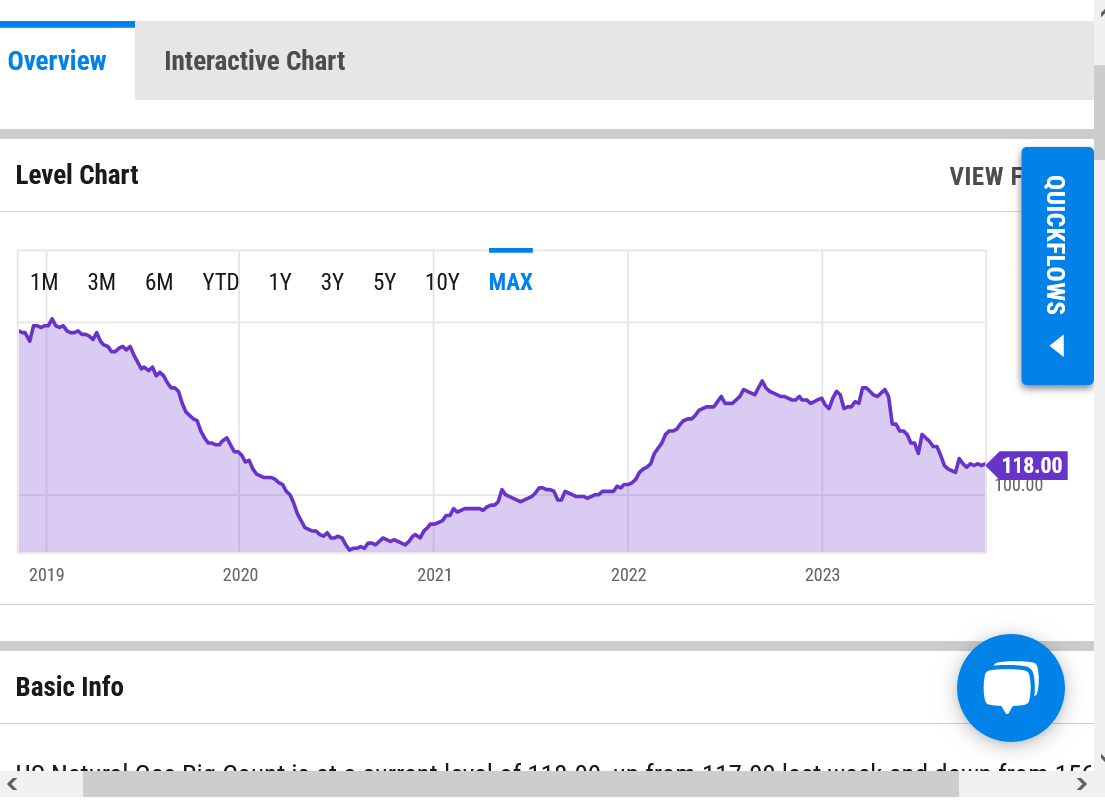
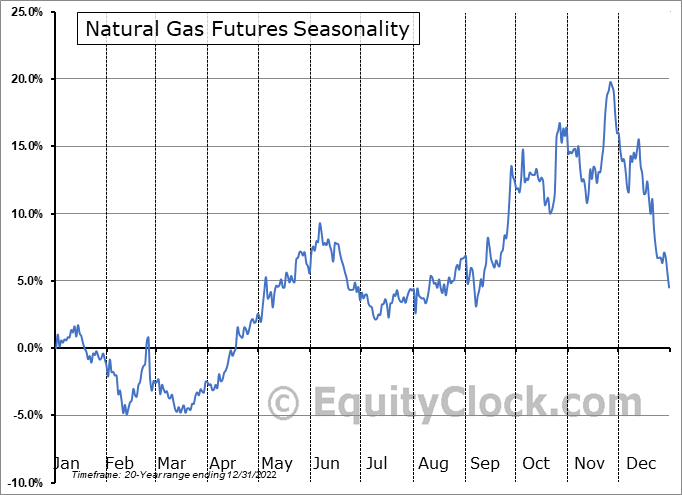
Rig count continues to be off the highs and potentially bullish with increasing exports.
It was 161 at the end of April 2023(high this year) and is at 118 in the latest week.
I wouldn't give this graph a great deal of weighting.
Weather/temperatures compared to average will matter 10X more.
https://charts.equityclock.com/natural-gas-futures-ng-seasonal-chart
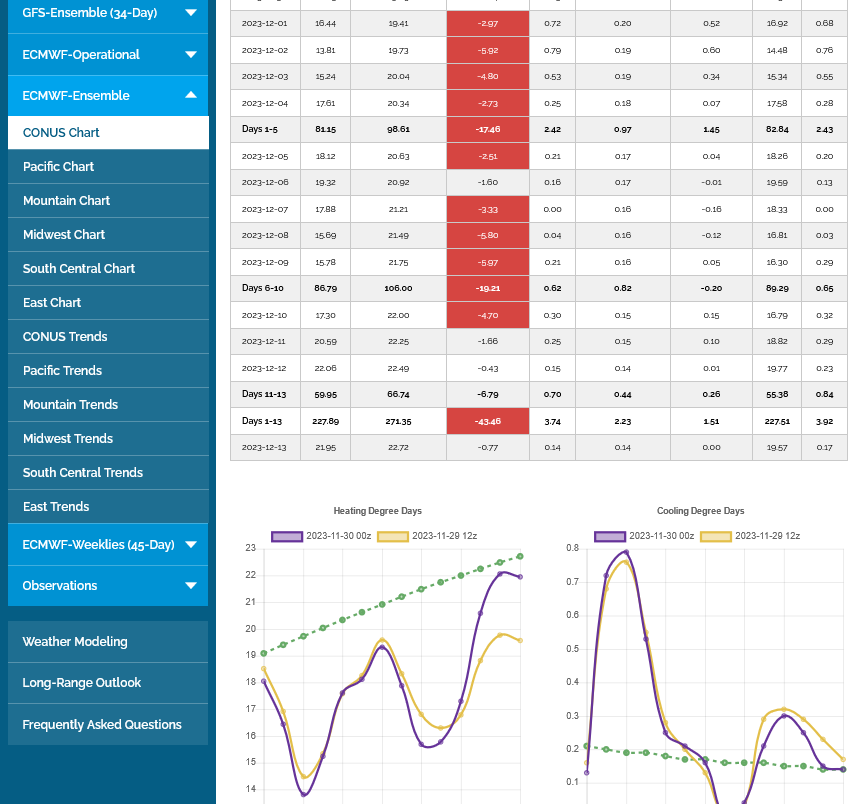
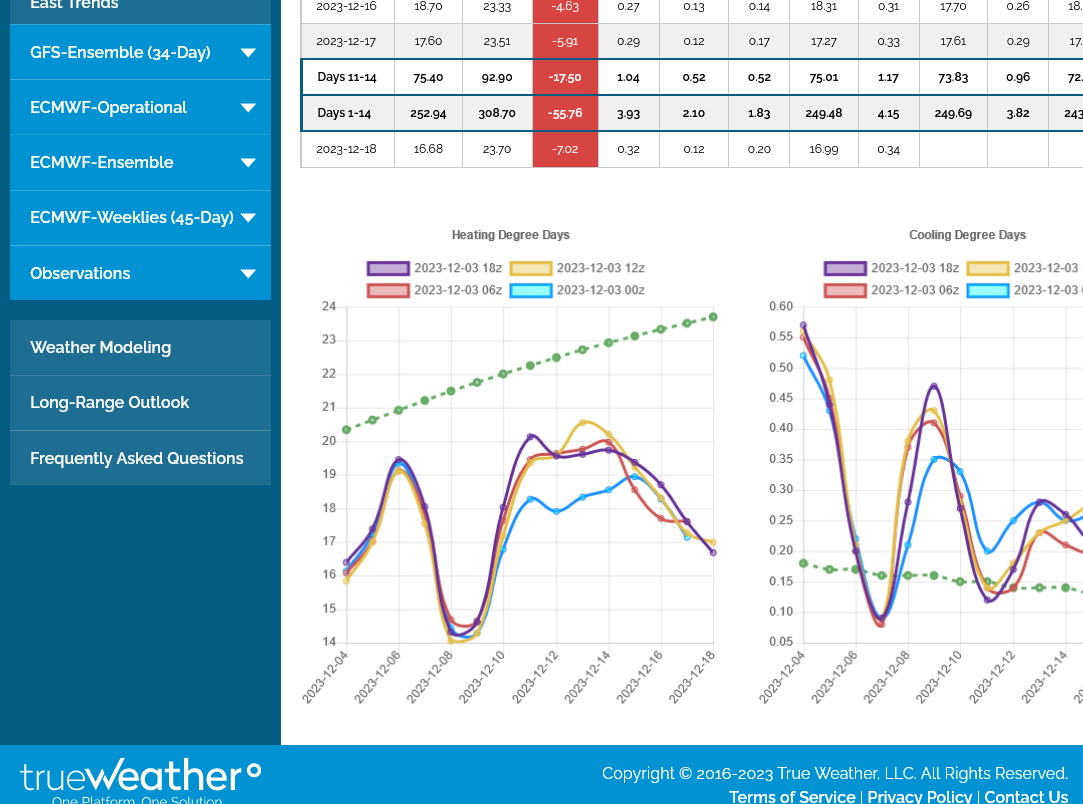
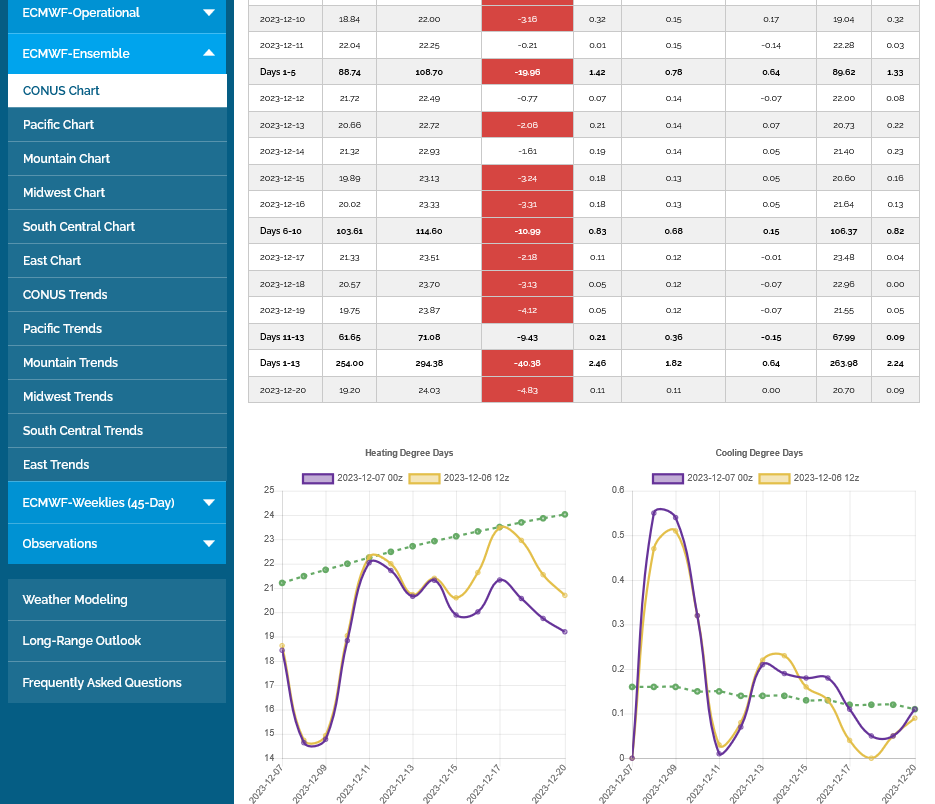
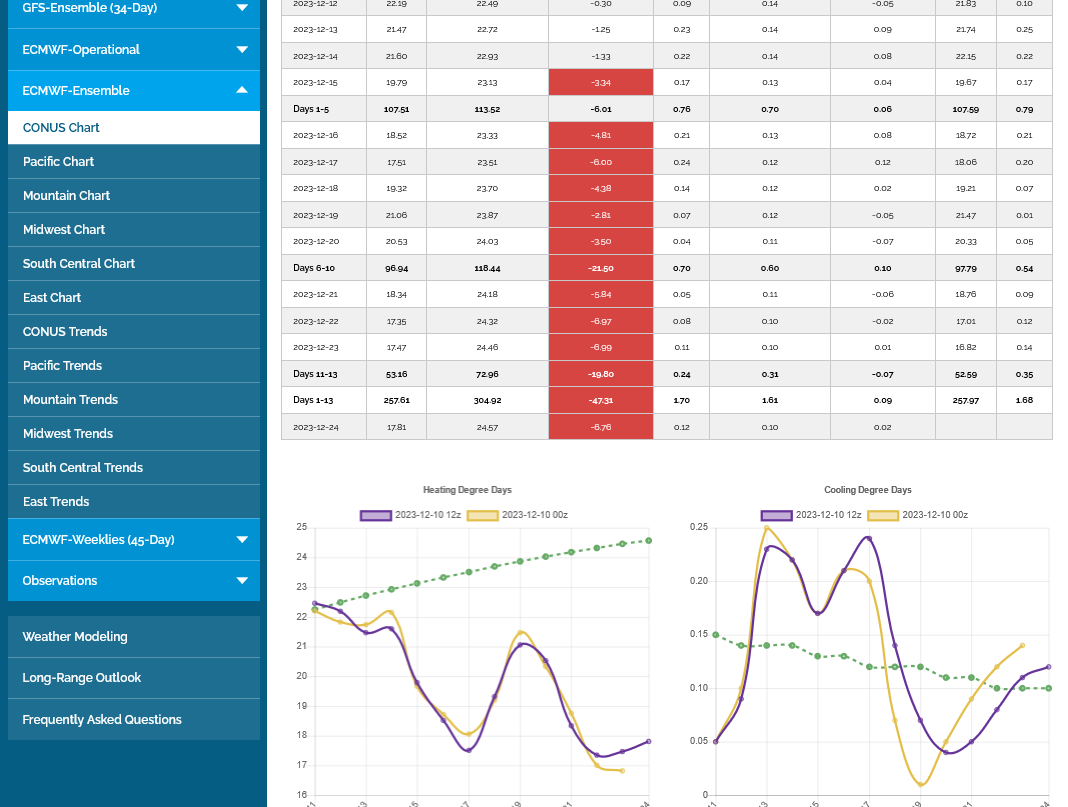
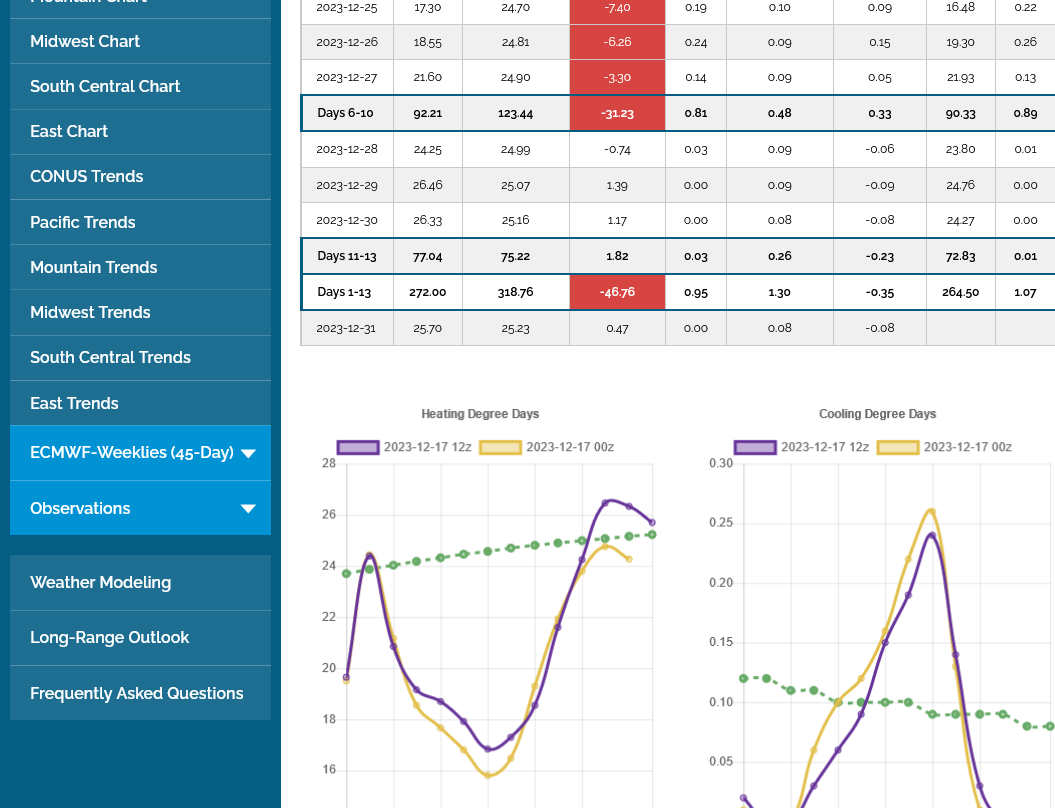
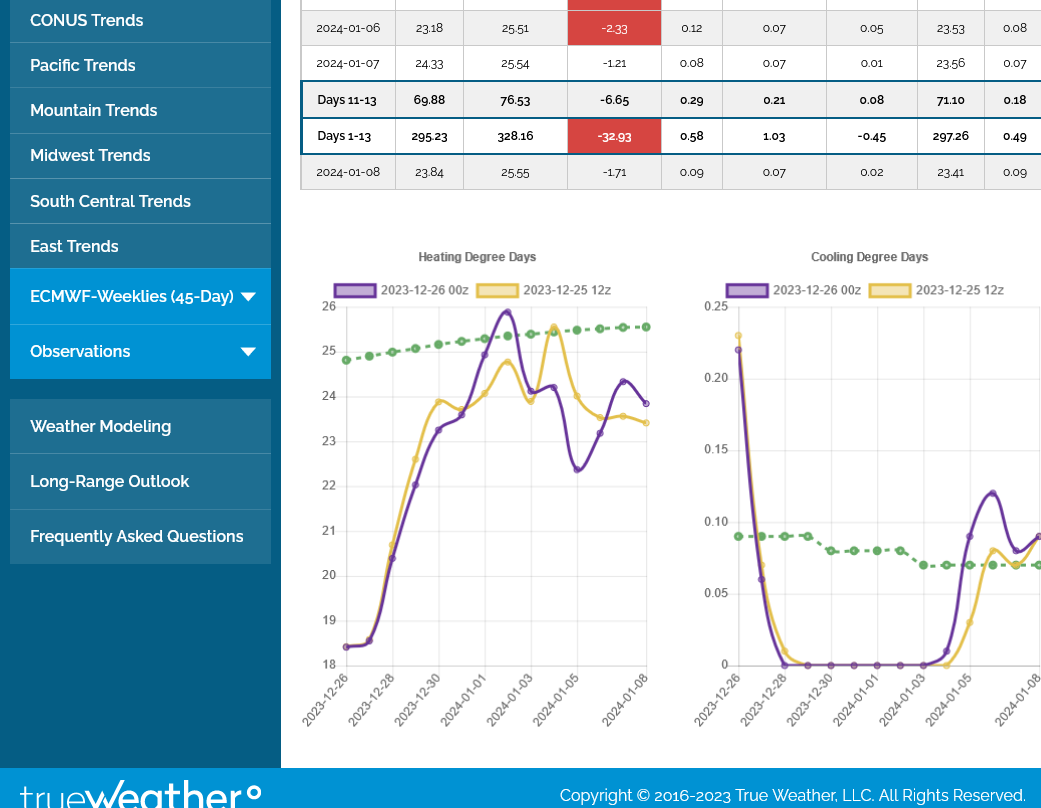
All the models have been MUCH colder since Sunday Evening. The last 12z GEFS was a whopping +27 HDDs vs the 18z run (18 hours prior) yesterday evening!!!
This graph below depicts that exactly on the left. The last 12z run is in purple(coldest). The 18z run from Sunday evening is in blue(mildest). Each run has been getting progressively colder.
The slowly increasing, dashed green line on the left is the historical average HDD value. Below that line is mild vs average. Above that line is cold vs average.
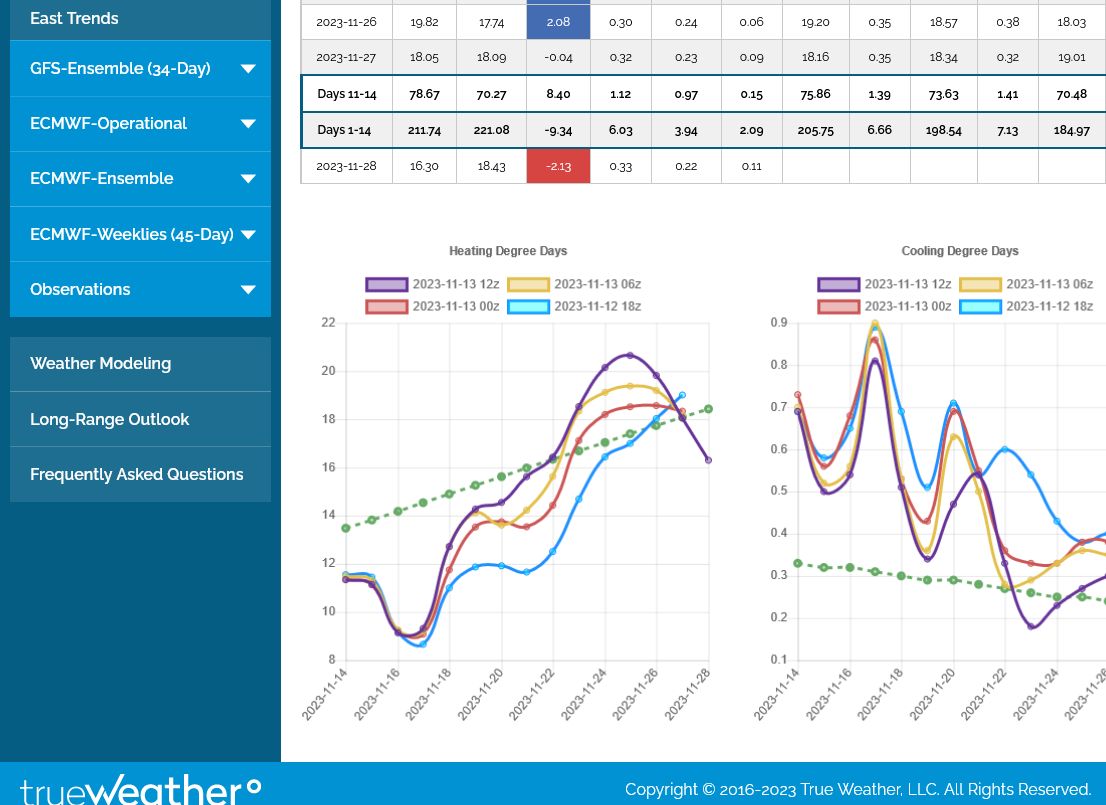
Natural gas futures retreated in early trading Tuesday as overnight forecast trends eased back on cold expectations for later this month, though gains from the previous session were largely preserved. The December Nymex contract was down 1.9 cents to $3.178/MMBtu at around 8:47 a.m. ET after rallying 16.4 cents Monday. A mix of overnight forecast…
++++++++++++
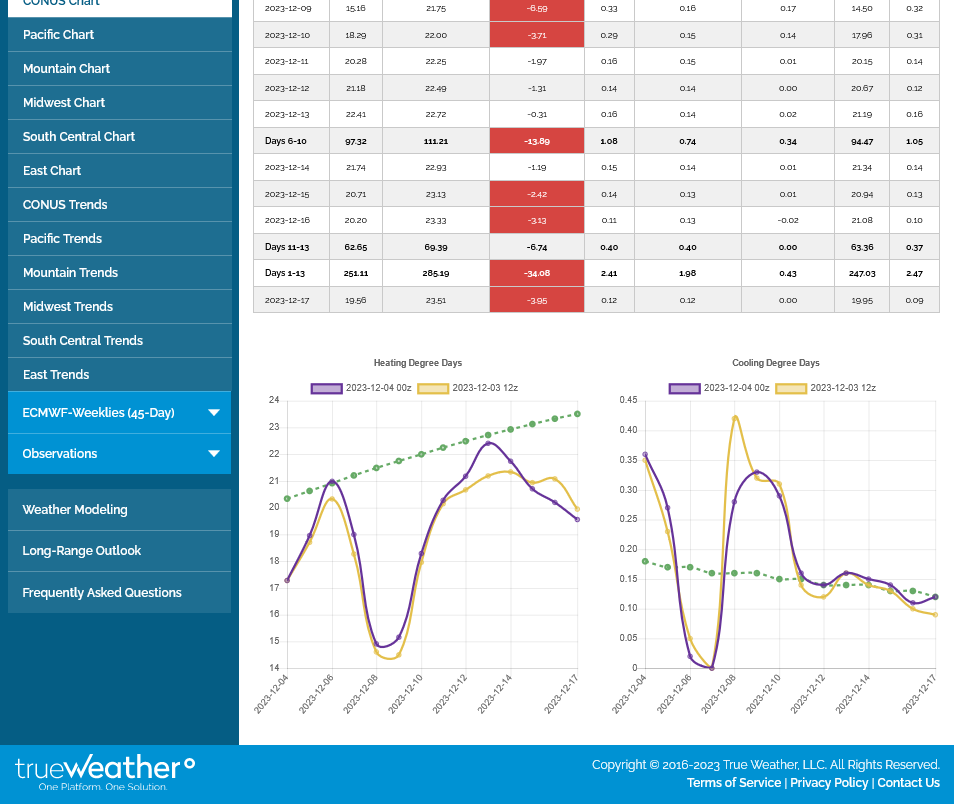
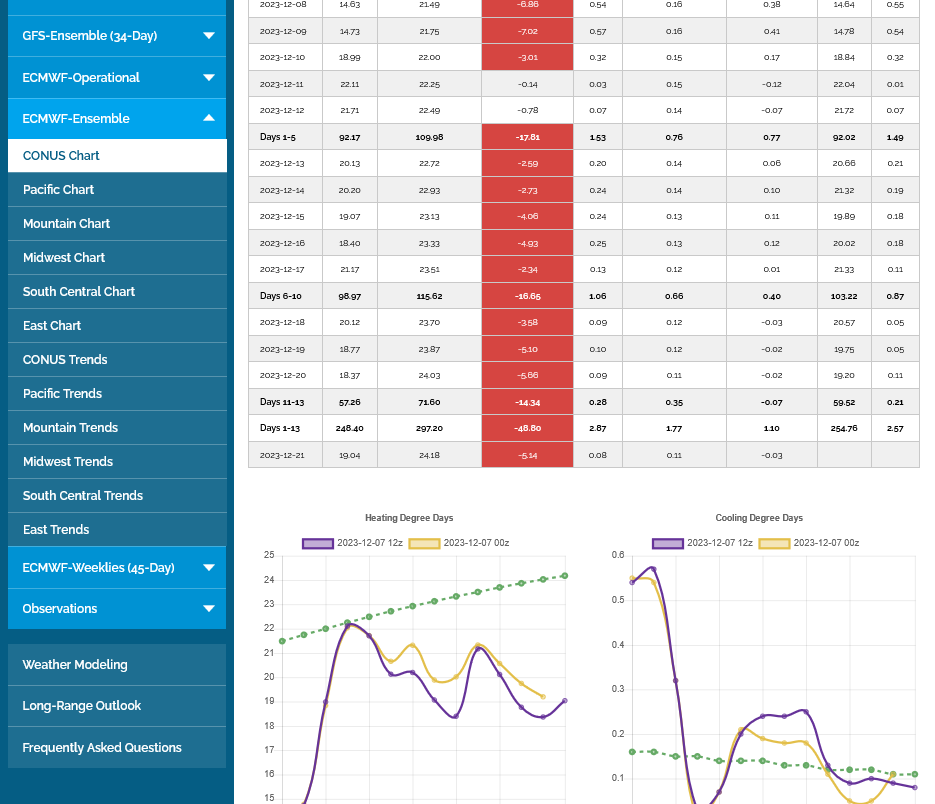
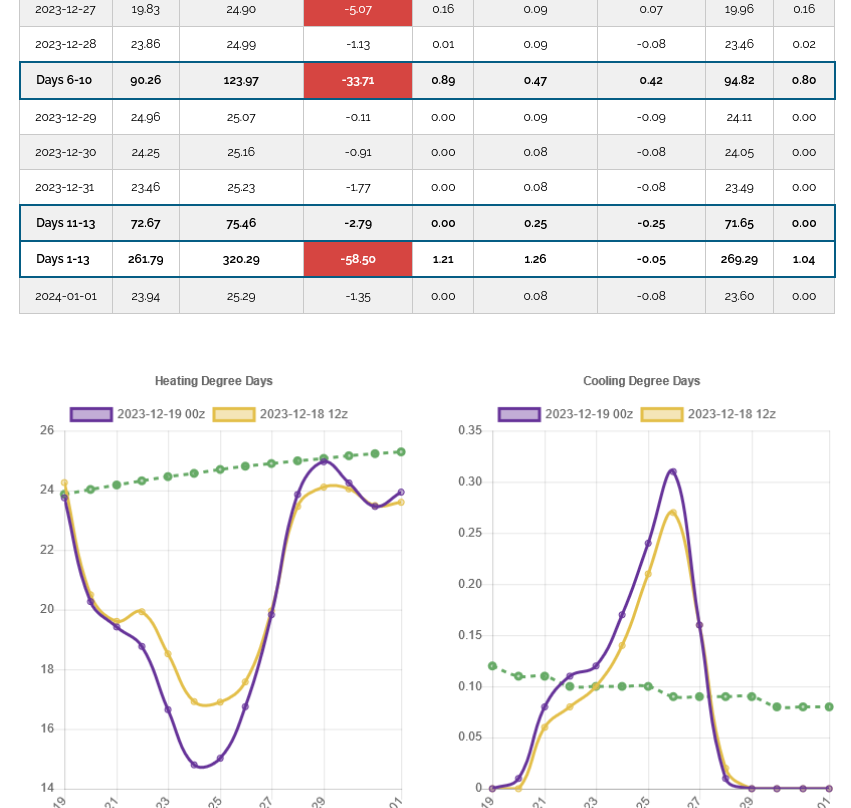
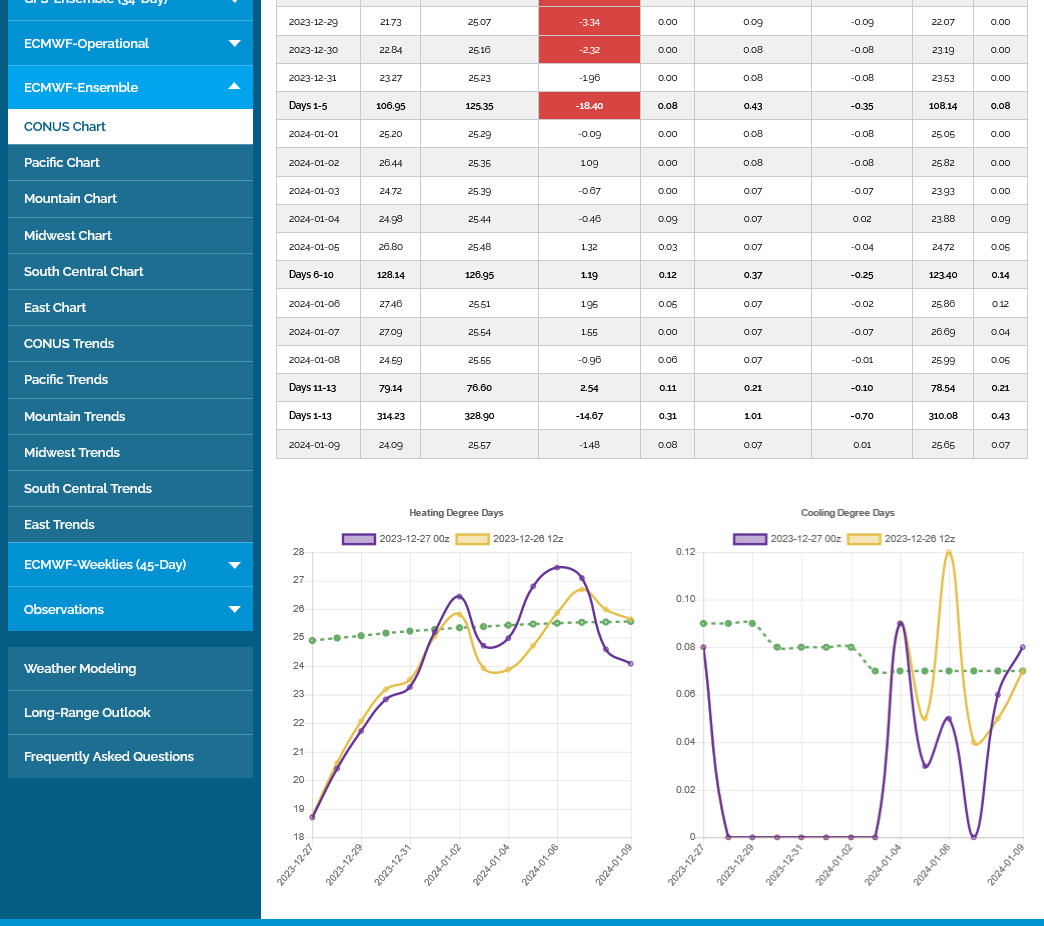
0z European model -7 HDDS to the bearish side vs the previous 12z run! Purple line on the left graph below. Brown is the previous run. Green is the slowly increasing average. Despite being less cold, the purple line still gets above the green line/average.
This EIA report was for 2 weeks for the first time ever.
+60 Bcf this past week and -6 Bcf for the previous week.
They released data for each week separately, so I was confused in my communication of what would happen above which assumed wrongly, that it would just be 1 number for 2 weeks.
The market will treat it like that though.
The spike lower on the release, tells us the market thought it was bearish. although we were already a bit lower before that.
https://ir.eia.gov/ngs/ngs.html
![]()
for week ending November 10, 2023 | Released: November 16, 2023 at 10:30 a.m. | Next Release: November 22, 2023
| Working gas in underground storage, Lower 48 states Summary text CSV JSN | |||||||||||||||||||||||||
|---|---|---|---|---|---|---|---|---|---|---|---|---|---|---|---|---|---|---|---|---|---|---|---|---|---|
| Historical Comparisons | |||||||||||||||||||||||||
| Stocks billion cubic feet (Bcf) | Year ago (11/10/22) | 5-year average (2018-22) | |||||||||||||||||||||||
| Region | 11/10/23 | 11/03/23 | net change | implied flow | Bcf | % change | Bcf | % change | |||||||||||||||||
| East | 931 | 924 | 7 | 7 | 880 | 5.8 | 897 | 3.8 | |||||||||||||||||
| Midwest | 1,116 | 1,105 | 11 | 11 | 1,082 | 3.1 | 1,075 | 3.8 | |||||||||||||||||
| Mountain | 256 | 253 | 3 | 3 | 208 | 23.1 | 210 | 21.9 | |||||||||||||||||
| Pacific | 292 | 284 | 8 | 8 | 242 | 20.7 | 276 | 5.8 | |||||||||||||||||
| South Central | 1,238 | 1,206 | 32 | 32 | 1,223 | 1.2 | 1,173 | 5.5 | |||||||||||||||||
| Salt | 332 | 313 | 19 | 19 | 325 | 2.2 | 316 | 5.1 | |||||||||||||||||
| Nonsalt | 906 | 893 | 13 | 13 | 898 | 0.9 | 857 | 5.7 | |||||||||||||||||
| Total | 3,833 | 3,773 | 60 | 60 | 3,635 | 5.4 | 3,630 | 5.6 | |||||||||||||||||
Note: Working gas stocks in the Lower 48 states, for the week ending, November 3, 2023, totaled 3,773 Bcf, and the implied net withdrawal for the week totaled 6 Bcf. Information about the implied net change on a regional level is available in the history spreadsheet. Totals may not equal sum of components because of independent rounding. | |||||||||||||||||||||||||
Working gas in storage was 3,833 Bcf as of Friday, November 10, 2023, according to EIA estimates. This represents a net increase of 60 Bcf from the previous week. Stocks were 198 Bcf higher than last year at this time and 203 Bcf above the five-year average of 3,630 Bcf. At 3,833 Bcf, total working gas is within the five-year historical range.
For information on sampling error in this report, see Estimated Measures of Sampling Variability table below.

++++++++++++++++++++
Nymex natural gas futures were trading down sharply after the U.S. Energy Information Administration (EIA) on Thursday reported two weeks’ worth of natural gas storage data that landed bearishly outside expectations. EIA reported a net withdrawal of 6 Bcf of natural gas from storage in the week ended Nov. 3, lower than expected, and an…
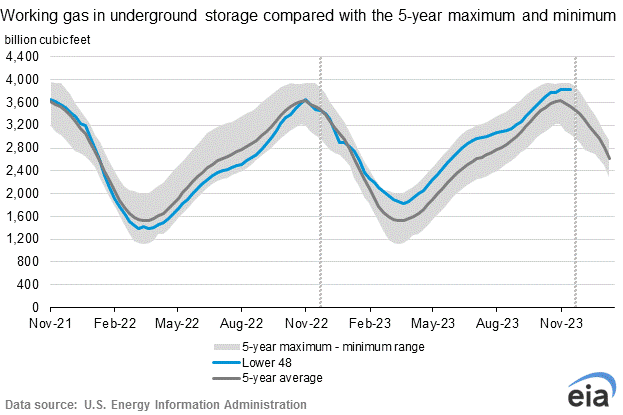
NOTE: The blue line on the graph above is close to the 5 year highs and well above the 5 year average going into the heating season.
Natural gas futures tested the $3/MMBtu level for the front month in early trading Friday as the market continued to mull evidence of oversupply in the latest government inventory data. The December Nymex contract was off 5.4 cents to $3.008 at around 8:41 a.m. ET. January was off 5.6 cents to $3.183. The U.S. Energy…
++++++++++++
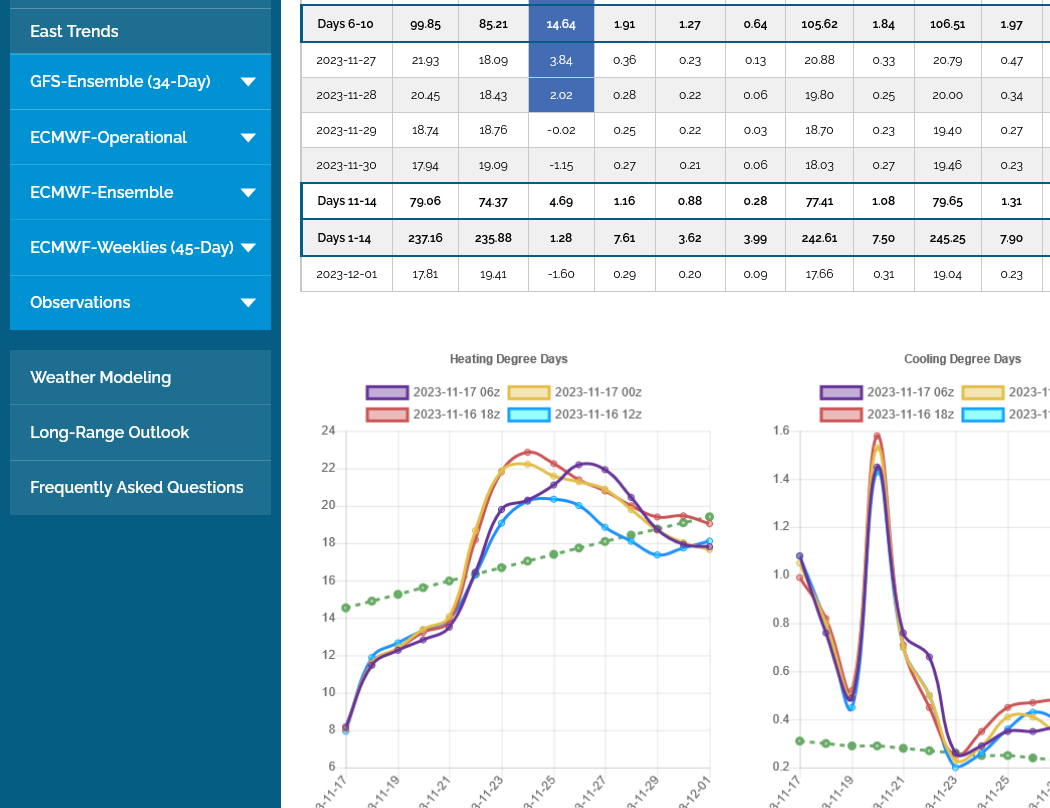
Weather is not really that bearish but temps do hover close to average at the end of the 2 week period below. Purple left is the last run of the 6z GEFS for HDDs the next 2 weeks. Green is the slowly increasing seasonal average HDDs.
Natural gas futures held steady in early trading Tuesday as the market mulled a mixed forecast outlook for late November into early December. After locking in day/day losses the past three sessions, the December Nymex contract was unchanged at $2.882 as of 8:46 a.m. ET. Weather data overnight continued a recent stretch of “wild swings,”…
+++++++++++++
7 day temps for the next EIA report that comes out ON WEDNESDAY this week.
We knew that weather was coming a couple of weeks ago and dialed that into the price but it WILL BE a bearish one compared to the HISTORICAL average. Compared to market expectations is what will cause the reaction after the release:
https://www.cpc.ncep.noaa.gov/products/tanal/temp_analyses.php
Natural gas futures probed modestly higher early Wednesday as traders awaited the latest government inventory data, a potentially pivotal follow-up to the decidedly bearish result from last week’s release. The December Nymex contract was up 3.2 cents to $2.878/MMBtu at around 8:42 a.m. ET. The December contract posted a fourth consecutive daily decline on Tuesday,…
+++++++++++++++
After chilly weather the next 10 days, the weather turns much milder and bearish. The market will almost always give the most weight to CHANGES in the forecast and changes are almost always the greatest in the later part of the forecast which is least known.
This was the last 2 runs of the 2 week, European model. HDDs are left and purple was the last 0z run, that was +2 HDDs vs the previous run tan. A tiny bit bullish but the pattern is getting milder late in the period which superimposes a strong bearish impact long term on individual runs like this. The dashed green line is the historical average which will continue to slowly increase until mid January when the climatological peak in HDDs occurs.
CDDs on the right are too tiny to matter until around late April but especially May. The scale on the right has minuscule numbers on the Y axis.
EIA report in an hour will cause the price to spike.
The EIA report comes out at 11am.
Price spike higher after the release tells us the market thought it was bullish!
However, note the blue line on the graph below. Current ng in storage is near the top of the 5 year average and not that far from the highest ever(the historical peaks are typically in mid-November as the graph shows) A cold Winter can cause massive drawdowns but a mild Winter is going to result in a glut.
https://ir.eia.gov/ngs/ngs.html
![]()
for week ending November 17, 2023 | Released: November 22, 2023 at 12:00 p.m. | Next Release: November 30, 2023
| Working gas in underground storage, Lower 48 states Summary text CSV JSN | |||||||||||||||||||||||||
|---|---|---|---|---|---|---|---|---|---|---|---|---|---|---|---|---|---|---|---|---|---|---|---|---|---|
| Historical Comparisons | |||||||||||||||||||||||||
| Stocks billion cubic feet (Bcf) | Year ago (11/17/22) | 5-year average (2018-22) | |||||||||||||||||||||||
| Region | 11/17/23 | 11/10/23 | net change | implied flow | Bcf | % change | Bcf | % change | |||||||||||||||||
| East | 918 | 931 | -13 | -13 | 868 | 5.8 | 881 | 4.2 | |||||||||||||||||
| Midwest | 1,118 | 1,116 | 2 | 2 | 1,066 | 4.9 | 1,058 | 5.7 | |||||||||||||||||
| Mountain | 255 | 256 | -1 | -1 | 204 | 25.0 | 207 | 23.2 | |||||||||||||||||
| Pacific | 296 | 292 | 4 | 4 | 233 | 27.0 | 273 | 8.4 | |||||||||||||||||
| South Central | 1,240 | 1,238 | 2 | 2 | 1,204 | 3.0 | 1,158 | 7.1 | |||||||||||||||||
| Salt | 331 | 332 | -1 | -1 | 319 | 3.8 | 312 | 6.1 | |||||||||||||||||
| Nonsalt | 909 | 906 | 3 | 3 | 885 | 2.7 | 846 | 7.4 | |||||||||||||||||
| Total | 3,826 | 3,833 | -7 | -7 | 3,575 | 7.0 | 3,577 | 7.0 | |||||||||||||||||
Totals may not equal sum of components because of independent rounding. | |||||||||||||||||||||||||
Working gas in storage was 3,826 Bcf as of Friday, November 17, 2023, according to EIA estimates. This represents a net decrease of 7 Bcf from the previous week. Stocks were 251 Bcf higher than last year at this time and 249 Bcf above the five-year average of 3,577 Bcf. At 3,826 Bcf, total working gas is within the five-year historical range.
For information on sampling error in this report, see Estimated Measures of Sampling Variability table below.
The U.S. Energy Information Administration (EIA) on Wednesday reported a withdrawal of 7 Bcf of natural gas from storage for the week ended Nov. 17. The draw proved steeper than expectations and sent Nymex natural gas futures higher. December Nymex futures were trading marginally flat on the day at around $2.843/MMBtu ahead of the noon…
+++++++++++++
metmike: The weather turns pretty mild and BEARISH in week 2!
European model was -10 HDDs overnight. VERY mild in week 2. Purple line on the left is the last 0z run. Tan line was the previous 12z run, 12 hours earlier. Dashed green is the slowly increasing seasonal average.
NG had a tiny gap lower, possibly on the reduced risk for extreme cold in the 2nd half of December.
Mild temps last week so the EIA in an hour will be bearish by late November standards but the market traded that 2 weeks ago.
The reaction at 9:30am will be entirely from the number compared to already dialed in EXPECTATIONS.
The weather forecast continues BEARISH for at least the next 2 weeks and has put great pressure on the market this week.
https://www.cpc.ncep.noaa.gov/products/tanal/temp_analyses.php
Last 0z run of the European model solution below in purple/left for HDDs. Green is average.
https://ir.eia.gov/ngs/ngs.html
+10 Bcf. Anytime you get an injection at this time of year its pretty bearish. Likely not far from market expectations. Note the blue line on the graph below being almost at the top of the 5 year range for storage.
Storage is almost full and we are in great shape for the upcoming Winter. The next 2 weeks of mildish weather will just continue that mentality.
Extreme cold will still give up tradable spikes higher but they will be limited because the market will never feel threatened regarding storage.
for week ending November 24, 2023 | Released: November 30, 2023 at 10:30 a.m. | Next Release: December 7, 2023
| Working gas in underground storage, Lower 48 states Summary text CSV JSN | |||||||||||||||||||||||||
|---|---|---|---|---|---|---|---|---|---|---|---|---|---|---|---|---|---|---|---|---|---|---|---|---|---|
| Historical Comparisons | |||||||||||||||||||||||||
| Stocks billion cubic feet (Bcf) | Year ago (11/24/22) | 5-year average (2018-22) | |||||||||||||||||||||||
| Region | 11/24/23 | 11/17/23 | net change | implied flow | Bcf | % change | Bcf | % change | |||||||||||||||||
| East | 915 | 918 | -3 | -3 | 844 | 8.4 | 864 | 5.9 | |||||||||||||||||
| Midwest | 1,111 | 1,118 | -7 | -7 | 1,043 | 6.5 | 1,041 | 6.7 | |||||||||||||||||
| Mountain | 252 | 255 | -3 | -3 | 198 | 27.3 | 204 | 23.5 | |||||||||||||||||
| Pacific | 298 | 296 | 2 | 2 | 227 | 31.3 | 271 | 10.0 | |||||||||||||||||
| South Central | 1,260 | 1,240 | 20 | 20 | 1,184 | 6.4 | 1,155 | 9.1 | |||||||||||||||||
| Salt | 343 | 331 | 12 | 12 | 315 | 8.9 | 316 | 8.5 | |||||||||||||||||
| Nonsalt | 917 | 909 | 8 | 8 | 869 | 5.5 | 839 | 9.3 | |||||||||||||||||
| Total | 3,836 | 3,826 | 10 | 10 | 3,495 | 9.8 | 3,533 | 8.6 | |||||||||||||||||
Totals may not equal sum of components because of independent rounding. | |||||||||||||||||||||||||
Working gas in storage was 3,836 Bcf as of Friday, November 24, 2023, according to EIA estimates. This represents a net increase of 10 Bcf from the previous week. Stocks were 341 Bcf higher than last year at this time and 303 Bcf above the five-year average of 3,533 Bcf. At 3,836 Bcf, total working gas is within the five-year historical range.
For information on sampling error in this report, see Estimated Measures of Sampling Variability table below.
Natural gas futures reversed early day gains Thursday to fall for a fifth consecutive session after the weekly storage report printed a build that landed at the high end of expectations. The January Nymex natural gas futures contract settled at $2.802/MMBtu, down two-tenths of a cent day/day. February fell six-tenths of a cent to $2.763.…
+++++++++
Always tough for NG to go up when the forecast is this mild at this time of year.
1. 10 years. August 2022 MAJOR HIGH April 2023 MAJOR LOW
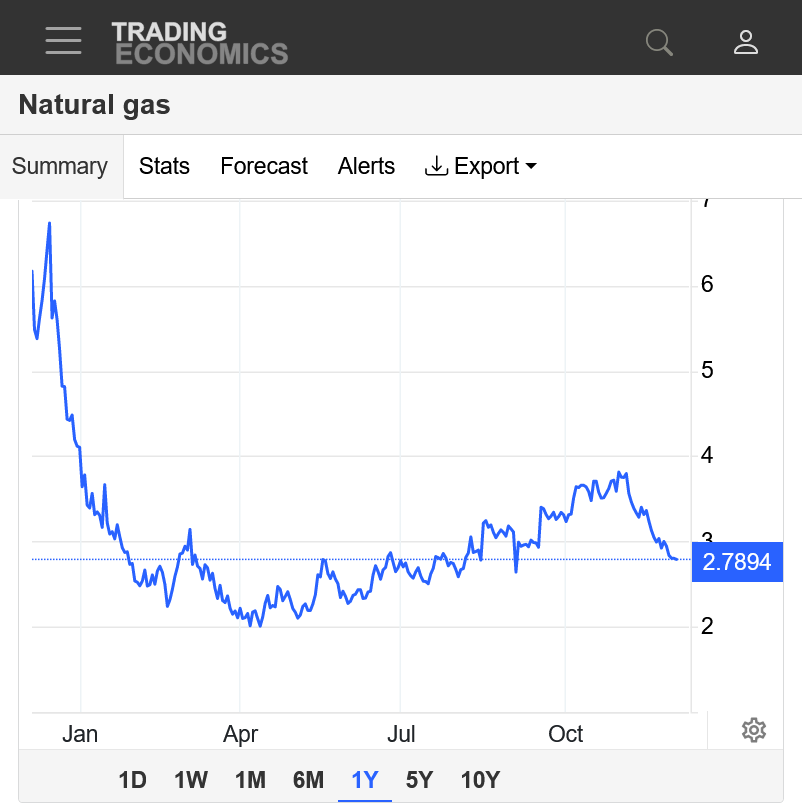
2. 1 year. After the April 2023 low, uptrend culminating with early November top/peak
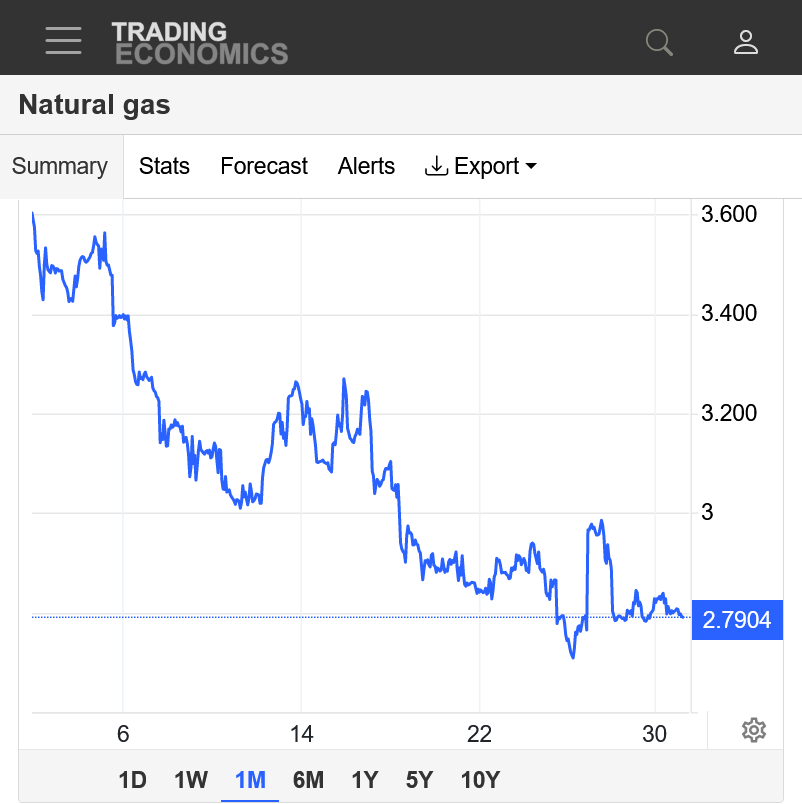
3. 1 month. New downtrend since early November. In an area of potential support if it would turn sharply colder. If it stays mild the next couple of weeks that support will likely be toast and we drop below Mondays lows. However, I believe this graph may be misleading because that low was tracking the December contract before January became the front month. December was trading substantially lower than January.
4. 1 week. Spike higher related, I believe was this chart going from using the getting ready to expire December price to the higher, next month January with is now the front month. Potential support area right here but we need help from the weather with storage packed full. The low this week was Monday at 5:30am On this chart. Not correct! That was actually the DECEMBER price, so January should be already below the January support.
5. just checked on my trading platform and these charts are in fact using December until the Tuesday open, then flipping to January, which was trading almost 2,000/contract higher. Fact is that we had spike Lows for this move We’d and and Thu(after the bearish EIA) and are down to those lows fight now….likely going to break them unless the weather suddenly turns colder.
NGF24 is down 10,000/contract since the November high! The recent cold snap was hardly able to produce a dead cat bounce.
The technical picture is extremely negative because of VERY mild weather and near full storage and very negative seasonals.
https://tradingeconomics.com/commodity/natural-Dr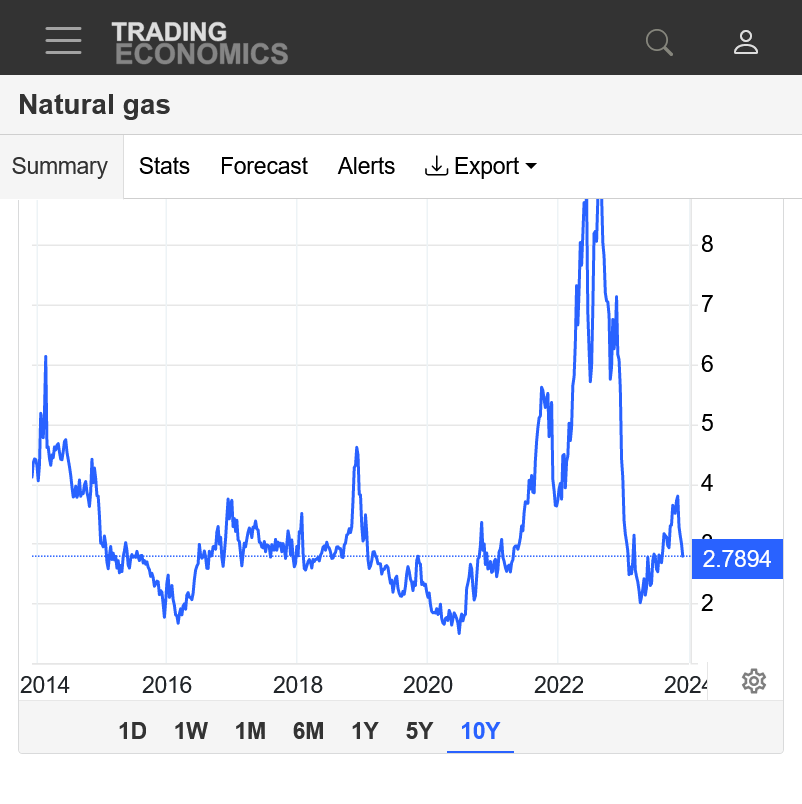
Modest gap lower on the open for this new week.
No signs of cold for at least 2 weeks, possibly mild thru much of December!
Below/left is the HDD graph of the last 4 runs of the GEFS, with the purple line being the latest 18z run. FAR below the slowly increasing green line which represents the seasonal average. Extremely bearish for December with chock full storage and negative seasonals.
https://charts.equityclock.com/natural-gas-futures-ng-seasonal-chart

The EIA report this Thursday should show a robust drawdown from decent cold the week AFTER Thanksgiving.
https://www.cpc.ncep.noaa.gov/products/tanal/temp_analyses.php
As milder temperatures continued to blanket Lower 48 forecast maps over the weekend, suggesting weak weather-driven demand could persist well into December, natural gas futures were trading sharply lower early Monday. After carving out a low of $2.688/MMBtu earlier in the morning, the January Nymex contract was off 9.6 cents to $2.718 at around 8:40…
+++++++++++++++
The overnight guidance was a bit LESS mild. The HDD below for the last 0z European model(left bottom/purple) was +4 HDDs. However, these solutions were NOT from a pattern chance to colder. They were from adjusting the same bearish pattern to make some days slightly colder.
+++++++++++++
No sign of any significant cold or pattern change. Just a few days in the 2 week forecasts that were not quite as mild that added several HDs overnight and an extremely oversold market looking for an excuse for a dead cat bounce.
i hear crazy talk again of ng down to zero etc....any thoughts where an oversold bounce happens
Thanks cc!
No telling how low we go but we have 3 extremely powerful items pressuring NG right now.
1. Mild weather/no sign of major cold.
2. Storage is almost full
3. Seasonals. Don't be long at this time of year unless we have major cold in the forecast!
https://www.cpc.ncep.noaa.gov/products/predictions/814day/index.php
https://ir.eia.gov/ngs/ngs.html
https://charts.equityclock.com/natural-gas-futures-ng-seasonal-chart
would u say the situation is better equal to or worse than last winter regarding oversupply
As expected, the EIA report showed a robust drawdown.
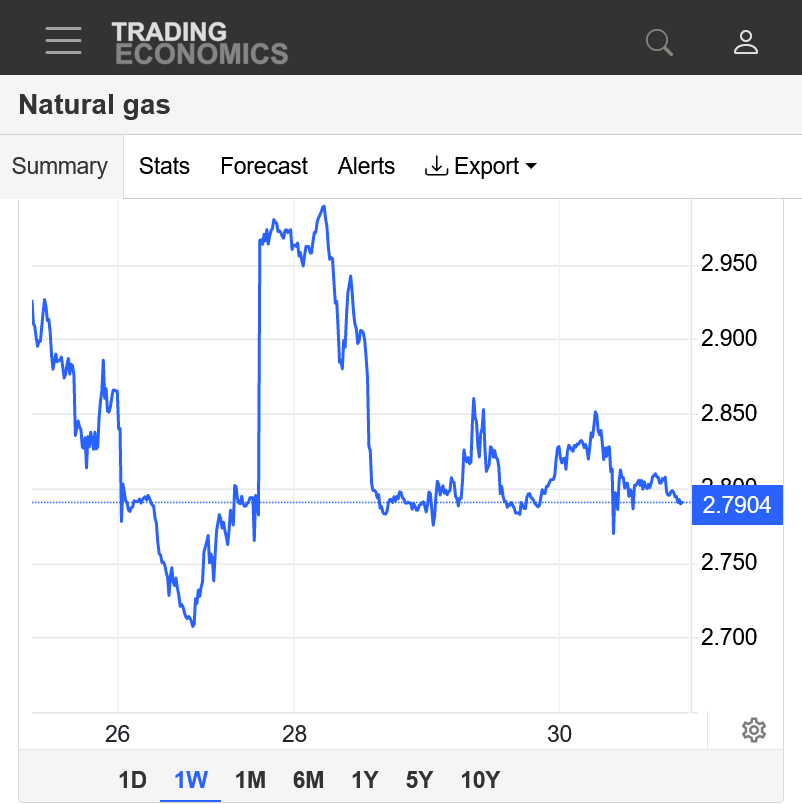
Re: Re: Re: Re: Re: Natural Gas 11-12-23
By metmike - Dec. 3, 2023, 8:49 p.m.
+++++++++++++++
This caused a spike higher on the release. We'll see if the market wants to make anything of this and stay supported because the forecast is BEARISH!!!
The 0z European model was a whopping -10 HDDs (purple/left below) to the bearish side compared to the previous 12z run.
THERE IS NO SIGN OF MAJOR COLD FOR AT LEAST 2 WEEKS!
+++++++++++++
-117 Bcf below! Note the blue line shows a big surplus vs the dark gray, 5 year average line.
Mild weather the rest of December will WIDEN that surplus and that's why prices have been collapsing lower.
https://ir.eia.gov/ngs/ngs.html
![]()
for week ending December 1, 2023 | Released: December 7, 2023 at 10:30 a.m. | Next Release: December 14, 2023
| Working gas in underground storage, Lower 48 states Summary text CSV JSN | |||||||||||||||||||||||||
|---|---|---|---|---|---|---|---|---|---|---|---|---|---|---|---|---|---|---|---|---|---|---|---|---|---|
| Historical Comparisons | |||||||||||||||||||||||||
| Stocks billion cubic feet (Bcf) | Year ago (12/01/22) | 5-year average (2018-22) | |||||||||||||||||||||||
| Region | 12/01/23 | 11/24/23 | net change | implied flow | Bcf | % change | Bcf | % change | |||||||||||||||||
| East | 876 | 915 | -39 | -39 | 835 | 4.9 | 848 | 3.3 | |||||||||||||||||
| Midwest | 1,082 | 1,111 | -29 | -29 | 1,030 | 5.0 | 1,021 | 6.0 | |||||||||||||||||
| Mountain | 245 | 252 | -7 | -7 | 194 | 26.3 | 200 | 22.5 | |||||||||||||||||
| Pacific | 289 | 298 | -9 | -9 | 218 | 32.6 | 266 | 8.6 | |||||||||||||||||
| South Central | 1,228 | 1,260 | -32 | -32 | 1,190 | 3.2 | 1,150 | 6.8 | |||||||||||||||||
| Salt | 334 | 343 | -9 | -9 | 325 | 2.8 | 320 | 4.4 | |||||||||||||||||
| Nonsalt | 894 | 917 | -23 | -23 | 864 | 3.5 | 829 | 7.8 | |||||||||||||||||
| Total | 3,719 | 3,836 | -117 | -117 | 3,465 | 7.3 | 3,485 | 6.7 | |||||||||||||||||
Totals may not equal sum of components because of independent rounding. | |||||||||||||||||||||||||
Working gas in storage was 3,719 Bcf as of Friday, December 1, 2023, according to EIA estimates. This represents a net decrease of 117 Bcf from the previous week. Stocks were 254 Bcf higher than last year at this time and 234 Bcf above the five-year average of 3,485 Bcf. At 3,719 Bcf, total working gas is within the five-year historical range.
For information on sampling error in this report, see Estimated Measures of Sampling Variability table below.
Note: The shaded area indicates the range between the historical minimum and maximum values for the weekly series from 2018 through 2022. The dashed vertical lines indicate current and year-ago weekly periods.
The just out 12z European Ensemble model lost and ADDITIONAL 7 HDDs to the bearish side. Purple line bottom/left.
The dashed green is the slowly increasing seasonal HDDs.........going in the complete opposite direction of this extremely mild weather coming up in week 2!!
That's -17 HDDs over the past 2 runs. WOW! This has killed the bullish EIA report mentality!
January natural gas eked out marginal gains in early trading Friday as market participants weighed supportive inventory data against continued calls for mild December heating demand. The January Nymex contract was up 1.4 cents to $2.599/MMBtu at around 8:40 a.m. ET. February was up fractionally to $2.522. Contracts further along the strip fell into the…
+++++++++++++++++
Bullish EIA number yesterday but NG can't get any traction with a MEGA bearish weather outlook!
Any weekend weather changes? Bullish or bearish side?
Hi cc,
Still extremely bearish on every model thru 2 weeks!
Glad that you asked, cc!
The purple line on the left was the last 12z European model.
It was actually +8 HDDs vs the previous run based entirely on the southward adjustment of the same brand of cold. However, you will note how far below the average, dashed green line it is and in fact, the extremely mild disparity is greatest at the end of 2 weeks. 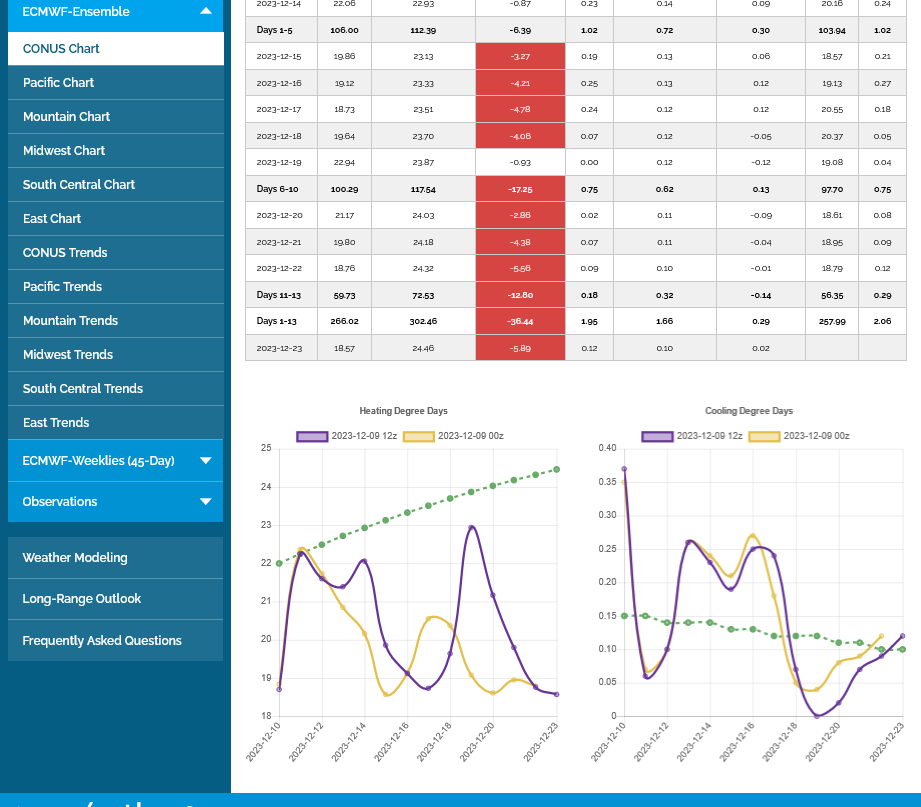
Zonal flow, spreading from west to east with near record temperatures in Canada. So air masses behind cold fronts will not be all that cold by December standards.
https://www.marketforum.com/forum/topic/83844/
https://www.marketforum.com/forum/topic/83844/#83852
https://www.marketforum.com/forum/topic/83844/#101131
Still no sign of any cold on any model for any time frame. Just the opposite!
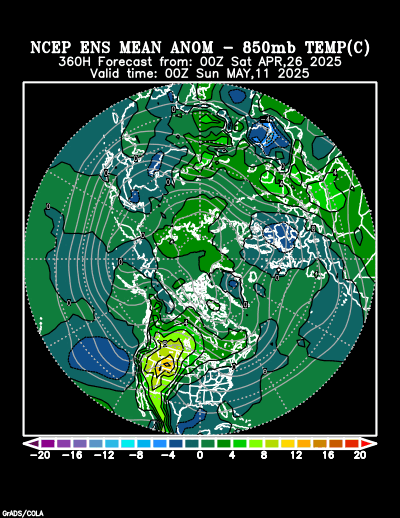
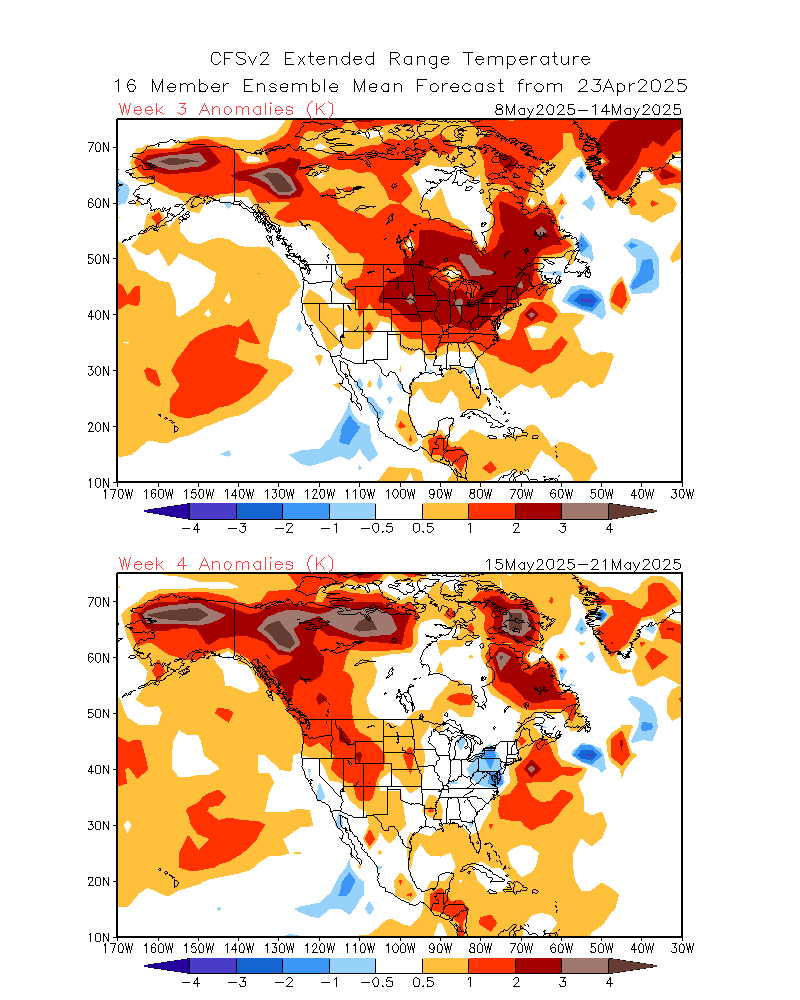
2 week 850 temp for ensemble mean anomaly
https://www.psl.noaa.gov/map/images/ens/t850anom_nh_alltimes.html
Week 3-4 forecasts don't have a great deal of skill.
https://www.cpc.ncep.noaa.gov/products/people/mchen/CFSv2FCST/weekly/
Temperatures below. These maps are 1 day old.
Big gap lower on the open which is no surprise considering how mild the weather forecast is!
These were the temperatures for this Thursday's EIA storage report. Should be a very small withdrawal for this time of year. No major cold anywhere during the first week of December.
https://www.cpc.ncep.noaa.gov/products/tanal/temp_analyses.php
+++++++++++++++++
Still no sign of cold! The last 12z European model HDDs on the left in purple. Previous 0z run from 12 hour earlier in tan. Slowly increasing normal HDD's in green. The disparity between average and the forecast is greatest at the end of the period.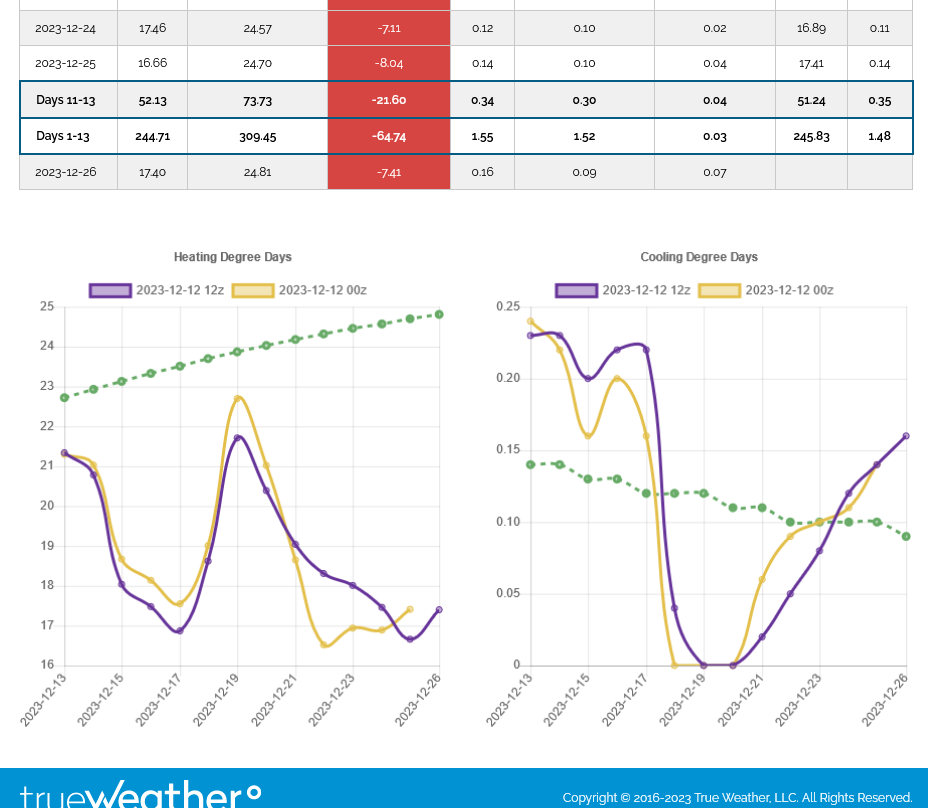
++++++++
Just to repeat: Don't be long NG at this time of year unless the pattern is turning SHARPLY colder.
https://charts.equityclock.com/natural-gas-futures-ng-seasonal-chart
++++++++
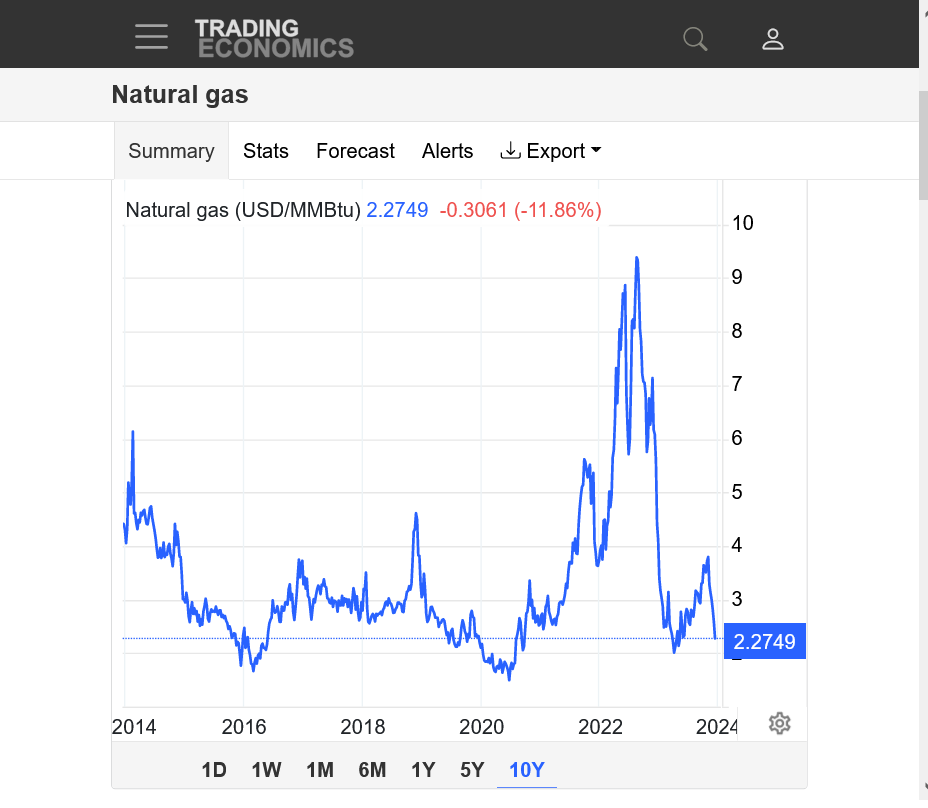
https://tradingeconomics.com/commodity/natural-gas
1. 10 years-spike high in Aug. 2022 caused record high production/financial incentivization.
2. 1 year-major low in April 2023 around $2 might be the next target.
3. 1 month
https://www.marketforum.com/forum/topic/83844/
+++++++++++++++++++++++
https://ir.eia.gov/ngs/ngs.html
for week ending December 8, 2023 | Released: December 14, 2023 at 10:30 a.m. | Next Release: December 21, 2023
| Working gas in underground storage, Lower 48 states Summary text CSV JSN | |||||||||||||||||||||||||
|---|---|---|---|---|---|---|---|---|---|---|---|---|---|---|---|---|---|---|---|---|---|---|---|---|---|
| Historical Comparisons | |||||||||||||||||||||||||
| Stocks billion cubic feet (Bcf) | Year ago (12/08/22) | 5-year average (2018-22) | |||||||||||||||||||||||
| Region | 12/08/23 | 12/01/23 | net change | implied flow | Bcf | % change | Bcf | % change | |||||||||||||||||
| East | 857 | 876 | -19 | -19 | 824 | 4.0 | 826 | 3.8 | |||||||||||||||||
| Midwest | 1,055 | 1,082 | -27 | -27 | 1,006 | 4.9 | 991 | 6.5 | |||||||||||||||||
| Mountain | 243 | 245 | -2 | -2 | 187 | 29.9 | 193 | 25.9 | |||||||||||||||||
| Pacific | 289 | 289 | 0 | 0 | 205 | 41.0 | 258 | 12.0 | |||||||||||||||||
| South Central | 1,219 | 1,228 | -9 | -9 | 1,198 | 1.8 | 1,137 | 7.2 | |||||||||||||||||
| Salt | 336 | 334 | 2 | 2 | 336 | 0.0 | 321 | 4.7 | |||||||||||||||||
| Nonsalt | 883 | 894 | -11 | -11 | 862 | 2.4 | 815 | 8.3 | |||||||||||||||||
| Total | 3,664 | 3,719 | -55 | -55 | 3,419 | 7.2 | 3,404 | 7.6 | |||||||||||||||||
Totals may not equal sum of components because of independent rounding. | |||||||||||||||||||||||||
Working gas in storage was 3,664 Bcf as of Friday, December 8, 2023, according to EIA estimates. This represents a net decrease of 55 Bcf from the previous week. Stocks were 245 Bcf higher than last year at this time and 260 Bcf above the five-year average of 3,404 Bcf. At 3,664 Bcf, total working gas is within the five-year historical range.
For information on sampling error in this report, see Estimated Measures of Sampling Variability table below.
metmike: Look how close the blue line is to being crammed full and near the record highs for this time of year. Dial in extremely mild weather the next 2 weeks and negative seasonals and ng prices can't get any traction, even after losing $14,000/contract since the start of November!
January Nymex natural gas futures settled the regular trading session higher on Thursday, backed by cooler weather trends. Still, more significant gains were relinquished as temperatures were forecasted to rise again. Meanwhile, the latest government storage report showed a withdrawal matching the figure modeled by NGI and most others, but it provided little additional support.…
+++++++++++
Cooler weather trends is stretching it.
++++++++++++++++
The added HDDs are mainly coming from mild air in the north being pushed farther southeast, where it's not so mild compared to average.
Turning colder the last week of December.
More this evening.
Hey Mike,
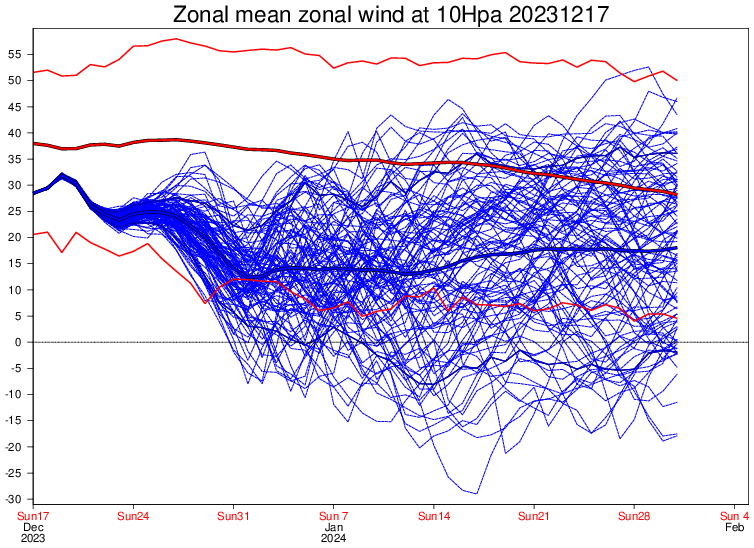
The EE is quite cold looking for here in the SE the last few days of Dec!
In addition, I continue to monitor the models for the possibility of an early Jan major SSW. If that occurs, that could lead to its own cold dominated period 1-3 weeks later in much of the US, especially E, that could last for 3-7 weeks. This from today’s Euro Weeklies shows the mean wind way up in the stratosphere at 10 mb along 60N. Those members that go below 0 are major SSWs. I count ~24% of members with one during 12/31-1/9, alone:
Wonderful post, Larry!
Like you mentioned the European model is the coldest by far. The last 12z run was +7.5 HDDs vs the previous run. Most of the chill is in the Southeast as you stated.
The source region for the cold in Canada will be extremely mild by Canadian standards in December but that same air mass dropping thousands of miles southeast will be chilly by much milder averages in that region.
Towards the end of week 2, below on the left the HDDs actually poke above the slowly increasing seasonal average in green.
European model was -4 HDDs and again, the main area with slightly below average temps will be the aSoutheast, where quite a few people live. There is no Arctic air associated with this pattern which features very mild temps in Canada, the source region for this cold.
With forecasts hinting that exceptional December warmth could eventually give way to January chills, natural gas futures continued to recover in early trading Monday. After rallying 9.9 cents on Friday, the January Nymex contract was up another 7.2 cents to $2.563/MMBtu at around 8:30 a.m. ET. EBW Analytics Group analyst Eli Rubin characterized the recent…
+++++++++++++
The last GEFS was +6 HDDs.
Building upper level heights in the higher latitudes could lead to a more favorable teleconnection to transport cold from high to mid latitudes in January. Initially, this will not be Arctic air.
GFS ensemble mean anomalies at 2 weeks. This is early January below and the chill is noticeable, mainly in the Southeast compared to average.
https://www.psl.noaa.gov/map/images/ens/z500anom_nh_alltimes.html 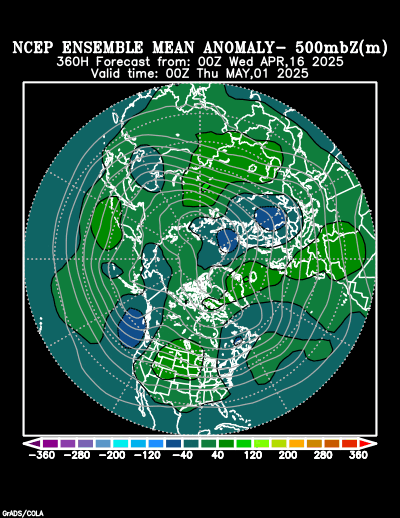
2 week 850 temp for ensemble mean anomaly
https://www.psl.noaa.gov/map/images/ens/t850anom_nh_alltimes.html
+++++++++++++++++++
Not cold enough yet for big gains!
With the natural gas market already facing a bearish temperature outlook to close out 2023, warmer overnight forecast trends saw futures retreat in early trading Tuesday. After settling 1.2 cents higher in the previous session — but well off the intraday high — the January Nymex contract was down 6.0 cents to $2.443/MMBtu at around…
++++++++++++
The European model was -7 HDDs overnight. Its the purple line on the left. It actually bumps up close to the average green line late next week! The pattern is still likely to morph to much colder in January!
+++++++
forgot to mention yesterday that the spike higher, filled the downside breakaway gap from earlier this month on Sunday Night, 12-10-23!
Technically, this is a gap and crap selling exhaustion formation after the gap was filled…especially after a long lived move in 1 direction. This should be seen as a likely exhaustion gap lower.
However, all we did was barely fill the gap, with no follow thru strength and have been sharply lower since then.
This shows that the weather forecast is in the drivers seat for ng at this time of year.
Any technical signatures are just going to be a response to the updated weather forecasts.
The forecast was much colder early Monday…..so the market went up.
Today its milder……now we’re down.
I think the lows are in, however with the pattern change to gradually colder and more supportive, starting next week and continuing in January.
A close above this weeks highs would help confirm the exhaustion gap and the lows for this move.
European model was a bit bullish at +4 HDDs but that came after the late morning GEFS was a whopping +12 HDDs! This is the main reason we've reversed higher from the big losses earlier in the morning.......bullish changes to the WEATHER FORECAST!
![]()
https://ir.eia.gov/ngs/ngs.html
for week ending December 15, 2023 | Released: December 21, 2023 at 10:30 a.m. | Next Release: December 28, 2023
| Working gas in underground storage, Lower 48 states Summary text CSV JSN | |||||||||||||||||||||||||
|---|---|---|---|---|---|---|---|---|---|---|---|---|---|---|---|---|---|---|---|---|---|---|---|---|---|
| Historical Comparisons | |||||||||||||||||||||||||
| Stocks billion cubic feet (Bcf) | Year ago (12/15/22) | 5-year average (2018-22) | |||||||||||||||||||||||
| Region | 12/15/23 | 12/08/23 | net change | implied flow | Bcf | % change | Bcf | % change | |||||||||||||||||
| East | 834 | 857 | -23 | -23 | 794 | 5.0 | 796 | 4.8 | |||||||||||||||||
| Midwest | 1,021 | 1,055 | -34 | -34 | 978 | 4.4 | 955 | 6.9 | |||||||||||||||||
| Mountain | 236 | 243 | -7 | -7 | 179 | 31.8 | 185 | 27.6 | |||||||||||||||||
| Pacific | 283 | 289 | -6 | -6 | 188 | 50.5 | 247 | 14.6 | |||||||||||||||||
| South Central | 1,203 | 1,219 | -16 | -16 | 1,199 | 0.3 | 1,114 | 8.0 | |||||||||||||||||
| Salt | 331 | 336 | -5 | -5 | 340 | -2.6 | 319 | 3.8 | |||||||||||||||||
| Nonsalt | 872 | 883 | -11 | -11 | 859 | 1.5 | 795 | 9.7 | |||||||||||||||||
| Total | 3,577 | 3,664 | -87 | -87 | 3,337 | 7.2 | 3,297 | 8.5 | |||||||||||||||||
Totals may not equal sum of components because of independent rounding. | |||||||||||||||||||||||||
Working gas in storage was 3,577 Bcf as of Friday, December 15, 2023, according to EIA estimates. This represents a net decrease of 87 Bcf from the previous week. Stocks were 240 Bcf higher than last year at this time and 280 Bcf above the five-year average of 3,297 Bcf. At 3,577 Bcf, total working gas is within the five-year historical range.
For information on sampling error in this report, see Estimated Measures of Sampling Variability table below.
+++++++++++++++
These were the milder than average temperatures last week that resulted in the smallish for the season drawdown. Note the blue line above. It's at the top of the 5 year range in storage in the gray shade. Storage levels are very robust right now!
However, NG prices are sharply high today and this week because of the pattern change coming up to much colder!
As mentioned earlier this week, THE LOWS ARE IN FOR NATURAL GAS!
https://www.cpc.ncep.noaa.gov/products/tanal/temp_analyses.php
++++++++++++
The U.S. Energy Information Administration (EIA) on Thursday reported an 87 Bcf withdrawal from natural gas storage for the week ended Dec. 15. The draw was an upside miss against expectations and sent Nymex natural gas futures higher. January futures traded 3.0 cents higher day/day at around $2.477/MMBtu ahead of the 10:30 a.m. ET report.…
++++++++++++++++
The main reason that we are up sharply is the colder weather pattern coming in January!
Get all the comprehensive weather here: https://www.marketforum.com/forum/topic/83844/
++++++++++++++++++
Weather maps have been advertising a lasting pattern change to colder all week and natural gas put in a solid bottom formation as a result. However, weather patterns can change abruptly. And the current El Nino could take over again and shift the forecast maps back to this early Winter, mild/zonal flow by the time we come back for trading in 3 days.
Weather models morphed a bit milder over the weekend. The 0z European model HDDs were -2 HDDs to the bearish side overnight, seen in purple on the left. Staying below the green average line.
Milder forecast trends over the Christmas holiday weekend and a less-than-impressive January temperature outlook helped pressure natural gas futures lower in early trading Tuesday. The January Nymex contract, set to expire Wednesday, was off 9.9 cents to $2.511/MMBtu at around 8:42 a.m. ET. February was down 9.0 cents to $2.400. Prior to Christmas Day, weather…
++++++++++
Added: Despite this there's strong indications of a much colder pattern in January and I still have high confidence that the lows are in,
Natural gas futures rallied early Wednesday, bolstered by colder shifts for early January in updated forecasts. The expiring January Nymex contract was up 12.2 cents to $2.672/MMBtu at around 8:47 a.m. ET. February was trading at $2.527, up 10.8 cents. Both the American and European weather models added heating degree days (HDD) to the outlook…
++++++++++++++
The 0z European model was +4 HDDs overnight after adding +10 HDDs 3 solutions ago, then taking half of them back, 2 solutions ago and now back to the coldest run compared to average in a long time!!
Note the purple line on the left, the last run actually spends some time above the average green line. Not an Arctic blast because the initial cold will be coming from Canada where mild air by Canadian standards will be flushed into much farther southern latitudes where its cold by those standards.
The markets will often respond to the CHANGE in a realitive sense compared to where we've been and what was expected more than the ABSOLUTE value compared to average. Expectations before compared to updated expectations.
If the forecast yesterday had been for a monster, bitter cold blast and we woke up to the current, MODEST cold air intrusion, NG would be LOWER instead of as much as +1,000/contract.
The front month, January expiring today makes things especially volatile and impacts the price dynamics too. The next month, Feb. is the one to gauge today.
The withdrawal on tomorrows EIA report will be dinky for this time of year.
The Southeast had chilly temperatures. The rest of the country was very mild.
https://ir.eia.gov/ngs/ngs.html
With January poised to bring a return to more seasonal conditions following exceptional December warmth, natural gas futures advanced in early trading Thursday. The February Nymex contract was up 6.1 cents to $2.498/MMBtu. Both the American and European weather models shifted warmer overnight to extend milder adjustments from runs on Wednesday, according to NatGasWeather. “Most…
+++++++++++++++++++
The models were all bearish overnight. -3 HDDs on the last 0z European model vs the last 12z run below(in purple) but the market sees the pattern change to much colder coming.
It's THE PATTERN, not individual model runs driving this bullish weather rally in NG the last couple of weeks. This put the bottom in when the potential SSW first showed up.
![]()
https://ir.eia.gov/ngs/ngs.html
for week ending December 22, 2023 | Released: December 28, 2023 at 10:30 a.m. | Next Release: January 4, 2024
| Working gas in underground storage, Lower 48 states Summary text CSV JSN | |||||||||||||||||||||||||
|---|---|---|---|---|---|---|---|---|---|---|---|---|---|---|---|---|---|---|---|---|---|---|---|---|---|
| Historical Comparisons | |||||||||||||||||||||||||
| Stocks billion cubic feet (Bcf) | Year ago (12/22/22) | 5-year average (2018-22) | |||||||||||||||||||||||
| Region | 12/22/23 | 12/15/23 | net change | implied flow | Bcf | % change | Bcf | % change | |||||||||||||||||
| East | 805 | 834 | -29 | -29 | 753 | 6.9 | 765 | 5.2 | |||||||||||||||||
| Midwest | 985 | 1,021 | -36 | -36 | 910 | 8.2 | 913 | 7.9 | |||||||||||||||||
| Mountain | 232 | 236 | -4 | -4 | 168 | 38.1 | 177 | 31.1 | |||||||||||||||||
| Pacific | 280 | 283 | -3 | -3 | 168 | 66.7 | 236 | 18.6 | |||||||||||||||||
| South Central | 1,187 | 1,203 | -16 | -16 | 1,145 | 3.7 | 1,084 | 9.5 | |||||||||||||||||
| Salt | 329 | 331 | -2 | -2 | 325 | 1.2 | 315 | 4.4 | |||||||||||||||||
| Nonsalt | 858 | 872 | -14 | -14 | 819 | 4.8 | 769 | 11.6 | |||||||||||||||||
| Total | 3,490 | 3,577 | -87 | -87 | 3,142 | 11.1 | 3,174 | 10.0 | |||||||||||||||||
Totals may not equal sum of components because of independent rounding | |||||||||||||||||||||||||
Working gas in storage was 3,490 Bcf as of Friday, December 22, 2023, according to EIA estimates. This represents a net decrease of 87 Bcf from the previous week. Stocks were 348 Bcf higher than last year at this time and 316 Bcf above the five-year average of 3,174 Bcf. At 3,490 Bcf, total working gas is within the five-year historical range.
metmike: No it's not! WE ARE NOW JUST ABOVE the Five-year historical range! Look at the blue line below! It just went outside the gray area. That's a bearish item, however the market dialed this into the price several weeks ago when the extremely mild weather that caused it, was first showing up on forecast weather models.
Note: The shaded area indicates the range between the historical minimum and maximum values for the weekly series from 2018 through 2022. The dashed vertical lines indicate current and year-ago weekly periods.
+++++++++++++++++
Mainly its the much colder weather pattern. We were already sharply higher BEFORE the EIA number was released.
I believe all the mild NWS extended forecasts the last few days are completely OUT TO LUNCH.
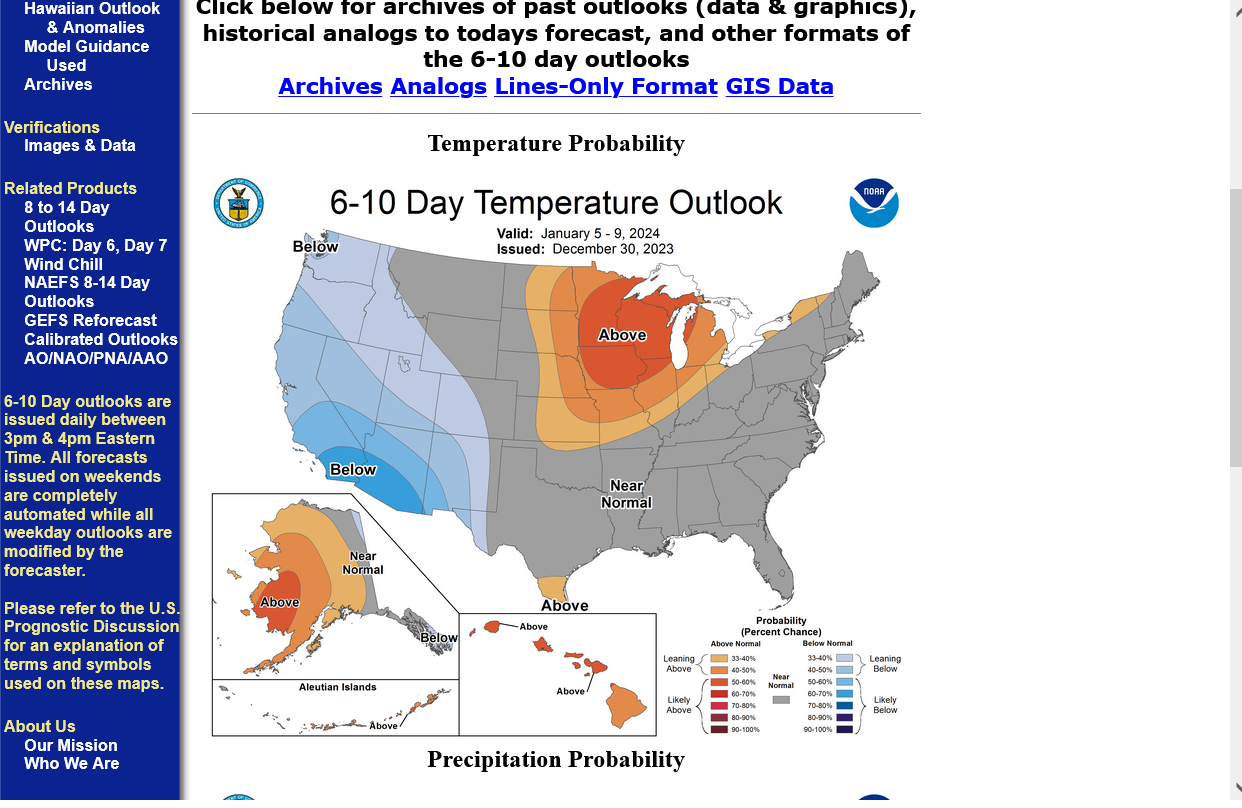
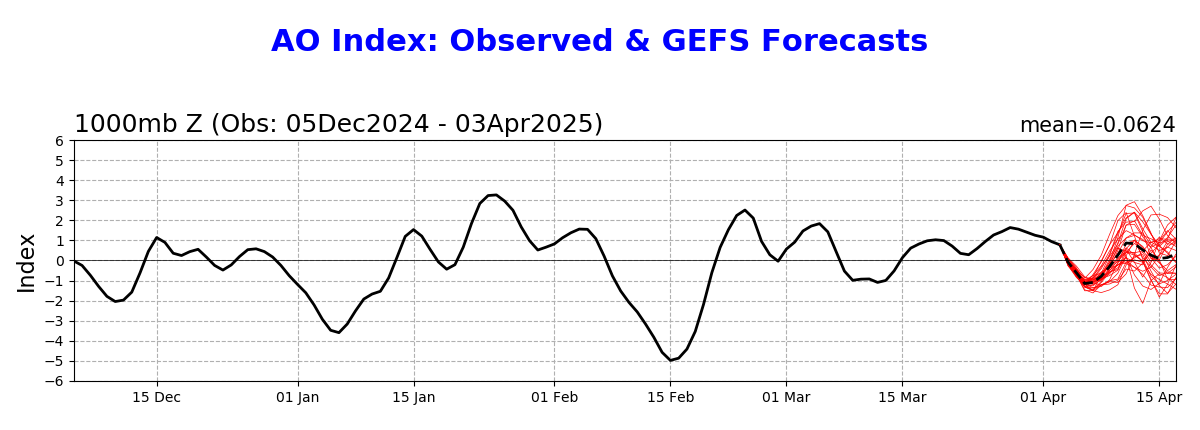
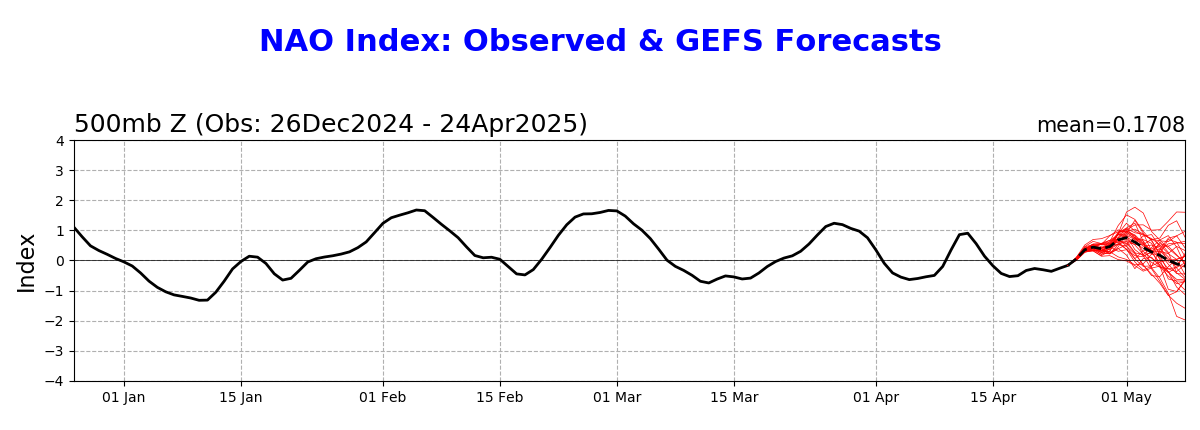
With the -AO, -NAO AND CROSS POLAR FLOW, the northern states are several categories TOO MILD in their just updated outlooks below.
Look for the updates to turn MUCH COLDER!
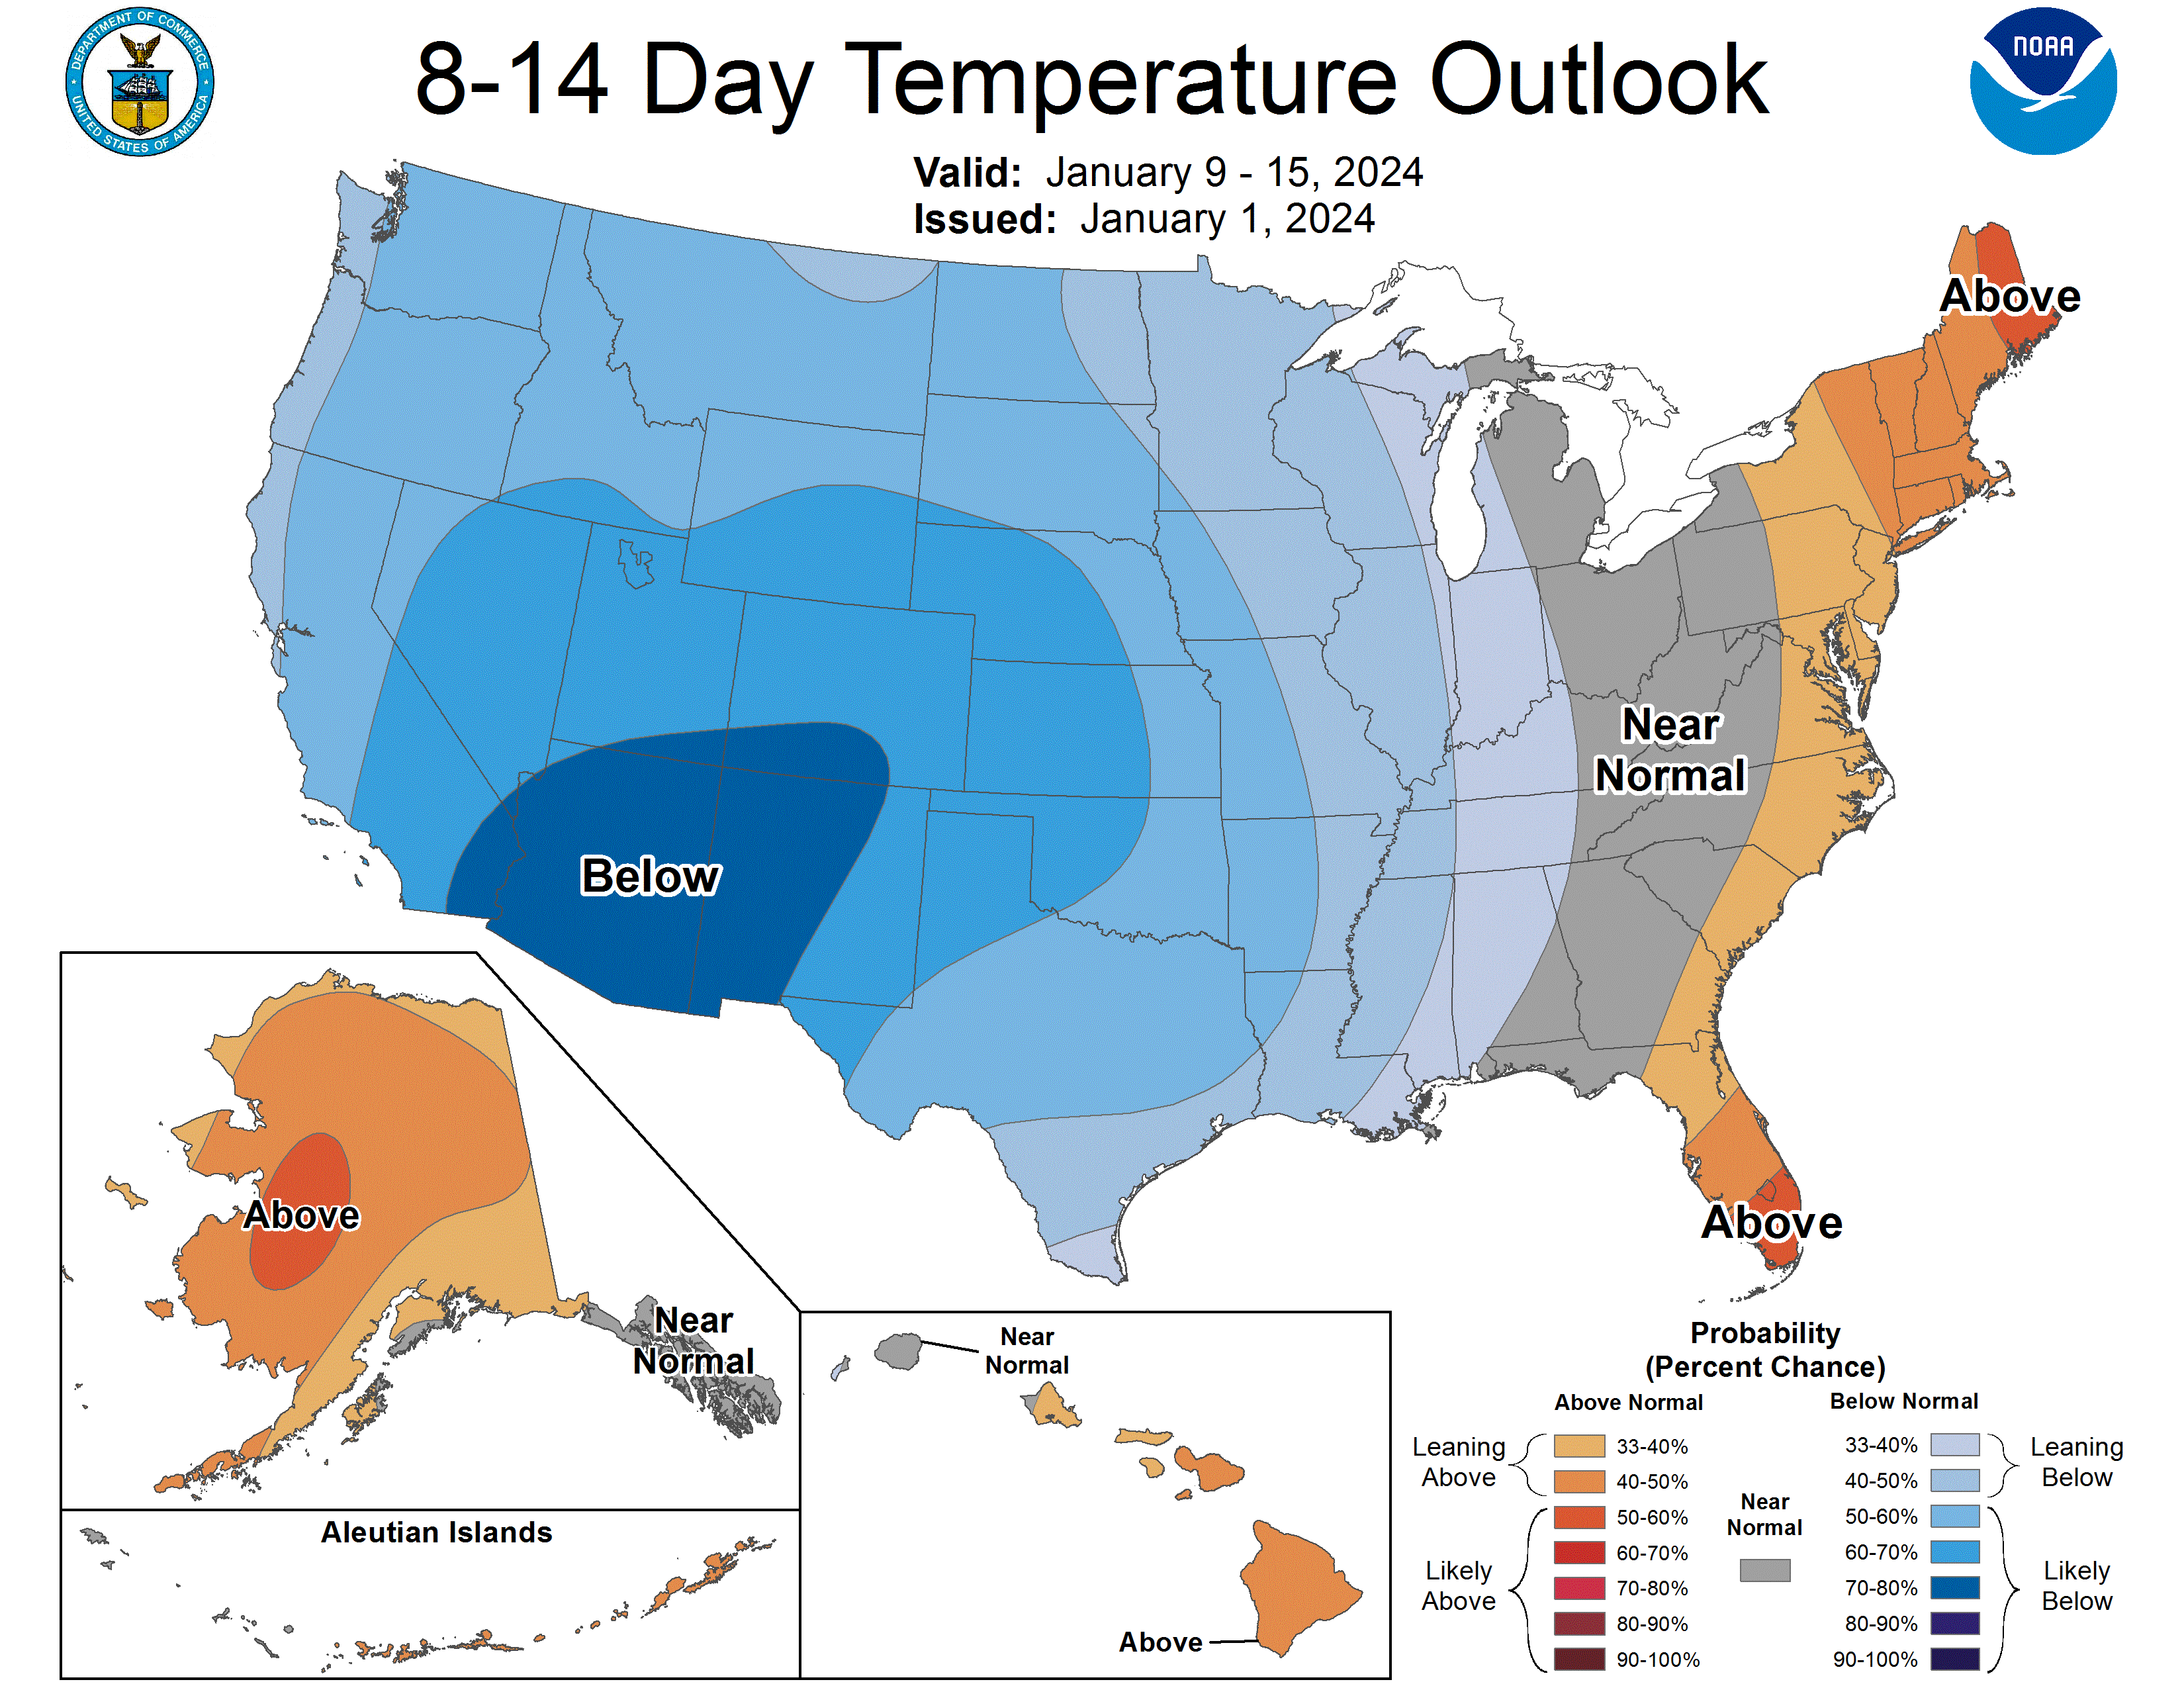
https://www.cpc.ncep.noaa.gov/products/predictions/610day/index.php
The NWS is catching on to the must colder week 2 forecast but the AO and NAO have increased in the last 2 days, so the threat for sustained, extreme cold in the East is less than Sat/Sun but still there.
The HDDs are higher/more bullish and pattern colder than Friday, so NG should open higher in 2 hours.
https://www.marketforum.com/forum/topic/83844/#83856
https://www.marketforum.com/forum/topic/83844/#83852
NG had a gap higher on the open as expected.
Should be an upside break way gap…..unless the weather forecast turns much milder.
The weather forecast turned MUCH less cold overnight.
The 0z European model below(left/purple line) was -12 HDDs vs the previous run and the 6z GEFS was an incredible -18 HDDs vs the previous run!
++++++++++
The big gap higher last night, now filled serves as a POTENTIAL gap and crap(buying exhaustion gap).
Depends mostly on the weather forecast updates but we should note the RECORD amount of natural gas in storage reduces the impact of extreme cold to generate speculative buying from large funds and other major traders.
The just updated 12z GEFS just lost another -8 HDDs and so NG is back close to last Friday's close.
2pm: The European model ADDED +4 HDDs and we had an afternoon bounce.
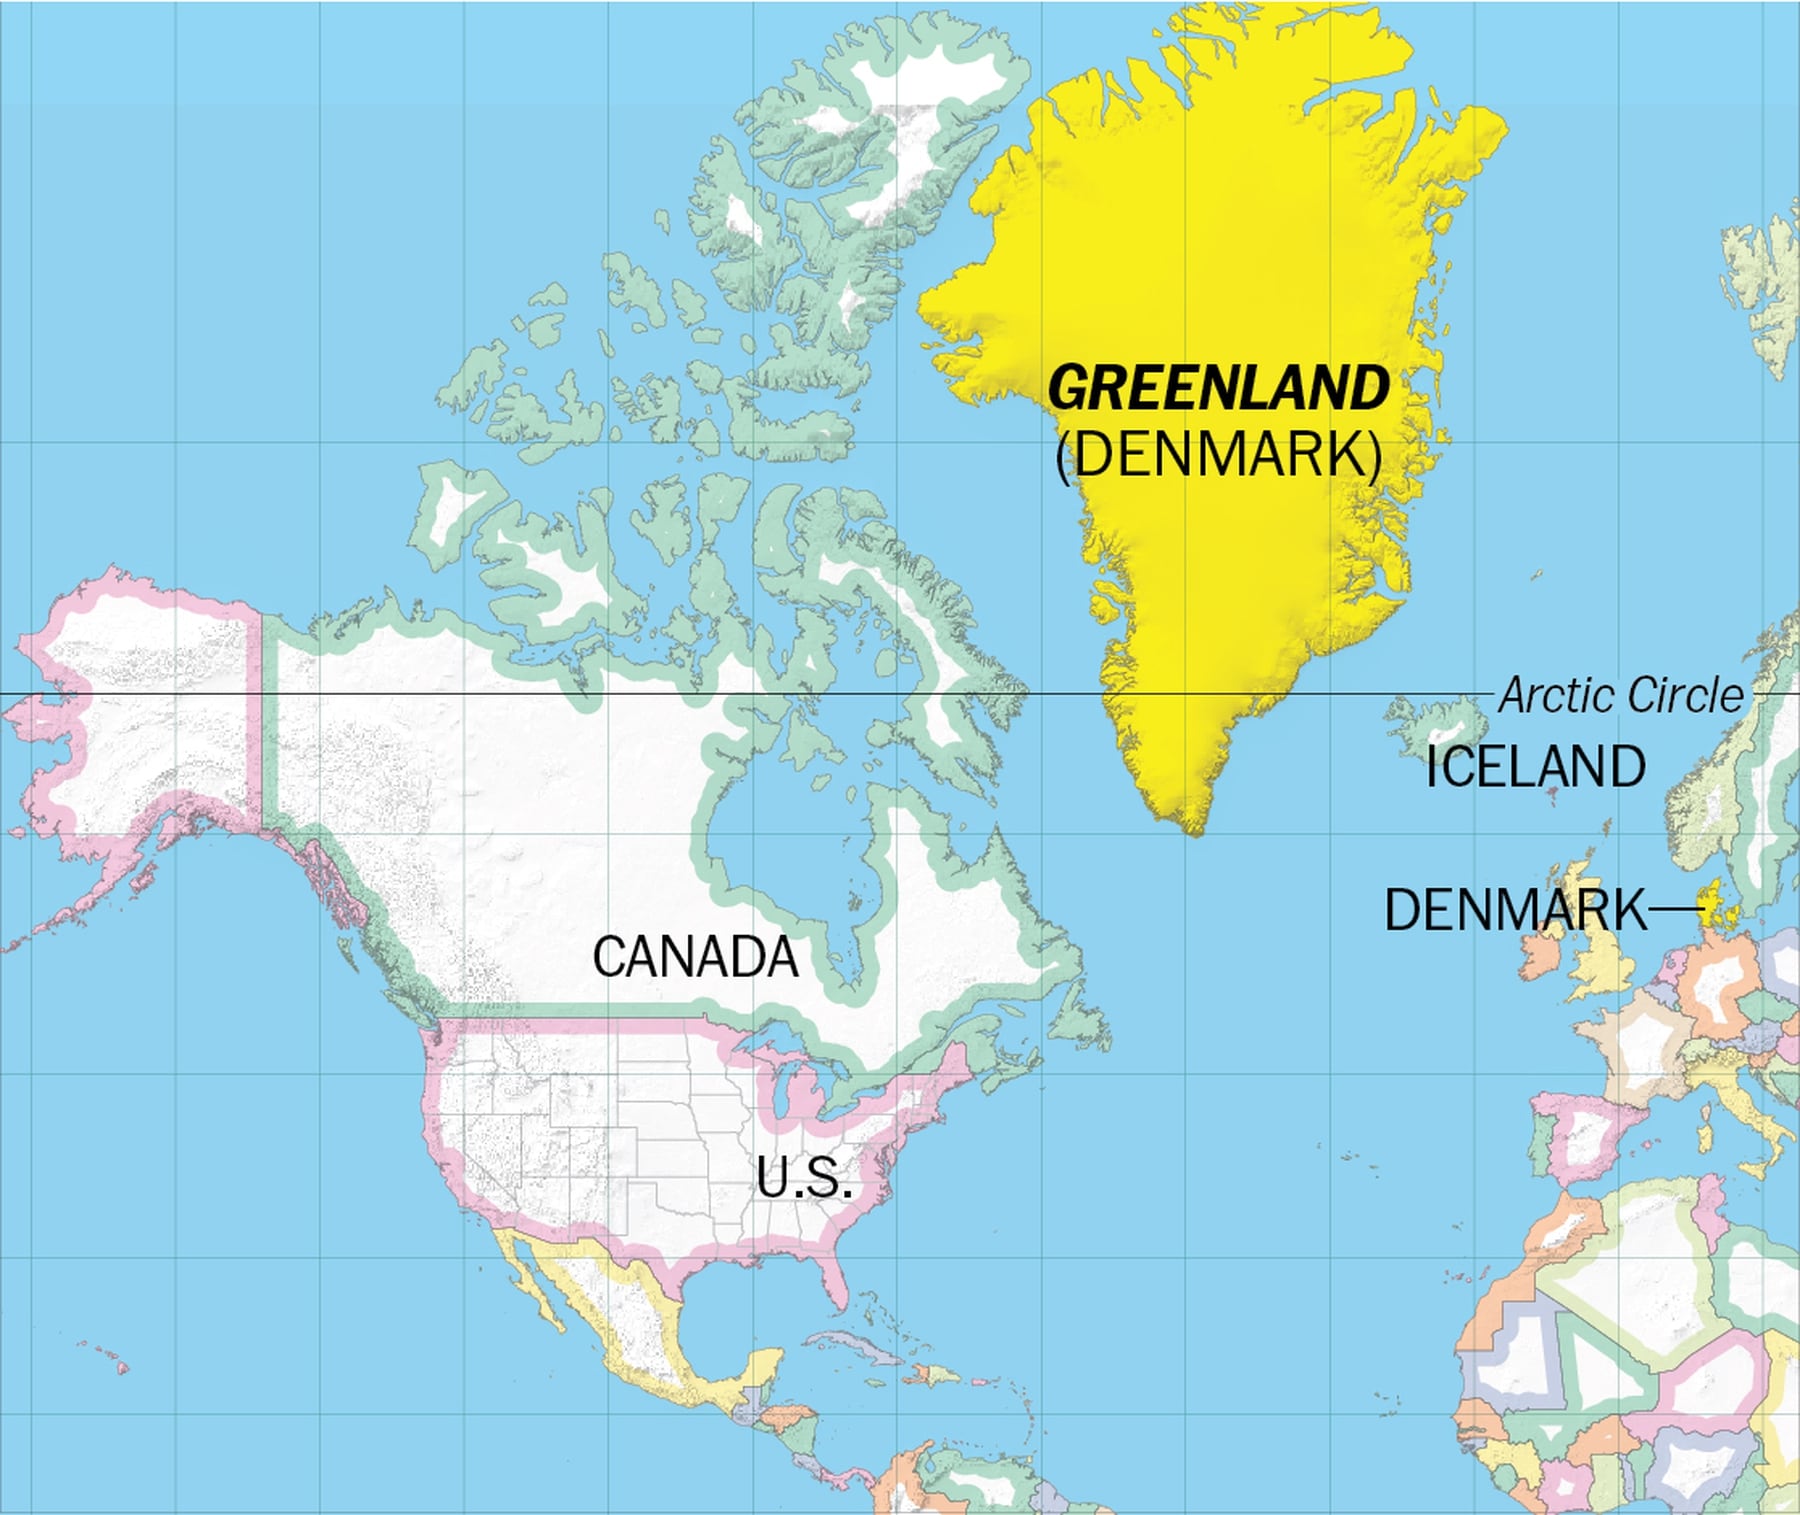
European model lost some HDDs with NG being weak in the very early morning hours but the 6z GEFS added a whopping +12.4 HDDs and NG had lots of buying after 4:30am. The pattern continues to look COLD and BULLISH for January with the Greenland Block, positive anomaly as well as the solidly -AO and -NAO.
The Greenland block FORCES THE JET STREAM AND COLD AIR TO TRACK FARTHER SOUTH THAN USUAL.
GFS ensemble mean anomalies at 2 weeks.
https://www.psl.noaa.gov/map/images/ens/z500anom_nh_alltimes.html
2 week 850 temp for ensemble mean anomaly
https://www.psl.noaa.gov/map/images/ens/t850anom_nh_alltimes.html
Arctic Oscillation Index, North Atlantic Oscillation Index, Pacific North American Index.
https://www.cpc.ncep.noaa.gov/products/precip/CWlink/daily_ao_index/ao.shtml
https://www.cpc.ncep.noaa.gov/products/precip/CWlink/pna/nao.shtml
More later today. Tied up with the Scholastic Chess of Indiana Chess tournament I’m hosting on Saturday.
The EIA number was record bearish at just -14 Bcf but the much colder pattern continues to be the bullish ammo to drive price higher the past 3+ weeks. No change in that much colder forecast.