Temperatures for week 2 on forecast models turned MUCH cooler over the weekend and that trend has continued.
This resulted in a gap lower open on Sunday evening. Losses were extended with strong follow thru selling, so that makes it a powerful downside break away gap on the price charts! Extremely bearish.
Natural gas futures flopped to start the first full week of September as production held strong and forecasts pointed to waning cooling demand as the month wears on. Coming off a cumulative 9% gain over the course of last week, the October Nymex gas futures contract on Tuesday dropped 18.3 cents day/day and settled at…
+++++++++++++
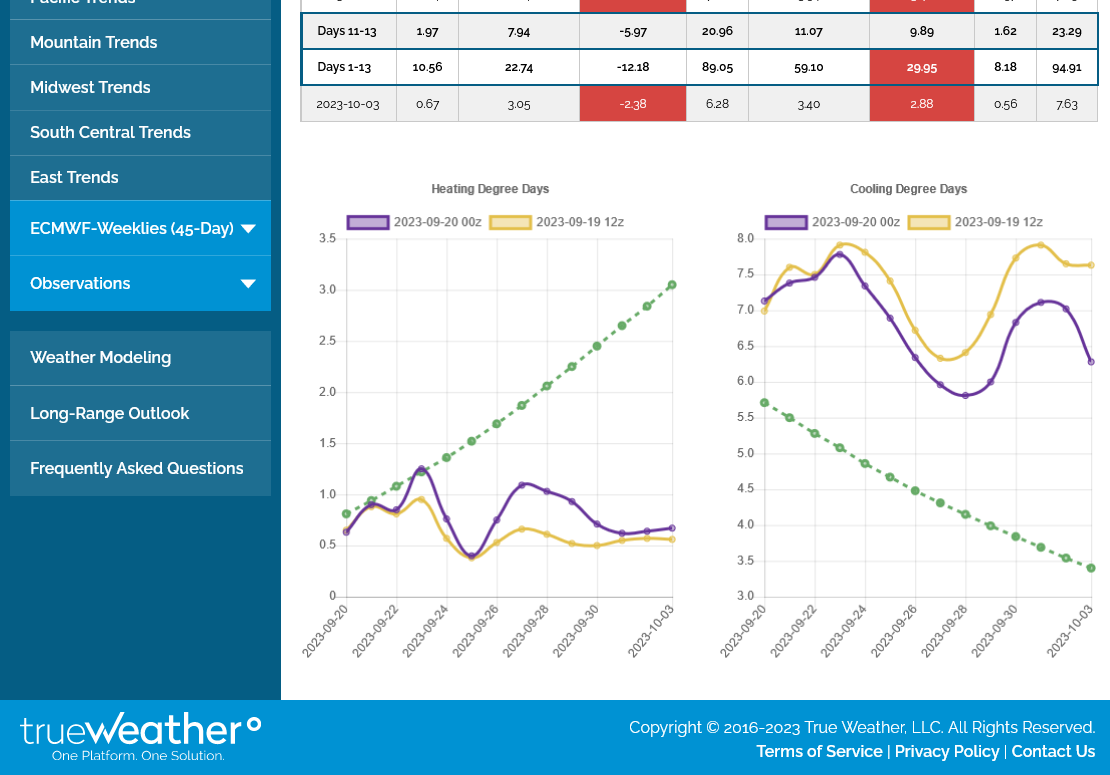
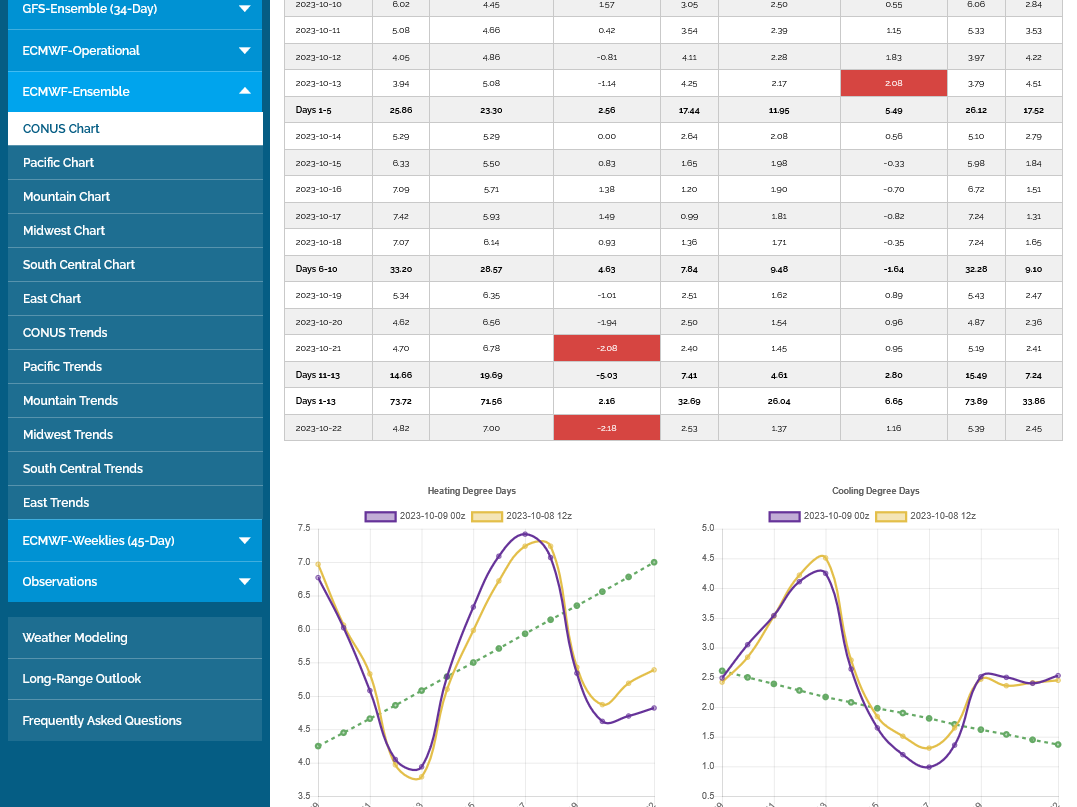
There's no MIXED about the weather forecast. Temps are massively cooler compared to last Friday's forecast. CDD's drop all the way down to average from the record warm early/mid September levels predicted 4 days ago. The graph on the right side is CDDs. Purple is the last, 12z run of the European Ensemble below.
Temps from last week for this weeks EIA report.
Mild Great Lakes/Ohio Valley/Northeast. Hot everywhere else. Small injection.
https://www.cpc.ncep.noaa.gov/products/tanal/temp_analyses.php
+33 BULLISH!
Interpretation: Blue line on the graph below has been curving down towards the 5 year average but still above average, except in the Pacific which has a small deficit.
The South Central had another withdrawal from widespread, intense heat that required burning a great deal of ng to generate electricity from AC demand.
Note: It was right around this time last year that ng supplies really started gushing in for the rest of the year(had some huge injections in the late Spring too). Easily a record for the injection season. As a result, we could be losing ground vs last year in many weeks ahead. With regards to storage vs the 5 year average, that will depend a great deal on the weather.
+++++++++++++++++++ https://ir.eia.gov/ngs/ngs.html
for week ending September 1, 2023 | Released: September 7, 2023 at 10:30 a.m. | Next Release: September 14, 2023
| Working gas in underground storage, Lower 48 states Summary text CSV JSN | |||||||||||||||||||||||||
|---|---|---|---|---|---|---|---|---|---|---|---|---|---|---|---|---|---|---|---|---|---|---|---|---|---|
| Historical Comparisons | |||||||||||||||||||||||||
| Stocks billion cubic feet (Bcf) | Year ago (09/01/22) | 5-year average (2018-22) | |||||||||||||||||||||||
| Region | 09/01/23 | 08/25/23 | net change | implied flow | Bcf | % change | Bcf | % change | |||||||||||||||||
| East | 766 | 751 | 15 | 15 | 632 | 21.2 | 702 | 9.1 | |||||||||||||||||
| Midwest | 877 | 853 | 24 | 24 | 772 | 13.6 | 818 | 7.2 | |||||||||||||||||
| Mountain | 218 | 213 | 5 | 5 | 159 | 37.1 | 181 | 20.4 | |||||||||||||||||
| Pacific | 252 | 248 | 4 | 4 | 238 | 5.9 | 262 | -3.8 | |||||||||||||||||
| South Central | 1,035 | 1,050 | -15 | -15 | 886 | 16.8 | 963 | 7.5 | |||||||||||||||||
| Salt | 241 | 249 | -8 | -8 | 182 | 32.4 | 221 | 9.0 | |||||||||||||||||
| Nonsalt | 795 | 801 | -6 | -6 | 704 | 12.9 | 742 | 7.1 | |||||||||||||||||
| Total | 3,148 | 3,115 | 33 | 33 | 2,686 | 17.2 | 2,926 | 7.6 | |||||||||||||||||
Totals may not equal sum of components because of independent rounding. | |||||||||||||||||||||||||
Working gas in storage was 3,148 Bcf as of Friday, September 1, 2023, according to EIA estimates. This represents a net increase of 33 Bcf from the previous week. Stocks were 462 Bcf higher than last year at this time and 222 Bcf above the five-year average of 2,926 Bcf. At 3,148 Bcf, total working gas is within the five-year historical range.
For information on sampling error in this report, see Estimated Measures of Sampling Variability table below.

Note: The shaded area indicates the range between the historical minimum and maximum values for the weekly series from 2018 through 2022.
++++++++++++++++++
Will we resume the huge injections early this Fall??
By metmike - June 1, 2023, 12:21 p.m.
Re: Re: Re: Re: Re: Re: Natural Gas 5-4-23
+110 Bcf WOW!!!! Note the blue line on the graph below! NG keeps gushing in!
https://www.marketforum.com/forum/topic/94944/#95779
By metmike - June 8, 2023, 10:30 a.m.
+118 Bcf IMPLIED FLOW. 14 of which was reclassified as base gas.
Excellent discussion and stats at this thread below!
NG in 2022 obliterates old record for autumn 100+ injections 69 responses |
Started by WxFollower - Nov. 13, 2022, 7:50 p.m.
https://www.marketforum.com/forum/topic/90609/
+++++++++++++
This record smashing production/supplies gushing in came when prices had spiked to 10 year highs towards the end of last Summer. It also showed that market dynamics are still controlled by the industry based on fundamentals and the price structure and not green agenda or Biden.
The indisputable fact is that switching to more green energy than we have been would be catastrophic, unsustainable and crush our economy while causing massive price increases for residential and industrial customers.
They pretend that isn't true, while presenting a complete fairy tale green energy future based on fake physical, energy and economic laws that can NEVER work because they violate those indisputable laws.
They do it for crony capitalism, political agenda/government funding, corrupted science, dishonest, ratings driven media and misled but sincere environmentalism.
Energy transition is a hoax
Started by metmike - April 15, 2023, 5:50 p.m.
By Kevin Dobbs
September 7, 2023
The cure for low prices?
Low prices!
Low ng prices like we've seen in the futures market this year is what causes negative economic incentive to producers. .........who cut back on investments to bring additional supplies to the market down the road.
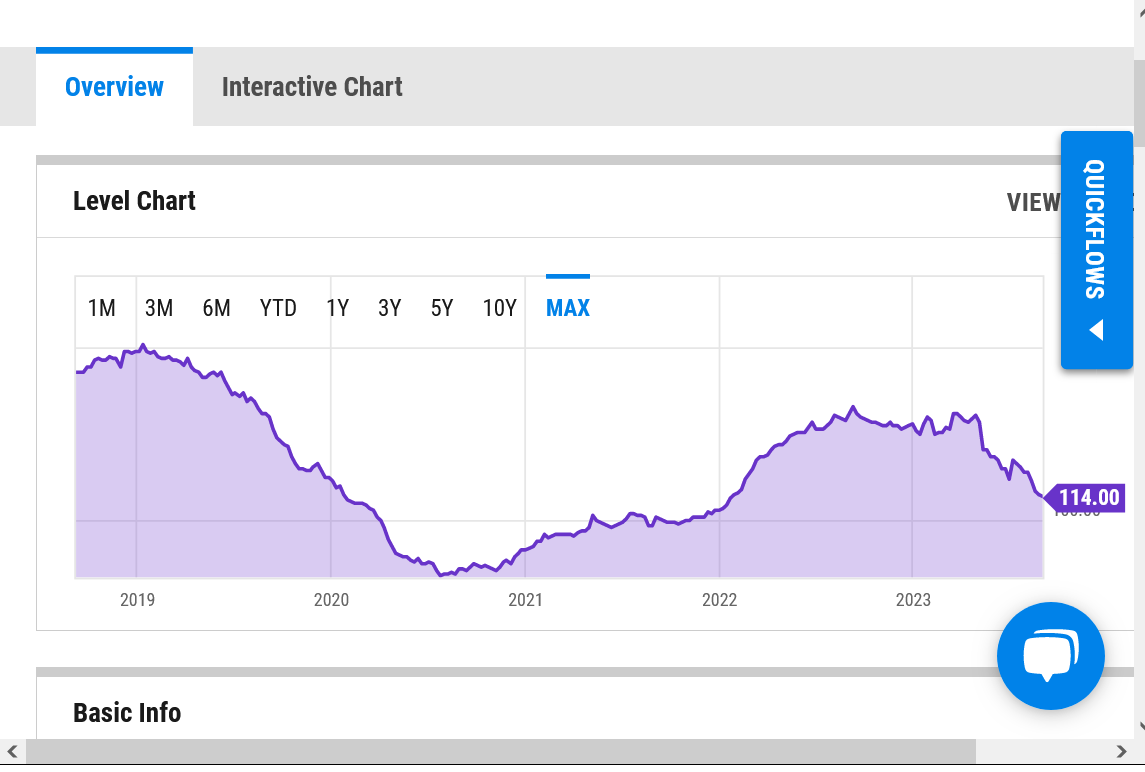
The dropping rig count(rigs searching/drilling for ng) shows that exactly.
https://ycharts.com/indicators/us_gas_rotary_rigs
US Natural Gas Rig Count is at a current level of 114.00, down from 115.00 last week and down from 158.00 one year ago. This is a change of -0.87% from last week and -27.85% from one year ago.
+++++++
https://neftegazru.com/tech-library/drilling-rigs-and-their-units/629643-rig-sount/
A Rig count is an official listing of all the oil and gas rigs that are operational at a certain location. This count demonstrates the necessary details such as the location of each rig and its functional status.
It is an important procedure as it helps to get an insight of the active number of drilling rigs that are installed on both offshore and onshore sites. A Rig count can be done nationally or internationally in different phases such as weekly, monthly or annually.
A Rig count is a tally process of active or inactive rigs. A Rig count helps in collecting data that helps in analyzing several factors and indicating the status of drilling activities.
A rig would be counted even if it is down and inactive or up and active. It is a definitive measure of understanding the drilling status of an oil well. This counting process of drilling rigs can also provide an insight to data such as the type and volume of oil or gas produced, well depth, production, drilling costs etc.
As a matter of fact, it is also used as a measurement of the production range. The rigs are counted from weekly to annual basis and can range from nationwide counting to global counting.
In general, the Rig count indicates a willingness for oil and gas companies to continue investing. Rig counts signify the actual activity within the current market. They are separate from speculation and analysis because they are the actual activity within the market.
+++++++++++++++++++++
DUCs-key factor
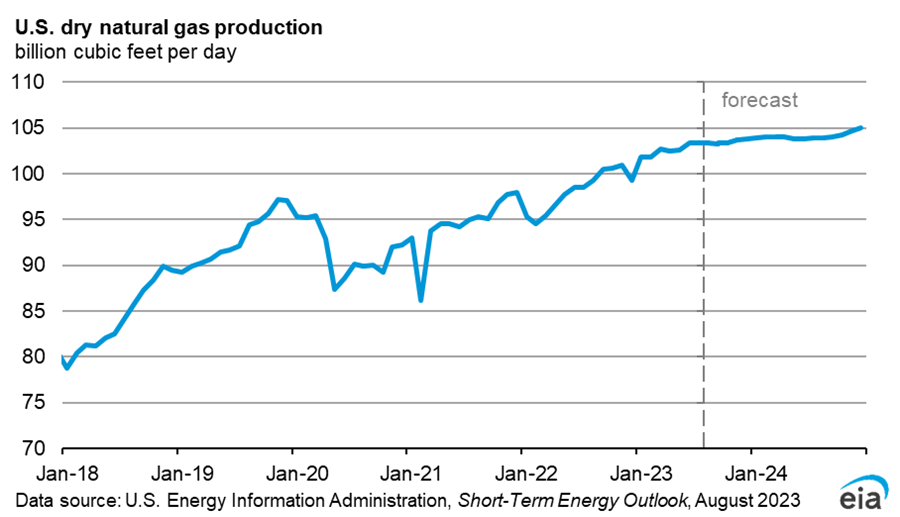
https://www.eia.gov/outlooks/steo/report/natgas.php
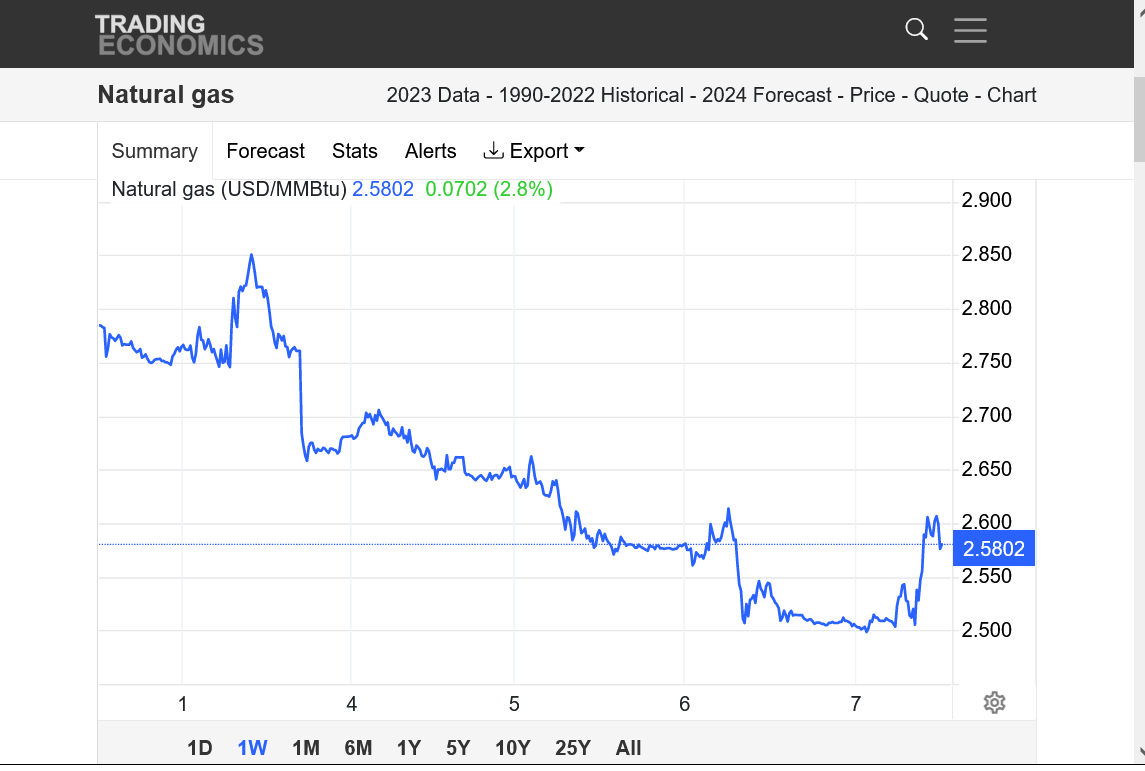
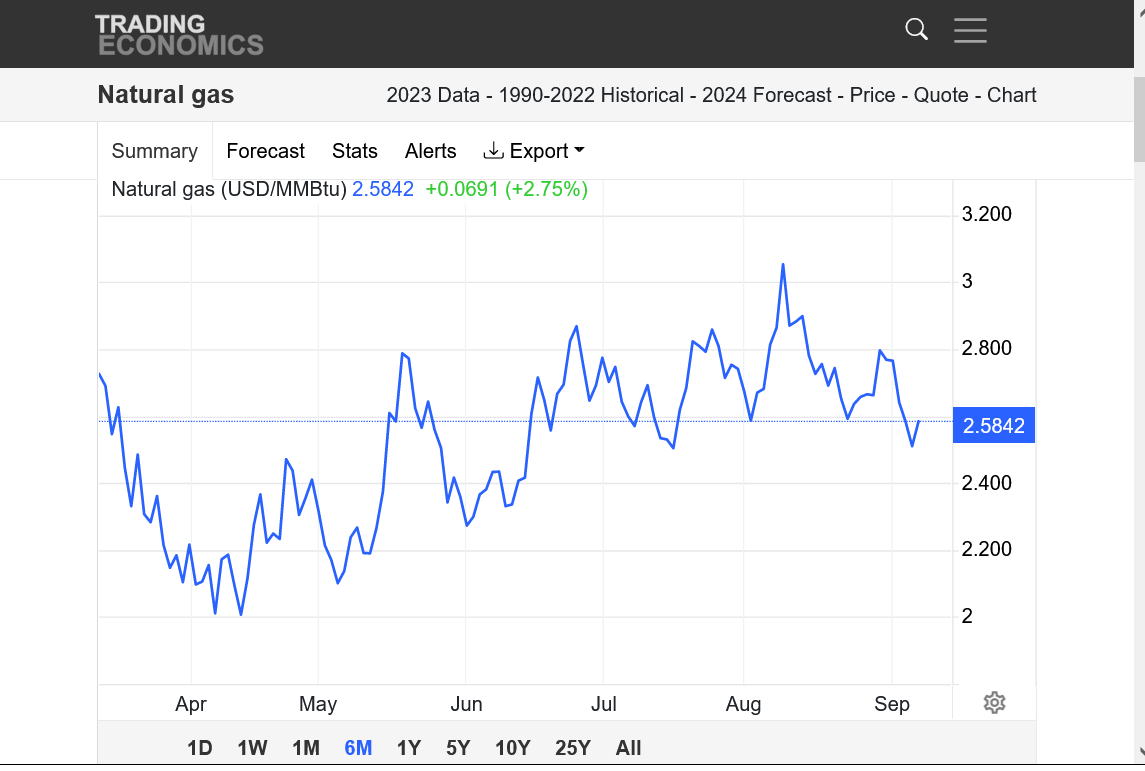
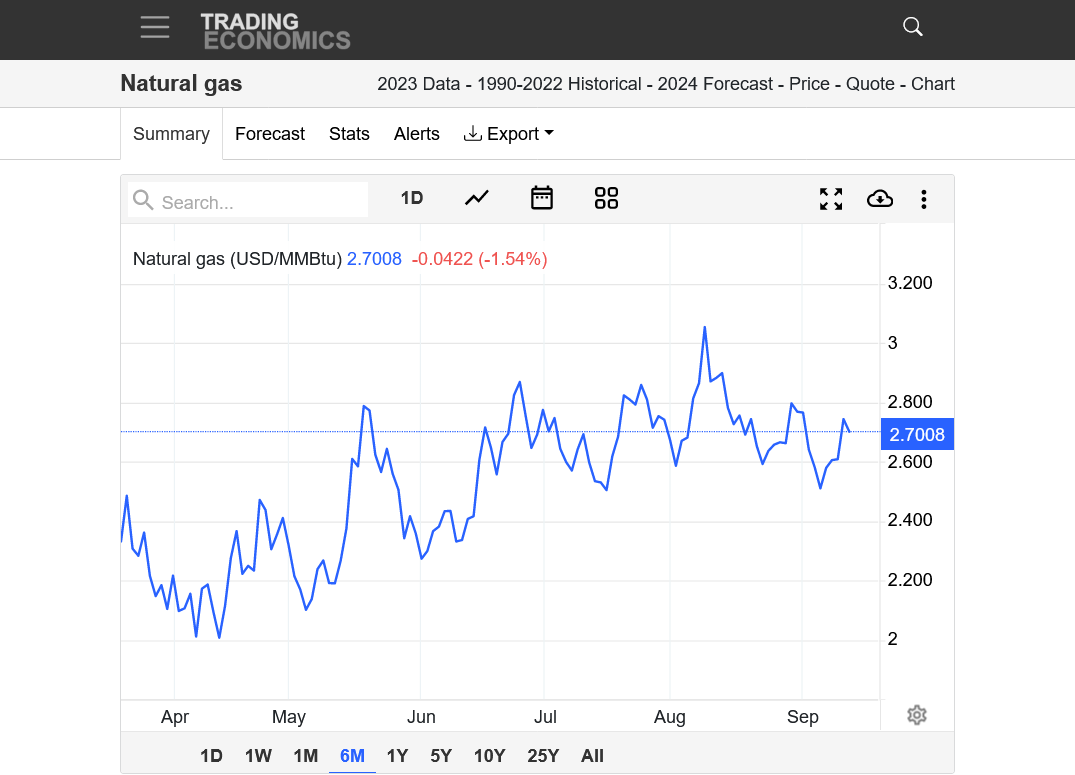
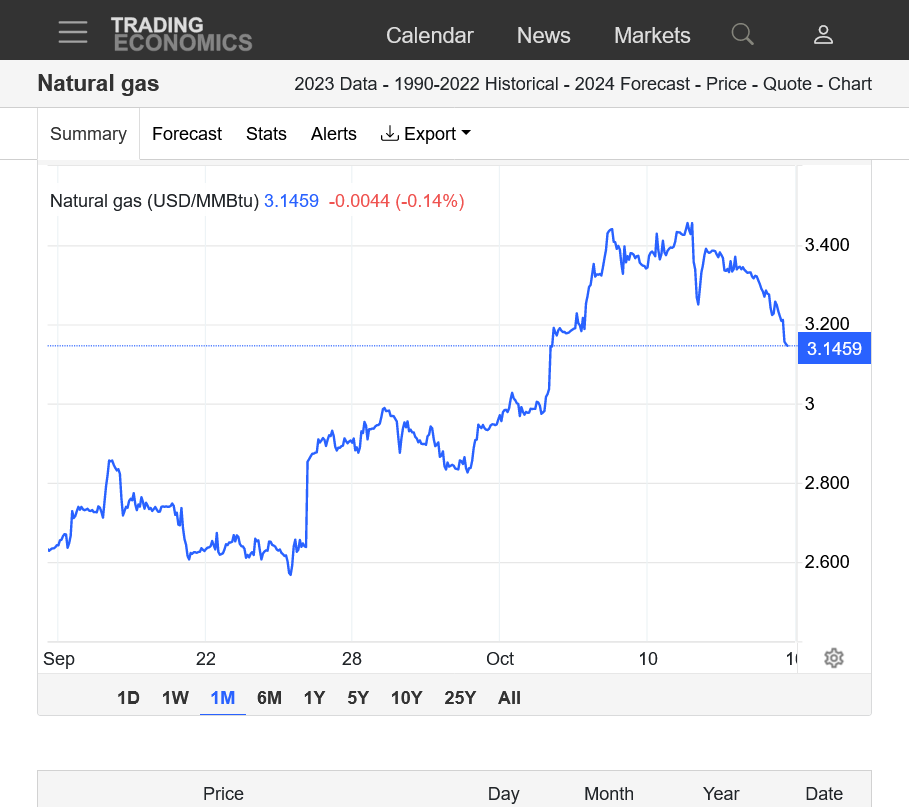
Natural gas price charts with analysis/interpretation
https://tradingeconomics.com/commodity/natural-gas
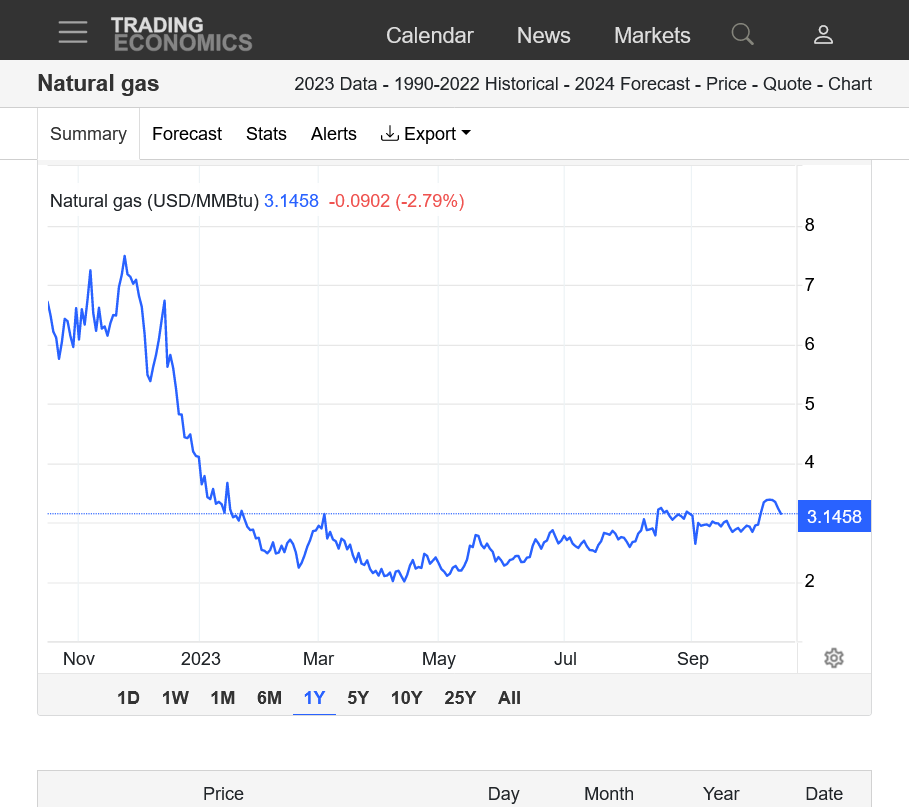
1. 1 week chart-forecasts turning MUCH cooler over the weekend/early this week.
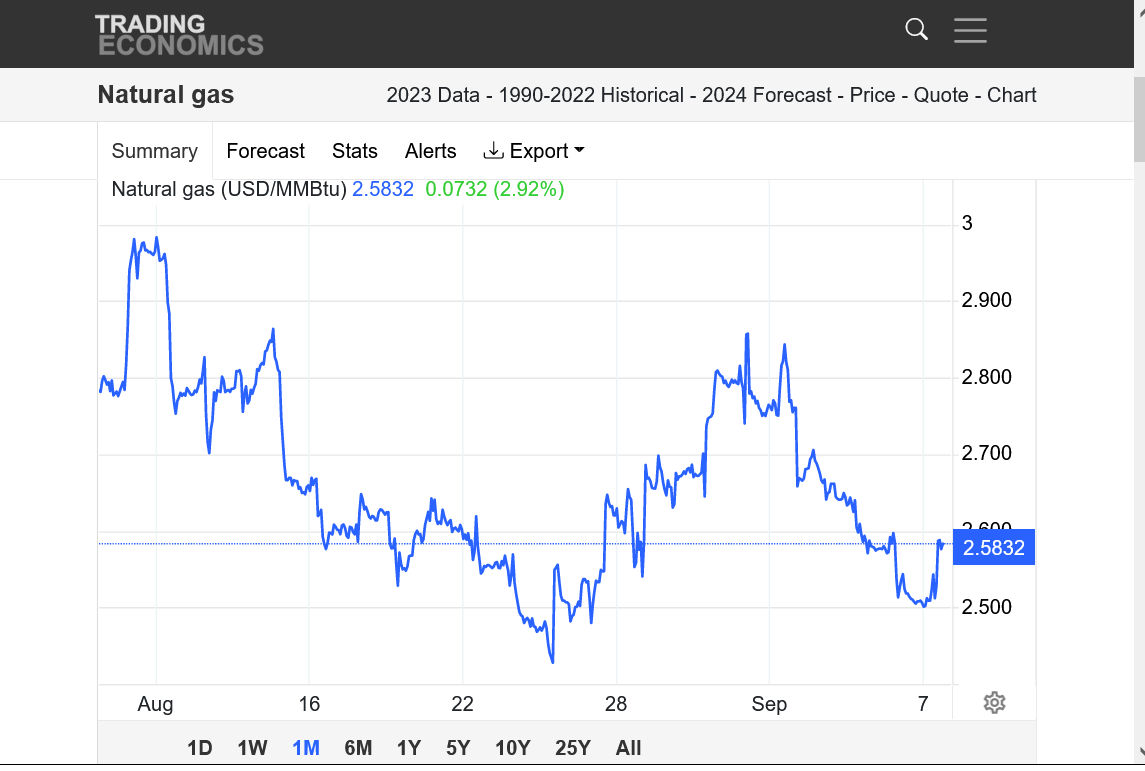
2. 1 month-late August spike up from heat could not challenge early August high
3. 6 month-very telling. MAJOR bottom in April, followed by bullish run/uptrend but the uptrending channel/slope weakened in July/Aug with new highs JUST barely in early Aug that the market was UNABLE TO HOLD.
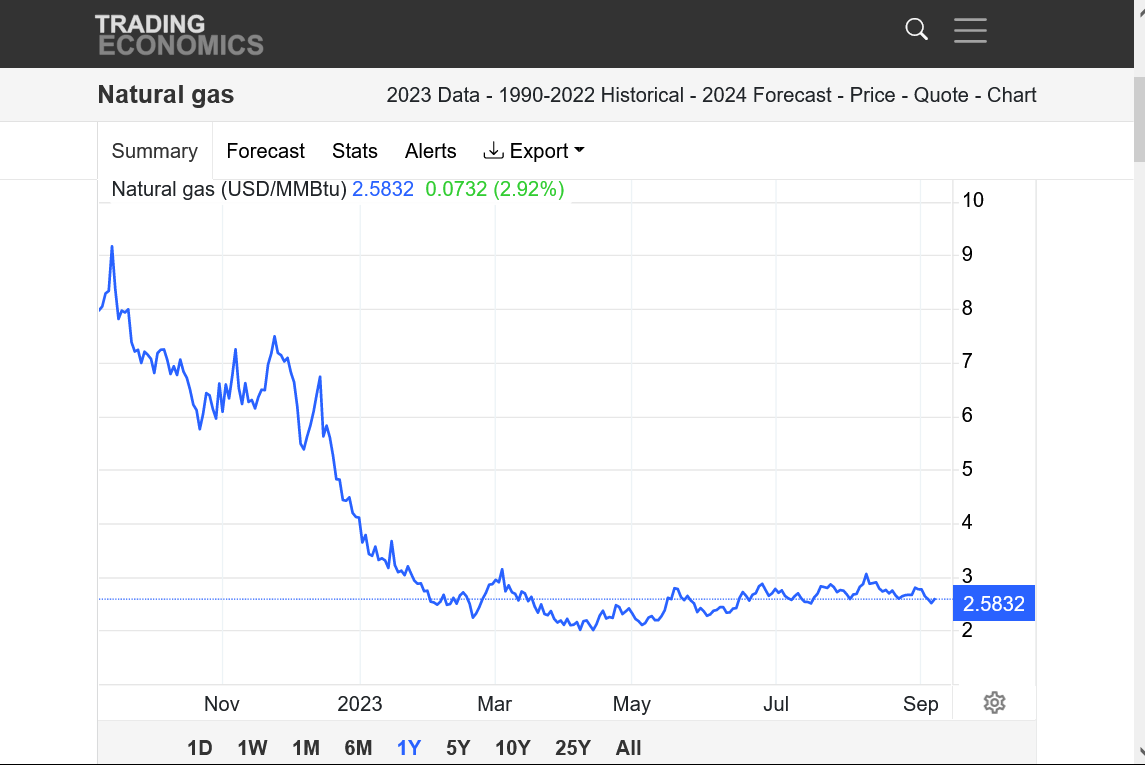
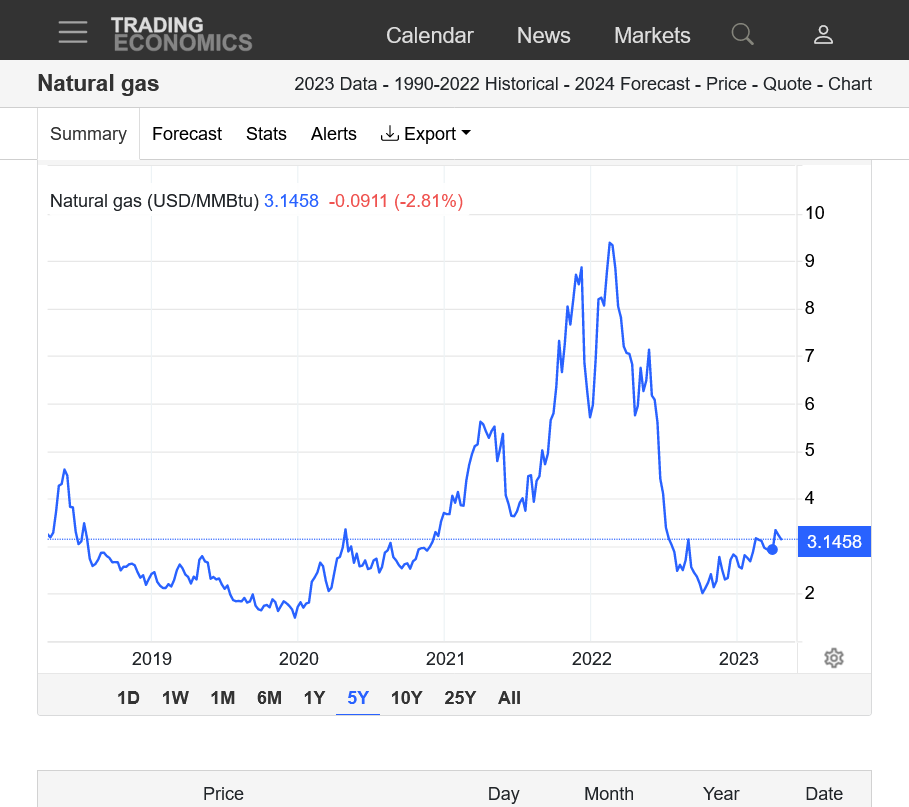
4. 1 year-Main thing to note is the price a year ago. MEGA top and price 3.5 times the current price. Then supplies started gushing in.
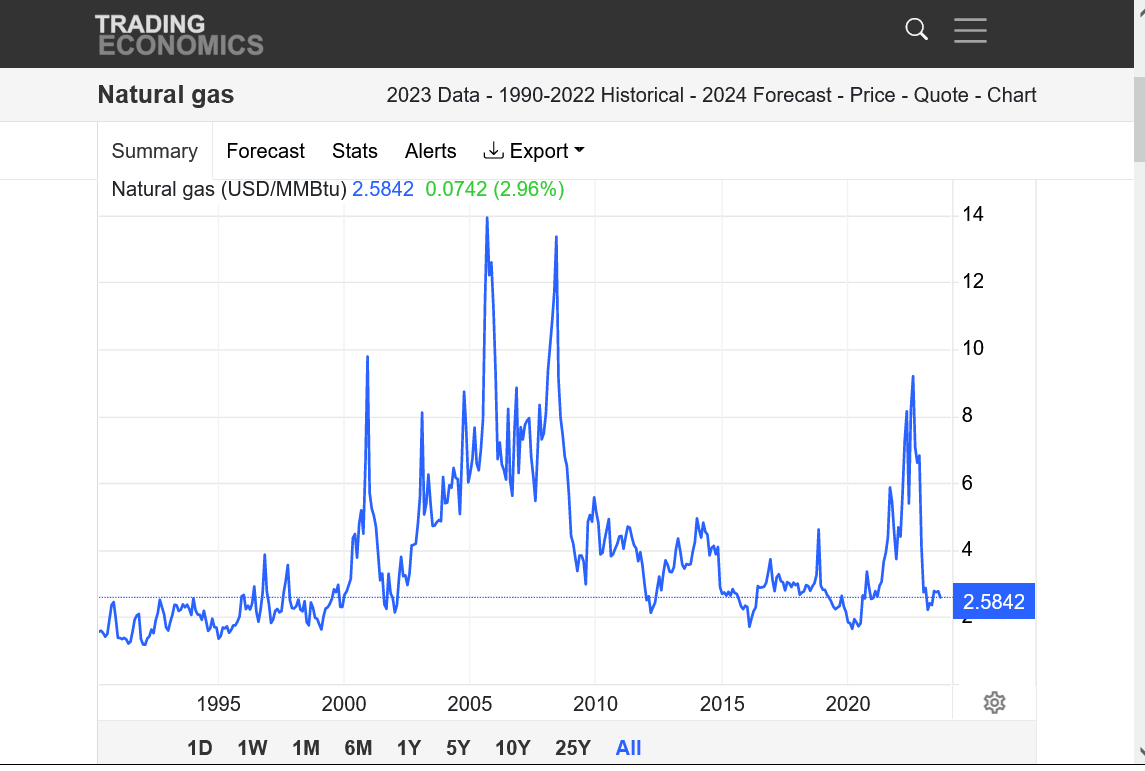
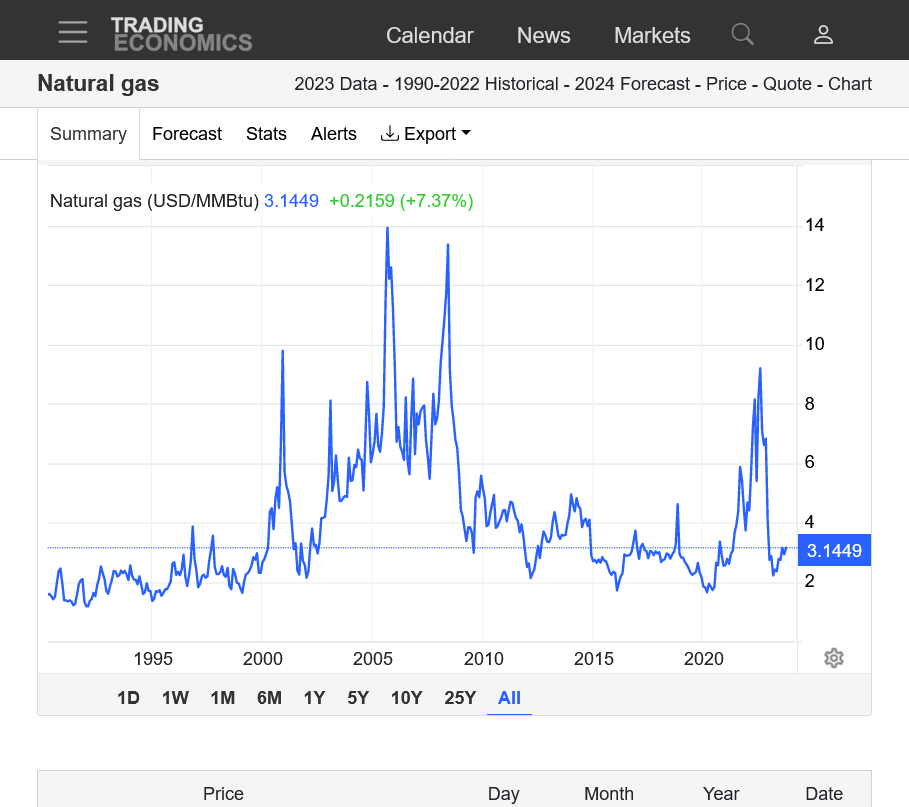
5. 30 years-shows the top 1 year ago. Highest price in well over a decade. Prices right now are historically on the low side.
Don't really follow NG. Will this have much effect?
Thanks much, buck!
Since the date of the article was 7 days ago, I would say no to the short term Impact on price.
We gapped lower last Sunday Night, almost entirely because of the weather forecast turning much cooler over last weekend compared to the previous Friday.
Not sure on how much impact this dynamic in the article will have longer term and how much the market has already dialed in that impact to the current price If there is any.
Sep 12, 2023
+++++++++++++++++++++
After starting off weak Sunday Night and continuing that way overnight. NG has displayed good strength. Prices really too off just after 9am this morning. Not sure why it picked that time frame but the weather is pretty bullish in week 2, for mid/late Sept.
The bottom right is the last 2 runs of the EE for CDDs. Close to average week 1, then soaring to almost double average during week 2. If this was July/August it wouldn't be bullish but it will keep the injections from being as robust as the could be in late Sept. as we try to fill storage heading into Winter.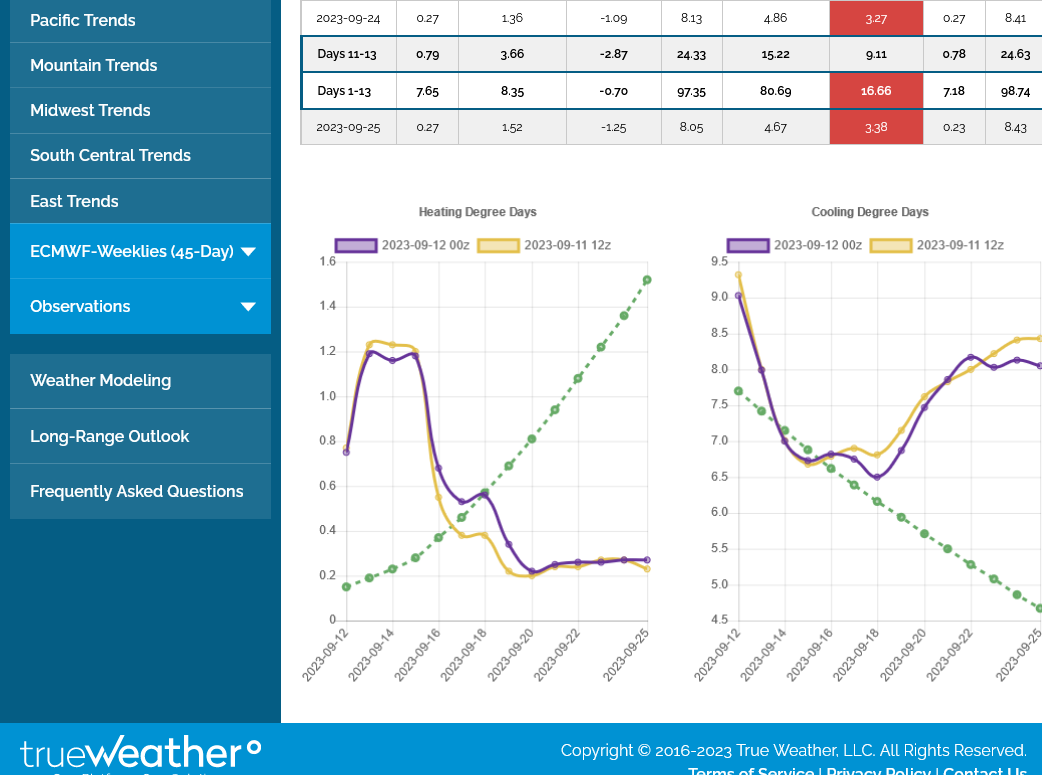
By Kevin Dobbs
September 13, 2023
Natural gas futures may be mired in a narrow range, but prices continue to edge upward. On Tuesday, the prompt month got a boost from falling production levels in the Permian Basin, a development that brought total output below the 100 Bcf/d level — a rare occurrence late in the summer of 2023.
+++++++++++++++
Here's the 7 day temps from last week for tomorrows 9:30am weekly storage report.
Enough CDDs to reduce the injection a bit from burning ng to generate electricity for air conditioning in the very warm/hot places.
https://www.cpc.ncep.noaa.gov/products/tanal/temp_analyses.php
Previous technical/chart post:
https://www.marketforum.com/forum/topic/98739/#98785
NG still trying to hold the weakening uptrend but the slope is collapsing and a failure to make new highs will harm the bull case. Potential top just above $3 in that case.
https://tradingeconomics.com/tsla:us
The Negative market reaction says that this was BEARISH!
https://ir.eia.gov/ngs/ngs.html
![]()
for week ending September 8, 2023 | Released: September 14, 2023 at 10:30 a.m. | Next Release: September 21, 2023
| Working gas in underground storage, Lower 48 states Summary text CSV JSN | |||||||||||||||||||||||||
|---|---|---|---|---|---|---|---|---|---|---|---|---|---|---|---|---|---|---|---|---|---|---|---|---|---|
| Historical Comparisons | |||||||||||||||||||||||||
| Stocks billion cubic feet (Bcf) | Year ago (09/08/22) | 5-year average (2018-22) | |||||||||||||||||||||||
| Region | 09/08/23 | 09/01/23 | net change | implied flow | Bcf | % change | Bcf | % change | |||||||||||||||||
| East | 775 | 766 | 9 | 9 | 657 | 18.0 | 725 | 6.9 | |||||||||||||||||
| Midwest | 904 | 877 | 27 | 27 | 804 | 12.4 | 851 | 6.2 | |||||||||||||||||
| Mountain | 225 | 218 | 7 | 7 | 162 | 38.9 | 185 | 21.6 | |||||||||||||||||
| Pacific | 260 | 252 | 8 | 8 | 235 | 10.6 | 262 | -0.8 | |||||||||||||||||
| South Central | 1,041 | 1,035 | 6 | 6 | 902 | 15.4 | 978 | 6.4 | |||||||||||||||||
| Salt | 241 | 241 | 0 | 0 | 186 | 29.6 | 225 | 7.1 | |||||||||||||||||
| Nonsalt | 801 | 795 | 6 | 6 | 715 | 12.0 | 753 | 6.4 | |||||||||||||||||
| Total | 3,205 | 3,148 | 57 | 57 | 2,760 | 16.1 | 3,002 | 6.8 | |||||||||||||||||
Totals may not equal sum of components because of independent rounding. | |||||||||||||||||||||||||
Working gas in storage was 3,205 Bcf as of Friday, September 8, 2023, according to EIA estimates. This represents a net increase of 57 Bcf from the previous week. Stocks were 445 Bcf higher than last year at this time and 203 Bcf above the five-year average of 3,002 Bcf. At 3,205 Bcf, total working gas is within the five-year historical range.
For information on sampling error in this report, see Estimated Measures of Sampling Variability table below.
+++++++++++++++++
Temps for this Thursday's 9:30am release from the EIA for natural gas storage.
Warm vs average West, South and East. Cool in the middle. I don't have a guess. Anybody else/Larry?
https://www.cpc.ncep.noaa.gov/products/tanal/temp_analyses.php
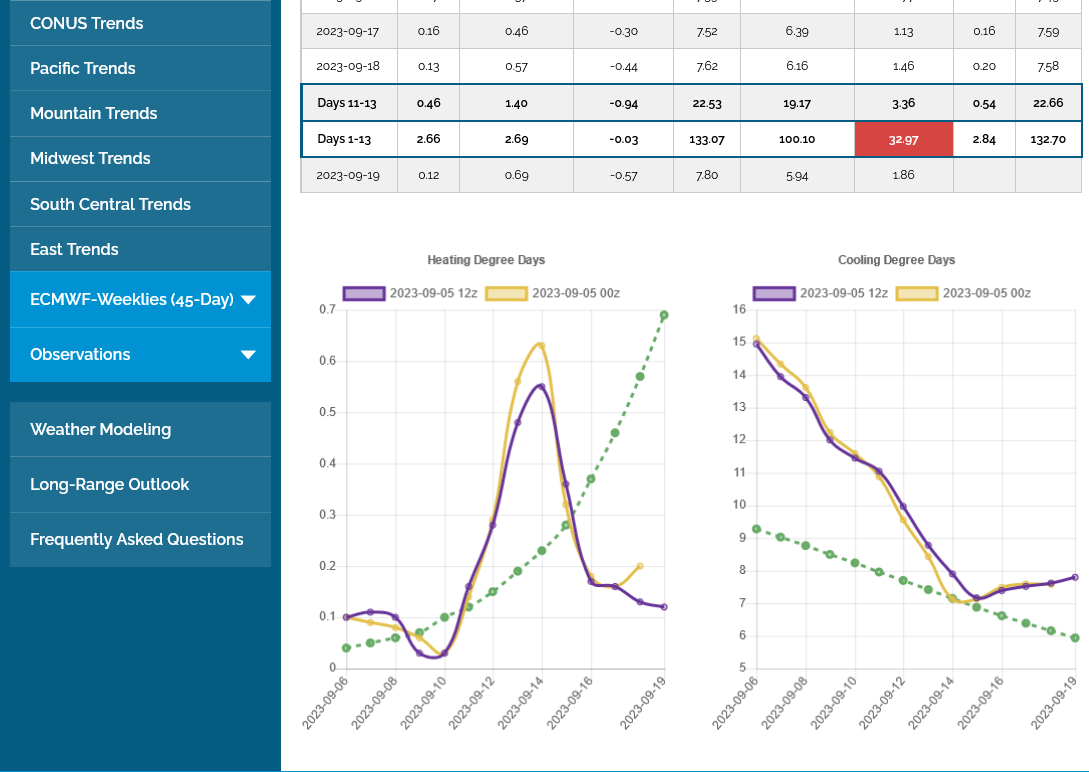
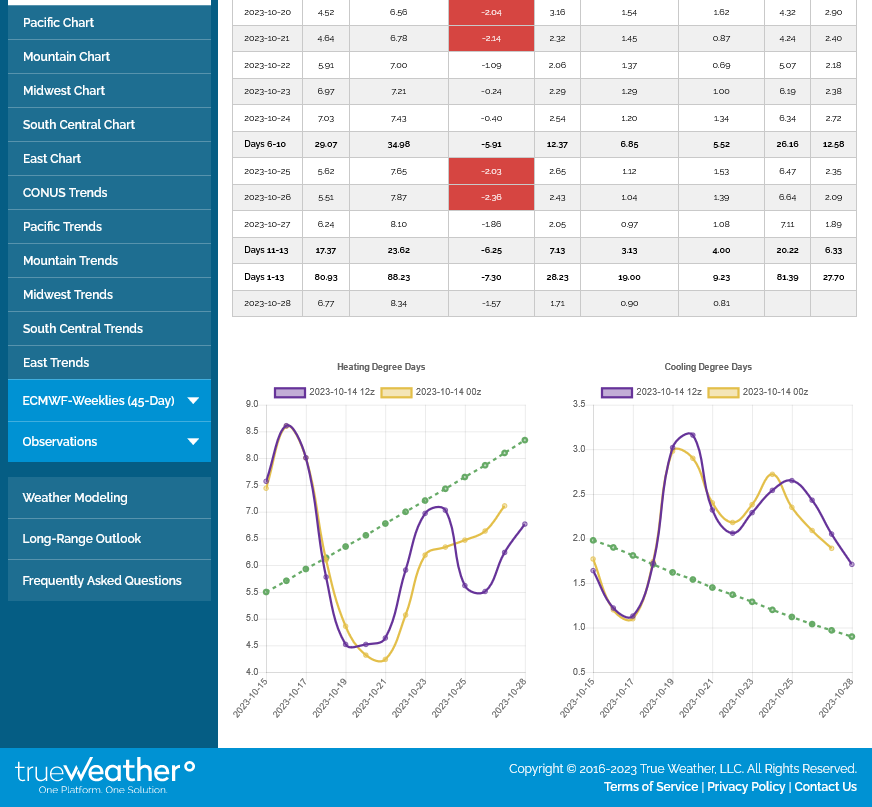
0z European Ensembles dropped 6 CDDs overnight from the previous 12z run Tuesday. A lot for September!
Purple line on the right for the graph below. Still higher CDDs than average which is the dashed green line that's plunging fast and means that average CDDs into early October don't matter.
In fact, HDDs that are rapidly increasing on the left (dashed green line) will pass up CDDS seasonally during the 2nd week of October!
A warm forecast like this after that happens, is more bearish than bullish.
The scales for the 2 graphs below are not the same.
EIA was a bit bearish based on the modest, initial spike lower.
![]()
https://ir.eia.gov/ngs/ngs.html
for week ending September 15, 2023 | Released: September 21, 2023 at 10:30 a.m. | Next Release: September 28, 2023
| Working gas in underground storage, Lower 48 states Summary text CSV JSN | |||||||||||||||||||||||||
|---|---|---|---|---|---|---|---|---|---|---|---|---|---|---|---|---|---|---|---|---|---|---|---|---|---|
| Historical Comparisons | |||||||||||||||||||||||||
| Stocks billion cubic feet (Bcf) | Year ago (09/15/22) | 5-year average (2018-22) | |||||||||||||||||||||||
| Region | 09/15/23 | 09/08/23 | net change | implied flow | Bcf | % change | Bcf | % change | |||||||||||||||||
| East | 793 | 775 | 18 | 18 | 686 | 15.6 | 751 | 5.6 | |||||||||||||||||
| Midwest | 931 | 904 | 27 | 27 | 839 | 11.0 | 883 | 5.4 | |||||||||||||||||
| Mountain | 228 | 225 | 3 | 3 | 167 | 36.5 | 189 | 20.6 | |||||||||||||||||
| Pacific | 263 | 260 | 3 | 3 | 237 | 11.0 | 265 | -0.8 | |||||||||||||||||
| South Central | 1,053 | 1,041 | 12 | 12 | 931 | 13.1 | 998 | 5.5 | |||||||||||||||||
| Salt | 242 | 241 | 1 | 1 | 197 | 22.8 | 231 | 4.8 | |||||||||||||||||
| Nonsalt | 811 | 801 | 10 | 10 | 733 | 10.6 | 767 | 5.7 | |||||||||||||||||
| Total | 3,269 | 3,205 | 64 | 64 | 2,859 | 14.3 | 3,086 | 5.9 | |||||||||||||||||
Totals may not equal sum of components because of independent rounding. | |||||||||||||||||||||||||
Working gas in storage was 3,269 Bcf as of Friday, September 15, 2023, according to EIA estimates. This represents a net increase of 64 Bcf from the previous week. Stocks were 410 Bcf higher than last year at this time and 183 Bcf above the five-year average of 3,086 Bcf. At 3,269 Bcf, total working gas is within the five-year historical range.
For information on sampling error in this report, see Estimated Measures of Sampling Variability table below.
The overnight 0z EE cooled again by -7 CDDs vs the previous 12z run. See the purple line on the right side of the graph.
Using the green dashed lines (SEASONAL AVERAGES), HDDs on the left, pass up CDDs on the right in early October. However, this year CDDs will be much greater than HDDs well into October because of the widespread above average temperature regime.
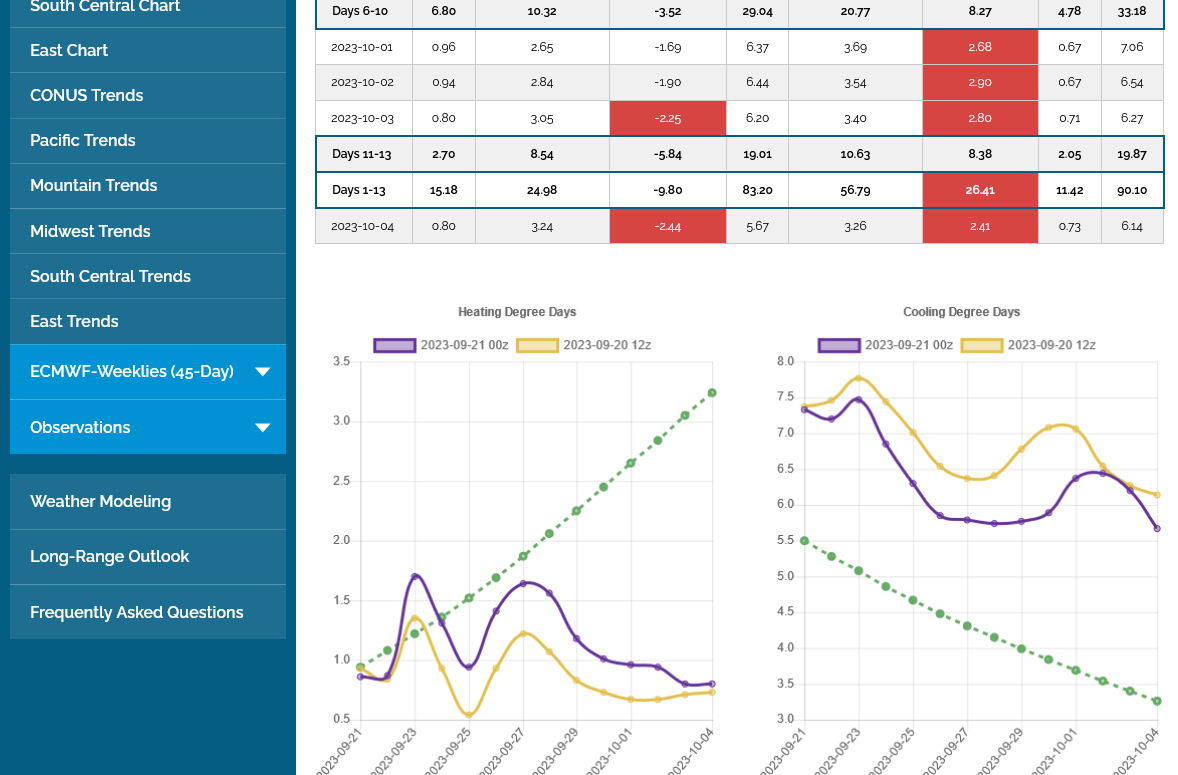
Boosted by early bargain buying, natural gas futures finished the week with a modest gain, snapping a two-day run of losses. But the front month struggled to muster much momentum amid strong supply levels, rapidly declining demand and weakening cash markets. At A Glance: Production recovers ground Forecasts further favor bears Stronger injection expected Following…
+++++++++++
These were the temps for this Thursday's EIA storage report.
The next several weeks, seasonally usually feature some of the most robust injections of the year because CDDs have plunged and HDDs have not yet ramped up.
This next one should be the largest one in some time.
https://www.cpc.ncep.noaa.gov/products/tanal/temp_analyses.php
Degree days
https://www.eia.gov/energyexplained/units-and-calculators/degree-days.php
You can see by the maps below that HDDS SWAMP CDDS, except for parts of the South and Southeast divisions. That's why we have INJECTIONS in the cooling season and WITHDRAWALS in the heating season.
.png)
.png)
+++++++++++++++++++++++++++
https://www.statista.com/statistics/245632/number-of-heating-degree-days-in-the-united-states/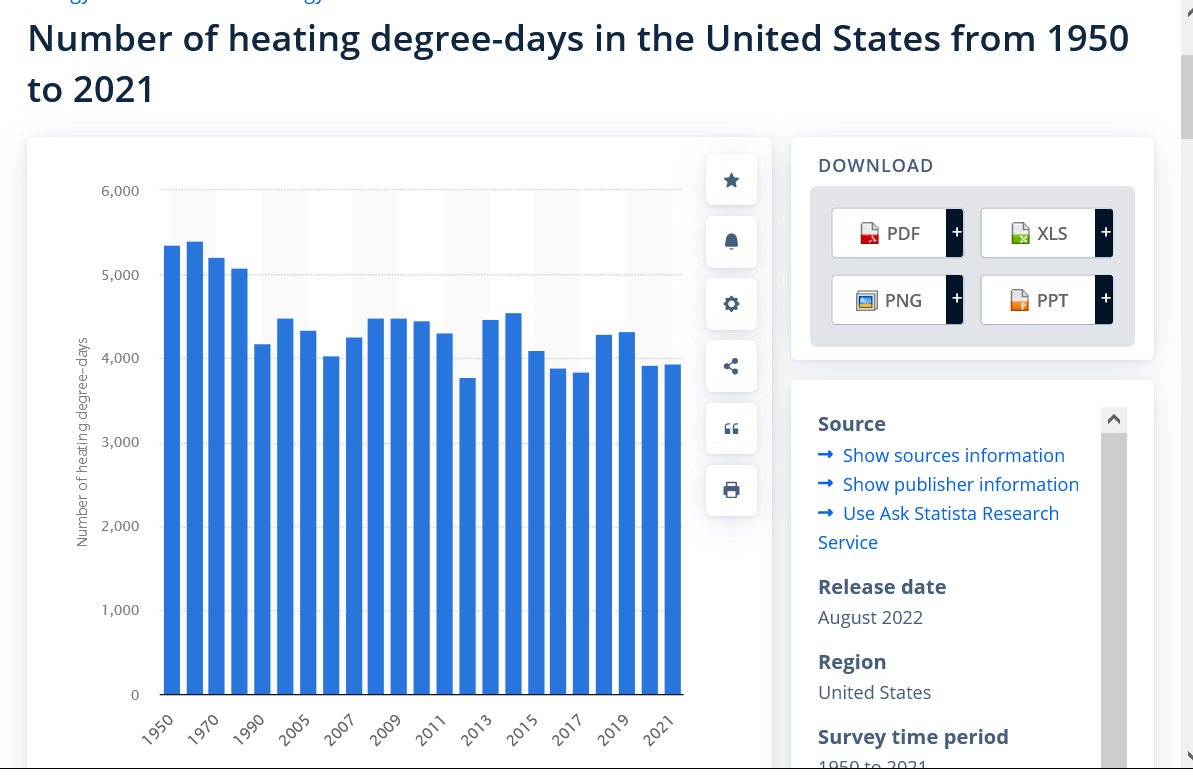
https://www.statista.com/statistics/245940/number-of-cooling-degree-days-in-the-united-states/
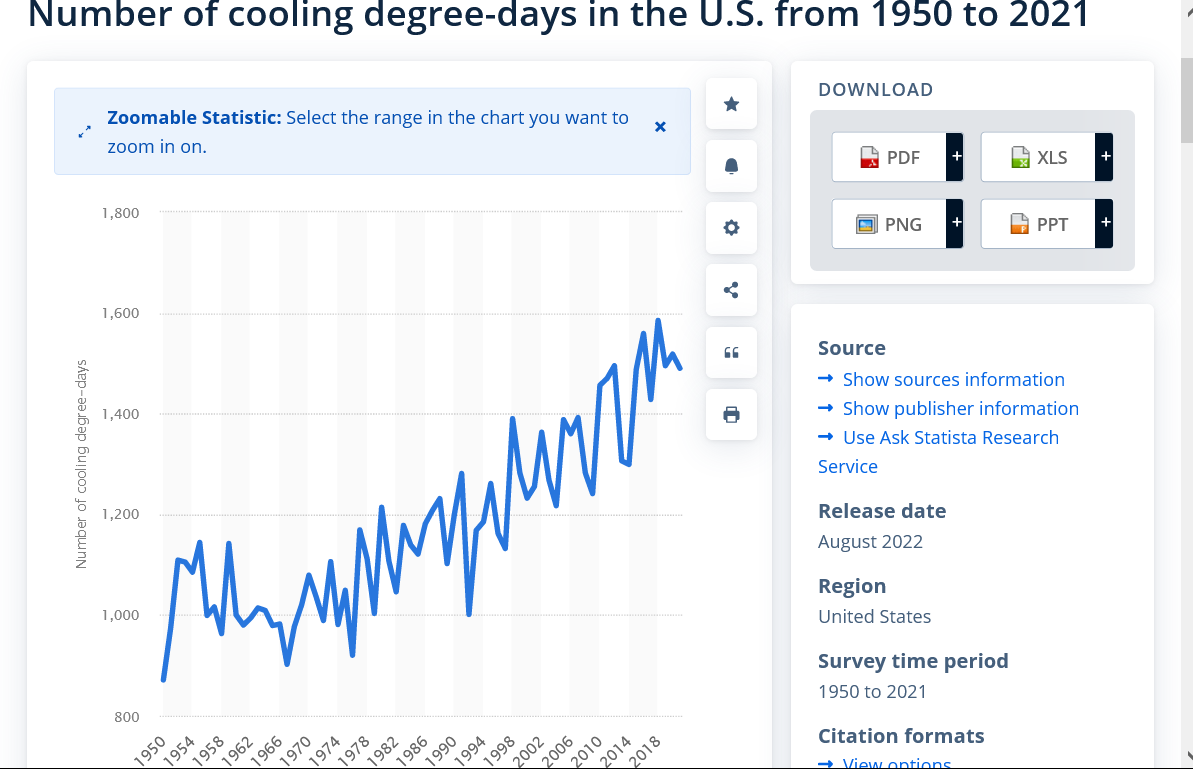
metmike: I'm going to explain how this source, uses a statistical, dishonest trick to make it look like the CDDs are increasing MUCH more than the HDDs are decreasing when the complete opposite is the truth.
1. HDDs go from 5402 to 3,936 = -1,466 HDDs
2. CDDs go from 963 to 1,585 = +622 CDDs
3. HDDs of -1,466 +CDDs of +622 = -844 degree days total for heating and cooling combined.
They accomplish the trick to make it look like the complete opposite by using a graph at the top for HDDS THAT STARTS AT 0! The 2nd one for CDDs starts at the low value of the metric they are graphing.
So they are manipulating the X axis of the graphs so that small changes on the 2nd graph are greatly magnified compared to the top graph. This is very likely intentional because its the same source, using the same data.
I see this all the time when biased/dishonest sources manipulate data to graph the fake climate crisis.
+++++++++++++++++
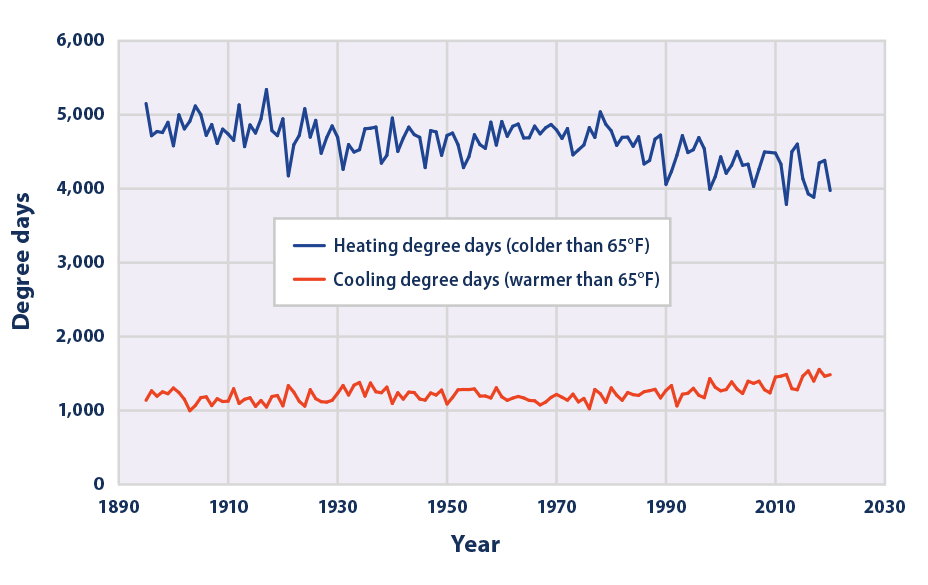
Here's an accurate, honest graphing of these 2 metrics.
https://www.epa.gov/climate-indicators/climate-change-indicators-heating-and-cooling-degree-days
You can clearly from eyeballing:
1. The blue line is MUCH GREATER and HDDs accounts for the vast majority of degree days.
2. The blue line has dropped a significant amount since the late 1970's(around -1,000 HDDs)
3. The orange line has started creeping higher since the early 1990's. It's just barely above the 1930's.
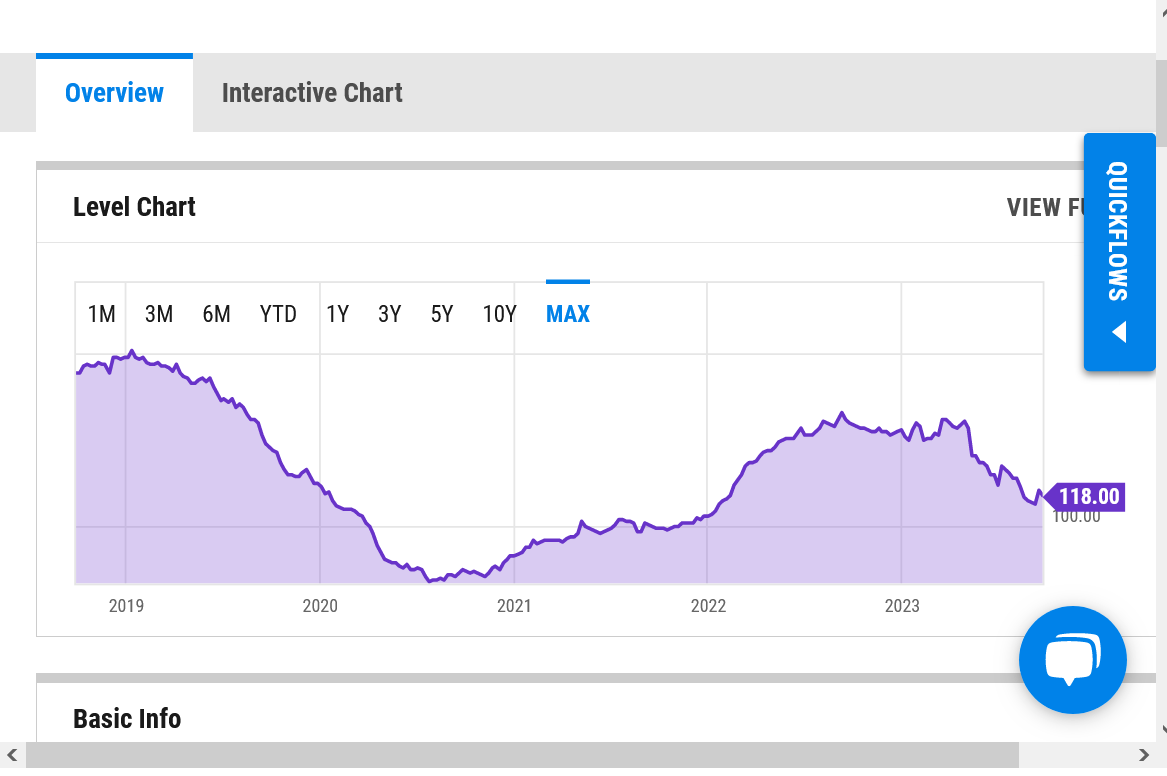
118.00 for Wk of Sep 22 2023
https://ycharts.com/indicators/us_gas_rotary_rigs
It was a big one! +90 Bcf. This has knocked NG down from the moderate gains earlier but we are still up $340/contract.
https://ir.eia.gov/ngs/ngs.html
![]()
for week ending September 22, 2023 | Released: September 28, 2023 at 10:30 a.m. | Next Release: October 5, 2023
| Working gas in underground storage, Lower 48 states Summary text CSV JSN | |||||||||||||||||||||||||
|---|---|---|---|---|---|---|---|---|---|---|---|---|---|---|---|---|---|---|---|---|---|---|---|---|---|
| Historical Comparisons | |||||||||||||||||||||||||
| Stocks billion cubic feet (Bcf) | Year ago (09/22/22) | 5-year average (2018-22) | |||||||||||||||||||||||
| Region | 09/22/23 | 09/15/23 | net change | implied flow | Bcf | % change | Bcf | % change | |||||||||||||||||
| East | 821 | 793 | 28 | 28 | 717 | 14.5 | 778 | 5.5 | |||||||||||||||||
| Midwest | 962 | 931 | 31 | 31 | 874 | 10.1 | 914 | 5.3 | |||||||||||||||||
| Mountain | 234 | 228 | 6 | 6 | 175 | 33.7 | 194 | 20.6 | |||||||||||||||||
| Pacific | 271 | 263 | 8 | 8 | 242 | 12.0 | 269 | 0.7 | |||||||||||||||||
| South Central | 1,071 | 1,053 | 18 | 18 | 955 | 12.1 | 1,015 | 5.5 | |||||||||||||||||
| Salt | 250 | 242 | 8 | 8 | 203 | 23.2 | 236 | 5.9 | |||||||||||||||||
| Nonsalt | 821 | 811 | 10 | 10 | 751 | 9.3 | 779 | 5.4 | |||||||||||||||||
| Total | 3,359 | 3,269 | 90 | 90 | 2,962 | 13.4 | 3,170 | 6.0 | |||||||||||||||||
Totals may not equal sum of components because of independent rounding. | |||||||||||||||||||||||||
Working gas in storage was 3,359 Bcf as of Friday, September 22, 2023, according to EIA estimates. This represents a net increase of 90 Bcf from the previous week. Stocks were 397 Bcf higher than last year at this time and 189 Bcf above the five-year average of 3,170 Bcf. At 3,359 Bcf, total working gas is within the five-year historical range.
For information on sampling error in this report, see Estimated Measures of Sampling Variability table below.
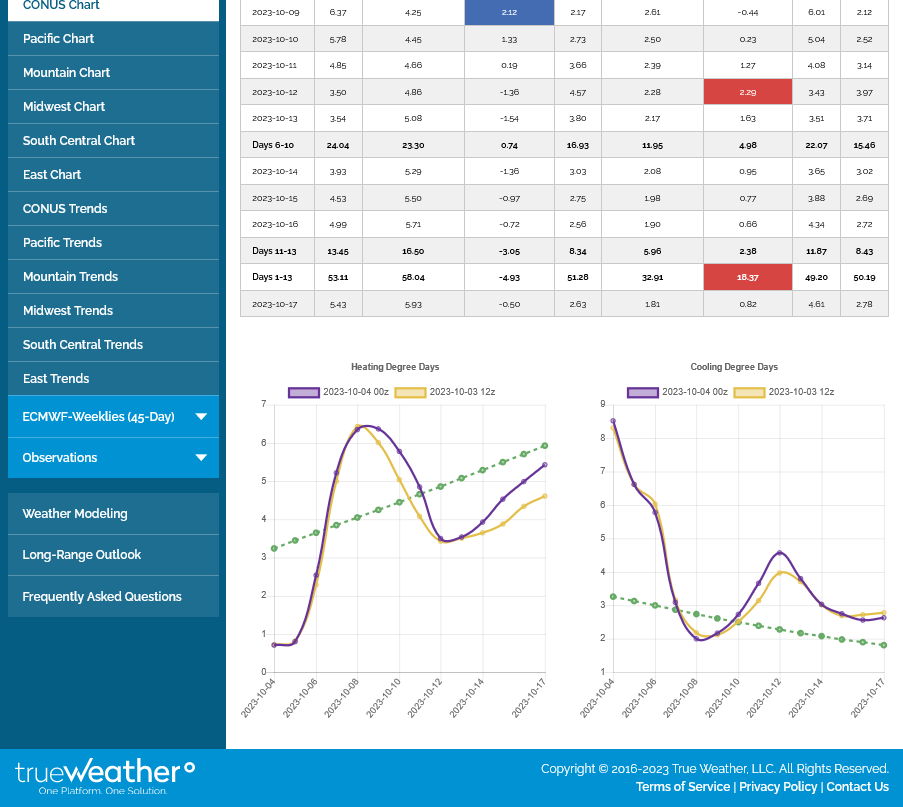
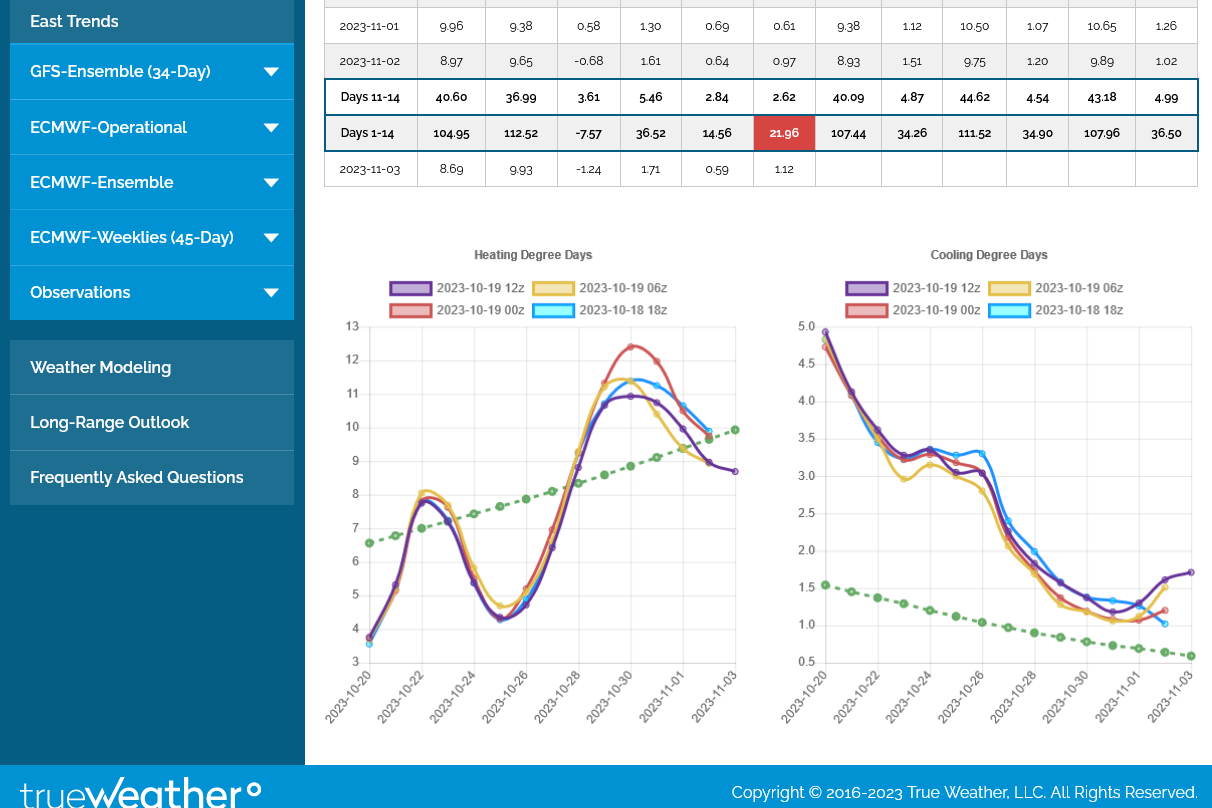
For natural gas, we've turned the corner with regards to how the market interprets temperatures. Apparently cold is now bullish and warm is bearish with this week being the seasonal date for HDDs to pass up CDDs.
From the European model below. Left is HDDs, right is CDDS. Purple is the last 0z run. Tan color was the 12z run, 12 hours before that.
You can see a lot of movement in the lines with the HDDs on the left having an upsloping trend and the CDDs on the right having a downsloping trend.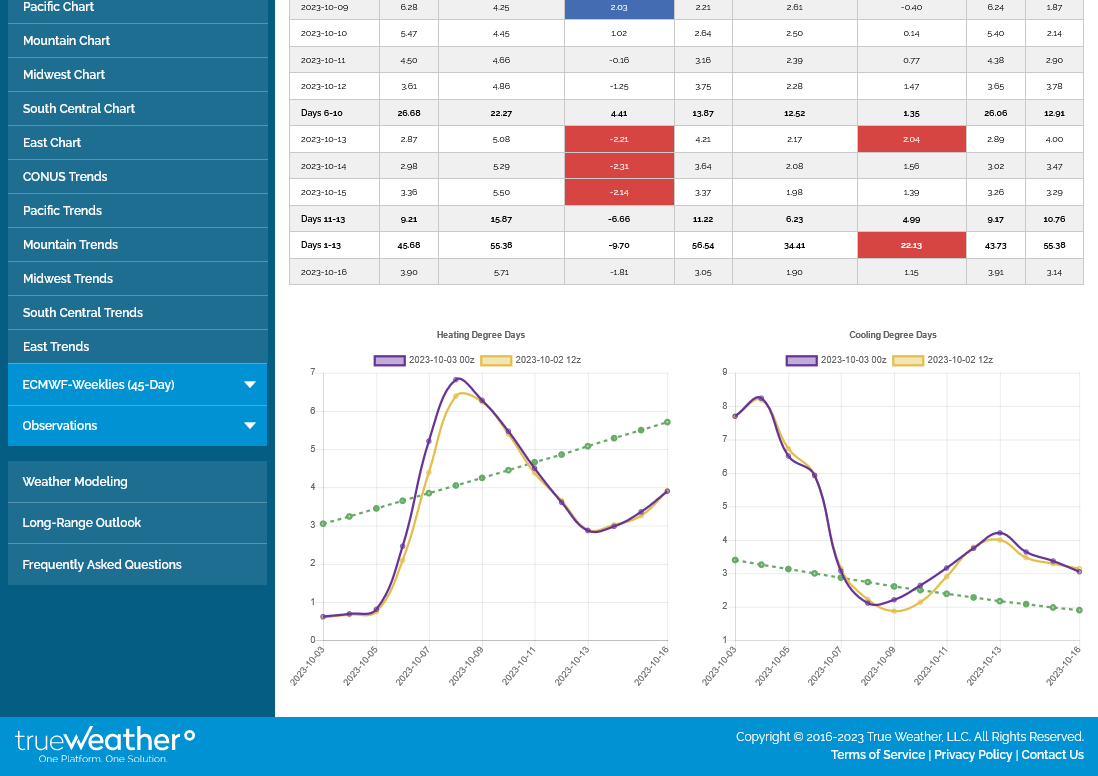
Temps last week for this Thursday's EIA. Near record warmth in the center. Probably caused some decent CDDs for the SouthCentral region but this storage report should feature a robust injection again.
Helped along by some cooler trends in the latest forecasts, natural gas futures continued to strengthen in early trading Wednesday. Coming off a 10.9-cent rally in the previous session, the November Nymex contract was up another 5.0 cents to $2.999/MMBtu at around 8:35 a.m. ET. Explanations for Tuesday’s rally were “elusive,” but seasonal buying and…
+++++++++
Last 0z European model, HDDs in purple on the left. +4 HDDs. Tan is previous model 12 hours earlier.
Natural gas futures rallied a second straight day, bolstered by cooler trends for the densely populated Northeast, spot market momentum and moderated production. At A Glance: Modest injection expected Mixed weather forecasts Production remains lower Coming off a 10.9 cent-gain the prior session, the November Nymex gas futures contract rose another 1.3 cents on Wednesday…
++++++++++
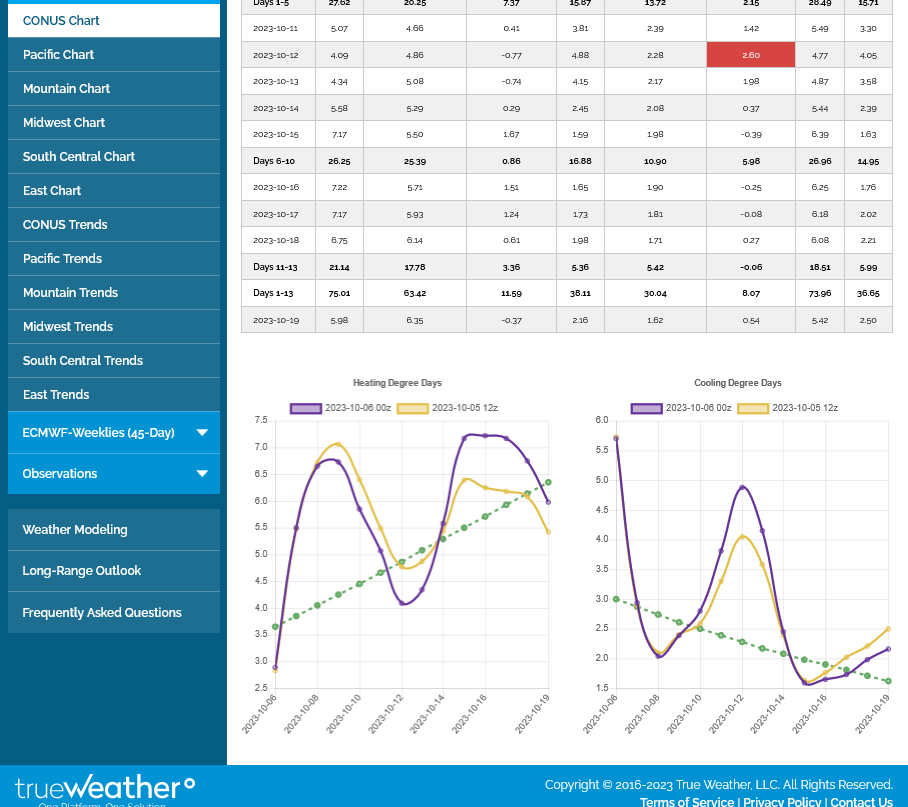
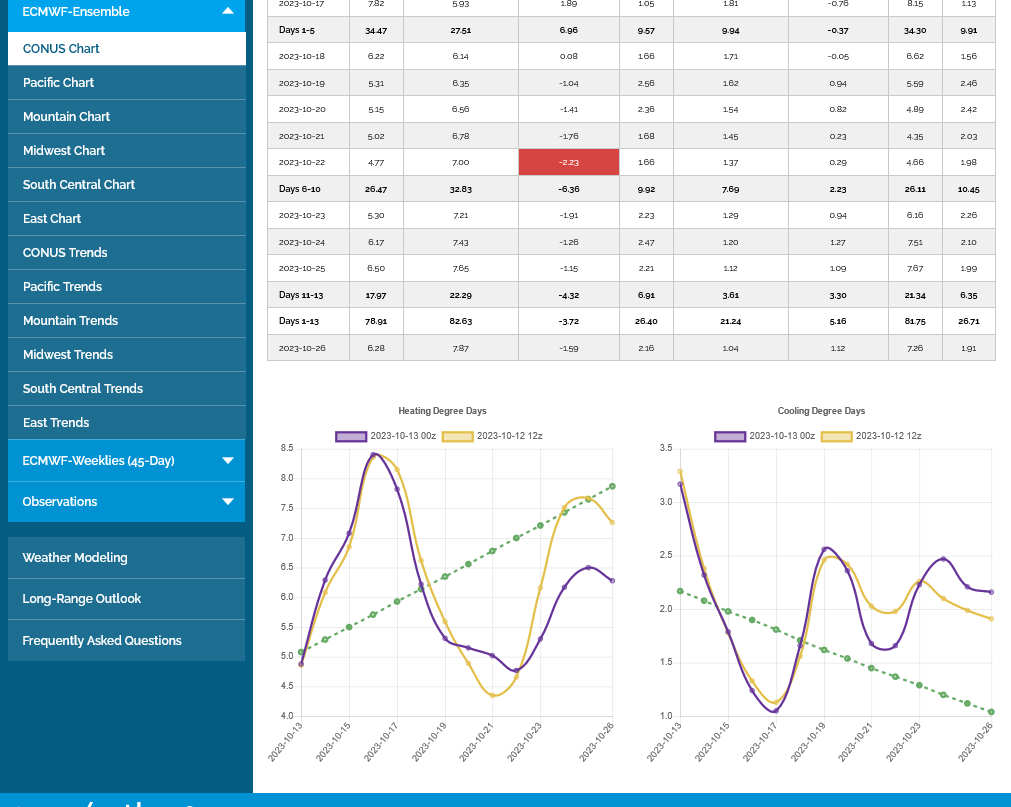
HDDs up +8 on the last 12z European mode; which gave us an afternoon bounce. It's still just October and not like this is record cold. More like moderate cold for a week, with below average temperatures!
The purple line on the left graft was the last run. All the extra cold came during the Oct. 9-15 period.
Bullish! According to the spike higher in price by the market but still the most robust injection by far since the Spring.
![]()
for week ending September 29, 2023 | Released: October 5, 2023 at 10:30 a.m. | Next Release: October 12, 2023
| Working gas in underground storage, Lower 48 states Summary text CSV JSN | |||||||||||||||||||||||||
|---|---|---|---|---|---|---|---|---|---|---|---|---|---|---|---|---|---|---|---|---|---|---|---|---|---|
| Historical Comparisons | |||||||||||||||||||||||||
| Stocks billion cubic feet (Bcf) | Year ago (09/29/22) | 5-year average (2018-22) | |||||||||||||||||||||||
| Region | 09/29/23 | 09/22/23 | net change | implied flow | Bcf | % change | Bcf | % change | |||||||||||||||||
| East | 847 | 821 | 26 | 26 | 751 | 12.8 | 807 | 5.0 | |||||||||||||||||
| Midwest | 991 | 962 | 29 | 29 | 911 | 8.8 | 949 | 4.4 | |||||||||||||||||
| Mountain | 239 | 234 | 5 | 5 | 183 | 30.6 | 200 | 19.5 | |||||||||||||||||
| Pacific | 278 | 271 | 7 | 7 | 246 | 13.0 | 273 | 1.8 | |||||||||||||||||
| South Central | 1,090 | 1,071 | 19 | 19 | 997 | 9.3 | 1,044 | 4.4 | |||||||||||||||||
| Salt | 259 | 250 | 9 | 9 | 222 | 16.7 | 249 | 4.0 | |||||||||||||||||
| Nonsalt | 830 | 821 | 9 | 9 | 775 | 7.1 | 796 | 4.3 | |||||||||||||||||
| Total | 3,445 | 3,359 | 86 | 86 | 3,088 | 11.6 | 3,273 | 5.3 | |||||||||||||||||
Totals may not equal sum of components because of independent rounding. | |||||||||||||||||||||||||
Working gas in storage was 3,445 Bcf as of Friday, September 29, 2023, according to EIA estimates. This represents a net increase of 86 Bcf from the previous week. Stocks were 357 Bcf higher than last year at this time and 172 Bcf above the five-year average of 3,273 Bcf. At 3,445 Bcf, total working gas is within the five-year historical range.
For information on sampling error in this report, see Estimated Measures of Sampling Variability table below.
Natural gas futures continued to climb early Friday amid signs of tightening underlying fundamentals following the latest government inventory data. After a furious 20.4-cent rally in the previous session, the November Nymex contract was up 4.9 cents to $3.215/MMBtu as of 8:40 a.m. ET. Prices soared Thursday as the U.S. Energy Information Administration (EIA) reported…
++++++++++
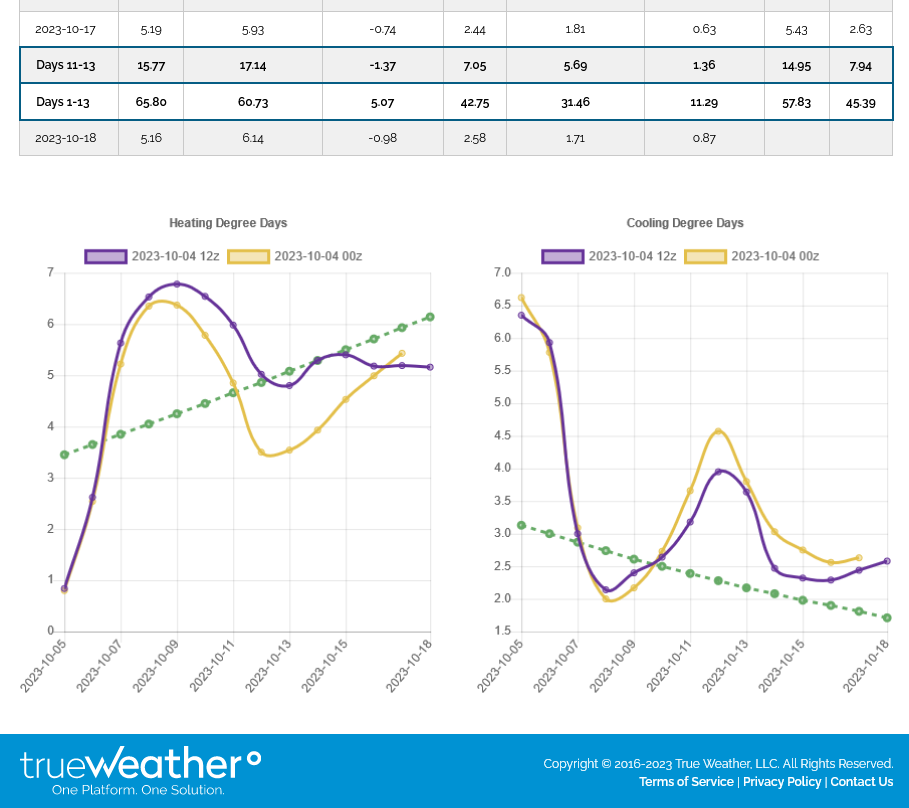
Left bottom purple was the last 0z European model. Warmer week 1, cooler week 2. The market is trading items more bullish right now than the slightly bullish weather.
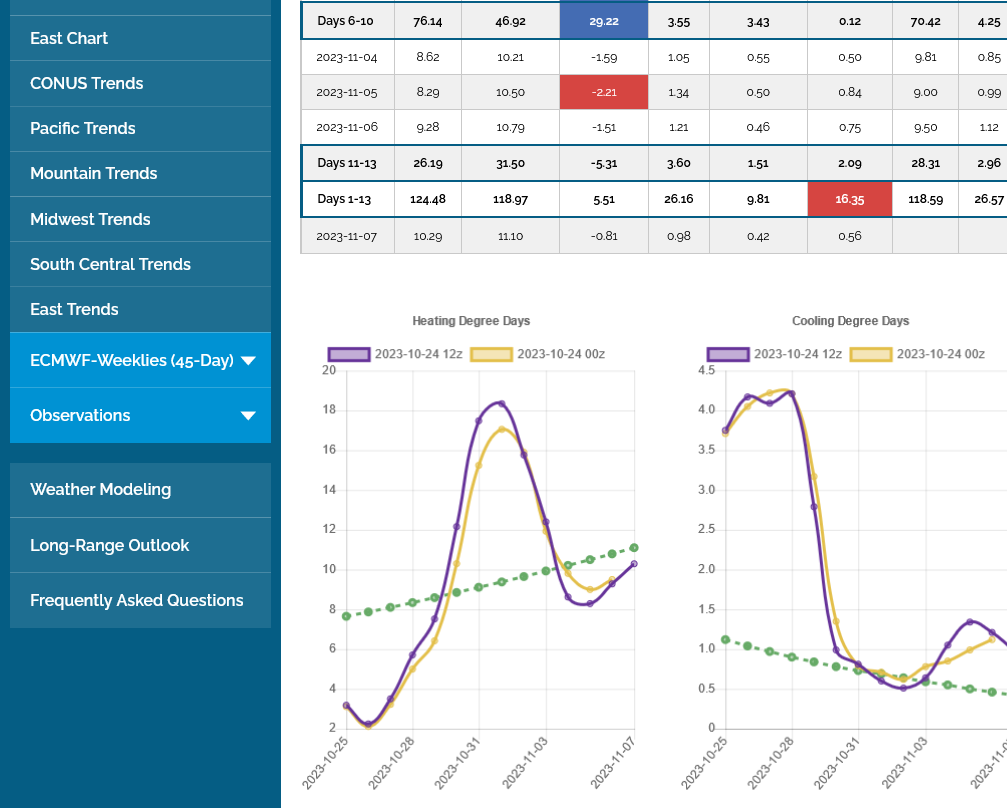
Here's the last graph of HDDs, bottom left from the last 0z European model-purple. Previous 12z run from Sunday is in tan. Not much change. Typical ups and downs with changing temps that are close to average overall.
Dashed green line is the average. Note the steep incline in HDDs as we head into the early parts of the heating season. This incline will continue until we peak in mid-January!
The graph on the right is for CDDs. Note the falling dashed green line. Above average temps from this point on are BEARISH in most places, though the south can still experience significant heat that increases AC use, from burning natural gas to generate the electricity.........but mostly on a REGIONAL scale.
Here are the temps for the period covering this Thursday's EIA storage report.
The heat was in places that often have early season HDDs but may have had some CDDs. The SouthCentral region, especially the huge demand state, TX had some significant CDDs for sure.
Overall though, this should be a very robust injection at the time of year when we usually have our biggest injections. Is 100+ possible? Are you out there, Larry?
https://www.cpc.ncep.noaa.gov/products/tanal/temp_analyses.php
Explanation from person that can't explain the weakness this morning compared to huge strength the last week(I don't have the explanation either, other than the last 6z GEFS was -3 HDDs. But the last 0z European model was +1 HDDs!)
Natural gas futures trimmed their recent gains in early trading Wednesday as a comfortable domestic supply picture to close out the injection season curbed upside for prices.
Jean,
I'm extremely grateful to you for this post/link. I know Jim Roemer well and had several conversations with him on the phone in the early/mid 1990s(before the internet) especially during the 1993 historical Mississippi flooding.
I had a paid subscription to Weather Trades that he started for a decade. Craig Solberg, who partnered with him is one of the best trading meteorologists/weather advisors in the business.
Here's Jim's complete report:
MIKE ~ I THOUGHT I'D RECOGNIZED HIS NAME FROM PREVIOUS POSTS OF YOURS.
I WAS IN IOWA, ON VACATION, DURING THAT FLOOD. I'D MAILED A PACKAGE TO IOWA & WATCHED IT FLOAT AWAY. LOL
I'VE GOT QUITE A BIT OF VCR VIDEO FROM DAVENPORT. WHAT A MESS!
Mike said:
“I had a paid subscription to Weather Trades that he started for a decade. Craig Solberg, who partnered with him is one of the best trading meteorologists/weather advisors in the business.”
——————-
Hey Mike,
Craig Solberg/Weather Trades was with Freese-Notis in the late 1990s to well into the 2000s back when I was a subscriber. So, Craig was with Jim Roemer before he was with Freese-Notis?
I probably didn't state that exactly right, Larry and it's tough to piece together because the history provided online for "Weather Trades" is missing.
We have to assume that it was just part of Freese-Notis, which started almost 2 decades before "Weather Trades".
Jim Roemer's bio states that he left Freese-Notis in 1991. But I started trading in early 1992 and talked to him on the phone a couple times just AFTER that. I will make a strong guess that because it was during extreme weather events(Great Mississippi River flood) and he probably was still living in Des Moines, that he would still interact with the meteorologists at Freese-Notis well after 1991 and they would share views and excitement for the extreme weather even if he wasn't still on the payroll?
I spoke with Craig Solberg on the phone during the 1990's, maybe dozens of times?
I turned a $2,000 account in 1992 into $600,000 at its peak in less than a decade using weather. I had a satellite dish on the roof getting weather data. There was no internet and there were no firms with meteorologists that had their own in house models like today. The market did not have the wild gyrations either. In a strong weather market, the updated models, 100% of the time dictated the price for hours after they were released. I got the models BEFORE the market reaction every single time.
I would margin out with positions on every trade on a big model change, then sit back and wait, sometimes up to an hour for the market to move strongly.
The only time that I lost money(2 times, I lost half the account) was holding huge long positions over weekends because the models changed and I couldn't get out before the huge gap lower open the following Monday morning (Sunday Night after they started Project A overnight trading).
Those days are long gone! The markets have MORE information than me today. The price makes wild gyrations that sometimes make no sense and I had my account drained to 0 on October 31, 2011 at MF Global from fraud, then again in July 2012 at PFG Best by fraud with borrowed money included.
Never recovered since then!
+++++++++
https://en.wikipedia.org/wiki/Freese-Notis
The Freese-Notis Weather company, commonly known as Freese-Notis, is a weather forecasting corporation. Headquartered in Des Moines, Iowa, United States, it has a global presence in the fields of meteorology, analytics, and related services, and also provides Internet Access DSL and Web hosting services. The company strengths for natural gas and energy markets now creates forecasts spanning industries such as media and web content found in the United States and foreign countries.
Charlie Notis and Harvey Freese both were students at Iowa State University in 1973. The company originated on the Iowa State University campus in nearby Ames while they were post-grad students at Iowa State during the 1973 oil crisis.
The partnership was formalized on May 1, 1973 with a typewriter as its first piece of office equipment and acted as collateral for shares of stock. A friend of Harvey and Charlie suggest to name the enterprise "Freese-Notis Weather." [1]
During the first couple years of existence, some of the radio listeners during the summer months would get confused when the radio announcer would introduce the Freese-Notis forecast that some thought was a "freeze-notice" forecast.
+++++++++++
Jim Roemer Bio
https://www.bestweatherinc.com/about/
Craig Solberg Bio
Bullish! +84 Bcf. Brief spike higher.
https://ir.eia.gov/ngs/ngs.html
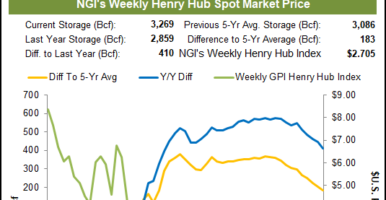
Note the blue line on the graph below, that was near the top of the range early this year, has worked it's way down towards the middle of the range but is still ABOVE the 5 year average. The rig count has been consistently dropping and exports increasing, so there is some fundamental support, especially if we see some early season cold.
October cold is not going to make a great amount of difference to the overall demand/supply picture as it will in Winter but speculative traders will use it to buy.
![]()
for week ending October 6, 2023 | Released: October 12, 2023 at 10:30 a.m. | Next Release: October 19, 2023
| Working gas in underground storage, Lower 48 states Summary text CSV JSN | |||||||||||||||||||||||||
|---|---|---|---|---|---|---|---|---|---|---|---|---|---|---|---|---|---|---|---|---|---|---|---|---|---|
| Historical Comparisons | |||||||||||||||||||||||||
| Stocks billion cubic feet (Bcf) | Year ago (10/06/22) | 5-year average (2018-22) | |||||||||||||||||||||||
| Region | 10/06/23 | 09/29/23 | net change | implied flow | Bcf | % change | Bcf | % change | |||||||||||||||||
| East | 874 | 847 | 27 | 27 | 778 | 12.3 | 832 | 5.0 | |||||||||||||||||
| Midwest | 1,021 | 991 | 30 | 30 | 947 | 7.8 | 981 | 4.1 | |||||||||||||||||
| Mountain | 244 | 239 | 5 | 5 | 189 | 29.1 | 204 | 19.6 | |||||||||||||||||
| Pacific | 278 | 278 | 0 | 0 | 249 | 11.6 | 275 | 1.1 | |||||||||||||||||
| South Central | 1,112 | 1,090 | 22 | 22 | 1,050 | 5.9 | 1,074 | 3.5 | |||||||||||||||||
| Salt | 267 | 259 | 8 | 8 | 249 | 7.2 | 262 | 1.9 | |||||||||||||||||
| Nonsalt | 845 | 830 | 15 | 15 | 800 | 5.6 | 812 | 4.1 | |||||||||||||||||
| Total | 3,529 | 3,445 | 84 | 84 | 3,213 | 9.8 | 3,366 | 4.8 | |||||||||||||||||
Totals may not equal sum of components because of independent rounding. | |||||||||||||||||||||||||
Working gas in storage was 3,529 Bcf as of Friday, October 6, 2023, according to EIA estimates. This represents a net increase of 84 Bcf from the previous week. Stocks were 316 Bcf higher than last year at this time and 163 Bcf above the five-year average of 3,366 Bcf. At 3,529 Bcf, total working gas is within the five-year historical range.
For information on sampling error in this report, see Estimated Measures of Sampling Variability table below.
-3 HDDs from the overnight, 0z European Ensemble model: Purple below/left.
The previous 12z run is the tan line.
After surging nearly 60 cents over six sessions, the November Nymex natural gas futures contract recorded three straight losses and finished trading Friday at $3.236/MMBtu, down 10.8 cents day/day and 3% for the week. At A Glance: Front month drops 10.8 cents Production volumes stronger Weather demand dissipates Analysts attributed the slump to a combination…
By Kevin Dobbs
October 13, 2023
++++++++++++++++++
Temps for next Thursdays EIA report. Chilly enough in the Midwest to have the furnaces on with increased ng demand.
https://www.cpc.ncep.noaa.gov/products/tanal/temp_analyses.php
+++++++++++++++++
HDDs for the next 2 weeks from the just out 12z European Ensemble. Purple line on the left was this last model, tan line was the previous 0z run.
Rapidly increasing seasonal HDDs are the dashed green line.
Note, that after these initial few days, we stay BELOW the seasonal average HDDs. Bearish! This means less ng demand for heating than average.
This is probably a big reason for why the ng price dropped hard on Friday.
Gap lower on the open, then a spike down, then back close to the open but no follow thru yet.
If the gap holds, its a downside breakaway gap.
If it gets filled, it's a gap and crap reversal signal. Usually a reliable selling exhaustion formation at the end of a MOVE LOWER.
NG has been moving higher recently and this would not mark a significant low of any sort except compared to Friday.
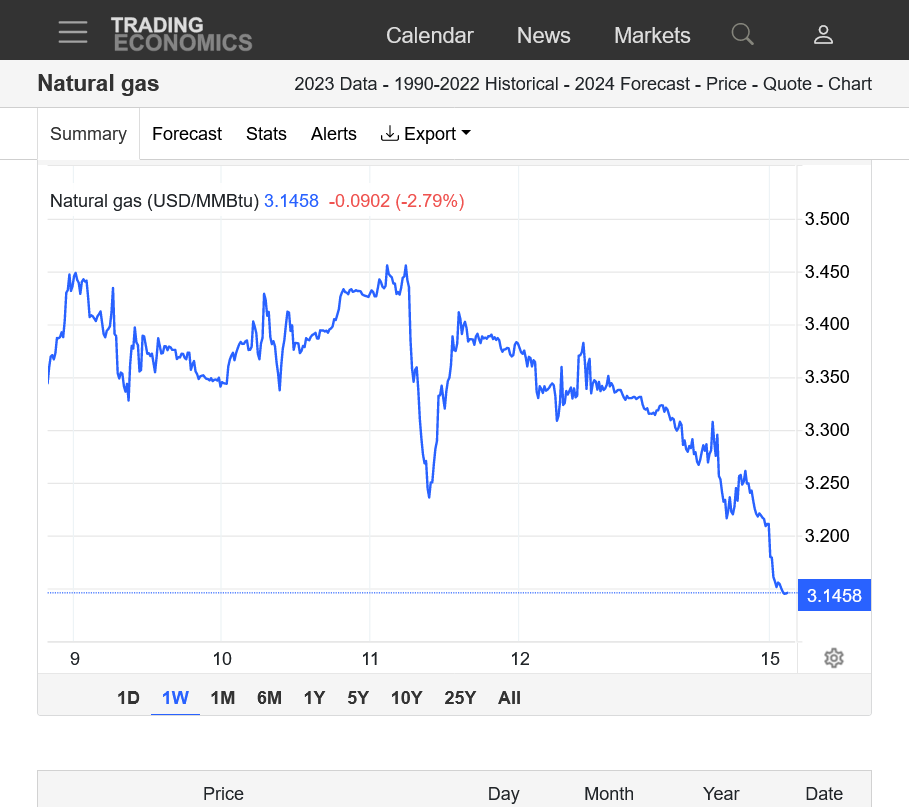
1. 35 years-spike to 13 year highs 14 months ago
2. 5 years-Spike high Aug. 2022. Spike low Apr. 2023.
3. 1 year-steady uptrend since major April 2023 low. Triple top formation?
4. 1 month-Seasonal high last week? Breaking uptrend? Double top formation?
5. 1 week-New downtrend? Downside breakaway Gap lower tonight not shown. Price below last weeks lows!
https://tradingeconomics.com/commodity/natural-gas
Bearish! Market had a big spike lower immediately after the release!
https://ir.eia.gov/ngs/ngs.html
![]()
for week ending October 13, 2023 | Released: October 19, 2023 at 10:30 a.m. | Next Release: October 26, 2023
| Working gas in underground storage, Lower 48 states Summary text CSV JSN | |||||||||||||||||||||||||
|---|---|---|---|---|---|---|---|---|---|---|---|---|---|---|---|---|---|---|---|---|---|---|---|---|---|
| Historical Comparisons | |||||||||||||||||||||||||
| Stocks billion cubic feet (Bcf) | Year ago (10/13/22) | 5-year average (2018-22) | |||||||||||||||||||||||
| Region | 10/13/23 | 10/06/23 | net change | implied flow | Bcf | % change | Bcf | % change | |||||||||||||||||
| East | 896 | 874 | 22 | 22 | 808 | 10.9 | 855 | 4.8 | |||||||||||||||||
| Midwest | 1,050 | 1,021 | 29 | 29 | 982 | 6.9 | 1,012 | 3.8 | |||||||||||||||||
| Mountain | 248 | 244 | 4 | 4 | 194 | 27.8 | 206 | 20.4 | |||||||||||||||||
| Pacific | 280 | 278 | 2 | 2 | 249 | 12.4 | 277 | 1.1 | |||||||||||||||||
| South Central | 1,152 | 1,112 | 40 | 40 | 1,093 | 5.4 | 1,101 | 4.6 | |||||||||||||||||
| Salt | 285 | 267 | 18 | 18 | 268 | 6.3 | 273 | 4.4 | |||||||||||||||||
| Nonsalt | 868 | 845 | 23 | 23 | 825 | 5.2 | 827 | 5.0 | |||||||||||||||||
| Total | 3,626 | 3,529 | 97 | 97 | 3,326 | 9.0 | 3,451 | 5.1 | |||||||||||||||||
Totals may not equal sum of components because of independent rounding. | |||||||||||||||||||||||||
Working gas in storage was 3,626 Bcf as of Friday, October 13, 2023, according to EIA estimates. This represents a net increase of 97 Bcf from the previous week. Stocks were 300 Bcf higher than last year at this time and 175 Bcf above the five-year average of 3,451 Bcf. At 3,626 Bcf, total working gas is within the five-year historical range.
For information on sampling error in this report, see Estimated Measures of Sampling Variability table below.
Utilities injected 97 Bcf of natural gas into storage for the week ended Oct. 13, bolstered by a big boost in South Central supplies, the U.S. Energy Information Administration (EIA) reported on Thursday. The result proved bearish versus expectations and recent norms – an 85 Bcf five-year average increase – and drove down Nymex natural…
++++++++
The last 12z GEFS(purple line on the left) had -2.5 HDDS vs the previous 6z run and -6.5 HDDs vs the 0z run before that one. The slowly increasing green dashed line is the average.
The gap lower on Sunday Night that we mentioned as a downside breakaway gap technical formation has predicted this weeks price crash lower.
Down over 3,000/contract this week and down 6,000/contract since last weeks double top formation. See price charts above.
Natural gas futures failed to gain traction Friday, continuing a lengthy losing streak amid elevated production volumes and strong supplies in storage. At A Glance: Stout supplies apply pressure Output holds above 102 Bcf/d Varied domestic demand view The November Nymex gas futures contract lost 5.8 cents day/day and settled at $2.899/MMBtu. It marked an…
++++++++++++++
The NWS extended guidance looks MUCH too cold:
https://www.marketforum.com/forum/topic/83844/#83852
All the weather:
https://www.marketforum.com/forum/topic/83844/
Oct 23, 2023
+++++++++++++
The very early morning, last 0z European model was a whopping +8 HDDs vs the previous 12z model from 12 hours earlier. Purple line on the left/below. Increasing dashed green is the average HDDs.
That caused us to rebound from moderate evening losses to gains earlier this morning, with some typical price uncertainty gyrations. At the moment we're just below unch.
The chilliest vs average last week was for the s/southeast parts of the country, where average temps are still pretty mild and the increased demand in residential heating was modest. So the injection this Thursday at 9:30 am on the EIA weekly report should still be VERY robust. Mild on the other side of the country.
Natural gas futures mounted momentum Tuesday and posted a second-straight gain, as forecasts pointed to frigid northern weather and production estimates pulled back sharply. The November Nymex gas futures contract settled at $2.971/MMBtu, up 4.5 cents day/day. NGI’s Spot Gas National Avg. jumped 17.5 cents to $2.220, boosted by demand in the wintry storm-laden Rocky…
++++++++++++++++++
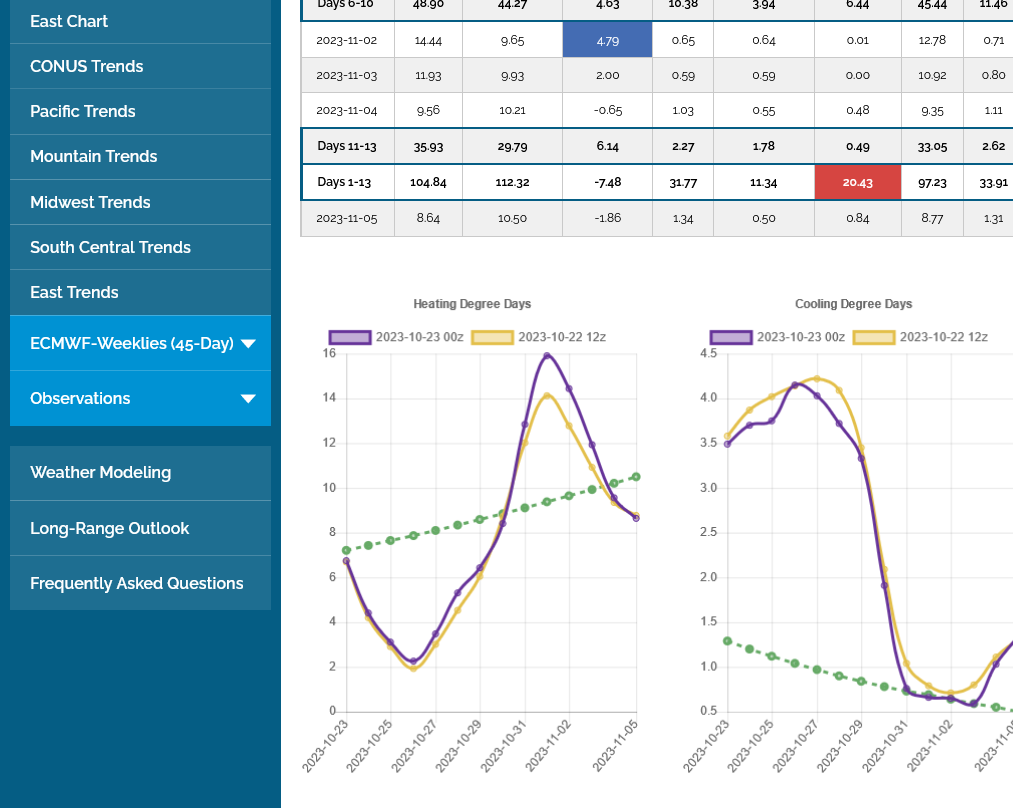
The last 12z European model (left purple line below) was a bullish +5 HDDs compared to the previous 0z run.
Dashed green line is the slowly increasing seasonal average HDDs. We are below average for several more days, spike to colder than average for 5 days(5 purple dots on the line), then down just below average.
So the cold snap really barely lasts a week. The maps at the end of week 2 are looking potentially on the mild side to start week 3, with the NAO, AO and PNA all close to zero at that time
https://www.marketforum.com/forum/topic/83844/#83856
++++++++++++++++++++++++++
European model +2.5 HDDs overnight.
BULLISH!!
Closing the huge surplus gap with last year because the Fall of 2022, featured record smashing huge injections. Regardless, current storage is still well above the 5 year average and in good shape, as can see from the blue line on the graph below.
https://ir.eia.gov/ngs/ngs.html
![]()
for week ending October 20, 2023 | Released: October 26, 2023 at 10:30 a.m. | Next Release: November 2, 2023
| Working gas in underground storage, Lower 48 states Summary text CSV JSN | |||||||||||||||||||||||||
|---|---|---|---|---|---|---|---|---|---|---|---|---|---|---|---|---|---|---|---|---|---|---|---|---|---|
| Historical Comparisons | |||||||||||||||||||||||||
| Stocks billion cubic feet (Bcf) | Year ago (10/20/22) | 5-year average (2018-22) | |||||||||||||||||||||||
| Region | 10/20/23 | 10/13/23 | net change | implied flow | Bcf | % change | Bcf | % change | |||||||||||||||||
| East | 908 | 896 | 12 | 12 | 823 | 10.3 | 872 | 4.1 | |||||||||||||||||
| Midwest | 1,075 | 1,050 | 25 | 25 | 1,004 | 7.1 | 1,035 | 3.9 | |||||||||||||||||
| Mountain | 252 | 248 | 4 | 4 | 198 | 27.3 | 208 | 21.2 | |||||||||||||||||
| Pacific | 283 | 280 | 3 | 3 | 248 | 14.1 | 277 | 2.2 | |||||||||||||||||
| South Central | 1,182 | 1,152 | 30 | 30 | 1,114 | 6.1 | 1,124 | 5.2 | |||||||||||||||||
| Salt | 299 | 285 | 14 | 14 | 276 | 8.3 | 286 | 4.5 | |||||||||||||||||
| Nonsalt | 883 | 868 | 15 | 15 | 837 | 5.5 | 838 | 5.4 | |||||||||||||||||
| Total | 3,700 | 3,626 | 74 | 74 | 3,387 | 9.2 | 3,517 | 5.2 | |||||||||||||||||
Totals may not equal sum of components because of independent rounding. Notice: EIA will delay its scheduled data releases November 8-10, 2023, to complete a planned systems upgrade. We will continue collecting energy data from survey respondents and will resume our regular publishing schedule on November 13. See our latest press release for more details. | |||||||||||||||||||||||||
Working gas in storage was 3,700 Bcf as of Friday, October 20, 2023, according to EIA estimates. This represents a net increase of 74 Bcf from the previous week. Stocks were 313 Bcf higher than last year at this time and 183 Bcf above the five-year average of 3,517 Bcf. At 3,700 Bcf, total working gas is within the five-year historical range.
For information on sampling error in this report, see Estimated Measures of Sampling Variability table below.
The 12z GEFS run was a whopping +13 HDDs vs the previous 2 runs. Mainly just delays the warm up in early November by a day or 2, then less mild at the end of the period.
++++++++++++++++++
Natural gas futures rallied again Thursday, gaining ground a fourth time this week as government inventory data signaled that gradually emerging heating demand and stronger LNG volumes are offsetting robust production – with winter looming. The November Nymex gas futures contract spiked 20.4 cents day/day and settled at $3.214/MMBtu. December, which takes over as the…
+++++
10pm:
12z European model was +9 HDDs.
18z GEFS backed off with -4 HDDs
Huge gap lower on the Sunday Night open.
Mild temps kicking in for mid November!
Forecast continues milder for mid November and we've extended the losses and confirming the open last night as a downside break away gap.
The technical pattern/signature is especially strong near the top of a big move up, which is the case here. A continuation of the milder outlooks will seal the fate lower and confirm a short term top was posted at the end of last week.
Seasonally, late October is within the window of high probability for this type of top.
Nat-Gas Prices Sink on the Outlook for Above-Normal U.S. Temps
Nat-gas prices have support from concern about global supplies after Chevron shut down a nat-gas production field in Israel because of safety concerns tied to the Israel-Hamas conflict. As a result of the drop in fuel flows, Egypt said it is re-examining plans to export LNG to Europe.
Thanks much, Jean!
The extremely mild temps last week during the period for Thursdays EIA storage report suggests that it will be very robust/bearish! However, the market knew about those temps in mid October and dialed them in when that warmth was first showing up on weather models.
Those warm temps with the big injection number estimates are not going to change much the next 3 days(as we mainly trade mid/late November weather right now).
The huge exception will happen when this next EIA report is released. At that moment, the market is likely to spike up or down strongly, based on the number compared to expectations. If the number is MUCH bigger or smaller, we are likely to build on that reaction(depending on the weather forecast then-if it favors the same direction as the EIA number, that provides the best chance for a big follow thru move).
https://www.cpc.ncep.noaa.gov/products/tanal/temp_analyses.php
Increased November chills for key demand markets in updated forecasts lifted natural gas futures to early gains Tuesday. The December Nymex contract, after shedding 13.1 cents in the previous session, was up 7.2 cents to $3.424/MMBtu at around 8:42 a.m. ET. Both the American and European weather models added heating degree days to the outlook…
++++++++++++
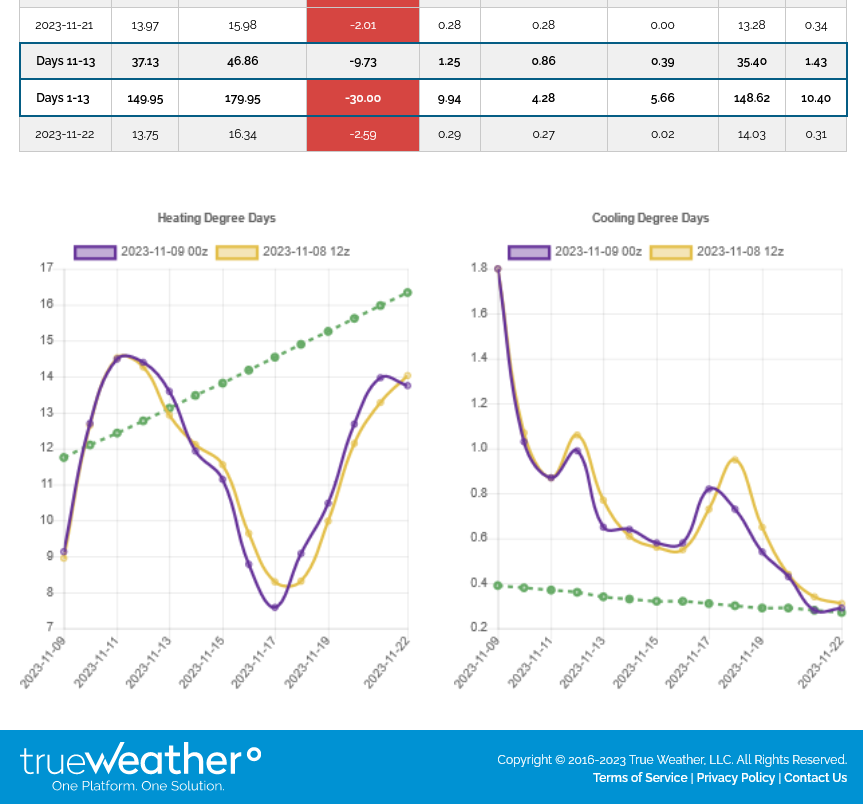
The 0z models were a paltry +2 HDDs but the 6z GEFS was +8 HDDs on top of that. However, the overall pattern in mid November still turns very mild. Weather is not likely the driving source here!
We've filled the gap from Sunday Night which suggests a gap and crop reversal formation. This would be especially powerful at the end of a move down, marking an exhaustion gap.
In this case, its hard to ascertain how significant it is. It could just be a market being extremely sensitive to small changes in weather OR more likely some bullish non weather fundamentals, with the rig count dropping and potential for increasing demand from exports as Jean's article yesterday suggested.
12z GEFS was a whopping -12 HDDs bearish vs the previous 6z run and -3 HDDs vs the 0z run before that.........but NG is + $2,220/contract, confirming that this IS NOT U.S. WEATHER RELATED.
0Z European model was -10 HDDs overnight. Bearish!
![]()
https://ir.eia.gov/ngs/ngs.html
for week ending October 27, 2023 | Released: November 2, 2023 at 10:30 a.m. | Next Release: November 16, 2023
| Working gas in underground storage, Lower 48 states Summary text CSV JSN | |||||||||||||||||||||||||
|---|---|---|---|---|---|---|---|---|---|---|---|---|---|---|---|---|---|---|---|---|---|---|---|---|---|
| Historical Comparisons | |||||||||||||||||||||||||
| Stocks billion cubic feet (Bcf) | Year ago (10/27/22) | 5-year average (2018-22) | |||||||||||||||||||||||
| Region | 10/27/23 | 10/20/23 | net change | implied flow | Bcf | % change | Bcf | % change | |||||||||||||||||
| East | 925 | 908 | 17 | 17 | 845 | 9.5 | 886 | 4.4 | |||||||||||||||||
| Midwest | 1,100 | 1,075 | 25 | 25 | 1,037 | 6.1 | 1,056 | 4.2 | |||||||||||||||||
| Mountain | 255 | 252 | 3 | 3 | 203 | 25.6 | 210 | 21.4 | |||||||||||||||||
| Pacific | 285 | 283 | 2 | 2 | 247 | 15.4 | 277 | 2.9 | |||||||||||||||||
| South Central | 1,214 | 1,182 | 32 | 32 | 1,154 | 5.2 | 1,146 | 5.9 | |||||||||||||||||
| Salt | 313 | 299 | 14 | 14 | 296 | 5.7 | 299 | 4.7 | |||||||||||||||||
| Nonsalt | 901 | 883 | 18 | 18 | 858 | 5.0 | 847 | 6.4 | |||||||||||||||||
| Total | 3,779 | 3,700 | 79 | 79 | 3,486 | 8.4 | 3,574 | 5.7 | |||||||||||||||||
Totals may not equal sum of components because of independent rounding. Notice: EIA will delay its scheduled data releases November 8-10, 2023, to complete a planned systems upgrade. We will continue collecting energy data from survey respondents and will resume our regular publishing schedule on November 13. See our latest press release for more details. | |||||||||||||||||||||||||
Working gas in storage was 3,779 Bcf as of Friday, October 27, 2023, according to EIA estimates. This represents a net increase of 79 Bcf from the previous week. Stocks were 293 Bcf higher than last year at this time and 205 Bcf above the five-year average of 3,574 Bcf. At 3,779 Bcf, total working gas is within the five-year historical range.
For information on sampling error in this report, see Estimated Measures of Sampling Variability table below.
+++++++++++++
By Chris Newman
November 2, 2023
++++++++++++
metmike: We were down almost $1,000/contract very early this morning from the mild mid November forecasts but couldn't stay down there. The last 12z European model just out that is +6 HDDs/bullish vs the previous 0z run, even has us with $220/contract gains! Despite that, the weather forecast is still modestly BEARISH. We are not higher here because of anybody seeing much colder weather. It's from SOMETHING ELSE!
Thanks, Jean!
The weather is on the bearish side. The 0z European model was -3 HDDs, seen below in purple on the left. Green dashed line is the increasing average HDDs. However the last GEFS was +9 HDDs. Regardless, cold shots look to be brief, trading off with warm ups for an overall mild vs average outlook.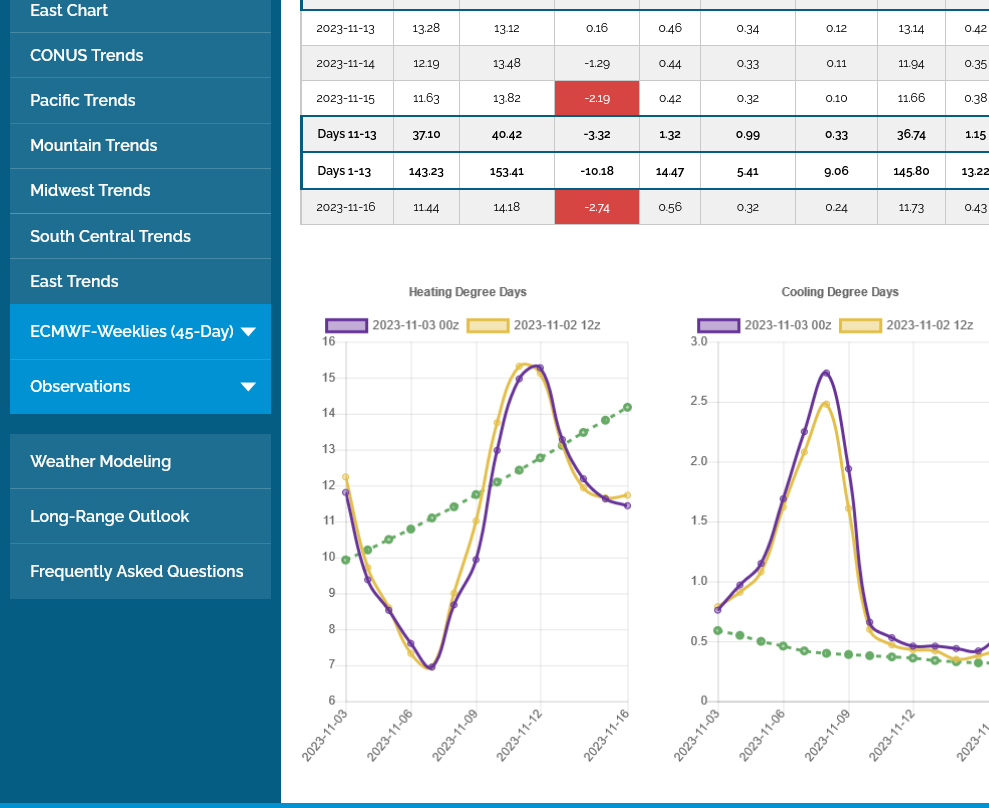
Mild outlook for mid November onward!
Modest gap lower that looks like a downside break away/bearish gap. European model was +2 HDDs that caused a dinky bounce but we've been under selling pressure very early this morning.
All the weather: https://www.marketforum.com/forum/topic/83844/
Mild extended outlooks!
https://www.marketforum.com/forum/topic/83844/#83852
Same very mild forecast. 0z run of the European model HDDs were -3 vs the previous run and even more bearish. Its the purple line on the left below. The previous run is in tan. The dashed green line is the slowly increasing average. 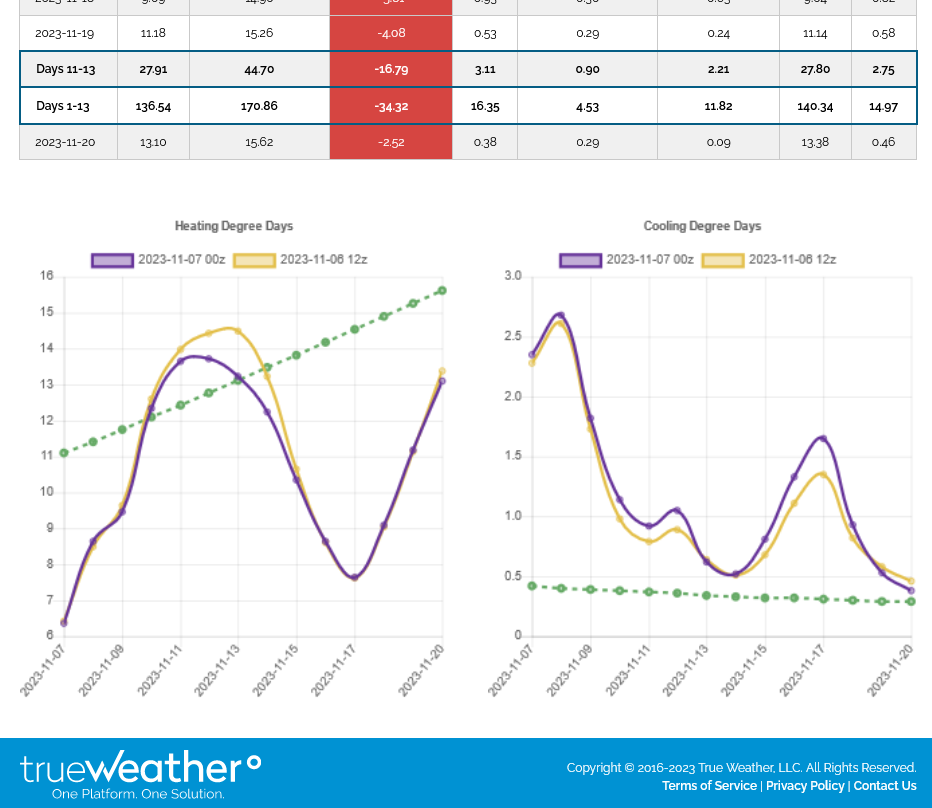
The forecasts remain very mild for the next 2 weeks. Note the last 0Z European model in purple on the left below. Tan was the previous one. Both lines well BELOW the dashed green line which is the slowly increasing seasonal average HDDs.
 ++++++++++++++++++
This was the temp map vs average for last week. Extremely cold vs average in the middle of the country.
Please note that there will NOT be a storage report today at 9:30am because the EIA is doing a system upgrade. Instead, next week, 11-16-23, they will publish 2 weeks worth of data.
https://www.eia.gov/pressroom/releases/press545.php