Previous thread:
Natural Gas 4-2-23
29 responses |
Started by metmike - April 2, 2023, 8:35 p.m.
https://www.marketforum.com/forum/topic/94295/
+++++++++++++
Momentum for natural gas futures proved further elusive on Thursday following an in-line government inventory report that kept supplies at a hefty surplus relative to historic averages. Strong production and weak weather-driven demand continued to command traders’ attention. The June Nymex gas futures contract fell 6.9 cents day/day and settled at $2.101/MMBtu. July lost 6.3…
May 4, 2023
The U.S. Energy Information Administration (EIA) reported an injection of 54 Bcf natural gas into storage for the week ended April 28. The result was essentially on par with expectations and failed to provide support for floundering Nymex natural gas futures. Ahead of the EIA print, the June Nymex gas futures contract was down 5.8…
![]()
https://ir.eia.gov/ngs/ngs.html
for week ending April 28, 2023 | Released: May 4, 2023 at 10:30 a.m. | Next Release: May 11, 2023
| Working gas in underground storage, Lower 48 states Summary textCSVJSN | |||||||||||||||||||||||||
|---|---|---|---|---|---|---|---|---|---|---|---|---|---|---|---|---|---|---|---|---|---|---|---|---|---|
| Historical Comparisons | |||||||||||||||||||||||||
| Stocks billion cubic feet (Bcf) | Year ago (04/28/22) | 5-year average (2018-22) | |||||||||||||||||||||||
| Region | 04/28/23 | 04/21/23 | net change | implied flow | Bcf | % change | Bcf | % change | |||||||||||||||||
| East | 410 | 390 | 20 | 20 | 251 | 63.3 | 301 | 36.2 | |||||||||||||||||
| Midwest | 481 | 468 | 13 | 13 | 322 | 49.4 | 360 | 33.6 | |||||||||||||||||
| Mountain | 95 | 90 | 5 | 5 | 92 | 3.3 | 97 | -2.1 | |||||||||||||||||
| Pacific | 100 | 90 | 10 | 10 | 175 | -42.9 | 193 | -48.2 | |||||||||||||||||
| South Central | 977 | 971 | 6 | 6 | 715 | 36.6 | 772 | 26.6 | |||||||||||||||||
| Salt | 278 | 275 | 3 | 3 | 230 | 20.9 | 247 | 12.6 | |||||||||||||||||
| Nonsalt | 699 | 695 | 4 | 4 | 486 | 43.8 | 525 | 33.1 | |||||||||||||||||
| Total | 2,063 | 2,009 | 54 | 54 | 1,556 | 32.6 | 1,722 | 19.8 | |||||||||||||||||
Totals may not equal sum of components because of independent rounding. | |||||||||||||||||||||||||
Working gas in storage was 2,063 Bcf as of Friday, April 28, 2023, according to EIA estimates. This represents a net increase of 54 Bcf from the previous week. Stocks were 507 Bcf higher than last year at this time and 341 Bcf above the five-year average of 1,722 Bcf. At 2,063 Bcf, total working gas is within the five-year historical range.
For information on sampling error in this report, see Estimated Measures of Sampling Variability table below.

+++++++++
7 day temps last week for this report. Unseasonably cold in much of the country, especially the center/Midwest!
https://www.cpc.ncep.noaa.gov/products/tanal/temp_analyses.php
+++++++++++++++++++++++++
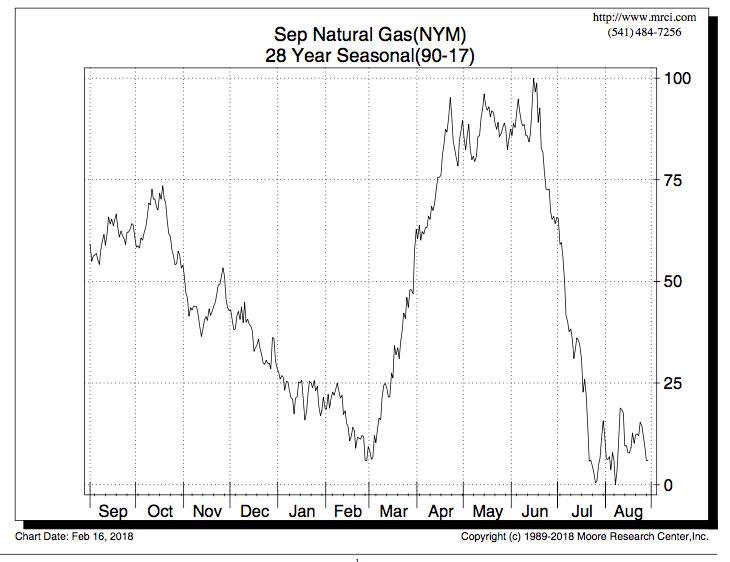
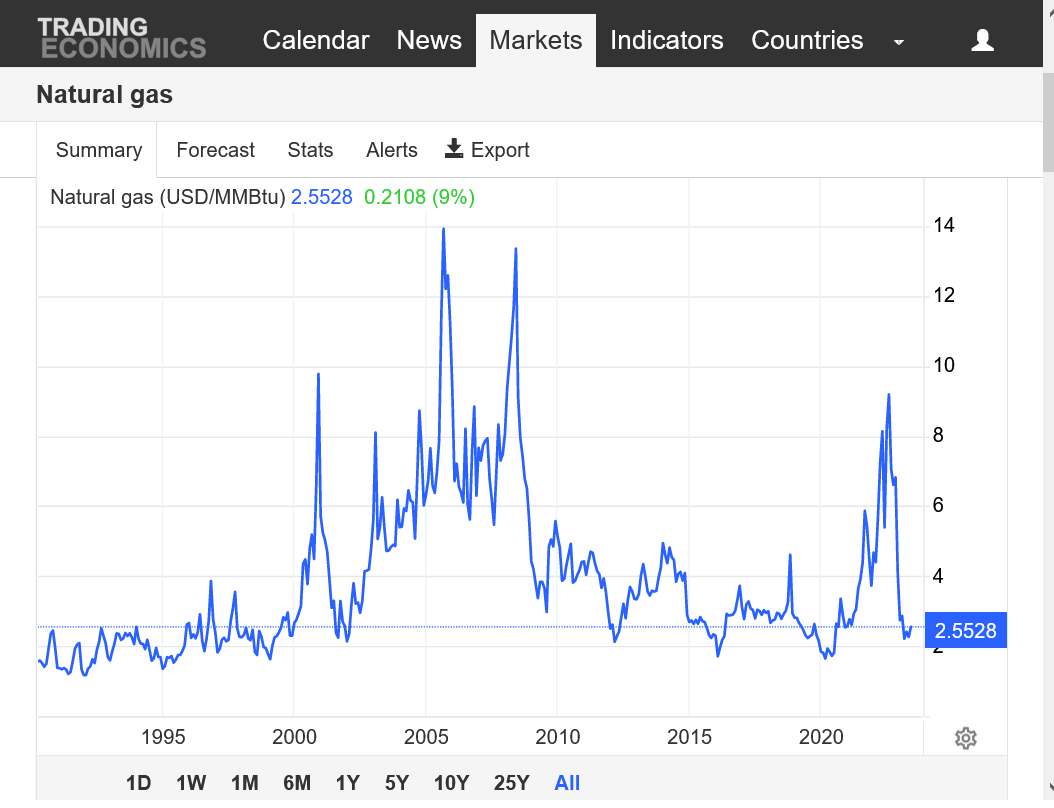
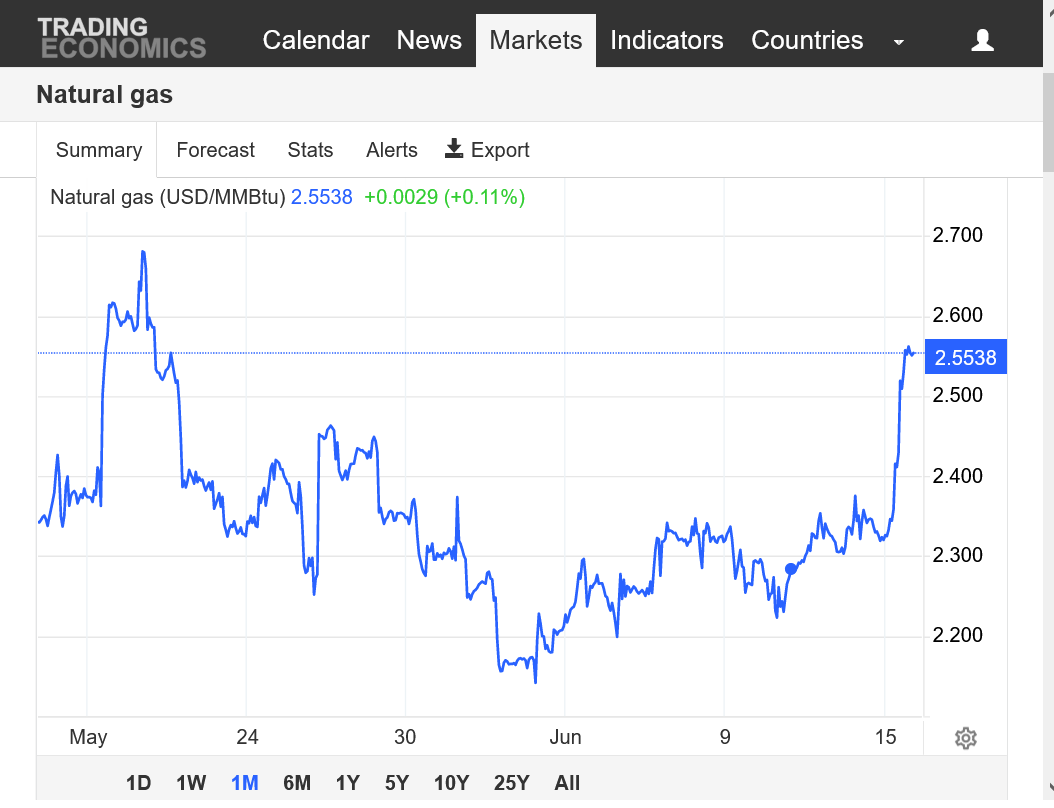
Below: Look at what the price of natural gas did historically based on the averages in March/April. It seems hard to believe that we are near contracts lows for June with such a strong positive seasonal but supplies are really gushing in at record levels right now.
+++++++
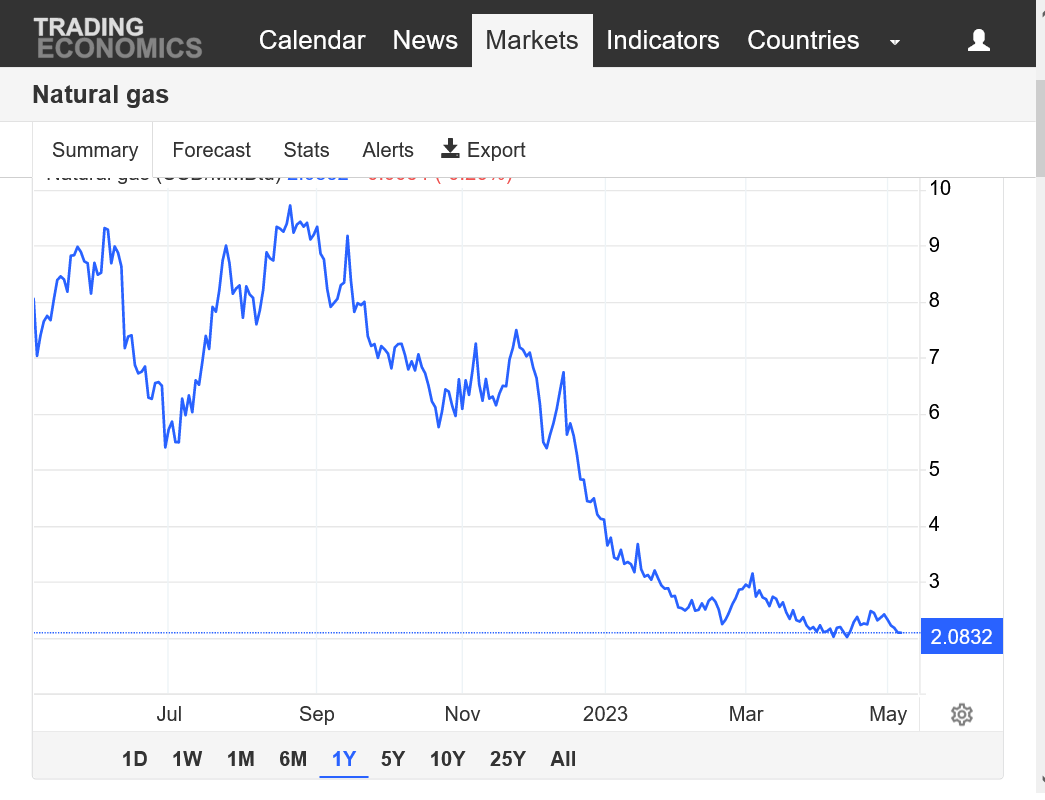
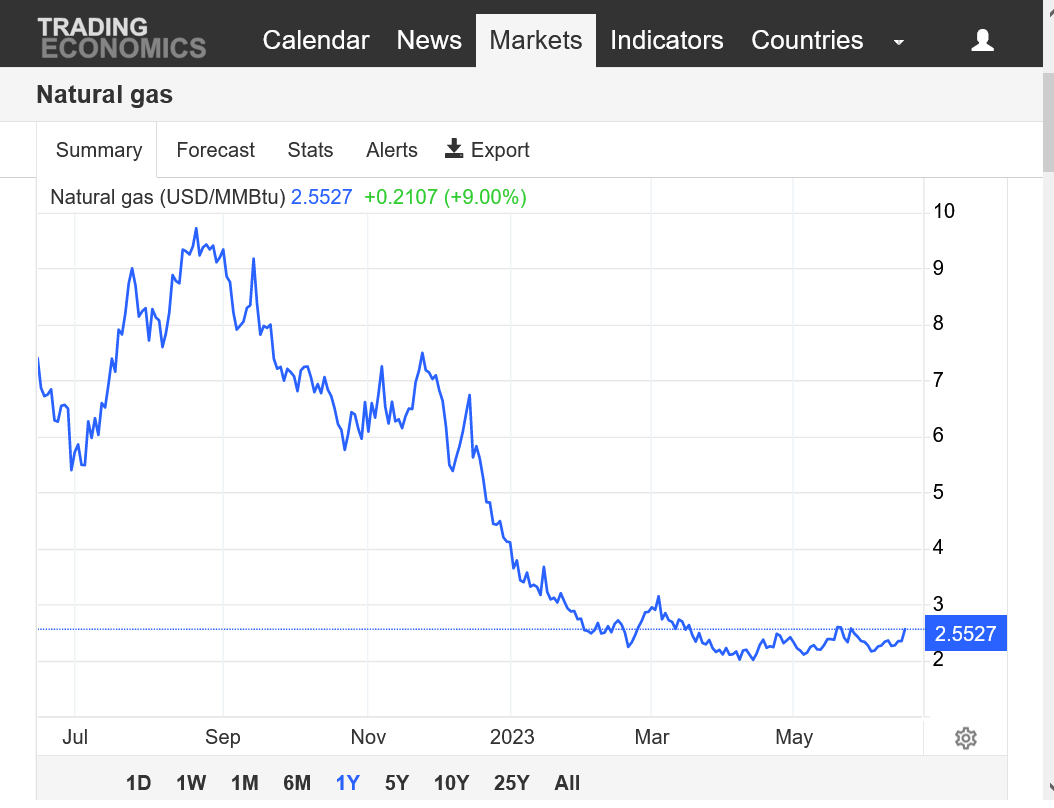
1. 1 year chart
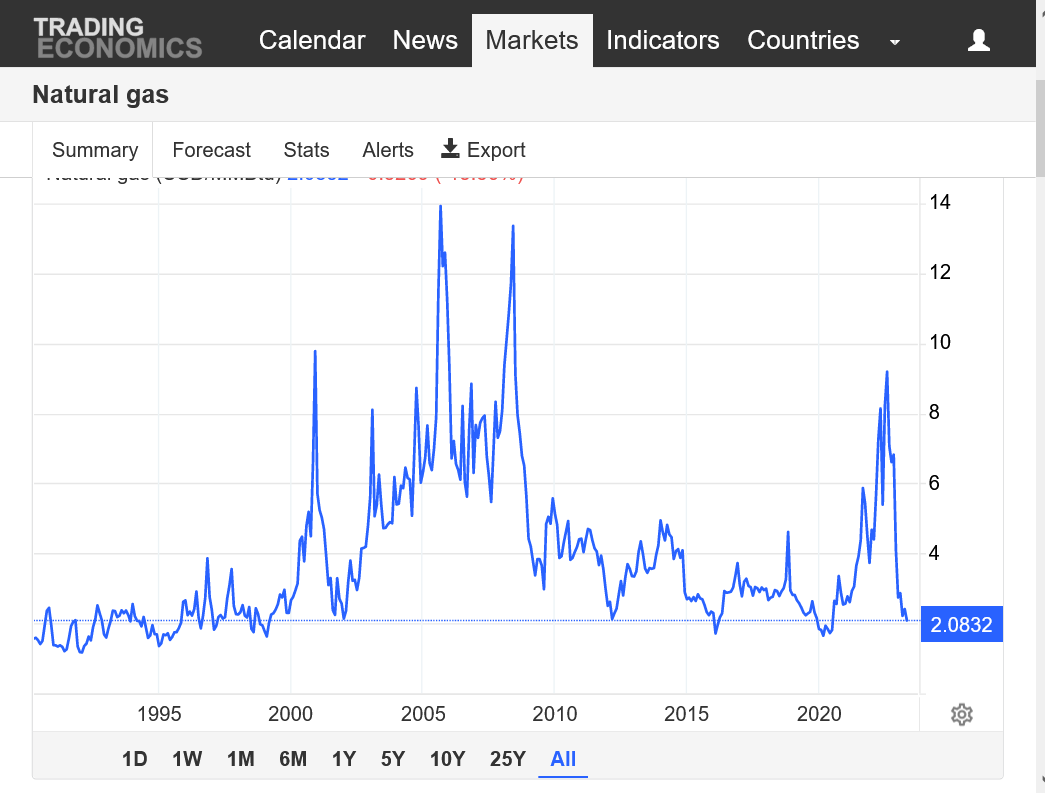
2. 30+ year chart
https://tradingeconomics.com/commodity/natural-gas
GOOD!! LOL KEEP GUSHING IT IN!
MY PROPANE BUDGET JUMPED ~ $540.00 LAST YEAR. THE BUDGET FOR NEXT YEAR, WILL GET SET, NEXT MONTH.
THANKS, MIKE!
Natural gas futures found further momentum on Monday, rallying a second consecutive session amid bargain buying, hints of a potential pullback in U.S. production and wildfires that interrupted output in Canada and boosted cash markets. At A Glance: Wildfires crimp Canadian output U.S. rig count hints at slowdown Cooling demand further softens The June Nymex…
+++++++++++++++++++++
There is more to production than just the rig count below.
https://ycharts.com/indicators/us_gas_rotary_rigs
 ++++++++++++
Pretty chilly last week, so the injection number this Thursday won't be too robust.
https://www.cpc.ncep.noaa.gov/products/tanal/temp_analyses.php
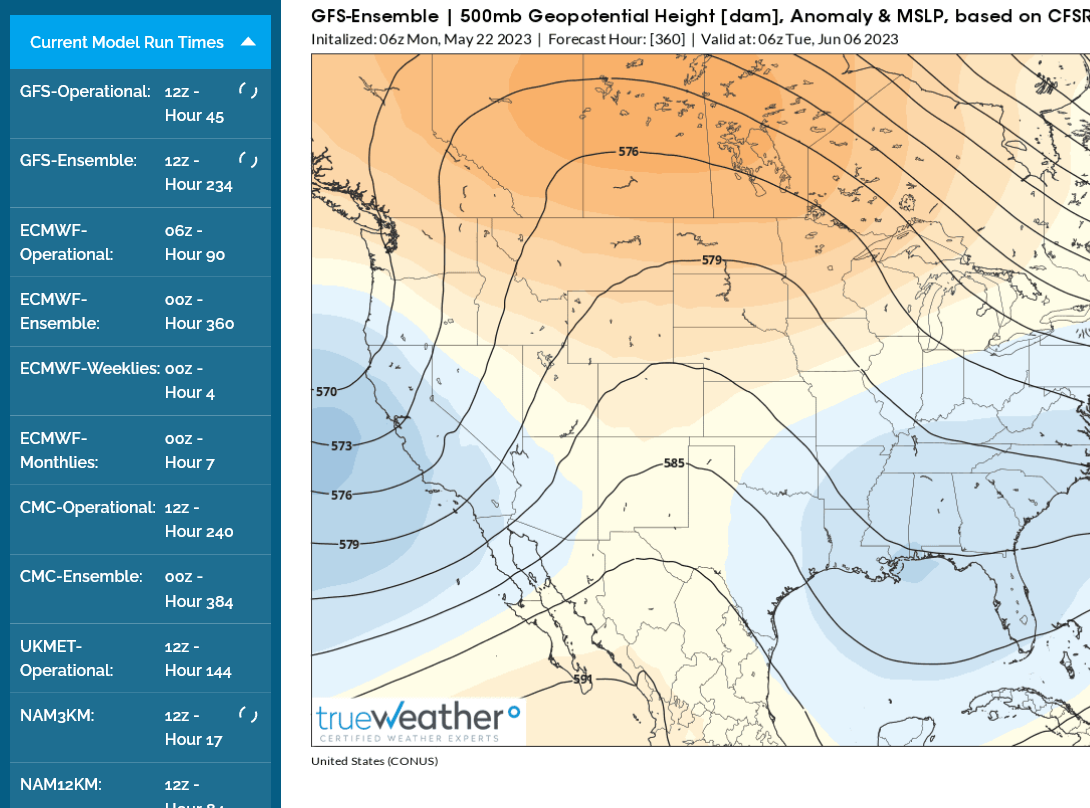
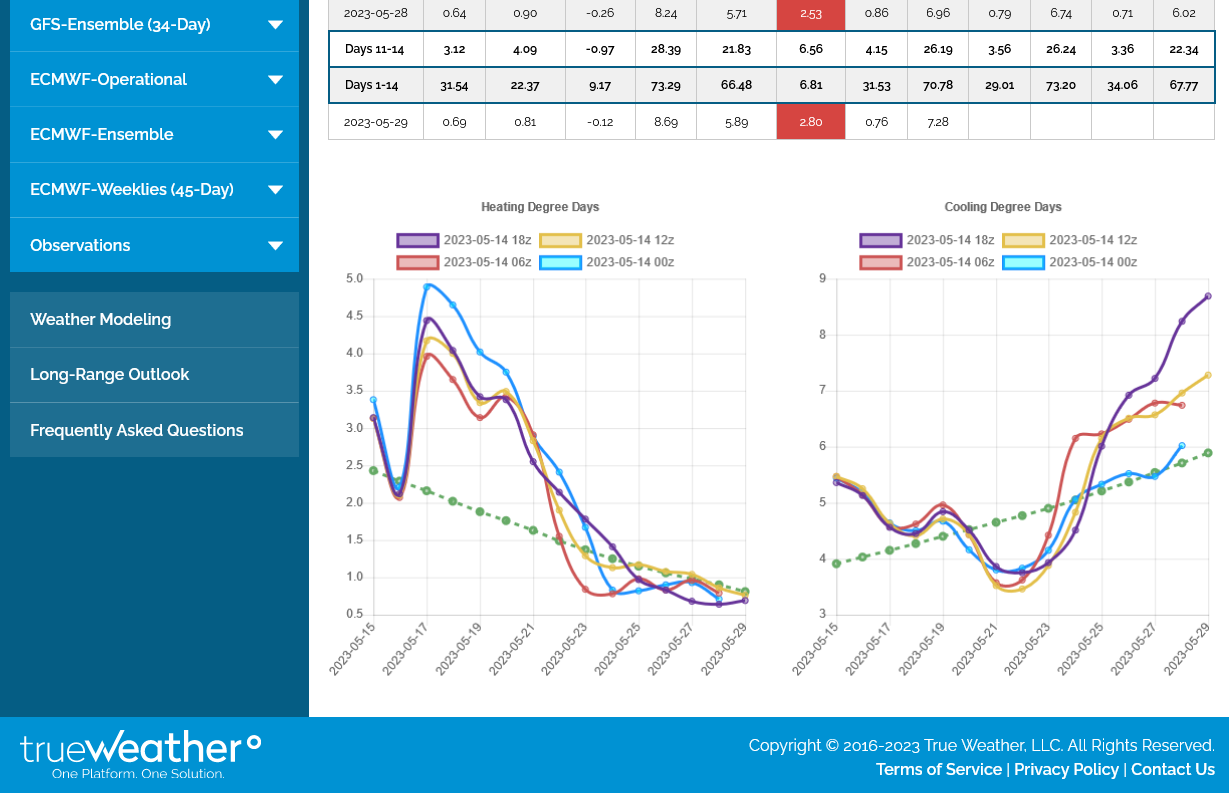
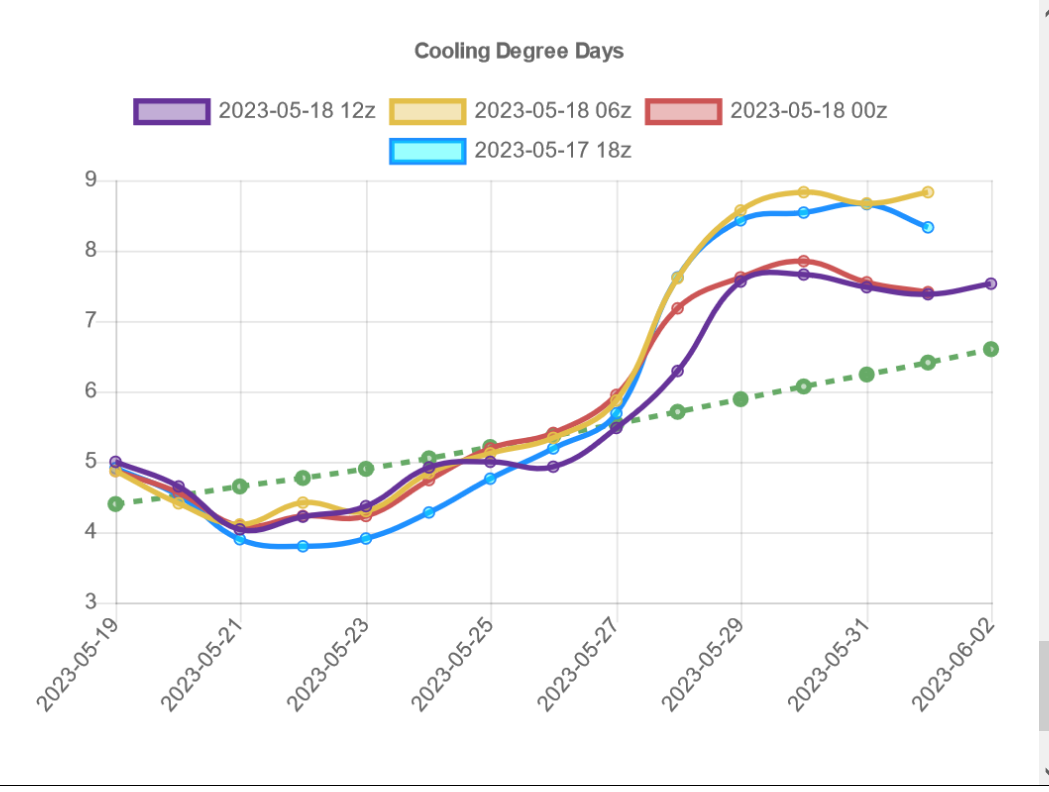
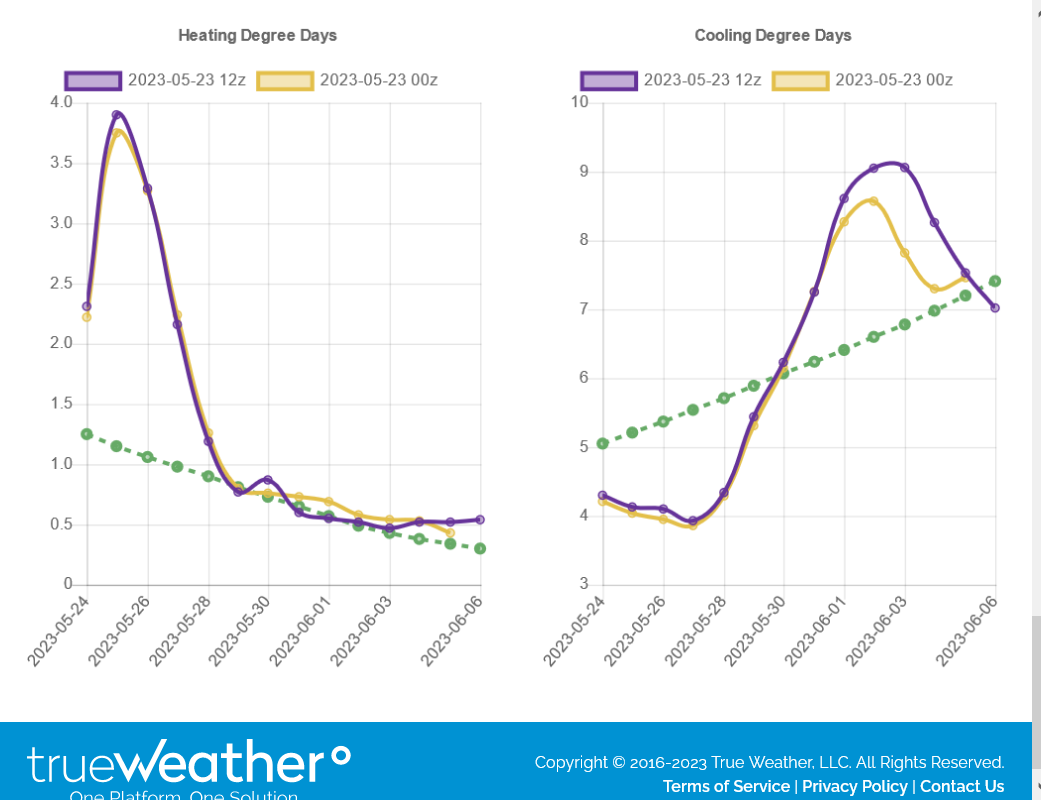
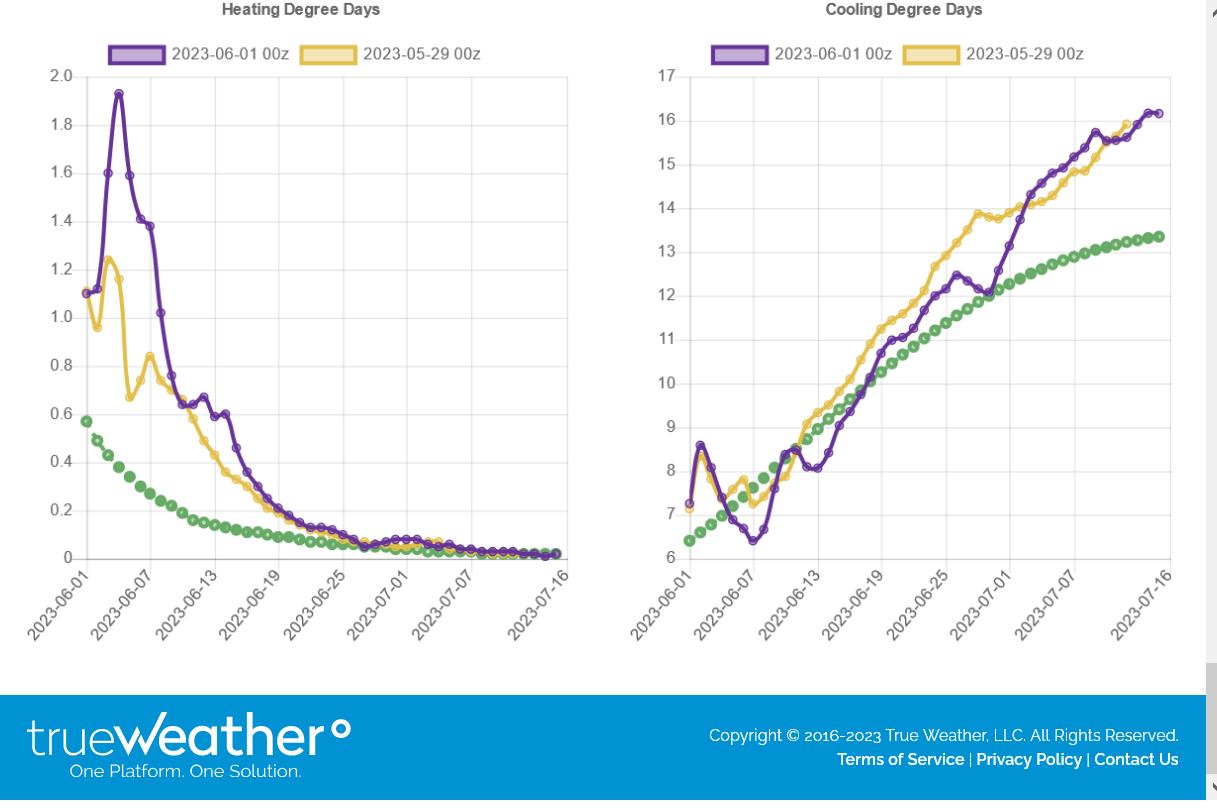
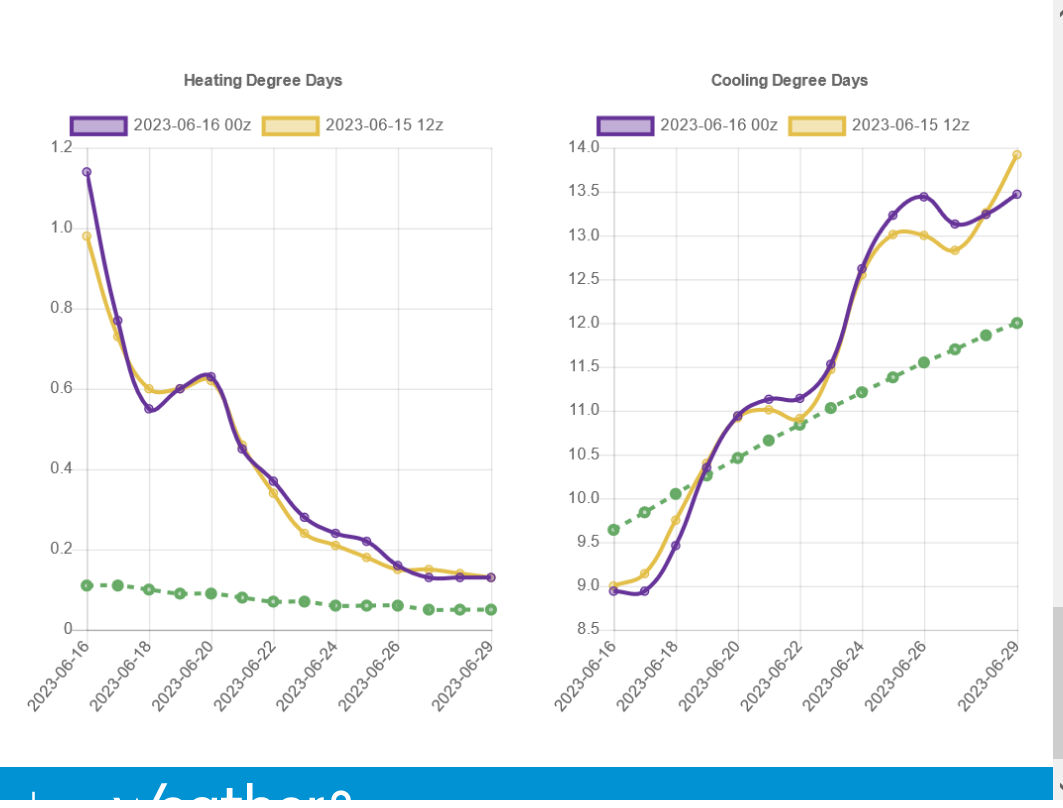
Cooling Degree Days are now seasonally higher than Heating Degree Days. This will continue until they go the other way in October. This was the last 0z run of the European Ensemble model.
HOT weather is now clearly bullish and COOL weather is bearish until then.
Note the dashed green lines below which represent the 30 year averages. HDD's are on the left below (falling fast). CDD's on the right(increasing fast).
CDD's just passed up HDD's! The scales are different on each side.
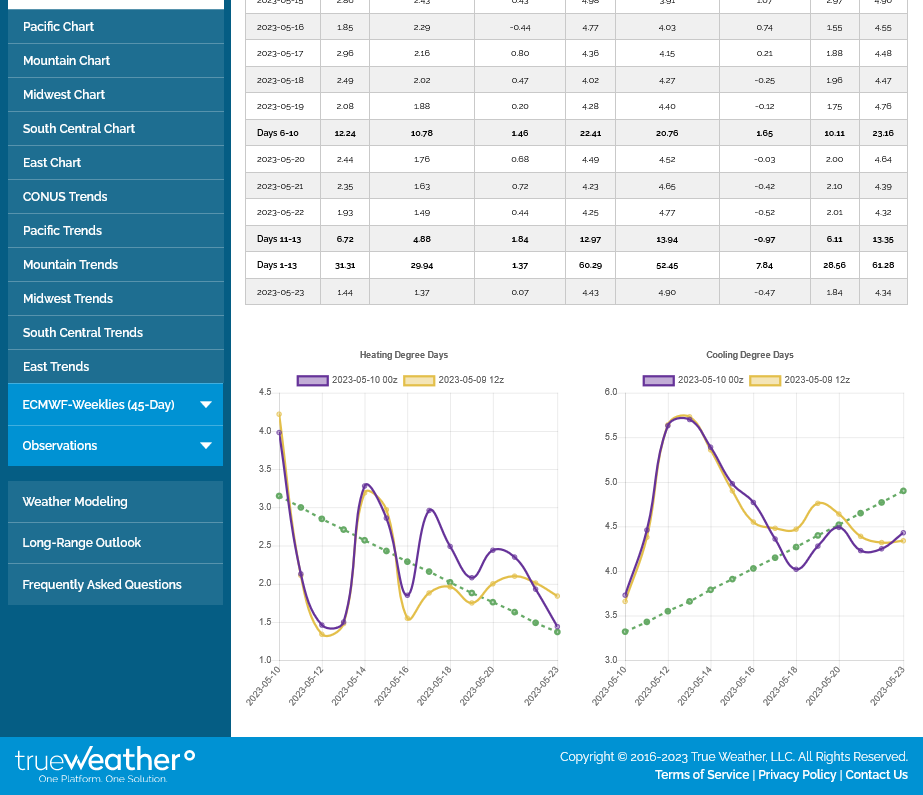
With that in mind, note the areas of above and below temps below in the week 2 forecasts. More blue=bearish. More red/brown=bullish.
The Midwest, South and East count the most because of the higher population density.
These maps will update every day around 2pm CDT.
https://www.cpc.ncep.noaa.gov/products/predictions/610day/


+78 Bcf was expected. Pretty robust considering the very chilly temps but weather is not a factor here.
We spiked up after the release and are back lower by a bit.
weather is not a big factor but the next major, sustained rally will likely come when the market sees the first major, widespread heatwave of 2023 For the high population centers.
this will create a big increase for residential cooling demand, generating electricity for AC use from burning natural gas At power plants.
https://ir.eia.gov/ngs/ngs.html
![]()
for week ending May 5, 2023 | Released: May 11, 2023 at 10:30 a.m. | Next Release: May 18, 2023
| Working gas in underground storage, Lower 48 states Summary text CSV JSN | |||||||||||||||||||||||||
|---|---|---|---|---|---|---|---|---|---|---|---|---|---|---|---|---|---|---|---|---|---|---|---|---|---|
| Historical Comparisons | |||||||||||||||||||||||||
| Stocks billion cubic feet (Bcf) | Year ago (05/05/22) | 5-year average (2018-22) | |||||||||||||||||||||||
| Region | 05/05/23 | 04/28/23 | net change | implied flow | Bcf | % change | Bcf | % change | |||||||||||||||||
| East | 422 | 410 | 12 | 12 | 271 | 55.7 | 322 | 31.1 | |||||||||||||||||
| Midwest | 497 | 481 | 16 | 16 | 339 | 46.6 | 379 | 31.1 | |||||||||||||||||
| Mountain | 104 | 95 | 9 | 9 | 95 | 9.5 | 102 | 2.0 | |||||||||||||||||
| Pacific | 114 | 100 | 14 | 14 | 182 | -37.4 | 202 | -43.6 | |||||||||||||||||
| South Central | 1,002 | 977 | 25 | 25 | 745 | 34.5 | 803 | 24.8 | |||||||||||||||||
| Salt | 287 | 278 | 9 | 9 | 240 | 19.6 | 257 | 11.7 | |||||||||||||||||
| Nonsalt | 715 | 699 | 16 | 16 | 504 | 41.9 | 546 | 31.0 | |||||||||||||||||
| Total | 2,141 | 2,063 | 78 | 78 | 1,632 | 31.2 | 1,809 | 18.4 | |||||||||||||||||
Totals may not equal sum of components because of independent rounding. | |||||||||||||||||||||||||
Working gas in storage was 2,141 Bcf as of Friday, May 5, 2023, according to EIA estimates. This represents a net increase of 78 Bcf from the previous week. Stocks were 509 Bcf higher than last year at this time and 332 Bcf above the five-year average of 1,809 Bcf. At 2,141 Bcf, total working gas is within the five-year historical range.
For information on sampling error in this report, see Estimated Measures of Sampling Variability table below.
+++++++++++++++++++++++
Natural gas futures advanced most of Thursday, bolstered by a modestly bullish storage print and lighter production. But with new demand drivers proving elusive, the June Nymex gas futures contract ultimately petered out and settled at $2.190/MMBtu, down one tenth of a cent day/day. July ticked up nine-tenths of a cent to $2.345. Cash prices…
+++++++++
Weather not a factor!
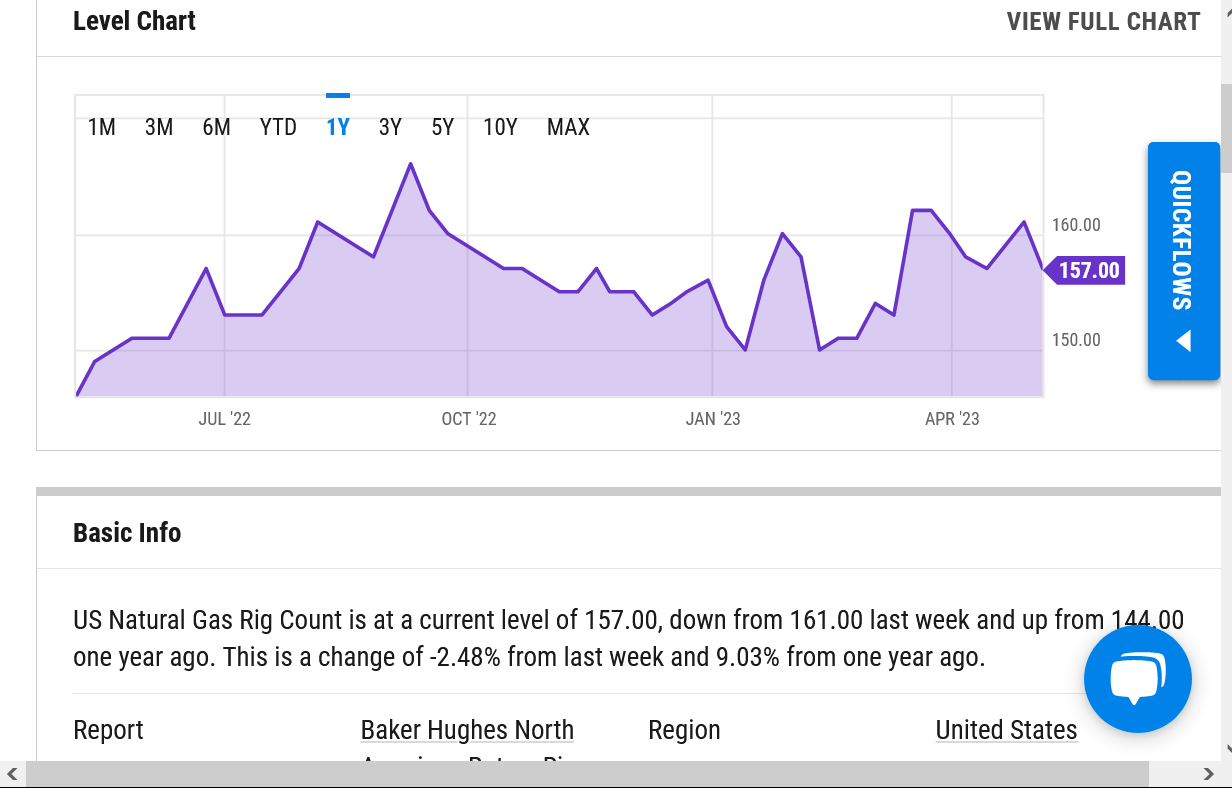
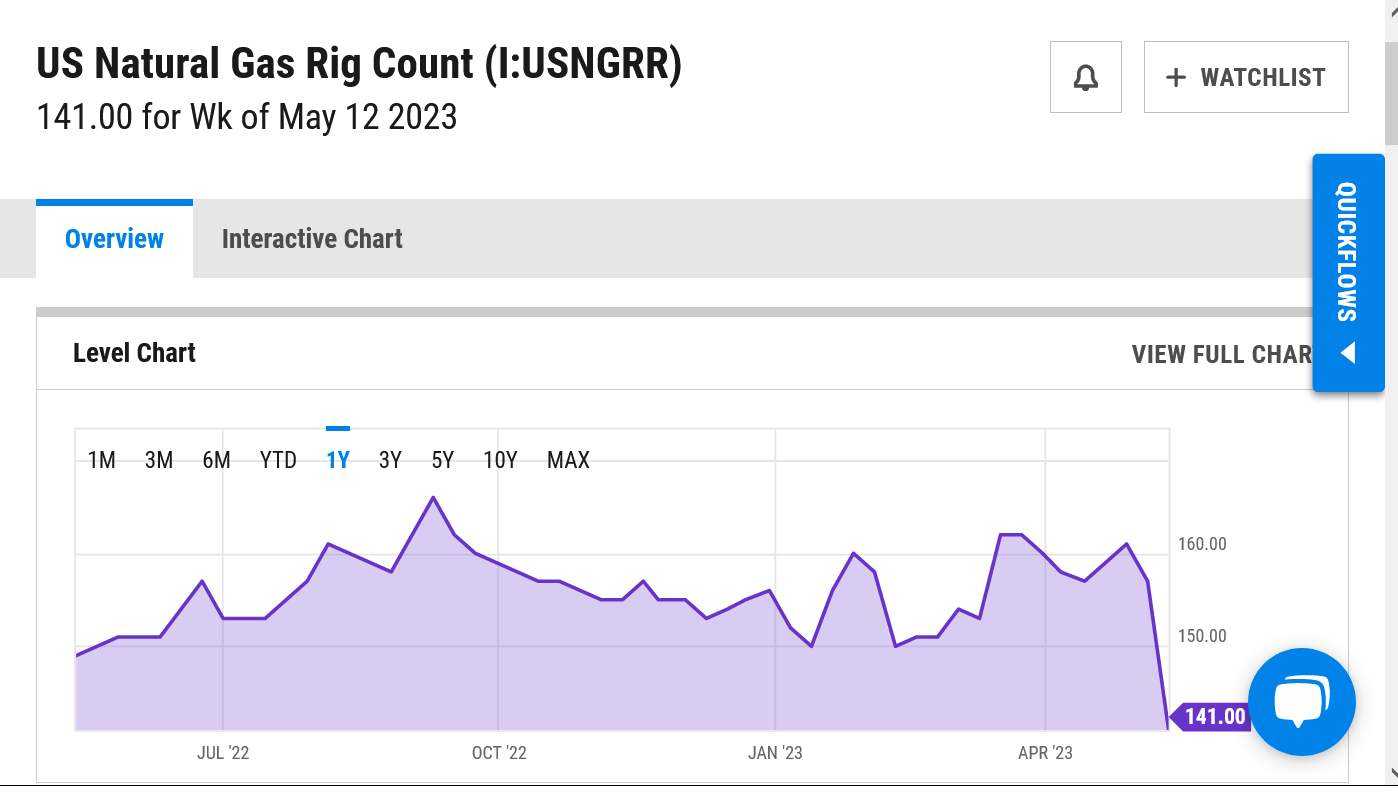
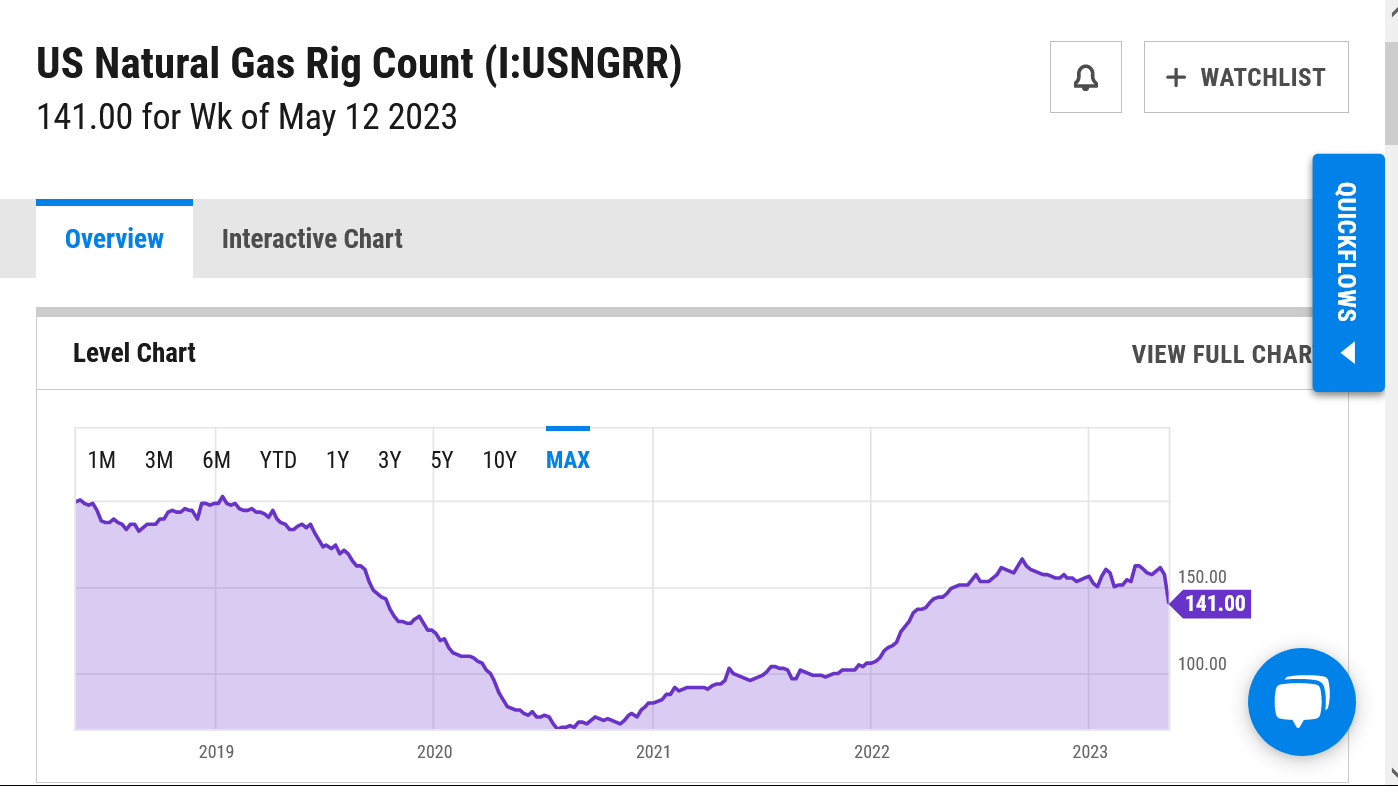
After losses in the two previous sessions, natural gas futures flailed into Friday, losing ground early as forecasts pointed to weak weather-driven demand and supplies remained robust. But the prompt month bounced back in early afternoon trading after the latest Baker Hughes Co. (BKR) data showed natural gas-directed rigs dropped by 16 to 141. The…
++++++++++++++++++
The rig count dropped 10% in 1 week. WOW! I don't have weekly data going back very far to compare to but that has to be one of the biggest drops in 1 week ever. The saying goes: The cure for low prices............IS LOW PRICES! and this is why. My question is........what took so long? There's an underlying reason why ng supplies started massively gushing in around last September and have continued that way to turn a big (more than -300 BCF) deficit compared to the previous year, into a 500 Bcf surplus vs the previous year right now.
The rig count below, dropped to 141 but this is still just over double the COVID lows set in the Summer of 2020. It could just be the first significant sign of the natural gas future fundamentals beginning to tighten up or just a 1 week outlier. If the rig count continues to back down quickly........,the lows are probably in. If we have a hot Summer........the lows are absolutely in.
1. 1 year chart
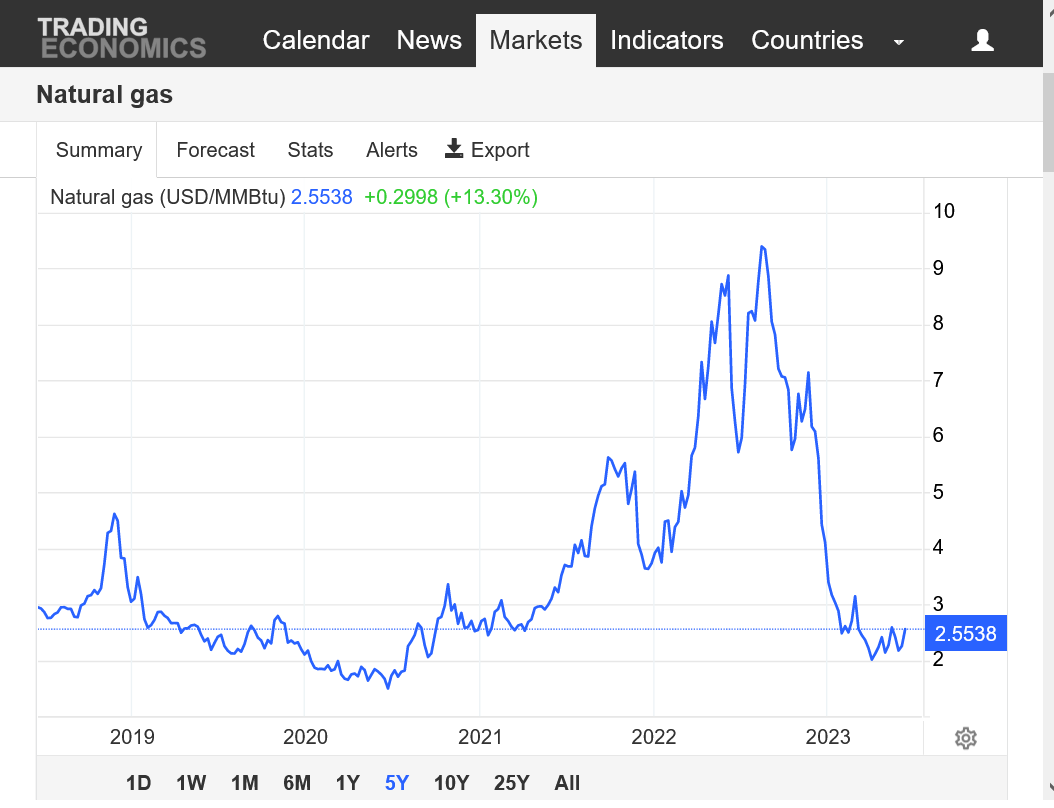
2. 5 year chart
https://ycharts.com/indicators/us_gas_rotary_rigs
The week 2 weather is heating up. Could have our first move higher based on increasing CDDs soon. Those are on the right box below for the GEFS. The last run is purple.
Natural gas futures pushed higher in early trading Monday as the market continued to ponder the balance implications of recent data showing a steep decline in drilling activity. Coming off a 7.6-cent gain to close out last week’s trading, the June Nymex contract was up another 6.0 cents to $2.326/MMBtu at around 8:40 a.m. ET.…
++++++++++++++++++++++
Heat in the week 2 forecast has become bullish for natural gas!
From early Tuesday:
May 16, 2023
+++++++++++++++
Late Tuesday:
Supported by expectations for slowing production, prompt-month natural gas futures gained just enough ground to notch a third consecutive advance on Tuesday. The June Nymex gas futures contract settled at $2.376/MMBtu, up one-tenth of a cent day/day. July ticked down eight-tenths of a cent to $2.534. NGI’s Spot Gas National Avg. advanced 12.0 cents to…
+++++++++++
12z GEFS in purple on the right was -4 CDDs. European model was -2 CDDs.
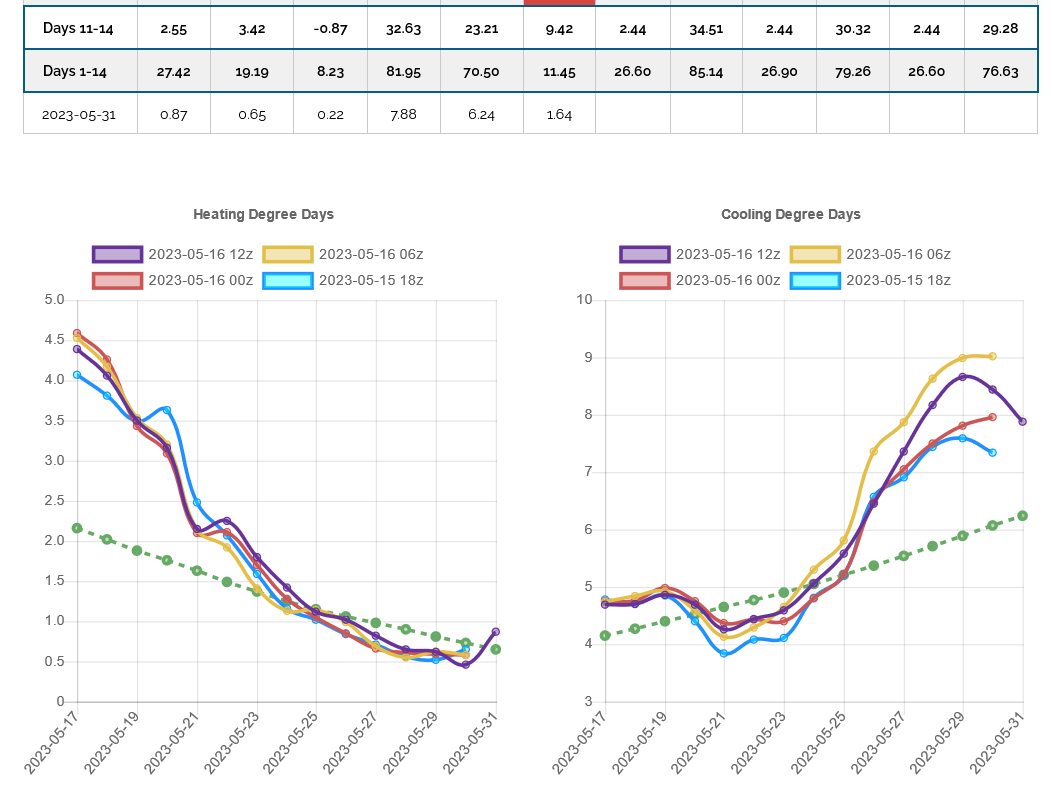
We'll see if the heat in the middle of the country in week 2, which has been bullish can shift farther east.
12z GEFS was -5 CDDs vs the 0Z run. ..bearish.
0z EE was +2 CDDs vs the previous 12z run.
+99 Bcf. The market launched higher after the release........so it must have been expecting 100+.
![]()
for week ending May 12, 2023 | Released: May 18, 2023 at 10:30 a.m. | Next Release: May 25, 2023
| Working gas in underground storage, Lower 48 states Summary text CSV JSN | |||||||||||||||||||||||||
|---|---|---|---|---|---|---|---|---|---|---|---|---|---|---|---|---|---|---|---|---|---|---|---|---|---|
| Historical Comparisons | |||||||||||||||||||||||||
| Stocks billion cubic feet (Bcf) | Year ago (05/12/22) | 5-year average (2018-22) | |||||||||||||||||||||||
| Region | 05/12/23 | 05/05/23 | net change | implied flow | Bcf | % change | Bcf | % change | |||||||||||||||||
| East | 458 | 422 | 36 | 36 | 293 | 56.3 | 345 | 32.8 | |||||||||||||||||
| Midwest | 520 | 497 | 23 | 23 | 361 | 44.0 | 402 | 29.4 | |||||||||||||||||
| Mountain | 112 | 104 | 8 | 8 | 102 | 9.8 | 108 | 3.7 | |||||||||||||||||
| Pacific | 127 | 114 | 13 | 13 | 186 | -31.7 | 212 | -40.1 | |||||||||||||||||
| South Central | 1,023 | 1,002 | 21 | 21 | 776 | 31.8 | 833 | 22.8 | |||||||||||||||||
| Salt | 290 | 287 | 3 | 3 | 250 | 16.0 | 266 | 9.0 | |||||||||||||||||
| Nonsalt | 734 | 715 | 19 | 19 | 528 | 39.0 | 567 | 29.5 | |||||||||||||||||
| Total | 2,240 | 2,141 | 99 | 99 | 1,719 | 30.3 | 1,900 | 17.9 | |||||||||||||||||
Totals may not equal sum of components because of independent rounding. | |||||||||||||||||||||||||
Working gas in storage was 2,240 Bcf as of Friday, May 12, 2023, according to EIA estimates. This represents a net increase of 99 Bcf from the previous week. Stocks were 521 Bcf higher than last year at this time and 340 Bcf above the five-year average of 1,900 Bcf. At 2,240 Bcf, total working gas is within the five-year historical range.
For information on sampling error in this report, see Estimated Measures of Sampling Variability table below.
+++++++
Hot in the center last week!
++++++++++++++++
CDDs overnight were also higher, as noted earlier +2 CDDs on the EE and the last 6z GEFS was +3.5 vs the previous run.
GEFS was -7 CDDs which didn't phase natural gas which doesn't care about just 1 solution of 1 model today. There is still some heat coming.
The last 12z run is in purple:
May 19, 2023
An estimated two-thirds of the people living across wide swaths of the United States and parts of Canada are facing elevated risks from “insufficient operating reserves” for power generation this summer, as extreme heat and maintenance disruptions breach an abundance of natural gas supply, according to the North American Electric Reliability Corp. (NERC). In its…
+++++++++++++++++++
Sort of a confusing signal in the article above and I'll avoid another fake green energy screed (-:
The 0z EE was -4 CDDs vs the prior 12z run which held us in check for awhile overnight. However, the market is trading THE PATTERN and not DDs on individual model runs.
Note the purple, 0z run below on the right was COOLER/LOWER.
But the trajectory is still UP and ABOVE average, which is still BULLISH, despite this last run being LESS bullish.
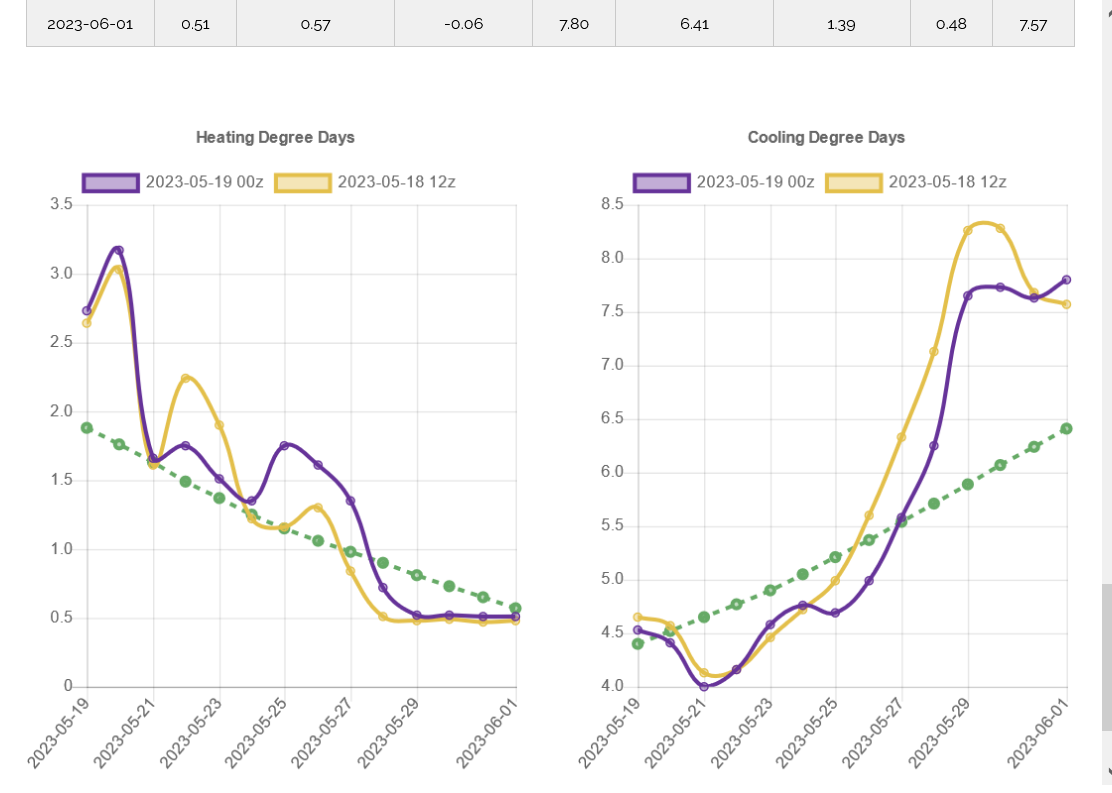
I can't get too bulish ng here with the heat in the NorthCentral US(where not too many people live) and not the South or Southeast.
CDDs are actually less than they were on Friday.
Here's the CDDs from the EE. Last run in purple was +2 CDDs vs the previous run. However, the pattern is cooler than any day last week, including Friday. The total CDDs for the 2 week period are right at average(cool this week, offsetting warm week 2, then near the average at the end). Last week, the week 2 warmth was greater!
With forecasts stubbornly withholding impressive summer heat, natural gas futures failed to build on last week’s momentum in early trading Monday. The June Nymex contract was down 7.9 cents to $2.506/MMBtu at around 8:45 a.m. ET. Futures rallied last week on signs of weakening supply, with bullish sentiment helped along by a tighter-than-expected Energy Information…
+++++++++++++++++++++++++++++++++++++++
YEP!
Last 4 GEFS solutions below. Even less CDDs.
The last 12z EE model forecast(purple on the right) was actually +4 CDDs which gave NG a slight afternoon bounce after it came out.
It's only from 4 hotter days NOT a pattern change to hotter needed to turn NG around!
7 days temps for the EIA report this morning. Hot Northwest, warm Midwest, chilly TX and Northeast. The number should be robust.
+++++++++++++++++++
+96 Bcf.........robust for mid May! Now at +529 Bcf vs last year! Note the blue line on the graph below. +340 vs the 5 year average. That's why prices are extremely low right now!
however, the week 2 forecast is turning Cooler. The EE overnight was a whopping -8 CDDs!
![]()
for week ending May 19, 2023 | Released: May 25, 2023 at 10:30 a.m. | Next Release: June 1, 2023
| Working gas in underground storage, Lower 48 states Summary text CSV JSN | |||||||||||||||||||||||||
|---|---|---|---|---|---|---|---|---|---|---|---|---|---|---|---|---|---|---|---|---|---|---|---|---|---|
| Historical Comparisons | |||||||||||||||||||||||||
| Stocks billion cubic feet (Bcf) | Year ago (05/19/22) | 5-year average (2018-22) | |||||||||||||||||||||||
| Region | 05/19/23 | 05/12/23 | net change | implied flow | Bcf | % change | Bcf | % change | |||||||||||||||||
| East | 489 | 458 | 31 | 31 | 321 | 52.3 | 370 | 32.2 | |||||||||||||||||
| Midwest | 546 | 520 | 26 | 26 | 390 | 40.0 | 428 | 27.6 | |||||||||||||||||
| Mountain | 120 | 112 | 8 | 8 | 108 | 11.1 | 115 | 4.3 | |||||||||||||||||
| Pacific | 139 | 127 | 12 | 12 | 192 | -27.6 | 222 | -37.4 | |||||||||||||||||
| South Central | 1,042 | 1,023 | 19 | 19 | 796 | 30.9 | 861 | 21.0 | |||||||||||||||||
| Salt | 294 | 290 | 4 | 4 | 252 | 16.7 | 273 | 7.7 | |||||||||||||||||
| Nonsalt | 748 | 734 | 14 | 14 | 545 | 37.2 | 588 | 27.2 | |||||||||||||||||
| Total | 2,336 | 2,240 | 96 | 96 | 1,807 | 29.3 | 1,996 | 17.0 | |||||||||||||||||
Totals may not equal sum of components because of independent rounding. | |||||||||||||||||||||||||
Working gas in storage was 2,336 Bcf as of Friday, May 19, 2023, according to EIA estimates. This represents a net increase of 96 Bcf from the previous week. Stocks were 529 Bcf higher than last year at this time and 340 Bcf above the five-year average of 1,996 Bcf. At 2,336 Bcf, total working gas is within the five-year historical range.
For information on sampling error in this report, see Estimated Measures of Sampling Variability table below.
Again, the big drop today is from much cooler week 2 weather maps with the upper ridge retrograding and northwest flow in the east, backing up and including the amidwest too.
Natural gas futures on Friday fell a second consecutive day and for the fourth time in a dismal week for bulls. Elusive demand – both domestic weather-driven consumption and lower calls for LNG – intersected with strong production levels to keep prices in check. At A Glance: Weak consumption prevails Production tops 100 Bcf/d Strong…
+++++++++++++
Listless demand means...........no major, long lasting heat in the high populations centers of the Midwest, East and South.
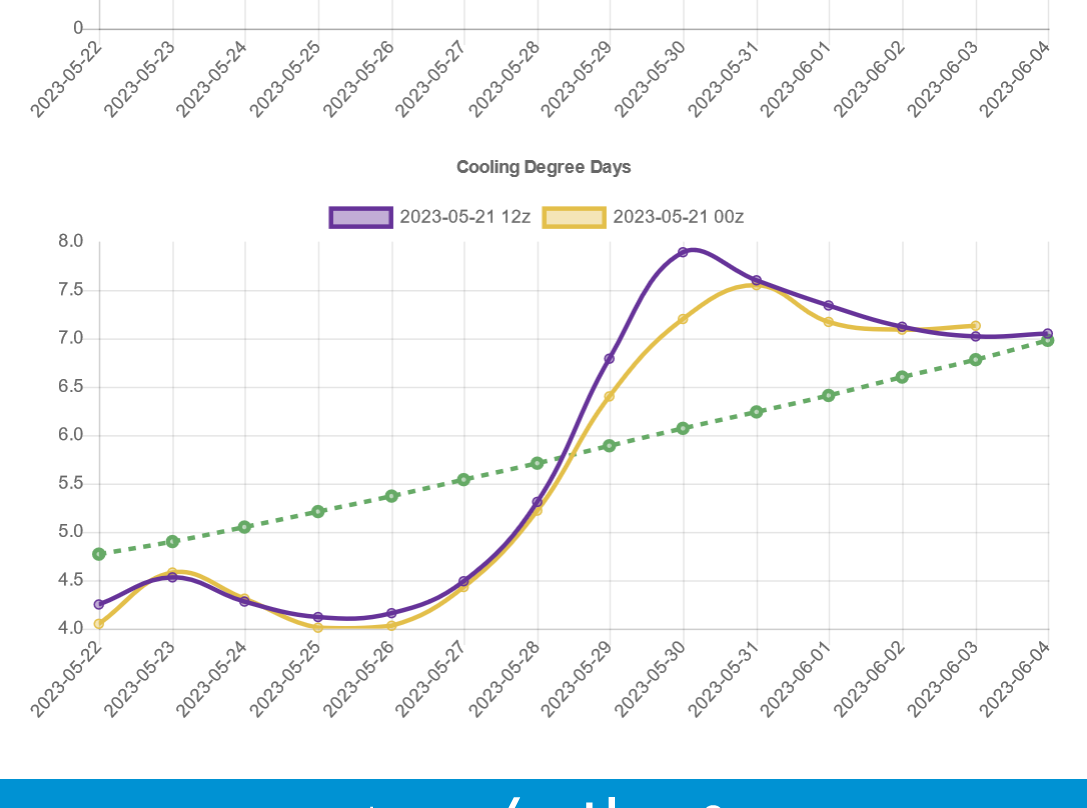
Less CDDs than last week on 2 week forecast. The last 12z GEFS was -9 CDDs vs the previous run(purple color on the graph on the right below) but we were already down -1,000+/contract.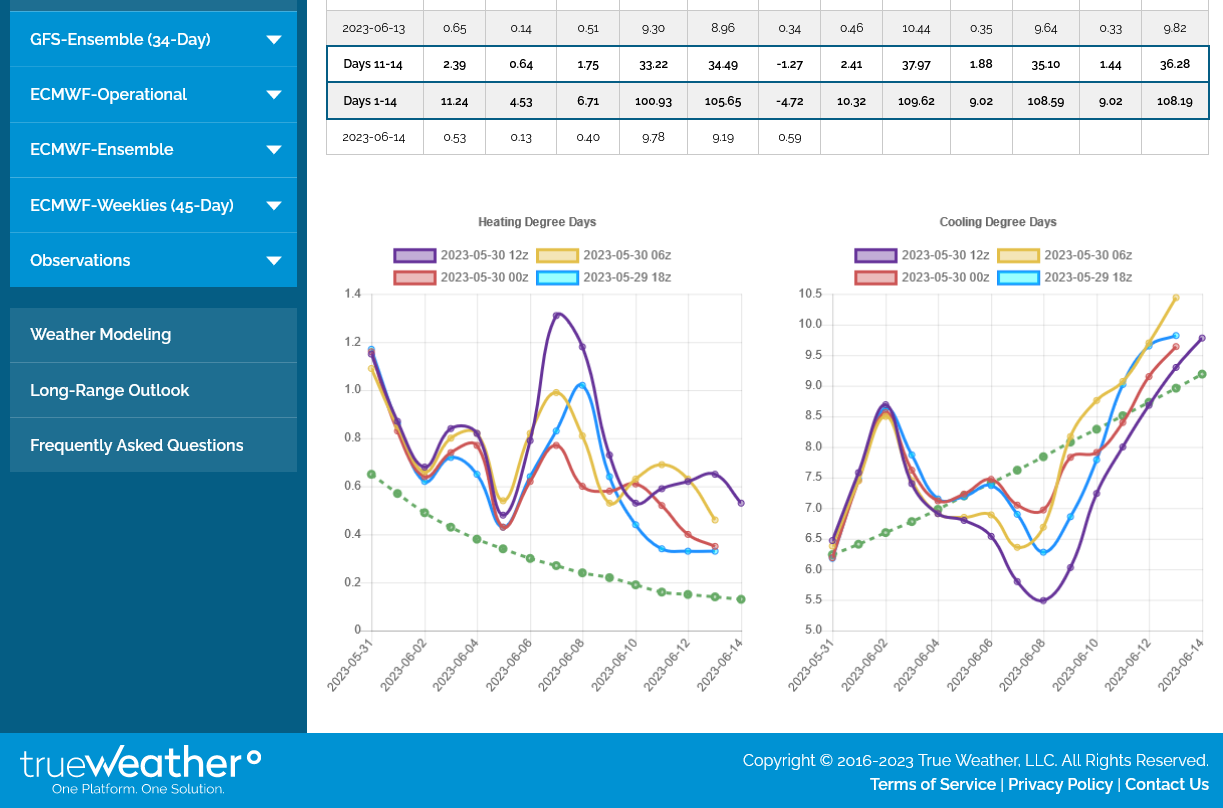 ++++++++++++
Longer range forecasts for later this month on mostly models have some decent heat coming in. Note the lines ALL being above the green dashed line(the average/normal) in the 2nd half of the month.
 The American Storm@BigJoeBastardi
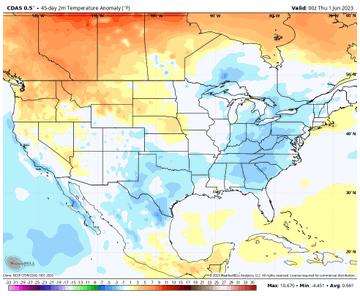
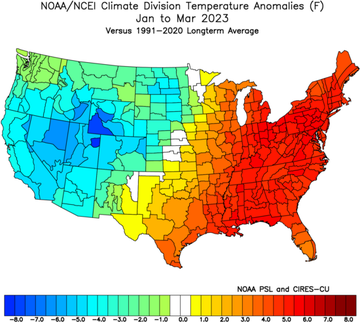
Last 45 days have had a complete reversal of the JFM pattern. The warm that is getting into the northeast now gets crushed next week and the week after as overall pattern look of cool south /east continues
The U.S. Energy Information Administration (EIA) reported an injection of 110 Bcf natural gas into storage for the week ended May 26. The result came in above median estimates and drove Nymex natural gas futures deeper into the red. The inventory increase, driven by steady production volumes above 100 Bcf/d and modest demand on both…
+++++++++++++++
+110 Bcf WOW!!!! Note the blue line on the graph below! NG keeps gushing in!
![]()
for week ending May 26, 2023 | Released: June 1, 2023 at 10:30 a.m. | Next Release: June 8, 2023
| Working gas in underground storage, Lower 48 states Summary text CSV JSN | |||||||||||||||||||||||||
|---|---|---|---|---|---|---|---|---|---|---|---|---|---|---|---|---|---|---|---|---|---|---|---|---|---|
| Historical Comparisons | |||||||||||||||||||||||||
| Stocks billion cubic feet (Bcf) | Year ago (05/26/22) | 5-year average (2018-22) | |||||||||||||||||||||||
| Region | 05/26/23 | 05/19/23 | net change | implied flow | Bcf | % change | Bcf | % change | |||||||||||||||||
| East | 522 | 489 | 33 | 33 | 342 | 52.6 | 399 | 30.8 | |||||||||||||||||
| Midwest | 577 | 546 | 31 | 31 | 421 | 37.1 | 457 | 26.3 | |||||||||||||||||
| Mountain | 127 | 120 | 7 | 7 | 112 | 13.4 | 121 | 5.0 | |||||||||||||||||
| Pacific | 151 | 139 | 12 | 12 | 199 | -24.1 | 231 | -34.6 | |||||||||||||||||
| South Central | 1,070 | 1,042 | 28 | 28 | 814 | 31.4 | 888 | 20.5 | |||||||||||||||||
| Salt | 304 | 294 | 10 | 10 | 249 | 22.1 | 278 | 9.4 | |||||||||||||||||
| Nonsalt | 766 | 748 | 18 | 18 | 566 | 35.3 | 610 | 25.6 | |||||||||||||||||
| Total | 2,446 | 2,336 | 110 | 110 | 1,889 | 29.5 | 2,097 | 16.6 | |||||||||||||||||
Totals may not equal sum of components because of independent rounding. | |||||||||||||||||||||||||
Working gas in storage was 2,446 Bcf as of Friday, May 26, 2023, according to EIA estimates. This represents a net increase of 110 Bcf from the previous week. Stocks were 557 Bcf higher than last year at this time and 349 Bcf above the five-year average of 2,097 Bcf. At 2,446 Bcf, total working gas is within the five-year historical range.
For information on sampling error in this report, see Estimated Measures of Sampling Variability table below.
+++++++++++++
Extremely bearish temps for the reporting period below:
https://www.cpc.ncep.noaa.gov/products/tanal/temp_analyses.php
Natural gas futures faltered on Thursday, driven lower by a robust inventory injection that reflected strong production and anemic demand. The July Nymex gas futures contract, which has lost ground each day this week, dropped 10.8 cents day/day and settled at $2.158/MMBtu.. August lost 8.5 cents to $2.273. At A Glance: EIA posts 110 Bcf…
+++++++++++
Note the purple line on the graph to the right/below, the last 45 day outlook from the EE model. Even though things heat up late this month and especially in early July, the forecast LOST around 16 CDDs vs the previous outlook in brown!
Mike,
And this +110 was for the week before Memorial Day Week. Memorial Day week when averaged out has had the largest injections of any week due to a combination of the holiday related reduction in demand combined with it being near the low point of the year DDwise. So, next week's EIA release may have another very large, if not larger, injection.
Thanks, Larry!
Next weeks numbers will be based on these 7 day temps thru yesterday. Pretty bearish(very warm/north cool South). However, I think hot days in places in the Upper Midwest may have generated significant CDDs.
Hey Mike,
You're welcome. I agree with you that US averaged DDs likely will be somewhat higher with the warmer Midwest and TX, too, even with the area in/near S SC/S GA/FL being slightly cooler. However, with the next EIA being Memorial Day week and with it on average having the largest injection, it wouldn't surprise me if that's enough to overcome the somewhat higher DDs and result in as large or larger than the +110 of the prior week.
Great point as usual, Larry!
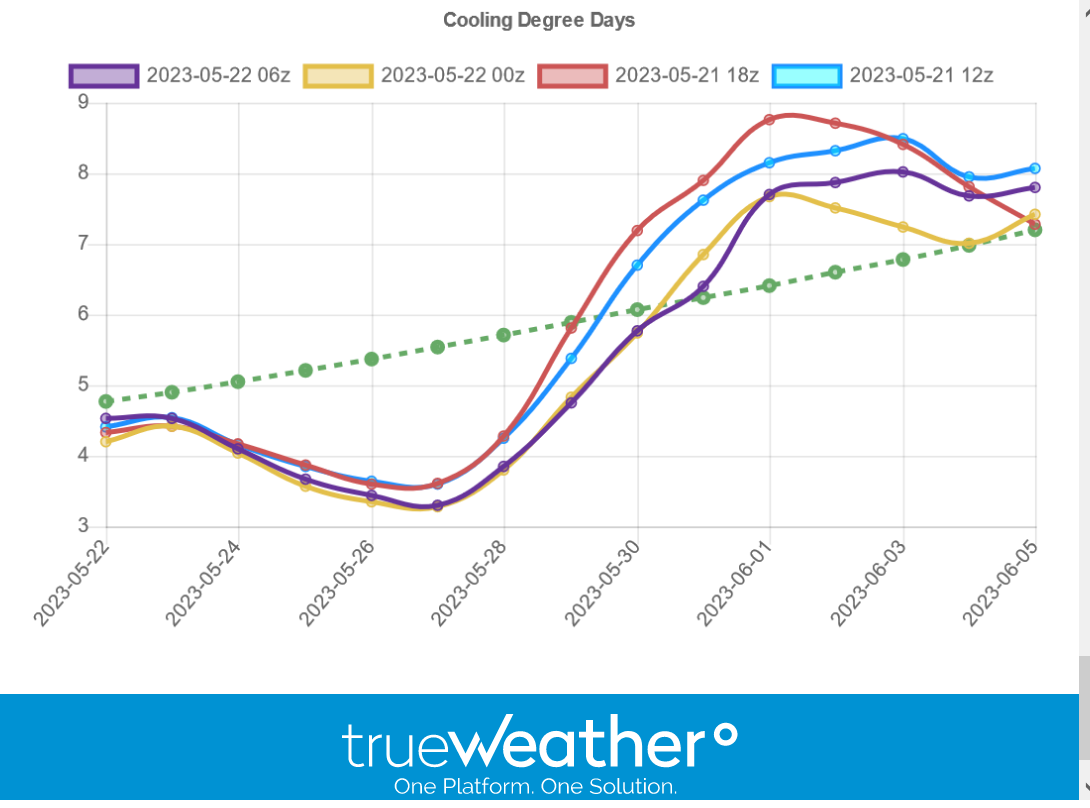
EE had much less CDDs in the last 0z run and it’s causing selling pressure.
the warming trend in week 2 is still intact…….just not AS warm/hot.
The last 12z EE in purple, below added back 5 CDDs that it took out the last run. Now we're up for the day after being modestly/sharply lower much earlier.
You can see the crystal clear warming trend in week 2.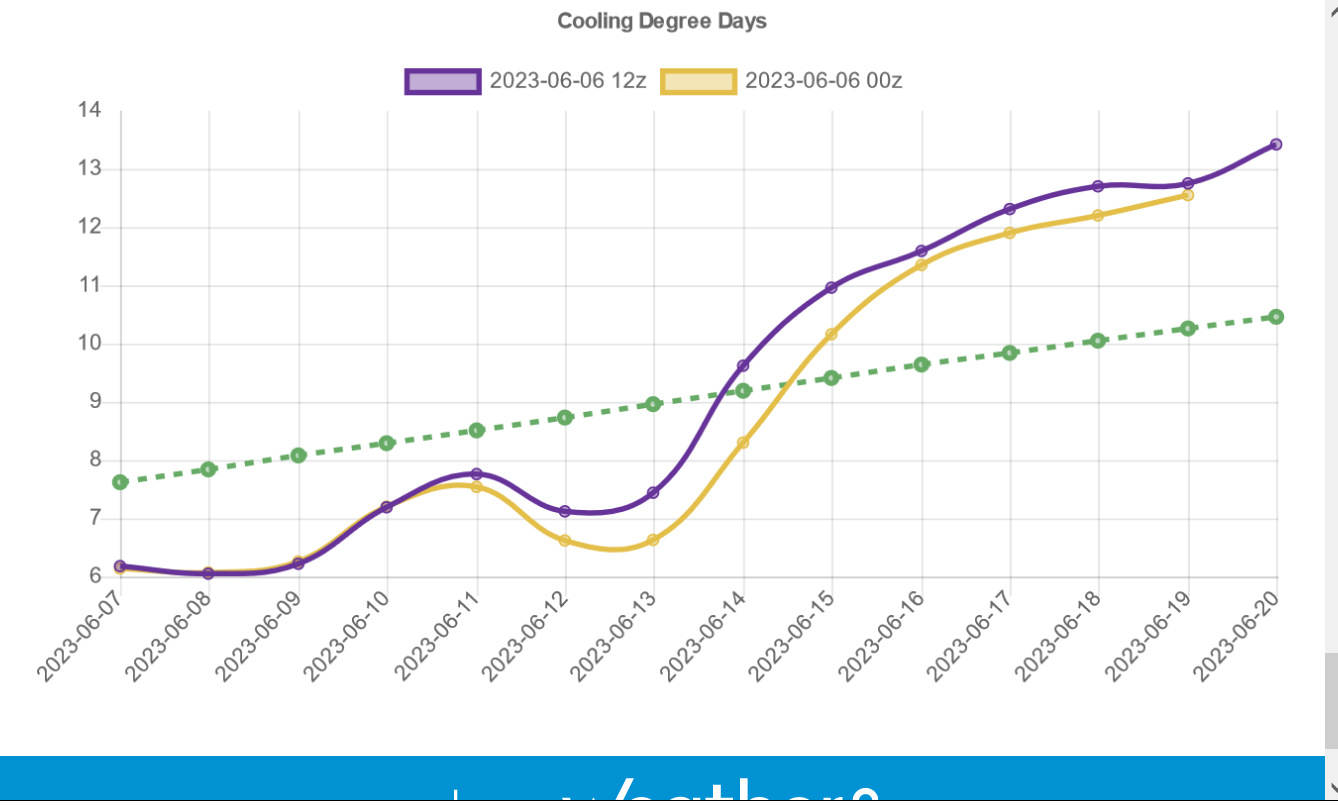
Jun 7, 2023
++++++++++++++++++++
Same story. Increasing heat coming week 2 is bullish for natural gas, despite bearish fundamentals. 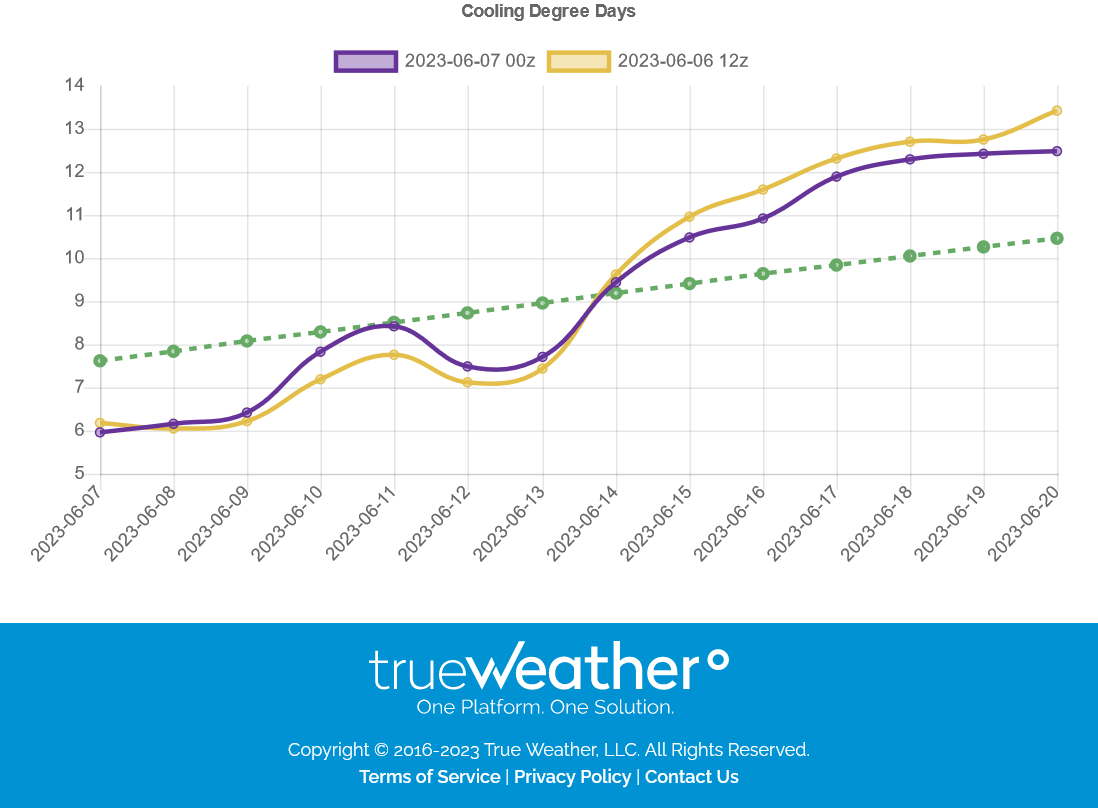
Bearish.
+118 Bcf IMPLIED FLOW. 14 of which was reclassified as base gas.
Note the surplus vs last year got bigger again. +562 Bcf! See the bearish blue line below, near the top of the 5 year range.
It was a holiday weekend, so demand was less as a result and a high number was expected, as predicted by WxFollower but this must be a near record injection! NG continues to gush in at a record rate!
https://ir.eia.gov/ngs/ngs.html
for week ending June 2, 2023 | Released: June 8, 2023 at 10:30 a.m. | Next Release: June 15, 2023
| Working gas in underground storage, Lower 48 states Summary text CSV JSN | |||||||||||||||||||||||||
|---|---|---|---|---|---|---|---|---|---|---|---|---|---|---|---|---|---|---|---|---|---|---|---|---|---|
| Historical Comparisons | |||||||||||||||||||||||||
| Stocks billion cubic feet (Bcf) | Year ago (06/02/22) | 5-year average (2018-22) | |||||||||||||||||||||||
| Region | 06/02/23 | 05/26/23 | net change | implied flow | Bcf | % change | Bcf | % change | |||||||||||||||||
| East | 552 | 522 | 30 | 30 | 372 | 48.4 | 427 | 29.3 | |||||||||||||||||
| Midwest | 604 | 577 | 27 | 27 | 450 | 34.2 | 486 | 24.3 | |||||||||||||||||
| Mountain | 137 | 127 | 10 | 10 | 117 | 17.1 | 129 | 6.2 | |||||||||||||||||
| Pacific | 164 | 151 | 13 | 13 | 209 | -21.5 | 242 | -32.2 | |||||||||||||||||
| South Central | 1,093 | C | 1,070 | 23 | 37 | C | 839 | 30.3 | 913 | 19.7 | |||||||||||||||
| Salt | 319 | 304 | 15 | 15 | 251 | 27.1 | 282 | 13.1 | |||||||||||||||||
| Nonsalt | 774 | C | 766 | 8 | 22 | C | 590 | 31.2 | 631 | 22.7 | |||||||||||||||
| Total | 2,550 | C | 2,446 | 104 | 118 | C | 1,988 | 28.3 | 2,197 | 16.1 | |||||||||||||||
Note: Reclassifications from working gas to base gas resulted in decreased working gas stocks of 14 Bcf in the Nonsalt South Central region for the week ending June 2, 2023. The implied flow for the week is an increase of 118 Bcf to working gas stocks. (See Notes and Definitions for more information on "implied flow.") Totals may not equal sum of components because of independent rounding. C=Reclassification. | |||||||||||||||||||||||||
Working gas in storage was 2,550 Bcf as of Friday, June 2, 2023, according to EIA estimates. This represents a net increase of 104 Bcf from the previous week. Stocks were 562 Bcf higher than last year at this time and 353 Bcf above the five-year average of 2,197 Bcf. At 2,550 Bcf, total working gas is within the five-year historical range.
For information on sampling error in this report, see Estimated Measures of Sampling Variability table below.
Hey Mike,
So, with this EIA being +118, it is still another of many huge Memorial Day week injections. This obviously may very well end up as the largest of the year.
Thanks, Larry!
I added this to the first post when you were typing:
It was a holiday weekend, so demand was less as a result and a high number was expected, as predicted by WxFollower but this must be a near record injection! NG continues to gush in at a record rate!
+++++++++++
Agree with your statement. I would have to think its going to be near impossible to have injections this high in the Fall, unless the Summer is extremely hot. There won't be room in storage for injections at this rate.
The last runs of the models(colors on the left-brown/purple for the GEFS) were not AS warm/took out alot of week 2 heat.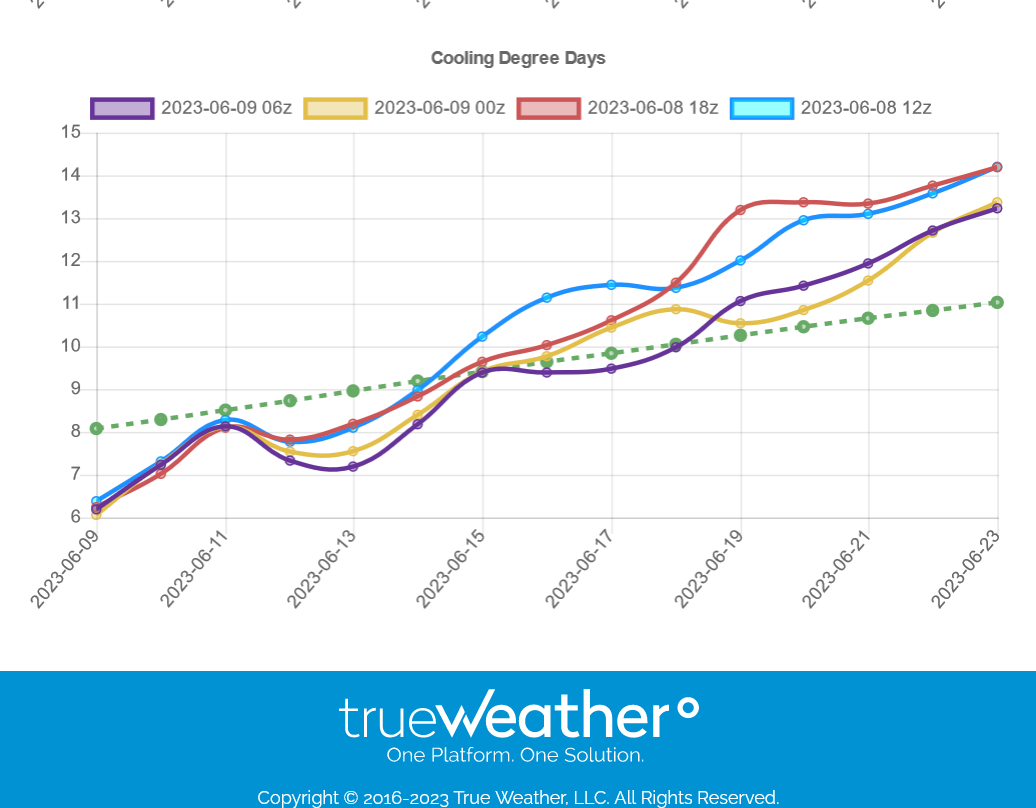
Fridays close:
More heat in the forecast over the weekend compared to Friday(although the last, 12z runs were not as hot -3 CDDs on the EE), so NG will likely open higher!
7 day temps for the next EIA report:
Hot North/Central down the Miss River Valley.
Mild TX to Southwest, cool East Coast where more people live!
https://www.cpc.ncep.noaa.gov/products/tanal/temp_analyses.php
Hey Mike,
Comparing to last week I see warmer SE, cooler NE, and warmer central US. I'm thinking somewhat higher CDDs for the US overall. That plus no holiday this week tells me to expect a significantly smaller injection on this week's report.
That makes great sense, Larry!
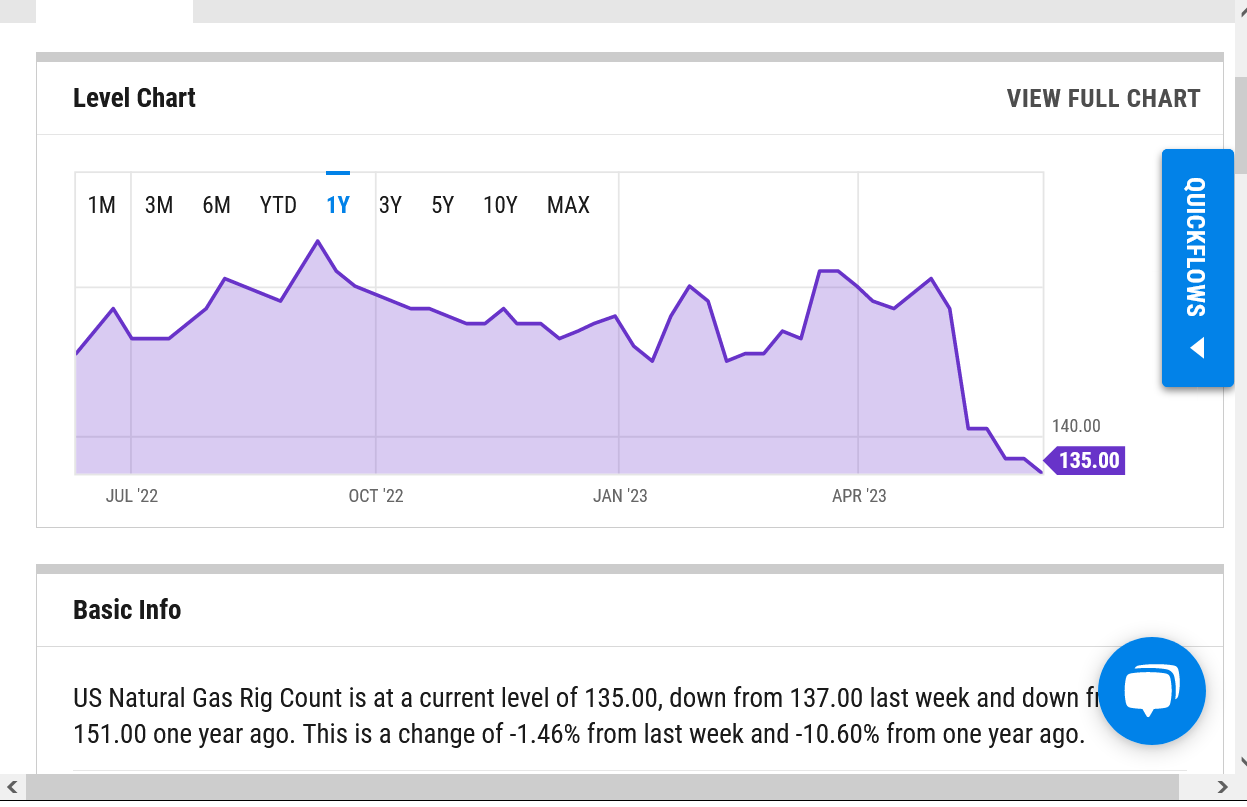
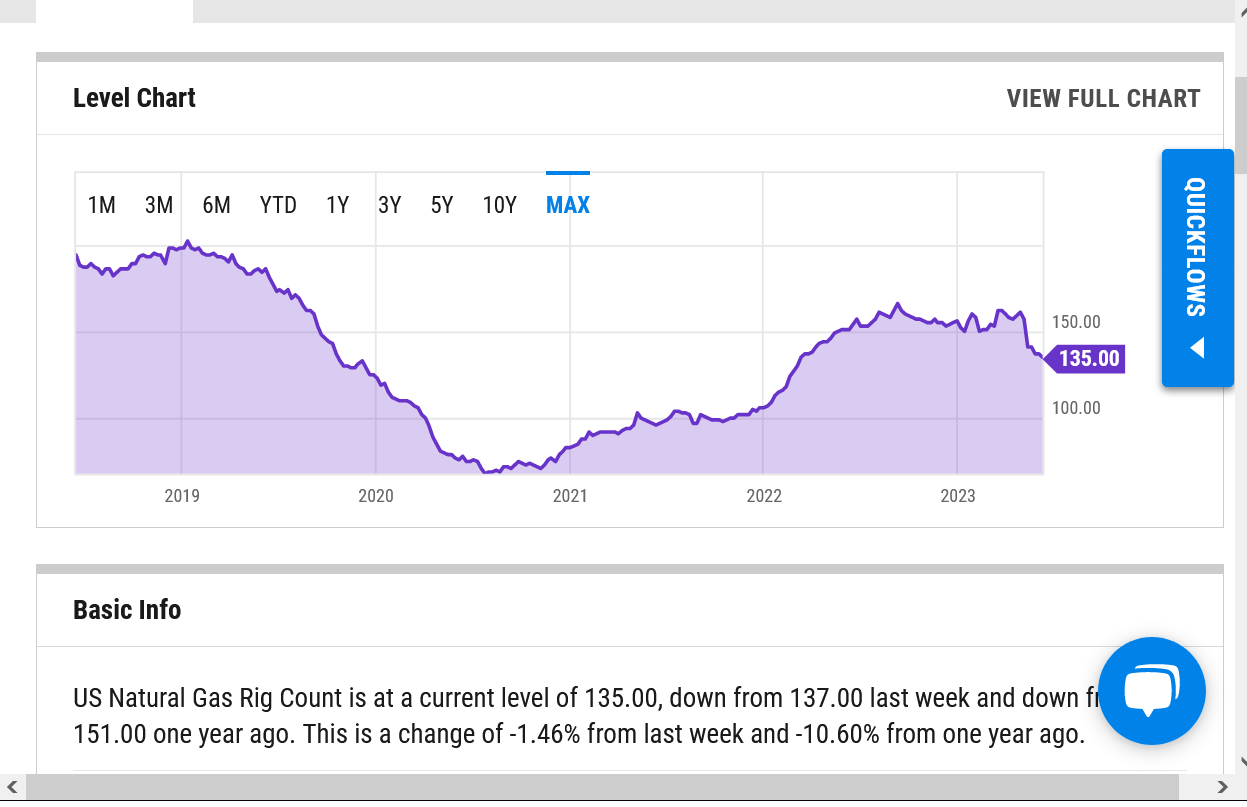
Rig count starting to plunge. Less supply down the road!
https://ycharts.com/indicators/us_gas_rotary_rigs
US Natural Gas Rig Count is at a current level of 135.00, down from 137.00 last week and down from 151.00 one year ago. This is a change of -1.46% from last week and -10.60% from one year ago.
1 year below
5 years below
EE was +3 CDDs overnight. Gave us a big pop higher early am that has managed to hold with the usual gyrations since then.
metmike: 12z models were -1.5 to -3 CDDS and ng came off the early morning highs.
EE was -5 CDDs overnight but NG WENT UP as the pattern is for warmer temps and this is just 1 run. Also, production will be slowing down as shown by the plunging rig count.
I doubt we get close to $2 again this year!
Bullish +84 Bcf. Big spike higher on the release. Again, note the blue line on the graph below to see how robust the current storage level is. +552 Bcf compared to last year!!
However, the rig count is plunging(with low prices taking away financial incentive by producers) and supplies may start to dry up later this year.
![]()
for week ending June 9, 2023 | Released: June 15, 2023 at 10:30 a.m. | Next Release: June 22, 2023
| Working gas in underground storage, Lower 48 states Summary text CSV JSN | |||||||||||||||||||||||||
|---|---|---|---|---|---|---|---|---|---|---|---|---|---|---|---|---|---|---|---|---|---|---|---|---|---|
| Historical Comparisons | |||||||||||||||||||||||||
| Stocks billion cubic feet (Bcf) | Year ago (06/09/22) | 5-year average (2018-22) | |||||||||||||||||||||||
| Region | 06/09/23 | 06/02/23 | net change | implied flow | Bcf | % change | Bcf | % change | |||||||||||||||||
| East | 574 | 552 | 22 | 22 | 403 | 42.4 | 453 | 26.7 | |||||||||||||||||
| Midwest | 632 | 604 | 28 | 28 | 478 | 32.2 | 515 | 22.7 | |||||||||||||||||
| Mountain | 148 | 137 | 11 | 11 | 121 | 22.3 | 135 | 9.6 | |||||||||||||||||
| Pacific | 176 | 164 | 12 | 12 | 220 | -20.0 | 244 | -27.9 | |||||||||||||||||
| South Central | 1,105 | 1,093 | 12 | 12 | 860 | 28.5 | 934 | 18.3 | |||||||||||||||||
| Salt | 324 | 319 | 5 | 5 | 251 | 29.1 | 284 | 14.1 | |||||||||||||||||
| Nonsalt | 781 | 774 | 7 | 7 | 609 | 28.2 | 650 | 20.2 | |||||||||||||||||
| Total | 2,634 | 2,550 | 84 | 84 | 2,082 | 26.5 | 2,281 | 15.5 | |||||||||||||||||
Totals may not equal sum of components because of independent rounding. | |||||||||||||||||||||||||
Working gas in storage was 2,634 Bcf as of Friday, June 9, 2023, according to EIA estimates. This represents a net increase of 84 Bcf from the previous week. Stocks were 552 Bcf higher than last year at this time and 353 Bcf above the five-year average of 2,281 Bcf. At 2,634 Bcf, total working gas is within the five-year historical range.
For information on sampling error in this report, see Estimated Measures of Sampling Variability table below.
Natural gas futures on Thursday rallied for a fourth consecutive session, bolstered by a bullish storage print that came on the heels of hotter weather and lower production. The July Nymex gas futures contract settled at $2.533/MMBtu, up 19.1 cents day/day. August jumped 19.6 cents to $2.609. At A Glance: EIA prints 84 Bcf injection…
++++++++++++++
We even more strongly confirmed the lows being in as mentioned earlier this week.
Weather had nothing to do with today's move. The market is looking ahead at production dropping. https://www.marketforum.com/forum/topic/94944/#96213
Interestingly, the market has been trading almost the opposite as seasonals this year! Going down in the Spring when it almost always goes up.
Right now, early Summer is the typical seasonal top for NG!
The first chart, 30 year, long range does not properly show recent prices. Please use it for prices BEFORE this year only.
1. 30 year
2. 5 year
3. 1 year
4. 1 month
The EE was slightly warmer, +1 CDD overnight. The NG market is trading a technical bottom and curtailment of record supplies that have been gushing in since the end of last Summer.
The NG is also trading THE PATTERN of more heat, as seen by the lines below, on the right staying well ABOVE the green dashed line. These additional CDDs vs average will create additional cooling demand that will eat into the massive storage surplus IN COMBINATION with the supplies drying up.
Congrats to tjc on his long profits right now.
Weather models have a bit less heat in the 2 week forecast compared to last Friday, so NG has pulled back a bit, after a slightly lower open.