KEY EVENTS TO WATCH FOR:
Monday, May 15, 2023
8:30 AM ET. May Empire State Manufacturing Survey
Mfg Idx (previous 10.8)
Employment Idx (previous -8.0)
New Orders Idx (previous 25.1)
Prices Received (previous 23.7)
Tuesday, May 16, 2023
8:30 AM ET. April Advance Monthly Sales for Retail & Food Services
Overall Sales-SA, M/M% (previous -1%)
Sales, Ex-Auto, M/M% (previous -0.8%)
Sales, Ex-Auto & Gas, M/M% (previous -0.3%)
8:55 AM ET. Johnson Redbook Retail Sales Index
Ret Sales Mo-to-Date, Y/Y% (previous +1.3%)
Latest Wk, Y/Y% (previous +1.3%)
9:15 AM ET. April Industrial Production & Capacity Utilization
Industrial Production, M/M% (previous +0.4%)
Capacity Utilization % (previous 79.8%)
Capacity Utilization, Net Chg (Pts) (previous +0.2)
10:00 AM ET. May NAHB Housing Market Index
Housing Mkt Idx (previous 45)
10:00 AM ET. March Manufacturing & Trade: Inventories & Sales
Total Inventories (previous +0.2%)
4:30 PM ET. API Weekly Statistical Bulletin
Crude Stocks, Net Chg (Bbls) (previous +3.6M)
Gasoline Stocks, Net Chg (Bbls) (previous +0.4M)
Distillate Stocks, Net Chg (Bbls) (previous -3.9M)
Wednesday, May 17, 2023
7:00 AM ET. MBA Weekly Mortgage Applications Survey
Composite Idx (previous 227.8)
Composite Idx, W/W% (previous +6.3%)
Purchase Idx-SA (previous 173.7)
Purchase Idx-SA, W/W% (previous +4.8%)
Refinance Idx (previous 507.1)
Refinance Idx, W/W% (previous +10.0%)
8:30 AM ET. April New Residential Construction - Housing Starts and Building Permits
Total Starts (previous 1.420M)
Housing Starts, M/M% (previous -0.8%)
Building Permits (previous 1.413M)
Building Permits, M/M% (previous -8.8%)
10:30 AM ET. EIA Weekly Petroleum Status Report
Crude Oil Stocks (Bbl) (previous 462.584M)
Crude Oil Stocks, Net Chg (Bbl) (previous +2.951M)
Gasoline Stocks (Bbl) (previous 219.711M)
Gasoline Stocks, Net Chg (Bbl) (previous -3.167M)
Distillate Stocks (Bbl) (previous 106.153M)
Distillate Stocks, Net Chg (Bbl) (previous -4.17M)
Refinery Usage (previous 91.0%)
Total Prod Supplied (Bbl/day) (previous 20.164M)
Total Prod Supplied, Net Chg (Bbl/day) (previous +0.359M)
Thursday, May 18, 2023
8:30 AM ET. May Philadelphia Fed Business Outlook Survey
Business Activity (previous -31.3)
Prices Paid (previous 8.2)
Employment (previous -0.2)
New Orders (previous -22.7)
Prices Received (previous -3.3)
Delivery Times (previous -25.0)
Inventories (previous -17.9)
Shipments (previous -7.3)
8:30 AM ET. Unemployment Insurance Weekly Claims Report - Initial Claims
Jobless Claims (previous 264K)
Jobless Claims, Net Chg (previous +22K)
Continuing Claims (previous 1813000)
Continuing Claims, Net Chg (previous +12K)
8:30 AM ET. U.S. Weekly Export Sales
10:00 AM ET. April Existing Home Sales
Existing Sales (previous 4.44M)
Existing Sales, M/M% (previous -2.4%)
Unsold Homes Month's Supply (previous 2.6)
Median Price (USD) (previous 375700)
Median Home Price, Y/Y% (previous -0.9%)
10:00 AM ET. April Leading Indicators
Leading Index, M/M% (previous -1.2%)
Leading Index
Coincident Index, M/M% (previous +0.2%)
Lagging Index, M/M% (previous -0.2%)
10:00 AM ET. 1st Quarter Quarterly Retail E-Commerce Sales
10:30 AM ET. EIA Weekly Natural Gas Storage Report
Working Gas In Storage (Cbf) (previous 2141B)
Working Gas In Storage, Net Chg (Cbf) (previous +78B)
4:30 PM ET. Federal Discount Window Borrowings
4:30 PM ET. Foreign Central Bank Holdings
Friday, May 19, 2023
10:00 AM ET. 1st Quarter Advance Quarterly Services
10:00 AM ET. April State Employment and Unemployment
The STOCK INDEXES? http://quotes.ino.com/ex?changes/?c=indexes
The STOCK INDEXES: The June NASDAQ 100 was higher overnight as it extends this year's rally. Overnight trading set the stage for a higher opening when the day session begins trading. Stochastics and the RSI are overbought but remain neutral to bullish signaling that sideways to higher prices are possible near-term. If June extends this year's rally, the 62% retracement level of 2022's decline crossing at 13,634.26 is the next upside target. Closes below the 20-day moving average crossing at 13,205.23 would signal that a short-term top has been posted. First resistance is last-Friday's high crossing at 13,494.25. Second resistance is the 62% retracement level of 2022's decline crossing at 13,634.26. First support is the 20-day moving average crossing at 13,205.23. Second support is the 50-day moving average crossing at 12,957.31.
The June S&P 500 was higher overnight as it extends the April-May trading range. Overnight strength sets the stage for a higher opening when the day session begins trading. Stochastics and the RSI are neutral to bullish signaling that sideways to higher prices are possible near-term. Closes above the May 1st high crossing at 4206.25 or below the May 4th low crossing at 4062.25 are needed to mark a breakout of the aforementioned trading range. First resistance is the May 1st high crossing at 4206.25. Second resistance February's high crossing at 4244.00. First support is the May 4th low crossing at 4062.25. Second support is the 38% retracement level of the 2022-2023 rally crossing at 3984.29.
INTEREST RATES http://quotes.ino.com/ex changes/?c=interest"
INTEREST RATES: June T-bonds were lower overnight as it extends the March-May trading range. Overnight weakness sets the stage for a lower opening when the day session begins trading. Stochastics and the RSI are turning neutral to bearish signaling that sideways to lower prices are possible near-term. Closes below the May 1st low crossing at 129-02 would mark a downside breakout of the March-May trading range thereby opening the door for additional weakness near-term. Closes above the May 4th high crossing at 133-00 would open the door for a possible test of April's high crossing at 134-14. First resistance is the May 4th high crossing at 133-00. Second resistance is April's high crossing at 134-14. First support is the May 1st low crossing at 129-02. Second support is the 38% retracement level of the October-January rally crossing at 128-08.
June T-notes were steady to slightly lower overnight. Overnight trading sets the stage for a slightly lower opening when the day session begins trading. Stochastics and the RSI are turning neutral to bearish signaling that sideways to lower prices are possible near-term. Closes below the 20-day moving average crossing at 115.084 would signal that a short-term top has been posted. If June resumes the rally off April's low, March's high crossing at 117.015 is the next upside target. First resistance is the May 4th high crossing at 117.000. Second resistance is March's high crossing at 117.015. First support is the 20-day moving average crossing at 115.084. Second support is the 50-day moving average crossing at 114.303.
ENERGY MARKETS? http://quotes.ino.com/ex?changes/?c=energy ""
ENERGIES:Junecrude oil was slightly higher overnight. Overnight trading sets the stage for a slightly higher opening when the day session begins trading. Stochastics and the RSI are neutral to bearish signaling that sideways to lower prices are possible near-term. If June extends last-week's decline, the March 24th low crossing at $67.02 is the next downside target. Closes above the 50-day moving average crossing at $75.03 would signal that a short-term low has been posted. First resistance is the 50-day moving average crossing at $75.03. Second resistance is the April 24th high crossing at $79.18. First support is the March 24th low crossing at $67.02. Second support is the May 4th low crossing at $63.64.
June heating oil was slightly higher overnight and sets the stage for a slightly higher opening when the day session begins trading. Stochastics and the RSI are neutral to bearish signaling that sideways to lower prices are possible near-term. If June extends the decline off January's high, the 62% retracement level of the 2020-2022 rally crossing at 2.1217 is the next downside target. Closes above the 20-day moving average crossing at 2.3869 would signal that a short-term low has been posted. First resistance is the 20-day moving average crossing at 2.3869. Second resistance is the 50-day moving average crossing at $2.5067. First support is the 62% retracement level of the 2020-2022 rally crossing at 2.1217. Second support is the the November-29, 2021 low crossing at 1.9476.
June unleaded gas was slightly higher in late-overnight trading as it consolidates some of the decline off last-Thursday's high. Overnight trading sets the stage for a steady to slightly higher opening when the day session begins trading. Stochastics and the RSI are neutral signaling that sideways trading is possible near-term. Closes above last-Thursday's high crossing at $2.5155 would renew the rally off May's low. Closes below the 10-day moving average crossing at $2.4218 would signal that a short-term top has been posted. First resistance is last-Thursday's high crossing at $2.5155. Second resistance is the 50-day moving average crossing at $2.5678. First support is the 10-day moving average crossing at $2.4218. Second support is May's low crossing at $2.2500.
June natural gas was slightly higher overnight and sets the stage for a slightly higher opening when the day session begins trading. Stochastics and the RSI are neutral to bullish signaling that sideways to higher prices are possible near-term. Closes above the 20-day moving average crossing at 2.307 would signal that a short-term low has been posted while opening the door for additional short-covering gains. If June renews the decline off March's high, the September-2020 low on the monthly continuation chart crossing at 1.795 is the next downside target. First resistance is the 20-day moving average crossing at 3.307. Second resistance is the 50-day moving average crossing at 2.464. First support is the May 5th low crossing at 2.031. Second support is the September-2020 low on the monthly continuation chart crossing at 1.795.
CURRENCIEShttp://quotes.ino.com/ex changes/?c=currencies"
CURRENCIES:The June Dollar was steady to slightly lower overnight as it extends the April-May trading range. Overnight trading and sets the stage for a slightly lower opening when the day session begins trading later this morning. Stochastics and the RSI are overbought but remain neutral to bullish signaling that sideways to higher prices are possible near-term. Closes above the April 3rd high crossing at $102.745 would mark a potential upside target of the aforementioned trading range. Closes below the 20-day moving average crossing at $101.511 temper the near-term friendly outlook. First resistance is the April 3rd high crossing at $102.745. Second resistance is the 25% retracement level of the 2022-2023 decline crossing at 103.594. First support is the April 14thlow crossing at 100.420. Second support is February's low crossing at 100.345.
The June Euro was steady to slightly higher overnight as it consolidates some of this month's decline. Overnight trading sets the stage for a slightly higher opening when the day session begins trading. Stochastics and the RSI are oversold but remain neutral to bearish signaling that sideways to lower prices are possible near-term. If June extends this month's decline, the 25% retracement level of the 2022-2023 rally crossing at 1.07774 is the next downside target. Closes above the 20-day moving average crossing at $1.10119 would temper the near-term bearish outlook. First resistance is the 20-day moving average crossing at $1.10119. Second resistance is April's high crossing at $1.11290. First support is April's low crossing at $1.08355. Second support is the 25% retracement level of the 2022-2023 rally crossing at 1.07774.
The June British Pound was steady to slightly higher overnight and sets the stage for a slightly higher opening when the day session begins trading. Stochastics and the RSI are neutral to bearish signaling that sideways to lower prices near-term. If June extends last-week's decline, the 50-day moving average crossing at 1.2387 is the next downside target. If June renews the rally off the March 8th low, the 62% retracement level of the 2021-2022 decline crossing at 1.2784 is the next upside target. First resistance is last-Wednesday's high crossing at 1.2692. Second resistance is the 62% retracement level of the 2021-2022 decline crossing at 1.2784. First support is the 50-day moving average crossing at 1.2387. Second support is April's low crossing at 1.2293.
The June Swiss Franc was steady to slightly higher overnight and sets the stage for a slightly higher opening when the day session begins trading. Stochastics and the RSI are oversold but remain neutral to bearish signaling that sideways to lower prices are possible near-term. Closes below the May 2nd low crossing at 1.11770 would signal that a short-term top has been posted while opening the door for additional weakness near-term. If June resumes the rally off the March low, the May-2021 high crossing at 1.14120 is the next upside target. First resistance the May-2021 high crossing at 1.14120. Second resistance is the 87% retracement level of the 2021-2022 decline crossing at 1.15040. First support is the May 2nd low crossing at 1.11770. Second support is the 50-day moving average crossing at 1.11237.
The June Canadian Dollar was higher overnight it consolidates some of last-week's decline. Overnight trading sets the stage for a higher opening when the day session begins trading. Stochastics and the RSI are neutral to bearish signaling that sideways to lower prices are possible near-term. Closes below the 50-day moving average crossing at $73.82 would signal that a short-term top has been posted while opening the door for additional weakness near-term. Closes above the 10-day moving average crossing at $74.25 would temper the near-term bearish outlook. First resistance is the 10-day moving average crossing at $74.25. Second resistance is May's high crossing at $75.18. First support is the 50-day moving average crossing at $73.82. Second support is April's low crossing at $73.23.
The June Japanese Yen was steady to slightly lower overnight and sets the stage for a slightly lower opening when the day session begins trading. Stochastics and the RSI have turned neutral to bearish signaling that sideways to lower prices are possible near-term. If June resumes the decline off the March's high, the 62% retracement level of the October-January rally crossing at 0.072908 is the next downside target. Closes above the 50-day moving average crossing at 0.075552 would confirm that a short-term low has been posted while opening the door for additional gains near-term. First resistance is the 50-day moving average crossing at 0.075552. Second resistance is the April 13th high crossing at 0.076475. First support is the May 2nd low crossing at 0.073055. Second support is the 62% retracement level of the October-January rally crossing at 0.072908.
PRECIOUS METALS http://quotes.ino.com/ex changes/?c=metals"
Junegold was steady to slightly lower overnight and sets the stage for a slightly lower opening when the day session begins trading later this morning. Stochastics and the RSI are neutral to bearish signaling that sideways to lower prices are possible near-term. Closes below last-Friday's low crossing at $2005.70 would temper the near-term friendly outlook. If June renews the rally off February's low, the March-2022 high crossing at $2097.20 is the next upside target. First resistance is the May 4th high crossing at $2085.40. Second resistance is the March-2022 high crossing at $2097.20. First support is the 50-day moving average crossing at $1989.10. Second support is the March 22nd low crossing at $1953.70.
July silver was steady to slightly higher overnight as it consolidates some of last-week's sharp decline, which marked a downside breakout of the April-May trading range. Overnight trading sets the stage for a steady to slightly higher opening when the day session begins trading later this morning. Stochastics and the RSI are oversold but remain neutral to bearish signaling that sideways to lower prices are possible near-term. Closes below the 50-day moving average crossing at $24.175 would open the door for additional weakness near-term. Closes above the 10-day moving average crossing at $25.361 would temper the near-term bearish outlook. First resistance is the 10-day moving average crossing at $25.361. Second resistance is the May 5th high crossing at $26.435. First support is the 50-day moving average crossing at $24.175. Second support is the March 28th low crossing at $23.145.
July copper was higher overnight as it consolidates some of last-Thursday's sharp decline. Overnight trading sets the stage for a higher opening when the day session begins trading. Stochastics and the RSI are oversold but remain bearish signaling that sideways to lower prices are possible near-term. If July extends the decline off April's high, the 62% retracement level of the 2022-2023 rally crossing at 3.6247 is the next downside target. Closes above the 20-day moving average crossing at 3.8960 would signal that a short-term low has been posted. First resistance is the 20-day moving average crossing at 3.8960. Second resistance is the 50-day moving average crossing at 3.9778. First support is last-Friday's low crossing at 3.6770. Second support is the 62% retracement level of the 2022-2023 rally crossing at 3.6247.
GRAINS http://quotes.ino.com/ex changes/?c=grains
July corn was higher overnight as it extends this month's trading range. Overnight trading sets the stage for a higher opening when the day sessions begins trading. Stochastics and the RSI are neutral to bullish signaling that sideways to higher prices are possible near-term. If July renews the rally off the May 3rd low, the 20-day moving average crossing at $5.98 1/4 is the next upside target. If July renews the decline off April's high, the December-2021 low crossing at $5.48 3/4 is the next downside target.First resistance is the 20-day moving average crossing at $5.98 1/4. Second resistance is the 50-day moving average crossing at $6.12 1/2. First support is the 50% retracement level of the 2020-2022 rally crossing at $5.71 3/4. Second support is the December-2021 low crossing at $5.48 3/4.
July wheat was higher overnight and sets the stage for a higher opening when the day session begins trading. Stochastics and the RSI are neutral to bullish signaling that sideways to higher prices are possible near-term. Closes above last-Monday's high crossing at $6.69 would confirm that a short-term low has been posted while opening the door for additional short-covering gains. If July resumes the decline off March's high the March-2021 low crossing at $5.71 is the next downside target. First resistance is last-Monday's high crossing at $6.69. Second resistance is the 50-day moving average crossing at $6.78 3/4. First support is the 87% retracement level of the 2020-2022 rally crossing at $6.17. Second support is the March-2021 low crossing at $5.71.
July Kansas City wheat was sharply higher overnight as it extends the rally off May's low. Overnight trading sets the stage for a sharply higher opening when the day session begins trading later this morning. Stochastics and the RSI are overbought but remain neutral to bullish signaling that sideways to higher prices are possible near-term. If July extends the rally off May's low, the 38% retracement level of the 2022-2023 decline crossing at $9.17 1/4 is the next upside target. Closes below the 20-day moving average crossing at $8.20 1/4 would signal that a short-term top has been posted. First resistance is the overnight high crossing at $9.05 3/4. Second resistance is the 38% retracement level of the 2022-2023 decline crossing at $9.17 1/4. First support is the 10-day moving average crossing at $8.33 1/4. Second support is the 20-day moving average crossing at $8.20 1/4.
July Minneapolis wheat was sharply higher overnight as it extends the rally off May's low. Overnight trading sets the stage for a sharply higher opening when the day session begins trading. Stochastics and the RSI are overbought but remain neutral to bullish signaling that sideways to higher prices are possible near-term. If July extends this month's rally, the April 18th high crossing at $8.95 1/4 is the next upside target. Closes below the 10-day moving average crossing at $8.31 1/2 would signal that the rally off the May 3rd low has ended. First resistance is the April 18th high crossing at $8.95 1/4. Second resistance is April's high crossing at $9.13 1/2. First support is the 10-day moving average crossing at $8.31 1/2. Second support is the May 3rd low crossing at $7.69.
SOYBEAN COMPLEX? http://quotes.ino.com/ex?changes/?c=grains "
July soybeans were higher overnight and sets the stage for a higher opening when the day session begins trading later this morning. Stochastics and the RSI are oversold, diverging but remain neutral to bearish signaling that sideways to lower prices are possible near-term. If July extends the decline off April's high, March's low crossing at $13.83 3/4 is the next downside target. Closes above the 20-day moving average crossing at $14.26 3/4 would signal that a short-term low has been posted while opening the door for additional short-covering gains. First resistance is the 20-day moving average crossing at $14.26 3/4. Second resistance is the May 8th high crossing at $14.44 3/4. First support is March's low crossing at $13.83 3/4. Second support is the 75% retracement level of the 2022-2023 rally crossing at $13.60 3/4.
July soybean meal was higher overnight as it extends the rally last-Wednesday's low. Overnight trading sets the stage for a higher opening when the day session begins trading. Stochastics and the RSI are neutral to bullish signaling that sideways to higher prices are possible near-term. Closes above the 20-day moving average crossing at $433.40 would signal that a short-term low has been posted while opening the door for additional gains near-term. If July renews the decline off March's high, the 38% retracement level of the 2020-2023 rally crossing at $411.90 is the next downside target. First resistance is the 20-day moving average crossing at $433.40. Second resistance is the 50-day moving average crossing at $449.00. First support is last-Wednesday's low crossing at $416.10. Second support is the 38% retracement level of the 2020-2023 rally crossing at $411.90.
July soybean oil was slightly lower overnight as it extends this year's decline. Overnight trading sets the stage for a steady to slightly lower opening when the day session begins trading. Stochastics and the RSI are oversold but remain neutral to bearish signaling that sideways to lower prices are possible near-term. If July extends this month's decline, the 62% retracement level of the 2020-2022 rally crossing at 46.42 is the next downside target. Closes above the 20-day moving average crossing at 52.53 would signal that a low has been posted while opening the door for a possible test of the 50-day moving average crossing at 54.51. First resistance is the 20-day moving average crossing at 52.53. Second resistance is the 50-day moving average crossing at 54.51. First support is the the overnight low crossing at 48.81. Second support is the 62% retracement level of the 2020-2022 rally crossing at 46.42.
Thanks much tallpine!
As speculated yesterday, the dry weather in week 2 and increasing heat has become bullish for grains and natural gas.
https://www.marketforum.com/forum/topic/95182/#95188
By metmike - May 14, 2023, 11:36 p.m.
Thanks very much, tallpine!
Bullish USDA crop production for HRW crop still has that market higher tonight.
Mostly dry weather in the Upper and Central Midwest the next 2 weeks is still favorable for planting.
Wondering when dry becomes bullish for C and S???
Could be soon.
7 Day Total precipitation below:
http://www.wpc.ncep.noaa.govcdx /qpf/p168i.gif?1530796126

Extended weather.
https://www.cpc.ncep.noaa.gov/products/predictions/610day/ | |||||||||
| 6 to 10 day outlooks | |||||||||
| Click below for information about how to read 6-10 day outlook maps Temperature Precipitation | |||||||||
| Click below for archives of past outlooks (data & graphics), historical analogs to todays forecast, and other formats of the 6-10 day outlooks ArchivesAnalogsLines-Only FormatGIS Data | |||||||||
Temperature Probability | |||||||||
Precipitation Probability | |||||||||
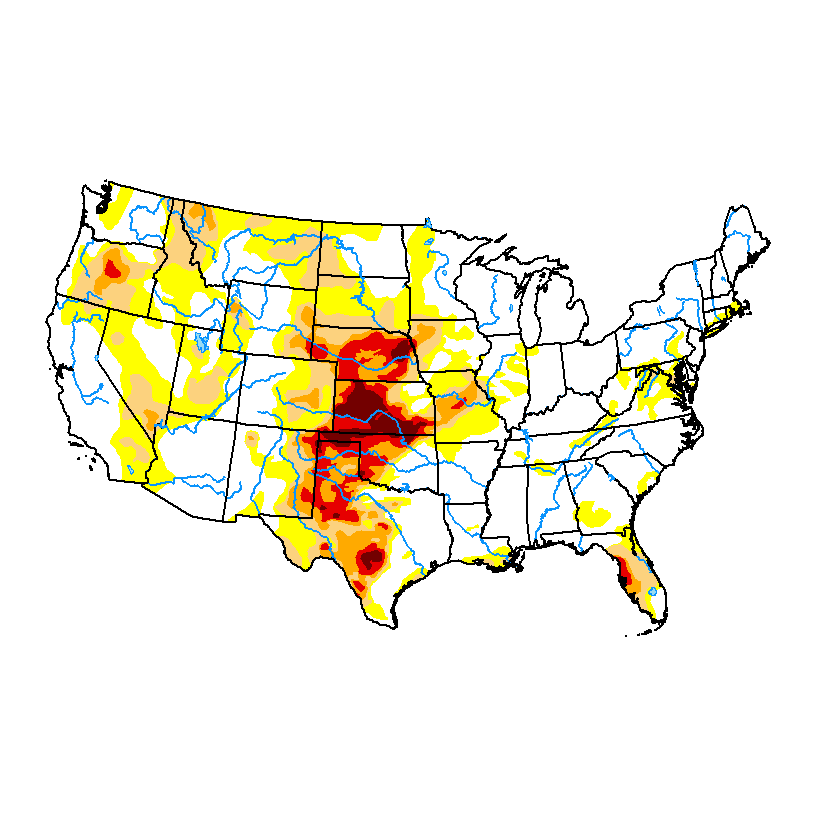
Soilmoisture anomaly:
These maps sometimes take a day to catch up to incorporate the latest data(the bottom map is only updated once a week).
https://www.cpc.ncep.noaa.gov/products/Soilmst_Monitoring/US/Soilmst/Soilmst.shtml#
![]()


++++++++++++++++++++++++++++
https://mrcc.purdue.edu/cliwatch/watch.htm#curMonths

Most of the drought in the West has been wiped out!
https://droughtmonitor.unl.edu/
Drought Monitor:
May 9, 2023
Drought monitor previous years: You can see the natural La Niña, (cold water-in the tropical Pacific)causing the drought! Starting in 2020, then worsening for 2+ years!
The ending of La Niña in 2023-heading towards El Nino, is causing the opposite weather-bombarding us with moisture.…..too much in some cases. This is a natural cycle NOT climate change!
Re: Re: KEY EVENTS TO WATCH FOR:
By metmike - May 14, 2023, 11:37 p.m.
All the weather:


