https://www.cnn.com/2023/04/12/weather/florida-flash-flood-fort-lauderdale/index.html
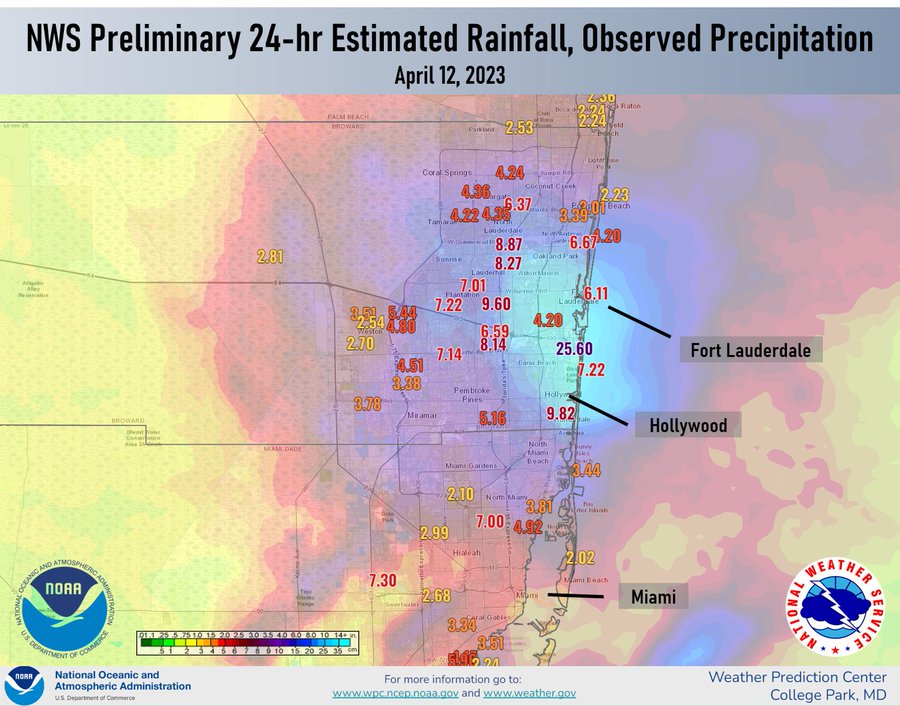
CNN — Fort Lauderdale experienced the rainiest day in its history Wednesday – a 1-in-1,000-year rainfall event – sparking a flash flood emergency in Broward County that has prompted emergency rescues, forced drivers to abandon cars, shuttered schools and shut down the airport through 9 a.m. Friday. And more rain is coming down.
The region recorded widespread rainfall totals of more than a foot, while Fort Lauderdale tallied 25.91 inches in a 24-hour period, according to preliminary reports from the National Weather Service office in Miami.
++++++++
https://www.cnn.com/2023/04/14/weather/fort-lauderdale-florida-flood-friday/index.html
+++++
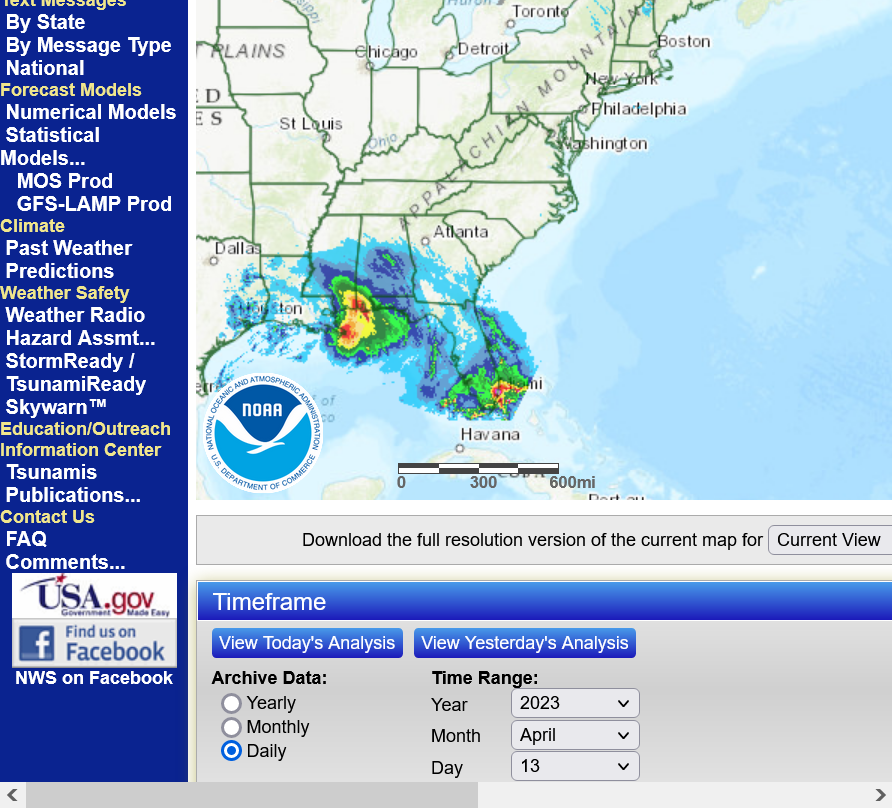
I haven't been able to find a real good close up rainfall map to show this very isolated event that featured a thunderstorm that sat in the same place for an extremely long time. It doesn't show up well on the map below because it was on such a tiny scale in the center of the small area of rain in far southeast FL.
https://water.weather.gov/precip/
More later
My thoughts for this huge Ft Lauderdale rain:
- Records go back to 1913.
- 25.91", which fell mainly within just a 12 hour period, far exceeds the greatest there on record in one calendar day. The old record was 14.59" on 4/25/1979 from a weak low in the NE GOM.
Here are prior 10"+ 2 calendar day rains:
- 16.74" 10/19-20/1924 from hurricane moving NE from NW Caribb.
- 15.79" 4/24-5/1979 from weak NE GOM low
- 13.72" 6/2-3/1930 with no tropical system anywhere nearby
- 13.10" 10/11-12/1947 from hurricane moving NE from NW Caribb.
- 12.25" 10/31-11/1/1969 near stationary front
- 11.00" 10/4-5/1948 from hurricane moving NE from NW Caribb.
- 10.89" 5/27-28/2003 (nothing tropical).
- 10.75" 3/14-15/1919 (nothing tropical).
- 10.68" 11/19-20/1973 (nothing tropical).
- 10.14" 6/7-8/1999 (nothing tropical).
The THREE day record is only 18.24" set 10/19-21/1924 per this:
https://www.newsweek.com/fort-lauderdale-third-annual-rainfall-only-7-hours-1794169?amp=1
----------------------------------
- Do I think that last week's 25.91" in 12 hours could be a 1,000 year event? Yes, even though we'll never know, that wouldn't at all be surprising based on how much heavier it was than all of the above and also how very rare rainfall this heavy within just 12 hours has occurred anywhere in the US, much less just there. I read that this is third heaviest rainfall event in one day, much less 12 hours, for any official station in the US with only Hurricane Harvey in 2017 in TX and Hawaii back a few decades slightly heavier. For that matter, this could have even been a once in several thousand year event
- Considering that there are thousands of official stations in the US, the expectancy is that on average there'd be several once in 1,000 year extremely heavy rainfall events in any one year somewhere in the US. So, having a once in 1,000 year event somewhere in the US in any one year isn't really as noteworthy as it sounds though it is obviously a huge deal wherever it occurs.
- Yes we're hearing more about "1,000 year events", but I don't necessarily think that's because they're occurring more frequently. Rather, I suspect that's more because they're being recognized much more than they used to be because doing so fits into the "AGW causes all extreme wx events" narrative.
--------------------
Is there any clearcut evidence that GW was a major cause? No clearcut evidence imho. Why?
- It occurred with dewpoints in the low 70s and offshore SSTs no higher than the low 80s. Yes, those are above average for mid April. However, SSTs get into the mid to upper 80s and dewpoints into the upper 70s every summer and yet nothing even close to this heavy an event has occurred most years in S FL summers. So, I think there was a lot more to this than just higher than average for mid-April dewpoints/SSTs. One factor appears to be very weak steering. Is the very weak steering for this somehow connected to AGW? Good luck on proving that!
- Look at the decades for the listed 11 heaviest Ft Lauderdale events since 1913:
1910s, 1920s, 1930s, 1940s (2), 1960s, 1970s (2), 1990s, 2000s, 2020s
This looks like a pretty even distribution. If these records had been heavily influenced by the 3 or so degree F warmer globe, I would have expected a heavier concentration since the 1980s (and especially in summer/early fall). Yet, there have been only 3 of 11 since then.
- Interestingly, none have occurred from a tropical cyclone since way back in 1948! Regardless of AGW factoring in or not, that's pretty interesting! If someone had told me before I did this research that it had been 75 years since the last top 11 two day heavy rainfall event at Ft. Lauderdale from a TC, I would have had a lot of doubt about it.
Larry,
That was a wonderful assessment and right on the money.
The rainfall map below shows how freaky and isolated this event was. 1 thunderstorm cell that basically parked over the same area. Much of the rain fell in something like 6 hours that made it even more impressive.
With regards to climate change. It's funny that every single extreme weather event is looked at with regards to that in today's world. It's like natural weather that controls almost all of our weather has taken a back seat in most peoples minds.
Of course we're happy to objectively discuss it with respect to that!
We know that the new, slightly warmer atmosphere can hold 7% more moisture than the old atmosphere could. However as Larry noted. The ocean temps that would support the highest precipital water for heaviest rain potential have been warmer than this(without climate change being a factor).
It really boils down to this, once again(Cliff Mass can be counted on as an elite source for using objective, authentic science)
https://cliffmass.blogspot.com/2016/03/the-golden-rule-of-climate-extremes.html
The Golden Rule
Considering the substantial confusion in the media about this critical issue, let me provide the GOLDEN RULE OF CLIMATE EXTREMES. Here it is:
The more extreme a climate or weather record is, the greater the contribution of natural variability.
Or to put it a different way, the larger or more unusual an extreme, the higher proportion of the extreme is due to natural variability.
https://www.wunderground.com/cat6/Summary-US-State-Historical-Precipitation-Extremes

Rocky Mountain states are very deficient when it comes to high precipitable water values needed for high end record rains but all the other southern states have had rains similar to this or higher during the last 130 years.........most BEFORE the fake climate crisis.
The TX record for 24 hour rains was set in 1979 from the remnants of Tropical Storm Claudette......42 inches. That's almost 3 times the top amount of rain that fell in this event for a 24 hour period.
And 1979 isn't 1,000 years ago!
I'm not saying that a great deal of rain didn't fall........just that natural variation of weather by far, played the biggest role and it would be a stretch to even call it a 1 in 100 year event.
Maybe 1 in 25 year event would be most scientifically accurate based on the empirical data that I show here vs the made up climate crisis using scary words, sensationalism and deception.
https://weather.com/news/climate/news/extreme-rainfall-precipitation-recorded-50-states
++++++++++
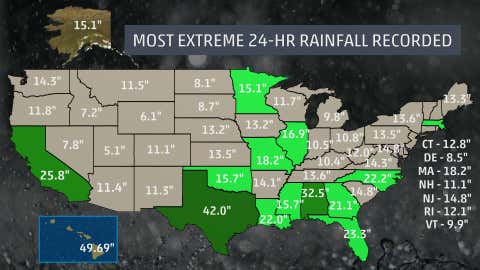
US Rainfall Records
The map/link below shows rainfall records for the US for total rains, going from a time frame of 1 minute up to a time frame of 1 year. If you go to the link, you will see this better. It shows the date of occurrence for each of these 20 events. The surprise is that all of them occurred BEFORE 1983 and before man made global warming and climate change would have been a factor. I can't completely explain this as I had recently done a study on our local region going back 120 years that did show heavier rain events over the last 30 years with an especially big increase in the last 15 years..
I think that we have in fact had at least a slight increase in the # of extreme rain events, however, this shows that regardless of humans the really extreme events have always happened and will continue to happen.
http://www.nws.noaa.gov/oh/hdsc/record_precip/record_precip_us.html
| USA Records-HDSC/OWP www.nws.noaa.gov Disclaimers: Some data are estimates. Not all data have been verified. "*" indicates questionable veracity. Coordinates are approximate. |
Duration Amount (in) Location Start date
1-min 1.23 Unionville, MD 4 Jul 1956
5-min 2.03 Alamogordo Creek, NM 5 Jun 1960
12-min 2.30 Embarrass, WI 28 May 1881
15-min 3.95 Galveston, TX 4 Jun 1871
30-min 7.00 Cambridge, OH 16 Jul 1914 42-min 12.0 Holt, MO 22 Jun 1947
13.8* Burnsville 6 WNW, WV 4 Aug 1943
60-min 12.0 Holt, MO 22 Jun 1947
12.0 305 Kilauea Sugar Plantation, Kauai, HI 24 Jan 1956
90-min 14.6 Burnsville 6 WNW, WV 4 Aug 1943
2-hr 15.0 Woodward Ranch (D'Hanis), TX 31 May 1935
2.17-hr 19.0 Rockport, WV 18 Jul 1889
2.75-hr 22.0 Woodward Ranch (D'Hanis), TX 31 May 1935
3-hr 28.5 Smethport, PA 18 Jul 1942
4.5-hr 30.7 Smethport, PA 18 Jul 1942
12-hr 34.3 Smethport, PA 17 Jul 1942
18-hr 36.4 Thrall, TX 9 Sep 1921
24-hr 43.0 Alvin, TX 29.42 -95.24 25 Jul 1979
3,4,5 4-day 62.0 Kukaiau, Hamakua, HI 27 Feb 1902
8-day 82.0 Kukaiau, Hamakua, HI 28 Feb 1902
1-month 149 Mt. Waialeale, Kauai, HI 1 Mar 1982
12-month 739 Kukui, Maui, HI 1 Dec 1981
++++++++++++++++
However, there were a number of individual STATE rain records broken in 2018/19. with a 1 year anomaly/spike higher.
Since 1970, the US has been slightly wetter, as seen on the graph below.
https://www.wunderground.com/cat6/Summary-US-State-Historical-Precipitation-Extremes

https://www.ranker.com/list/worst-floods-in-history/eric-vega?page=4
1. August 1931 Yangtze River, China 3,700,000 killed
2. September 1887 Yellow River, China 2,000,000 deaths
3. June 1938 Yellow River, China 800,000 deaths
4. August 1975 Banqiao, China 230,000 dead
5. 1935 Yangtze River 145,000 dead
6. November 1530 St. Felix Flood, Holy Roman Empire/Europe 100,000+ killed
7. August 1971, Hanoi/Red Rivers, North Vietnam 100,000 dead
8. May 1911 Jiangsu-Anhui, China 100,000 dead
9. December 1287 Holy Roman Empire/Europe 50,000+ dead
10. September 1949 Guatemala 40,000 dead
11. June 1954 Yangtze River, China 30,000 dead
12. June 1974 Bangladesh 28,700 dead
13. January 1362 St. Marcellus Flood-Ireland/Britain/N.Germany 25,000+ dead
14. November 1570 All Saints Flood Netherlands 20,000+ killed
15. December 1999 Vargas mudslides Venezuela 20,000 dead
How many of these events took place in the last 40 years?
Answer= 1
How many were caused by climate change =0
https://www.wsfa.com/2022/08/25/rare-1000-year-rain-events-keep-adding-up/
metmike: The title should read "abuse of climate science terminology, exaggeration and alarmism in meteorology continue to ramp up.........completely out of control in 2022"
1 in a 1,000 year deceptive journalism/reporting on stories is now becoming the norm (-:
Like Larry stated, 1,000 year events are actually expected at several locations every year.
https://simplemaps.com/data/us-cities
With over 108,000 cities in the US, if we had 108 of them reporting a 1,000 year event every year, then after 1,000 years, that would equate to 108,000 events that were 1,000 year events.
If we took a more conservative number like 10,600 observing stations:
https://www.weather.gov/iwx/coop_station
then we would expect more like 10.6 events that qualify as 1 in 1,000 year event for them to add up to 10,600 and an average of 1/station.
It doesn't work exactly like that but the example is to help us understand that 1 in 1,000 year events for individual locations are expected every year.
NOT for the country. If this rainfall record blew away the previous record for the US(from the past 100+ years) then that would be a different deal. It didn't come close to doing that.
Additional specific comments related to this below:
https://www.marketforum.com/forum/topic/94542/#94575
++++++++++++++++++
Richard B. (Ricky) Rood, University of Michigan
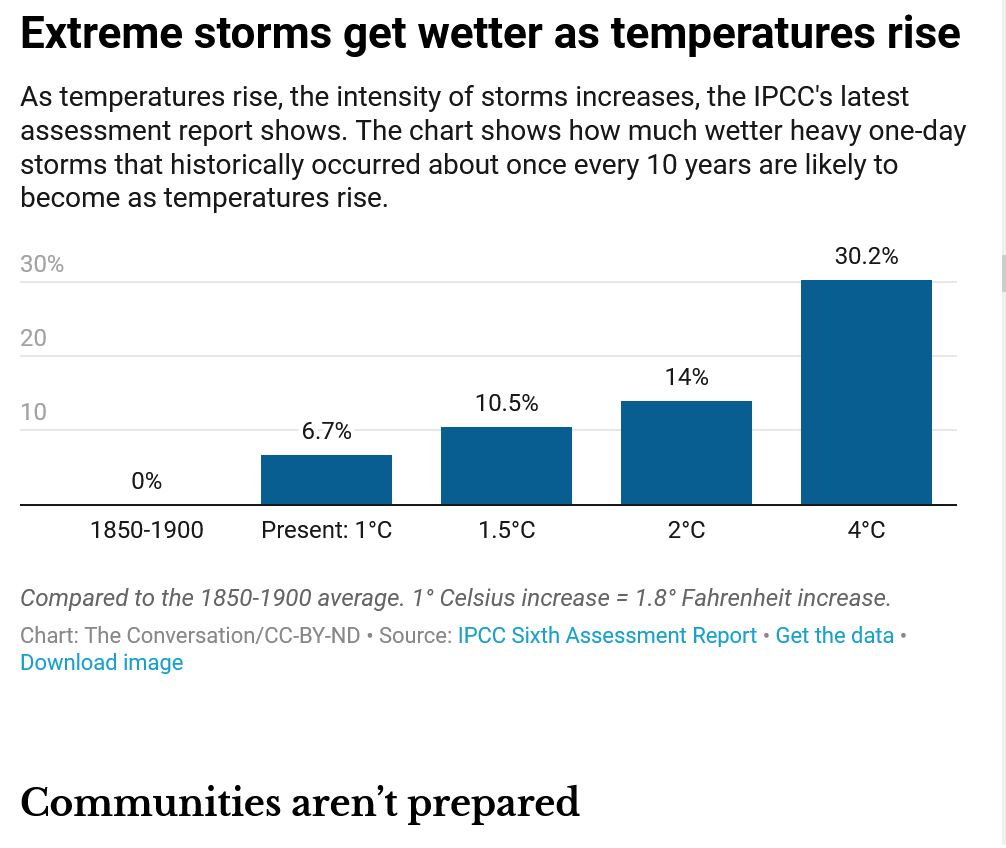
metmike: I agree with the present 6.7%
However, they are showing people an extreme IPCC, busted model projection of conditions being 4 Deg. C, 7 Deg. F higher?
There is almost no chance for warming to amount to that level this century, even in people that are pretty extreme with their views.
For reasonable scientists, there is NOBODY that believes this will happen. Even 3 deg. C warmer is unlikely before 2100.
The author is either:
1. Ignorant about climate science
2. Wants to scare people
3. Is sensationalizing to increase attention/sales and push a political agenda
For sure this is irresponsible science reporting and poor journalism based on the old standards. In today's world of journalism, especially regarding the fake climate crisis, journalists can manufacture anything they want and never be held accountable.
Many journalists are also activists using their profession to push messages vs reporting objective facts and telling more than 1 side(there's).
1 way to assess events like this in comparison to a slightly cooler planet when it comes to heavy rains is to simply add 7% to the amount of rain based on a global average increase of 7% in the amount of moisture from warming of +1 Deg.
This is extremely flawed because the warming and higher moisture amounts are MUCH greater at the higher latitudes and less in the tropics, where FL is located (if this happened in AK for instance, we would be able to claim greater than 7%).
Using this method, the amount of rain that would have fallen would have been..
24.21 inches compared to 25.91 inches
24.21 X .07 =1.69
24.21 +1.69 =25.90
+++++++++
This gifted TV meteorologist that works in S.Florida provides us with a terrific discussion/video.
I found these comments to be very insightful:
https://wattsupwiththat.com/2023/04/16/michael-e-mann-goes-humpty-dumpty-on-1000-year-event/
Reply to Walter
April 16, 2023 10:46 pm
its a definition ding dong. its just a DIFFERENT WAY of expressing the frequency or probability.
hint you dont need to measure every swede to estimate their height.
Hint: if you measured 100 swedes and foiunf the average swede was 6 feet tall
with a std dev of 3 inches.
you would say a 7 foot swede was a 1 in 5000 occurance.
if you flip a coin 10 times and witness heads 5 times, then you could also say that
observing 100 heads in a row could be a 1 in 500 occurance.
the magic of sampling is you dont have to sample 1000 years to know the 1000 year return peroid
AGAIN return peroid is not like observing for 1000 years and saying : we saw this
once, we saw that twice, we saw this 6 times. that would be stupid.
return peroid is just inverse of frequency by definition
Return periods for floods are a way of expressing the likelihood or probability of a flood of a certain size or magnitude occurring in a particular location in any given year. This information is useful for planning and designing infrastructure, such as bridges, dams, and levees, as well as for setting insurance rates and establishing emergency response plans.
The return period is a statistical concept that is calculated based on historical data on floods in a particular area. It represents the average time interval between floods of a certain size or magnitude occurring in that area. For example, a 100-year flood has a return period of 100 years, which means that there is a 1% chance of a flood of that size occurring in any given year.
https://en.wikipedia.org/wiki/Gumbel_distribution
++++++++++++++
MJB
April 17, 2023 6:17 am
As many others have pointed out a 1 in 1,000 event does not mean we have to wait 1,000 years or more for it to happen. Assuming adjacent years are independent of each other, there is an approximately 63% chance of a 1 in 1,000 year event occurring in any given 1,000 year period.
If we take the very narrow view that the 1 in 1,000 event is for a single place (define as you see fit, but something smallish like a county or city) then it’s a 0.1% chance of happening in any given year. But as we are running this for many years we need to consider the cumulative probability over successive years (or season, or multi-day event, whatever statistic the claim is based on).
For these kinds of math problems it’s simpler to calculate the probability of it not happening and then subtract from 1. So if we make a quick excel sheet that multiplies 0.999 by 0.999, and then the product of that by 0.999 for each successive row for 1,000 rows, we get the running probability of it not happening for each year, which we can reverse to the probability of it happening.
After doing so we find that for this very narrow view of a 1 in 1,000 event in a single relatively small pre-specified place we find the number of years to get a 10%, 25%, or 50% chance of it happening is 105, 288, and 693 years respectively.
But we know the climate alarmist view would not take such a narrow view, they would claim any 1 in 1,000 year event as evidence. As this story is for South Florida we’ll limit our considerations to anywhere in the US. As South Florida is roughly half a state, lets for the sake of argument say there are 100 possible places in the continental US for a 1 in 1,000 year event of similar geographic scope to occur.
Now if we are being honest (which presumably is our goal given we are challenging Mann’s statements), there is also likely a spatial auto-correlation (as a few other commenters have pointed out) where a single weather pattern is likely to increase the chance of a 1 in 1,000 year event in more than 1 half-state at a time, so we would need to temper our calculation accordingly. That is no simple task to do well given regional patterns, influence of various cycles (ENSO, PDO…), seasonal differences, etc. and well beyond the scope of this comment.
But as an example, and if my dusty/rudimentary/3-decades since learning it probability math is correct, the chance of a 1 in 1,000 year event occurring after only 10 years, if we are watching just 20 independent places, rises to a little over 18%. If we expand to the full 100 possible half-state sized places (i.e. ignoring spatial effects) there is an 86% chance of a 1 in 1,000 year event occurring within only 20-years.
Now, if like number of possible places to find a 1 in 1,000 event, we do the same adjustment for the many possible weather variables tracked (single event precip, monthly precip, daily maximum temp, seasonal average temp, number of days hotter than X, length of “fire season”, etc.) we almost guarantee a 1 in 1,000 year event happening somewhere in the continental US for some weather statistic every few years.
The simplistic view shown here by Mann is the reason that Vegas exists – probability is not intuitive, cumulative probability is “hard”, and conditional probability is almost always ignored (gamblers fallacy, etc.).
+++++++
This was me:
Mike Maguire
Reply to MJB
April 17, 2023 8:14 am
Great assessment!
https://simplemaps.com/data/us-cities
With over 108,000 cities in the US, when you multiply that huge number by the minuscule 1 in 1,000 year event probability at any 1 location…….you have the LIKELIHOOD of it happening at numerous locations each year.
If we took a more conservative number like 10,600 observing stations:
https://www.weather.gov/iwx/coop_station
We would still expect several 1 in 1,000 year events in most years for INDIVIDUAL locations.
When you expand the geographical region of the event, you greatly increase the number of events to compare with and it takes an even more extreme event to be a 1 in 1,000 event.
However, the numbers above based on numerous stations make for a very flawed, region expanding comparison when they expand to areas with a completely different climate.
We can’t expand the area to the entire US to compare with because 95% of the US would never have the same extremely favorable tropical/oceanic air mass in place that caused this.
An event like this in Bismark, ND for instance would be more like a 1 in a million event.
Throwing 95% of the country in that has almost no chance of this happening will make it look more unusual than it really was.