Previous thread:
Good bye La Nina
16 responses |
Started by metmike - Jan. 19, 2023, 10:05 p.m.
https://www.marketforum.com/forum/topic/92327/
++++++++++++++++++
El Nino on the way, very high confidence and it’s coming much faster than expected previously!
Thats often good news for the upcoming growing season!
Growing season analogs with El Nino are for favorable weather, even though we're starting the year with widespread drought.
Update: Before we grow the crop, we need to get it planted/well emerged. I'm increasingly concerned that the blockbuster El Nino will cause excessive rains downstream in parts of the US before that happens.
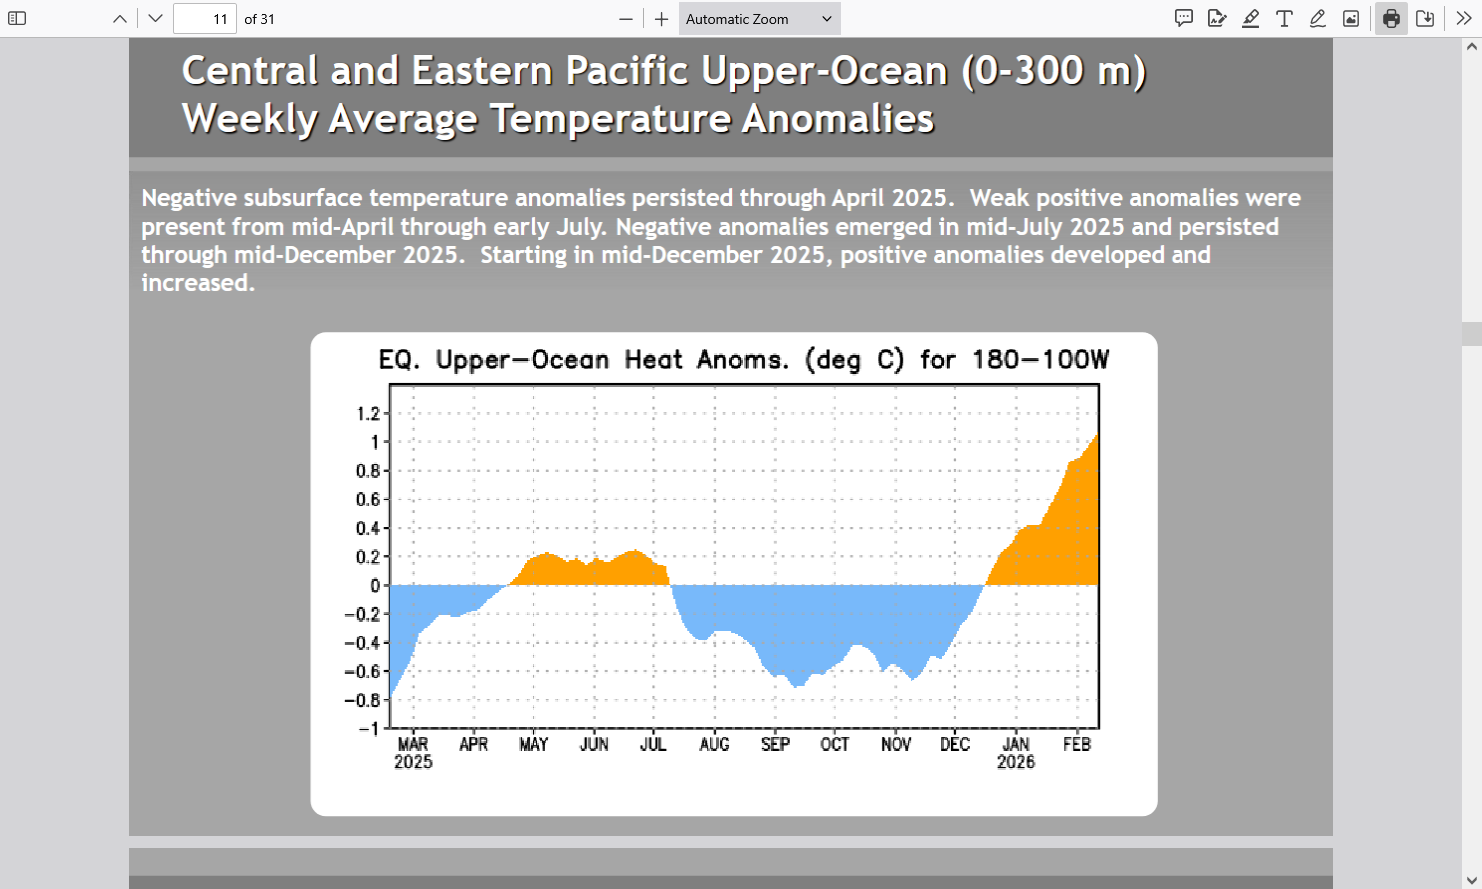
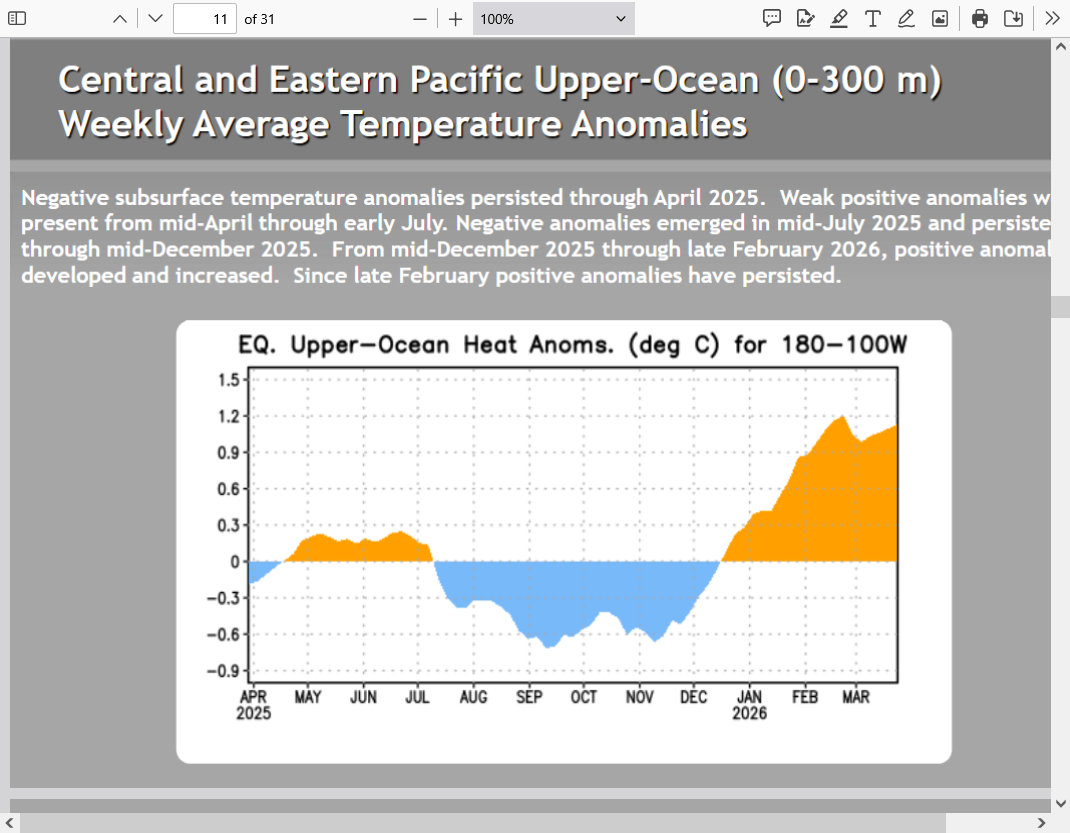
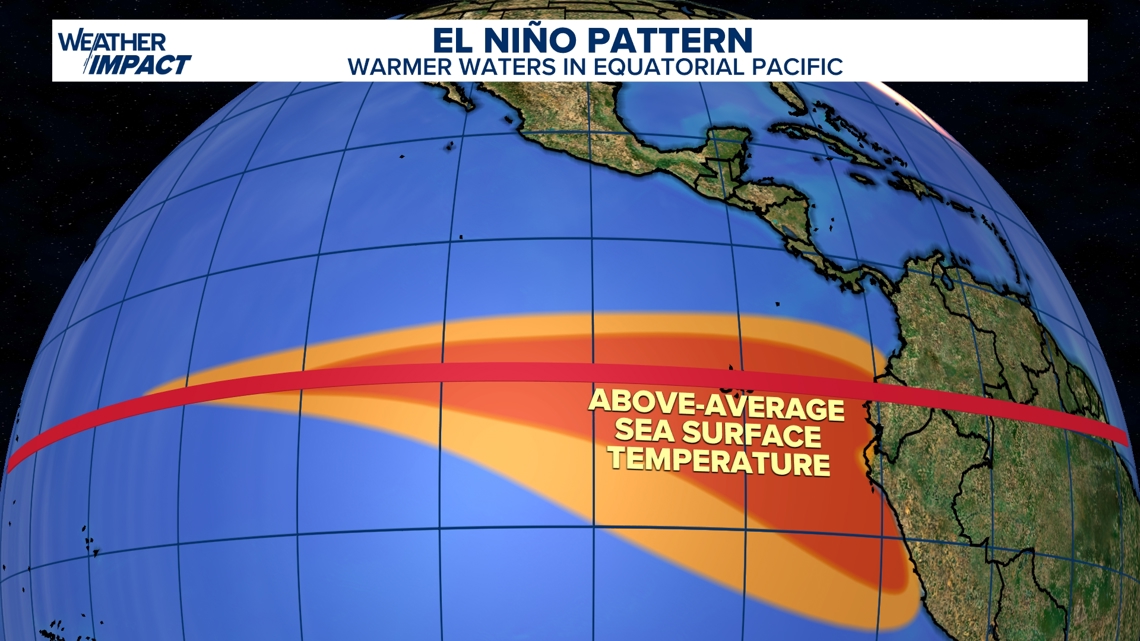
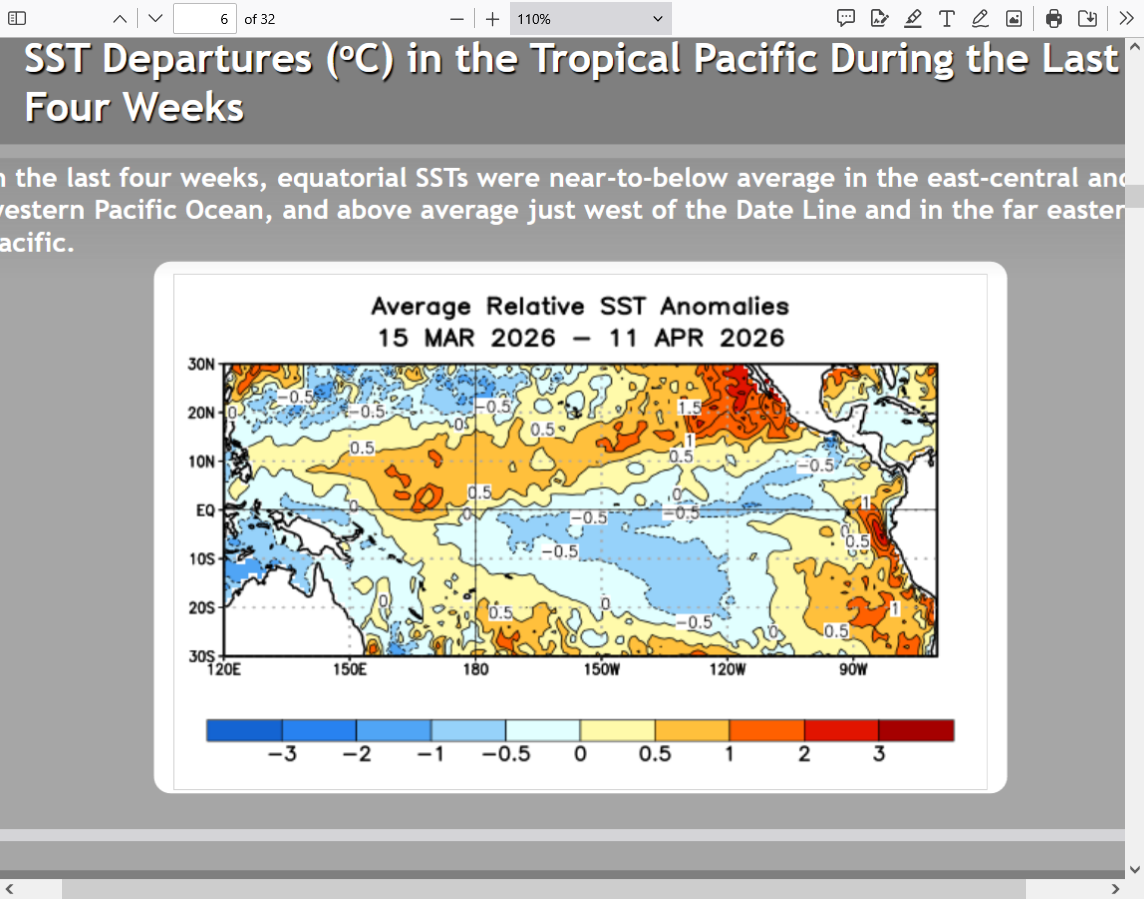
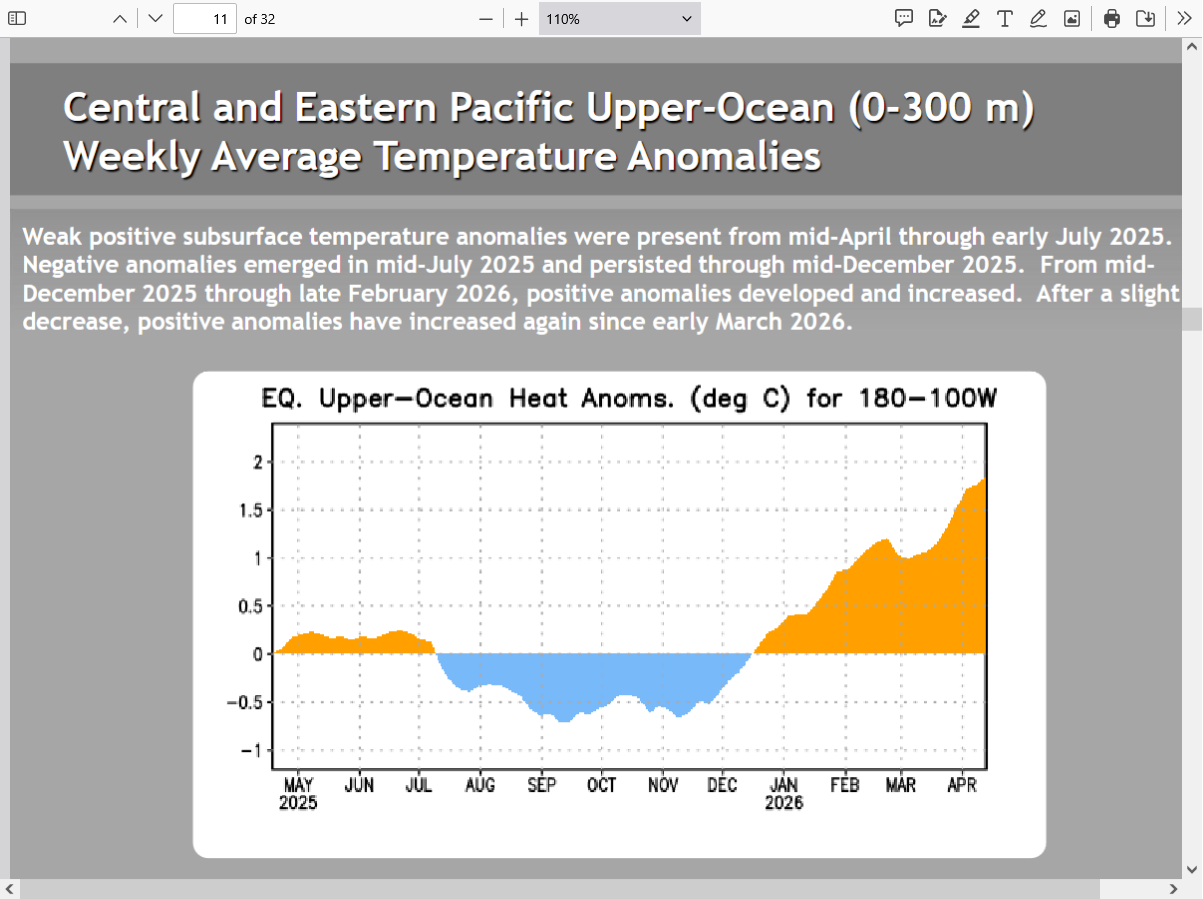
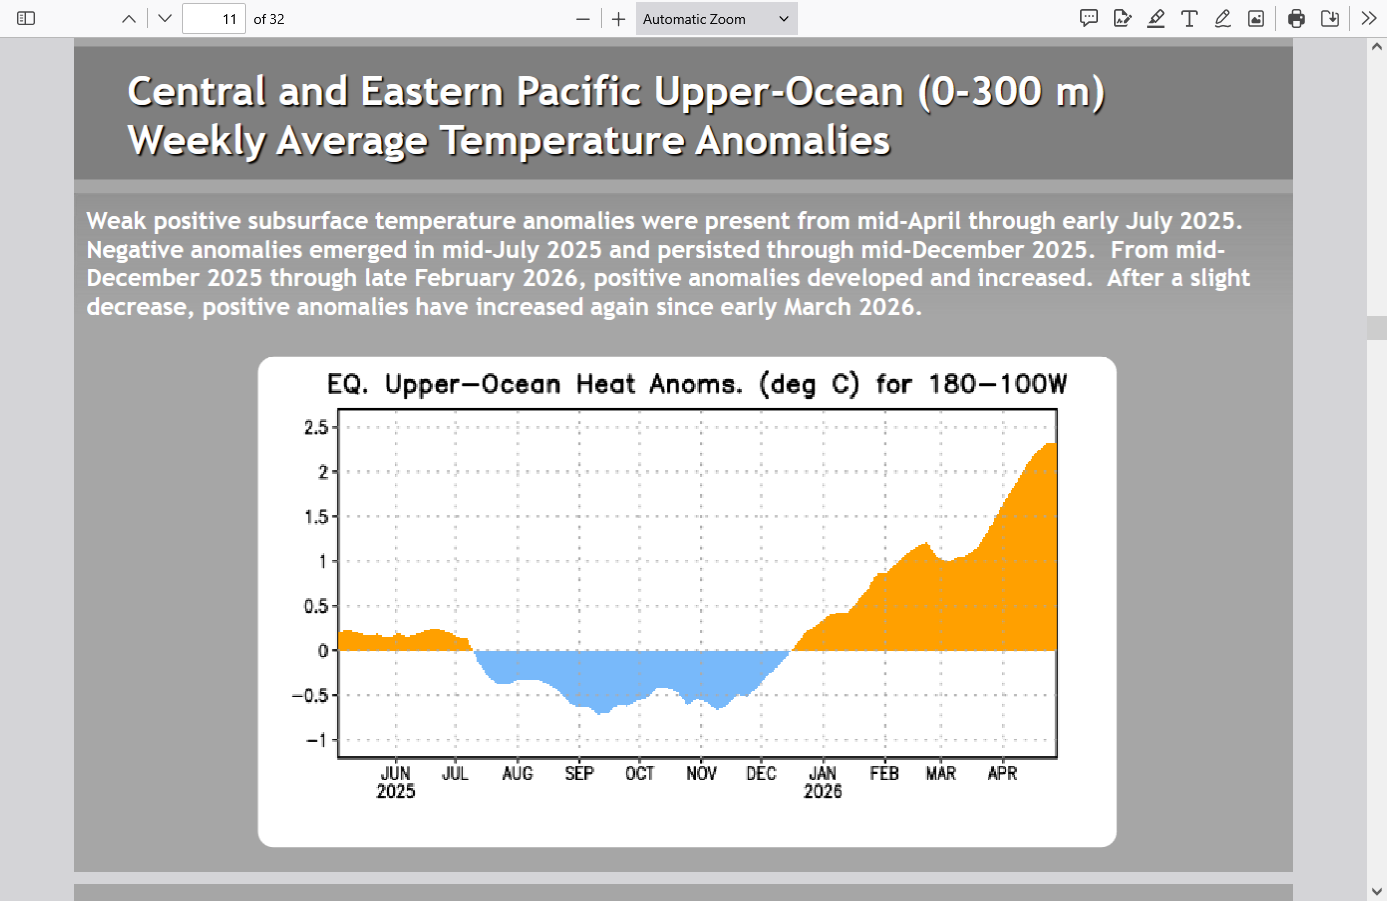
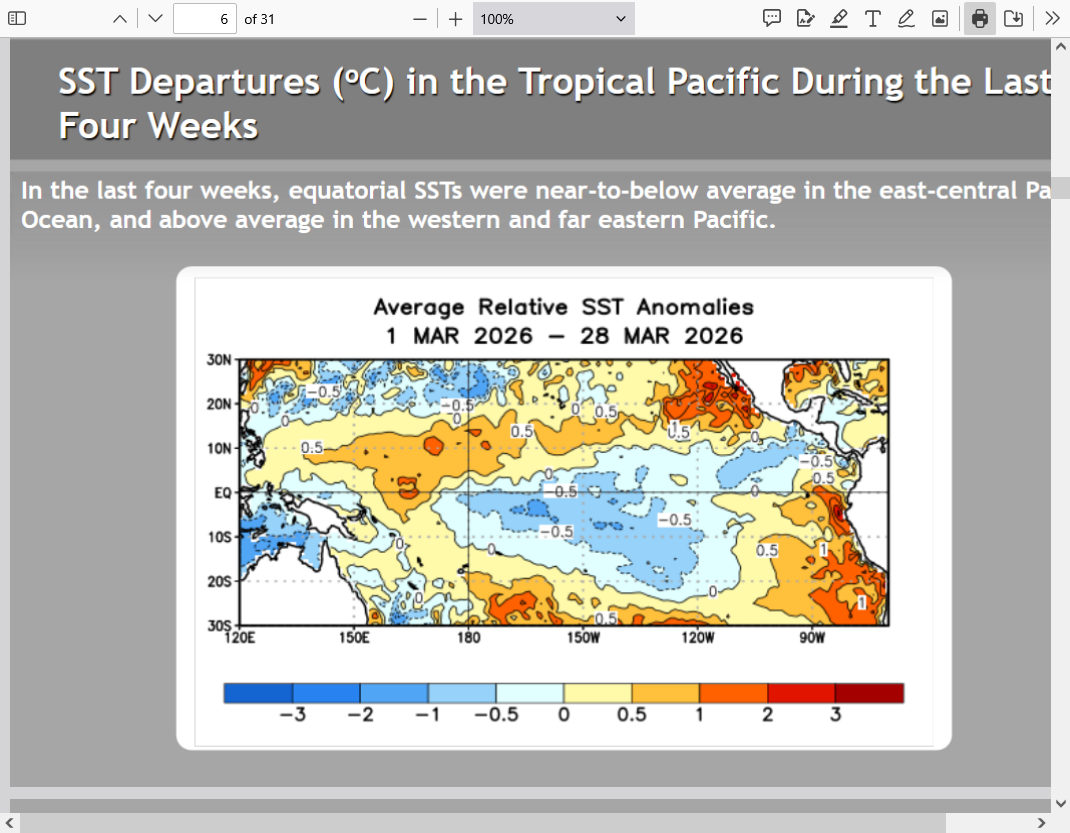
One of the few places with a colder than average ocean on the planet right now is the most important one. The East/Central tropical Pacific that determines La Nina/El Nino. But this is rapidly warming!
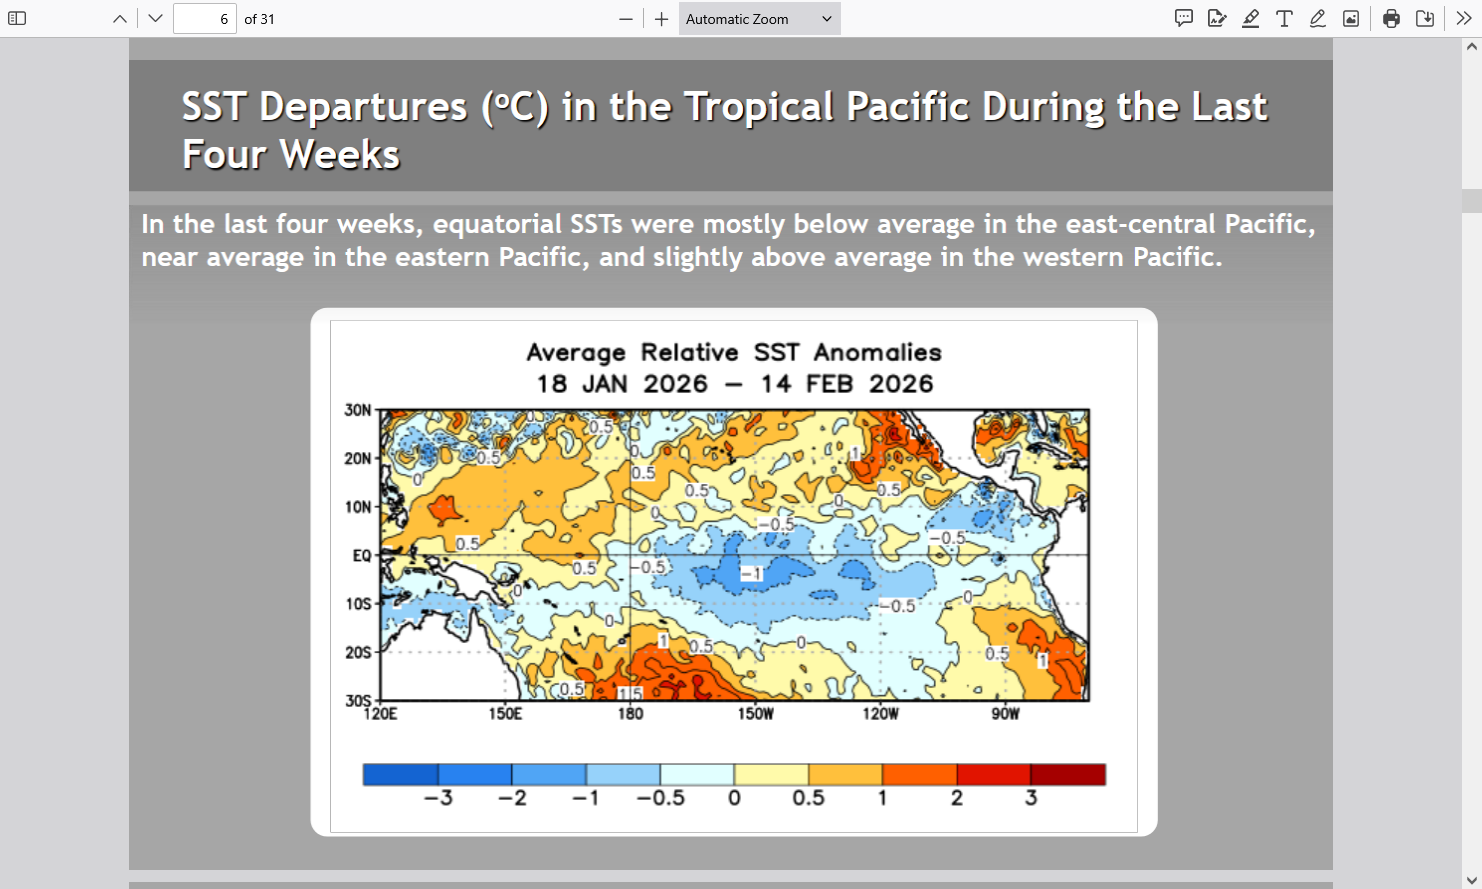
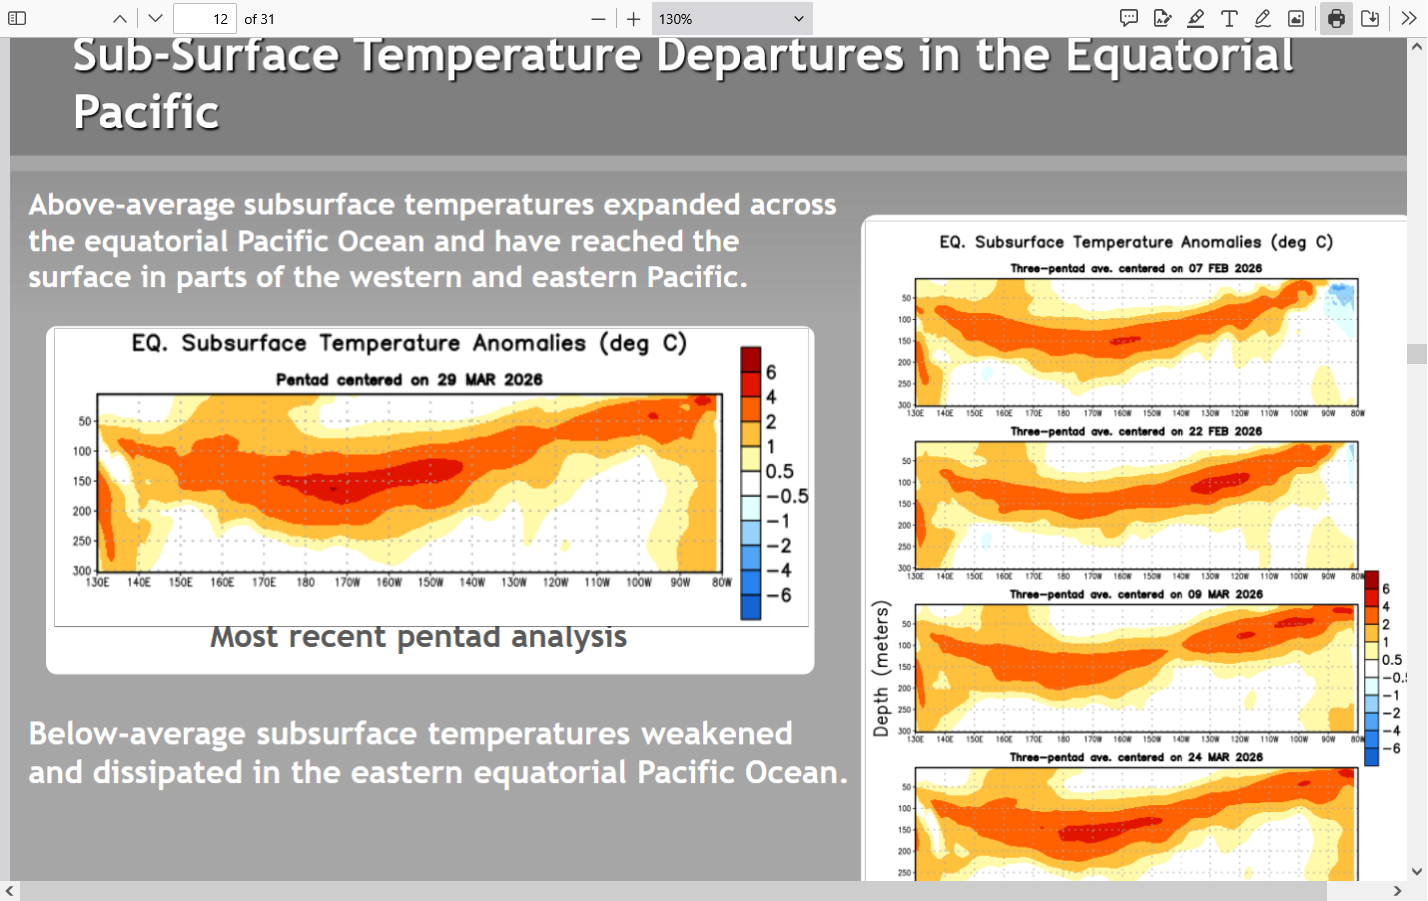
These negative temperature departures from average are NOT going to last. The water has already greatly warmed below and that warmer water should be coming to the surface during the rest of 2026. It's just a matter of time! It’s already happening with gusto!!
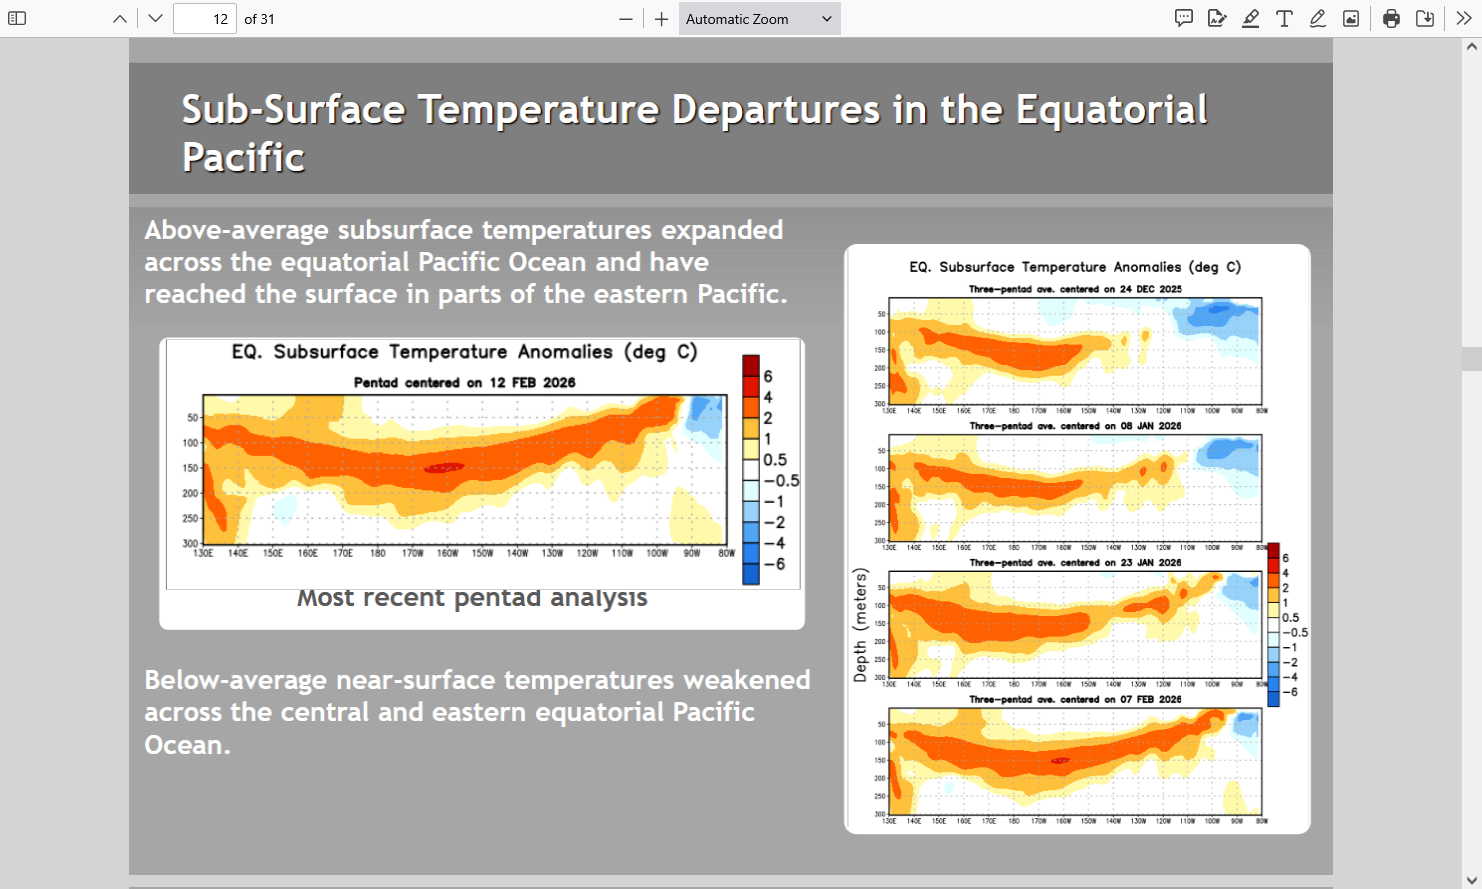
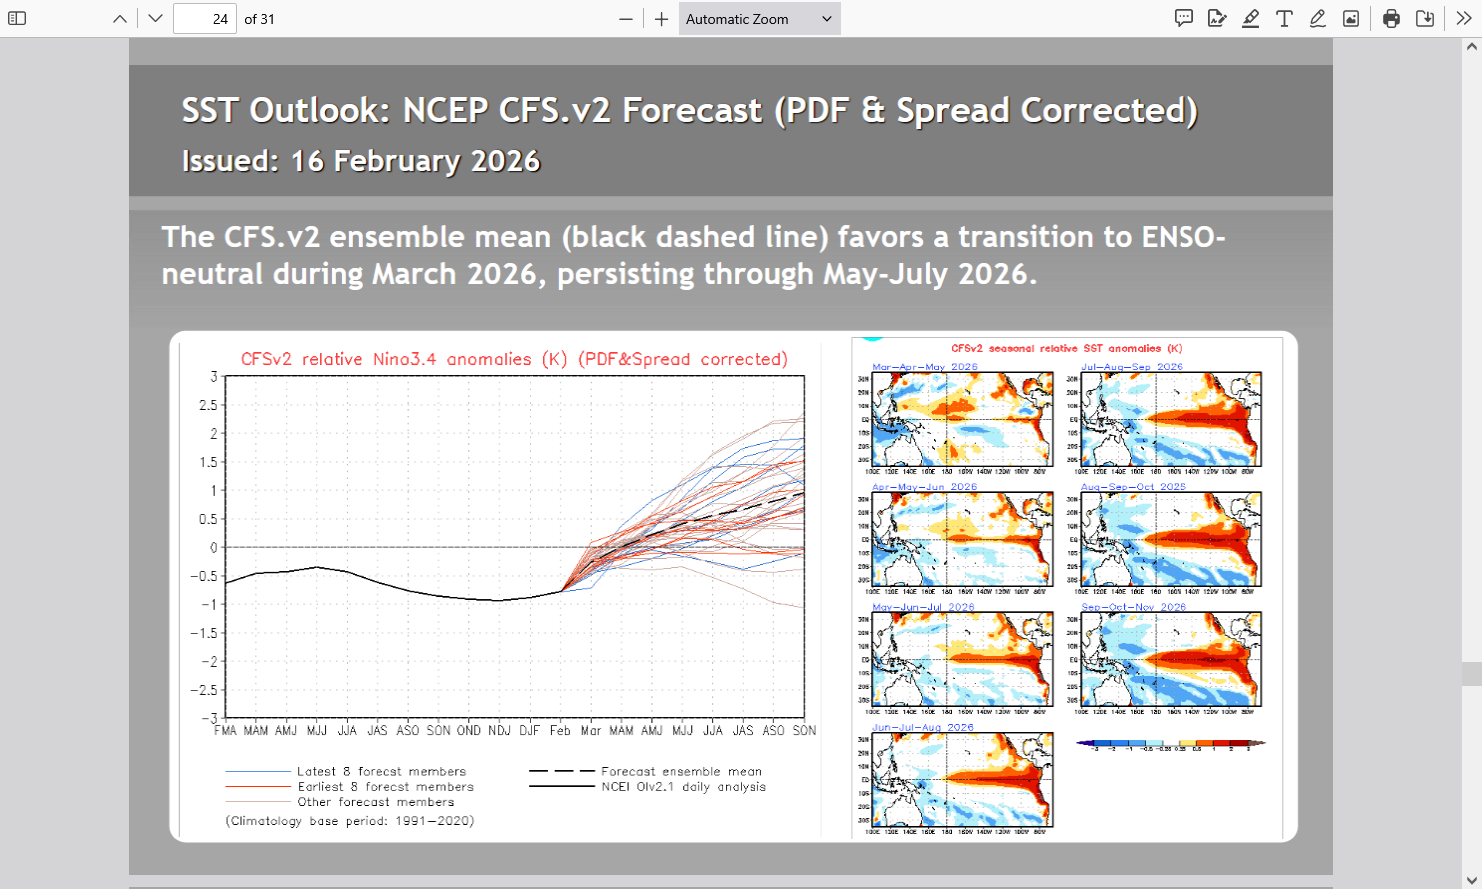
As a result, all the model take us to El Nino conditions.
Here's the thing to always keep in mind. The ENSO phase measurement/metric (La Nina/El Nino) is a 3 MONTH AVERAGE. This is a LAGGING INDICATOR.
The actual ocean/atmosphere will actually be in El Nino conditions for a couple of months BEFORE the average crosses into the El Nino threshold for NOAA to announce the official beginning of the new El Nino!
It would be like them telling us that Winter is here in January, after the 3 month average in temperatures Nov/Dec/Jan crossed low enough to make it Winter.
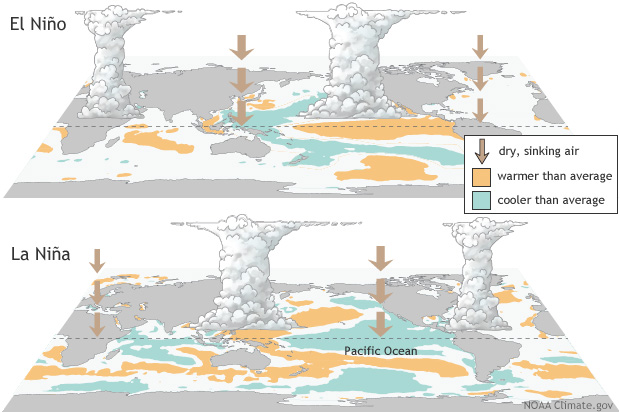
The huge weather pattern change here in February 2026 to much warmer because of the Pacific jet stream suddenly taking over (after the cold/dry pattern for previous months from La Nina) is the El Nino's impact already starting from the rapidly warming east/central tropical Pacific.
That doesn't mean the El Nino will take over like flipping a switch. Lingering impacts from the previous pattern could still persist for brief periods as they get weaker and weaker with the key area of the Pacific getting warmer and warmer. Becoming dominant over everything else.
The big thaw! 2-2-26
https://www.marketforum.com/forum/topic/117703/
Get all the comprehensive weather here:
https://www.marketforum.com/forum/topic/83844/
+++++++++++++++++++++++++
A huge pattern change to much milder is coming, especially in the week 2 part of the forecast!
This below has been the weather pattern the past 2 weeks:
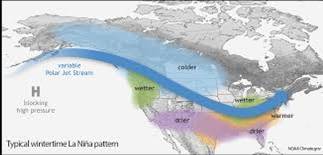
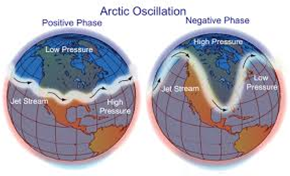
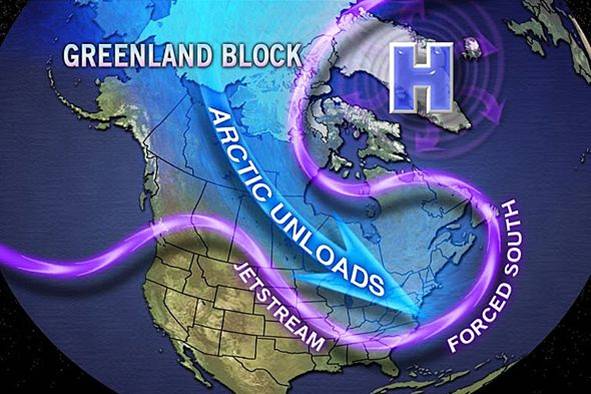
La Nina Winters have more amplified, meridional type flow........from north to south and a Greenland Block is more likely during a La Nina, like we have currently.
The pattern we had recently was an AMPLIFIED version of the La Nina signal depicted below.
https://www.hometownforecastservice.com/2020-2021-winter-outlook/
++++++++++++++
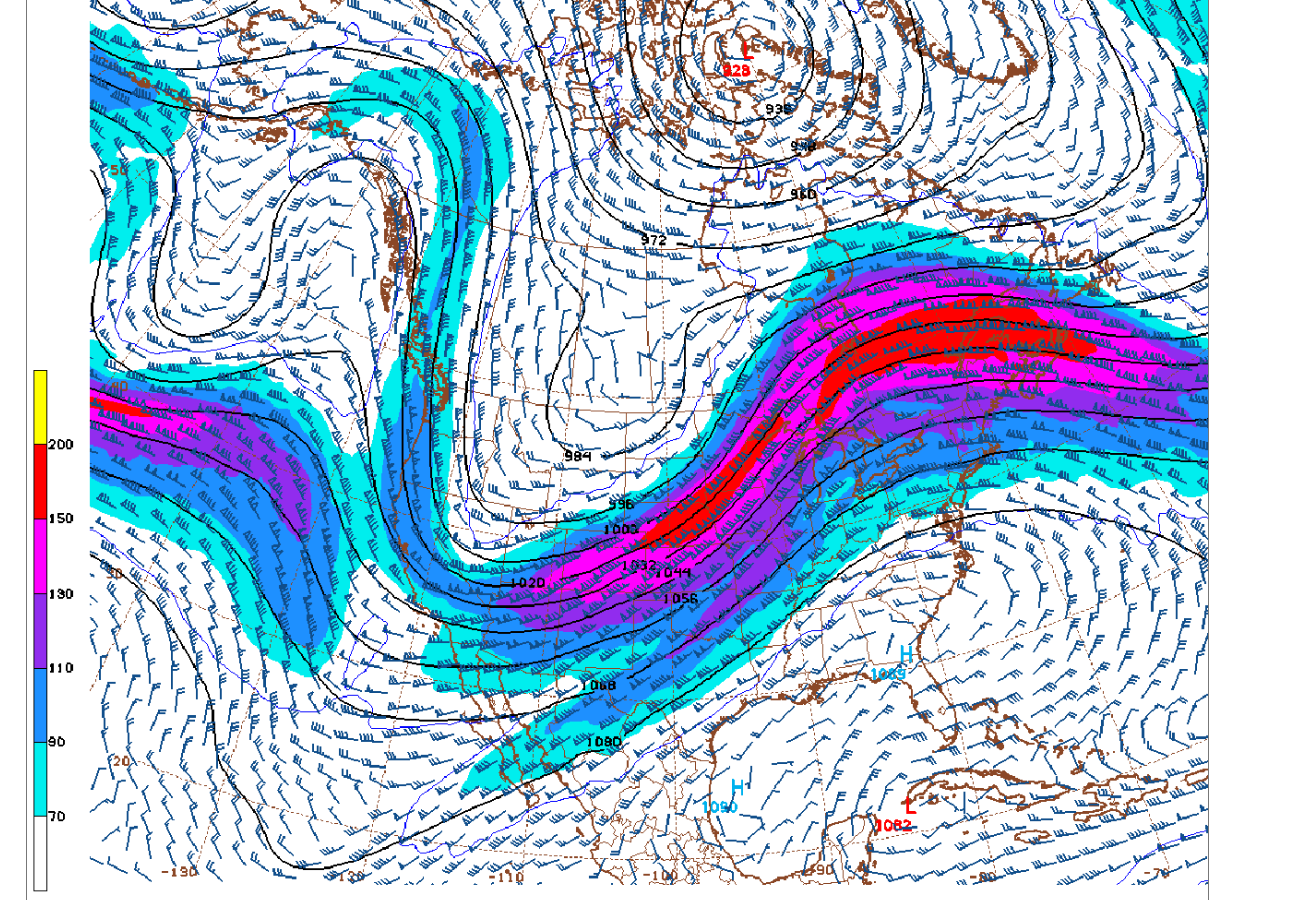
Below is going to be the NEW pattern in 2 weeks. This is the jet stream at 250 mb which is 34,000+ above the ground, up where the commercial jets fly! Note the big upper level ridge building in the East.
The upper level trough in the East RECENTLY will be replaced with this upper level RIDGE. The steering currents there will be from the south, replacing the flow that had been coming from Siberia, with cross polar flow, thru Canada, then plunging deeply into the United States, all the way to the Gulf of Mexico as depicted on the map above.
https://mag.ncep.noaa.gov/Image.php
++++++++++
2-17-26: This La Nina has weakened the fastest ever with Pacific water temperatures really warming fast now. We should assume that means El Nino conditions and analogs should be adjusted accordingly. For instance, the current forecast for El Nino by late Summer should be MOVED UP. In fact, considering the lag time issue mentioned above, I would move up the El Nino impact to THIS SPRING with regards to real world, empirical data based weather condition analogs.
Past analogs don't always guarantee the future outcome. They only increase the odds. The complete opposite can happen because of something different, unrelated to the previous main forcing mechanism that caused the analog to happen interferes with or even becomes more dominant.
The same conditions as the analog can happen.................but cause the large scale features to shift/ be deflected by XXX miles from a new force that wasn't there before. That shift, for many locations might completely flip the impact of the El Nino to the opposite impact it had in the analog years.
Yes, it happens all the time and this is long range forecasting that has low skill. However, the United States is close enough to the source region of this main forcing agent/mechanism (east/central tropical Pacific) so the the El Nino impact is pretty direct. As opposed to Europe or Asia.
I'll have some good analogs later today with verbiage to adjust them based on how quickly this El Nino is coming on.
The dry soils currently wide spread are a result of the La Niña from last Summer to last month.
This pattern is DEAD!
The new pattern will feature a rapidly developing El Niño.
I will speculate that the atmosphere could be in early El Niño mode already this Spring, responding quickly to positive temperature anomalies by that time.
Re: Re: Re: Re: Re: Weather May 2022
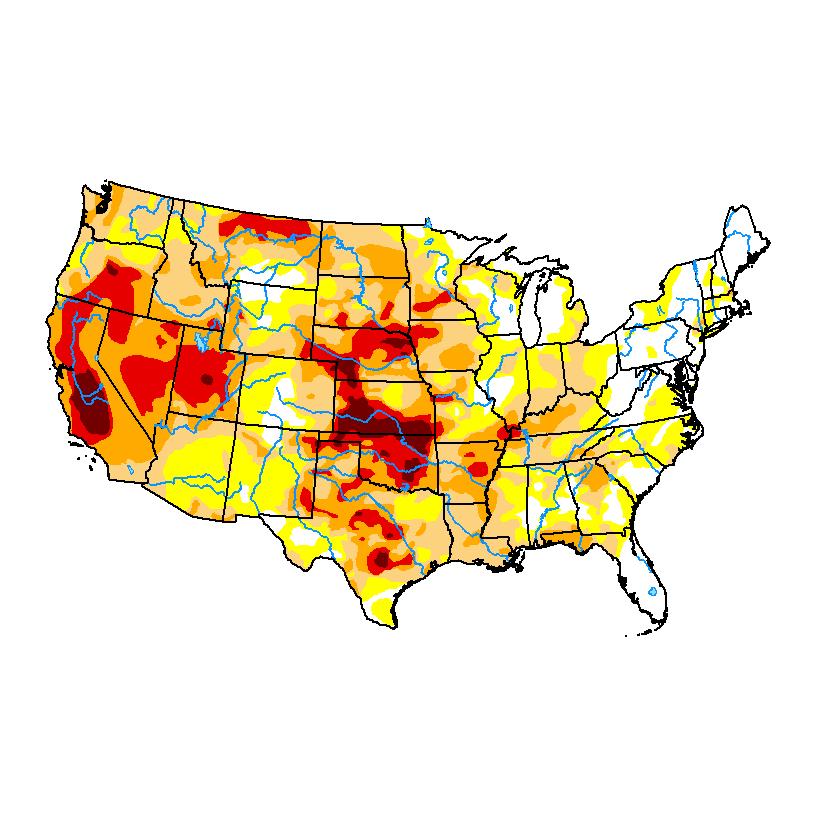
Soilmoisture anomaly:
These maps sometimes take a day to catch up to incorporate the latest data(the bottom map is only updated once a week).
https://www.cpc.ncep.noaa.gov/products/Soilmst_Monitoring/US/Soilmst/Soilmst.shtml#
![]()

++++++++++++++++++++++++++++
Updated daily below:
https://mrcc.purdue.edu/cliwatch/watch.htm#curMonths
Support for all MRCC-hosted products and services is currently suspended as of April 17, 2025, due to a lapse in federal funding from the Department of Commerce through NOAA.

NEW LINK:
https://www.drought.gov/current-conditions
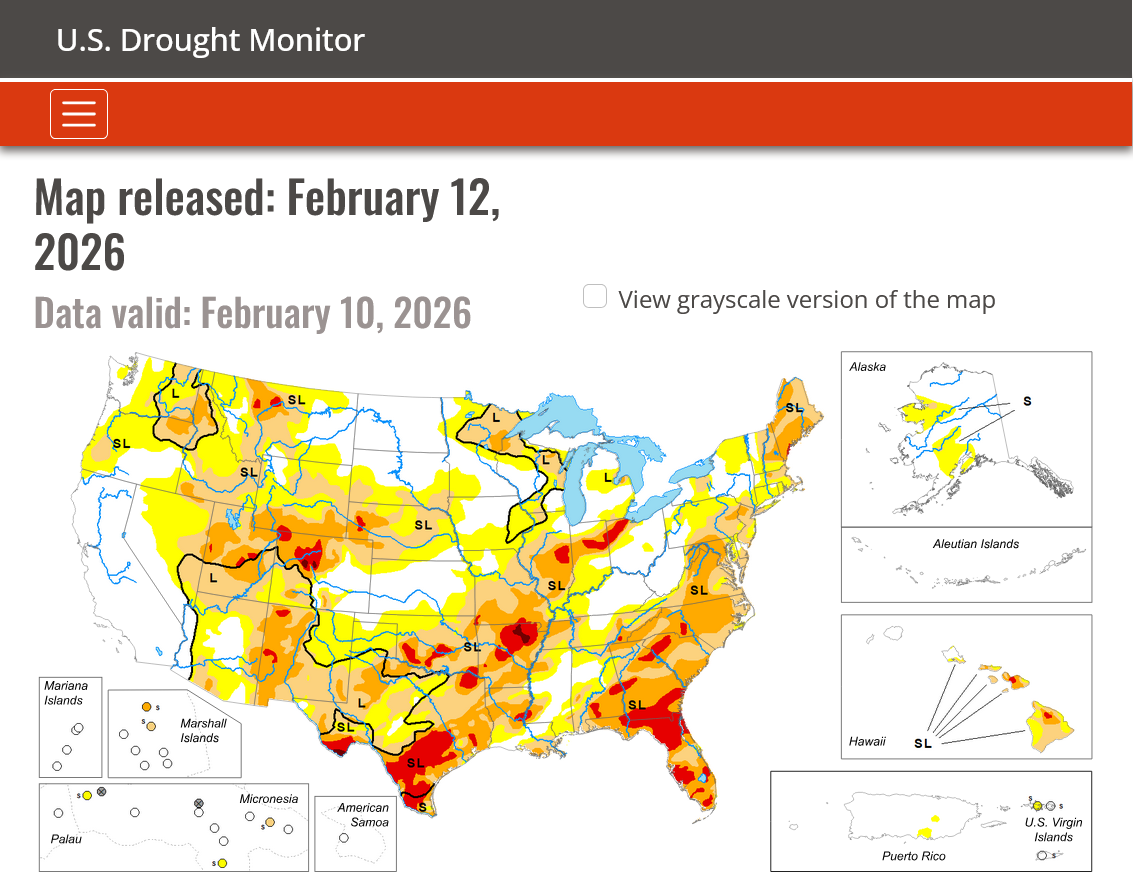
Thru February 10, 2026
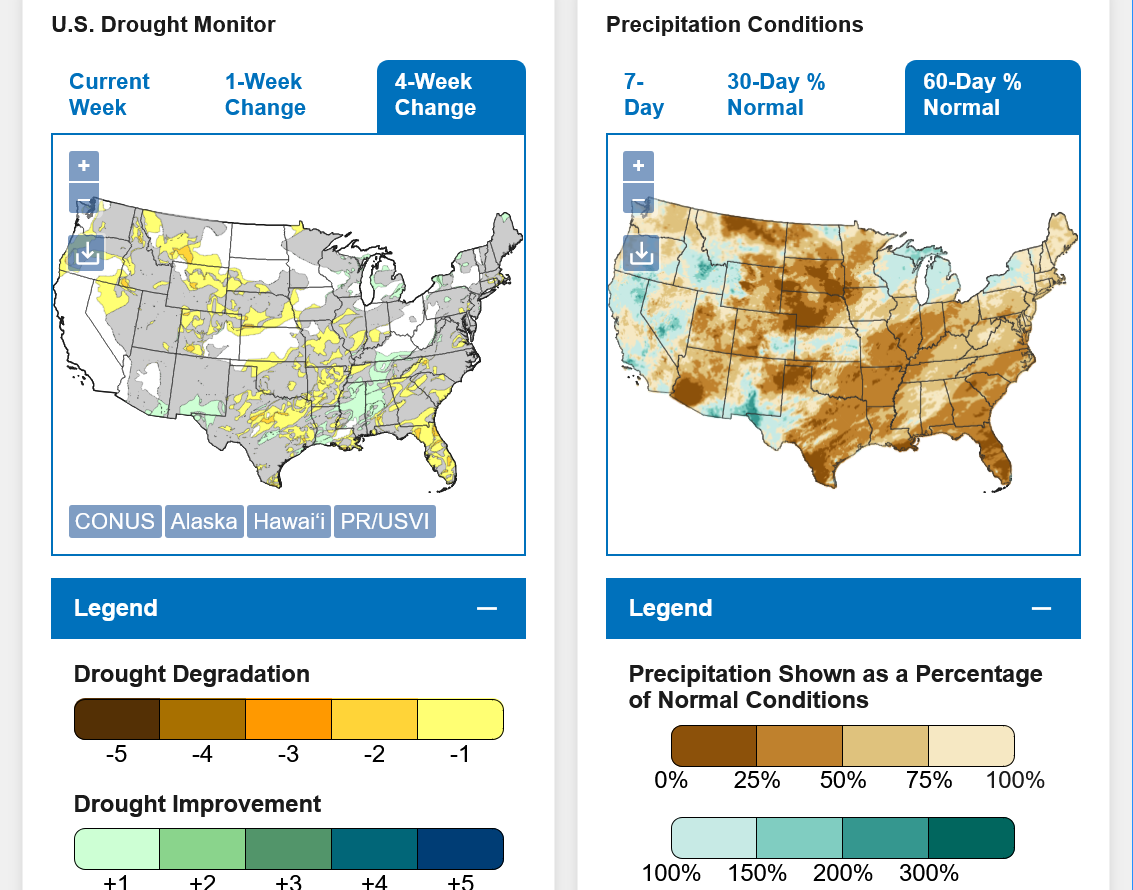
DROUGHT MONITOR
https://droughtmonitor.unl.edu/
Drought expanding this Winter from Southern Plains, northeastward.
7 Day Total precipitation below:
http://www.wpc.ncep.noaa.govcdx /qpf/p168i.gif?1530796126

Published August 24, 2023
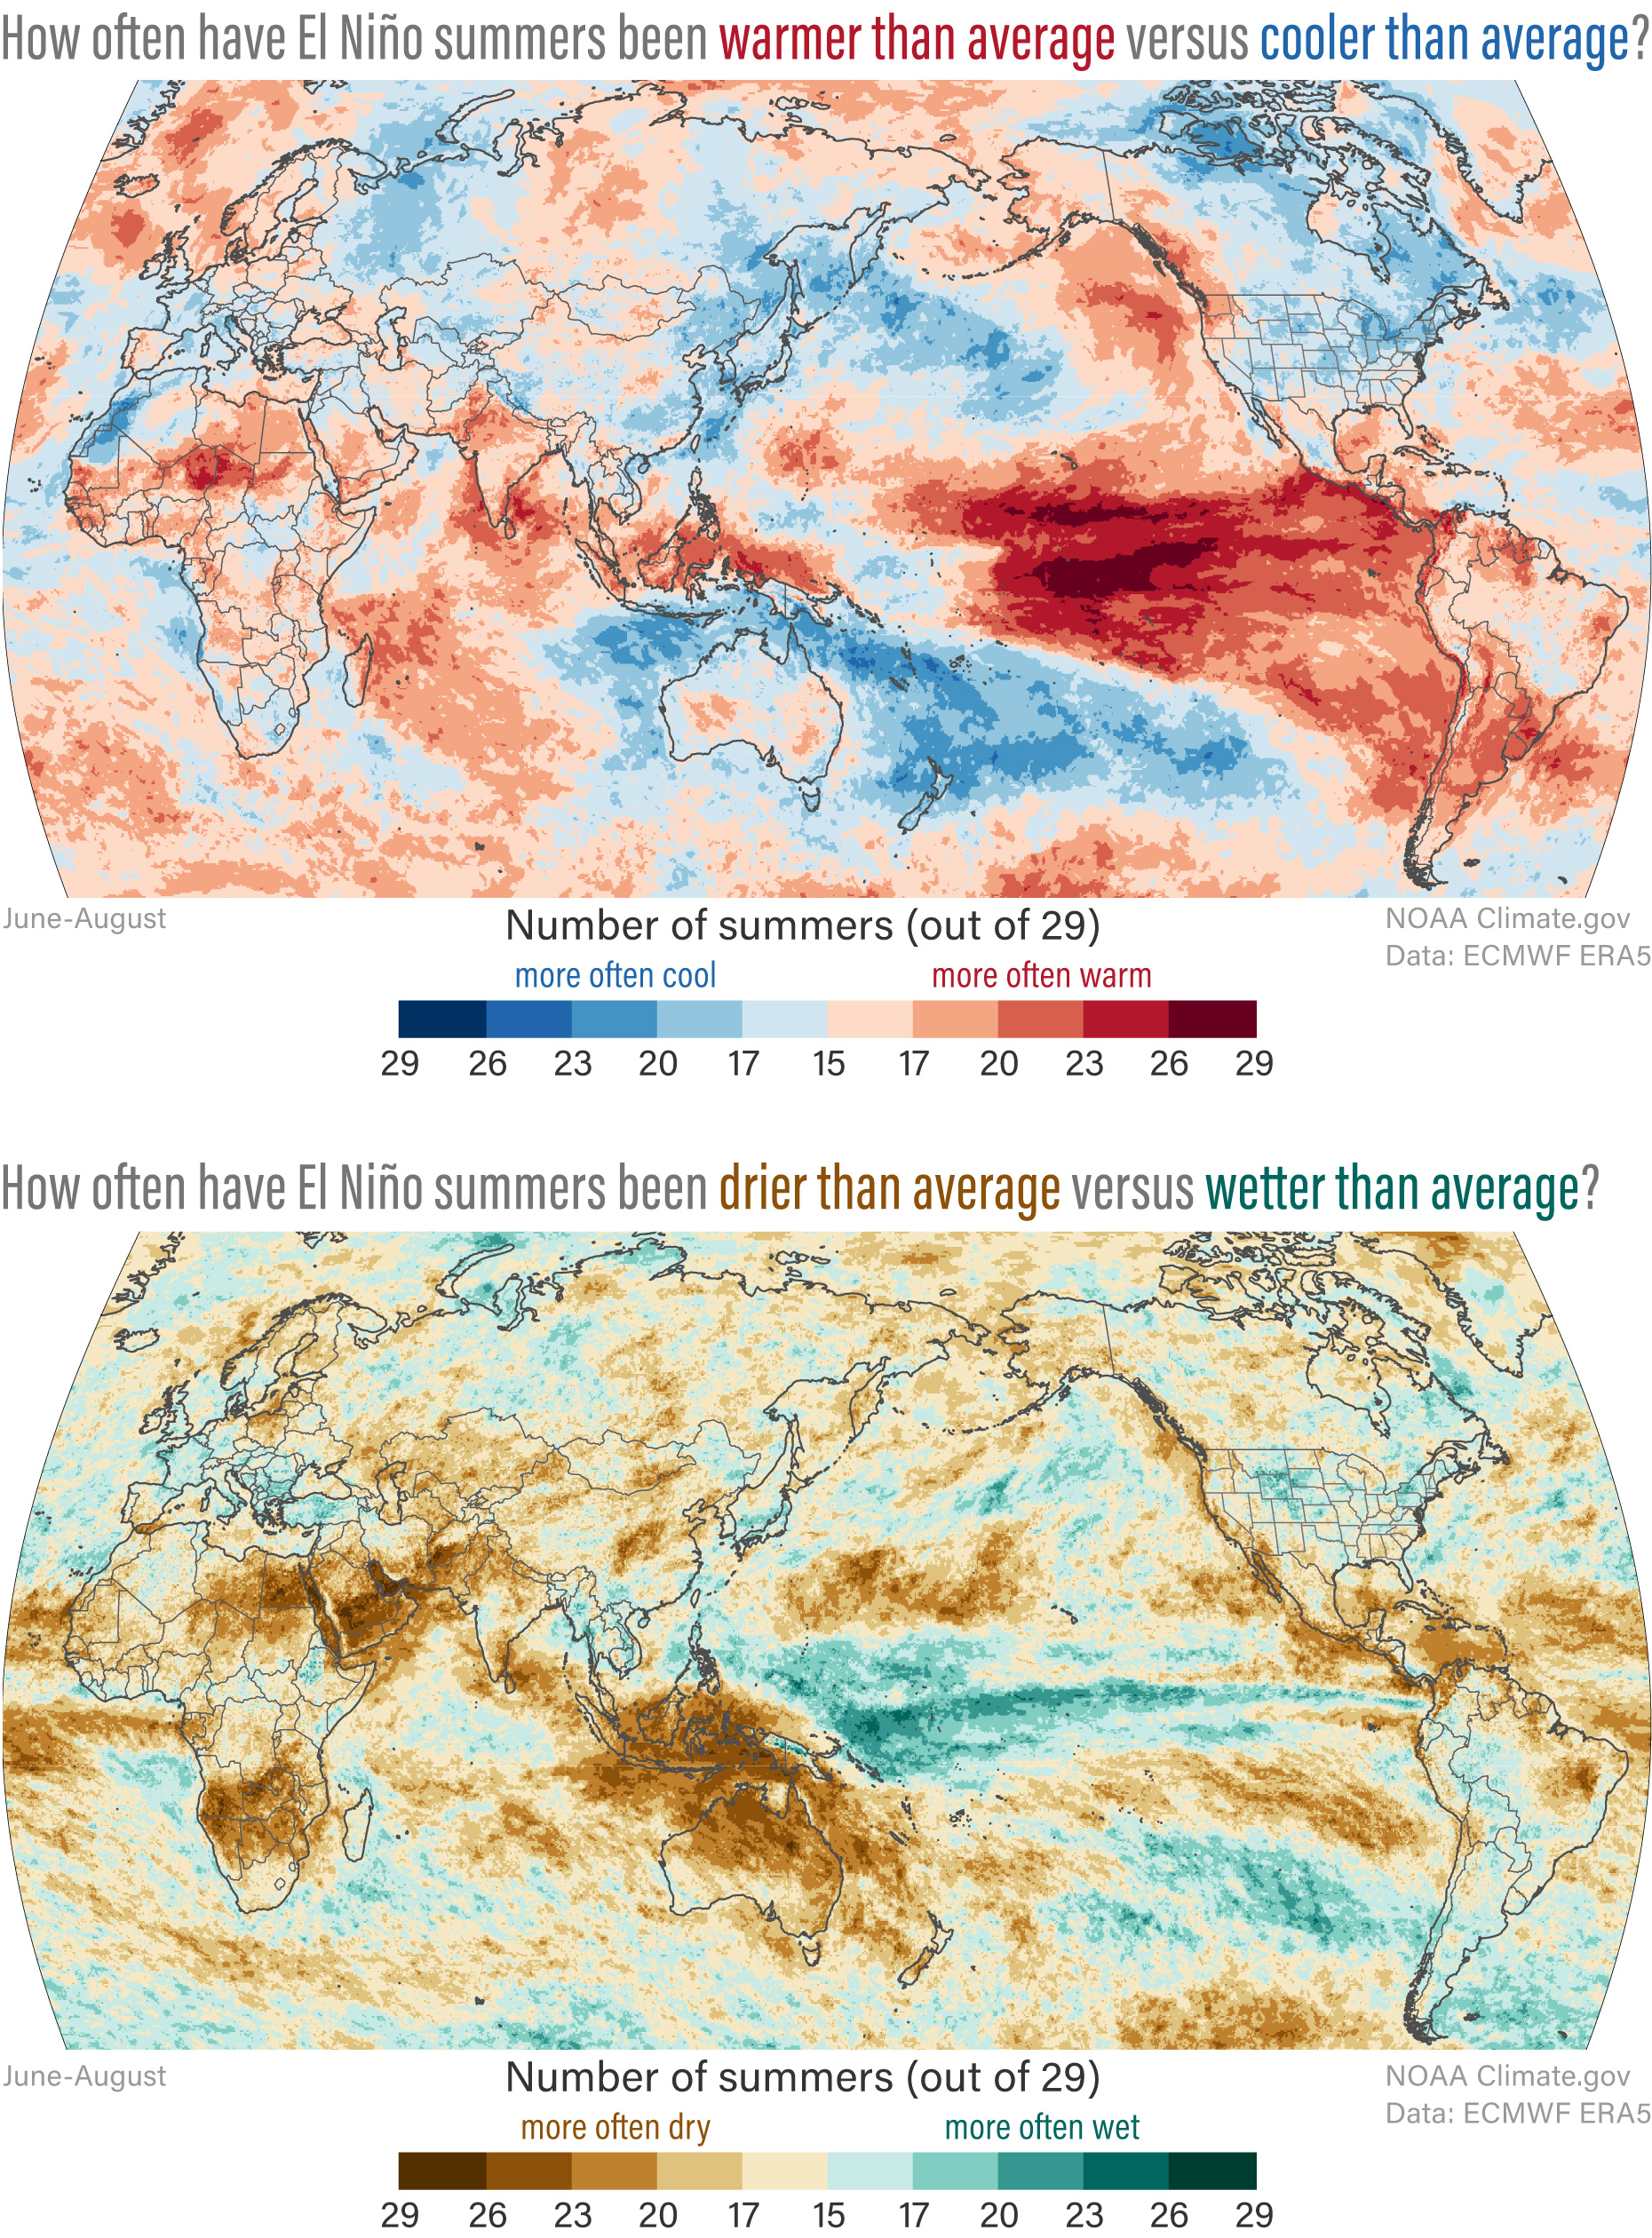
Since this El Nino is coming on faster than any previous one, we have to assume that the upcoming Summer will be greatly impacted by El Nino.
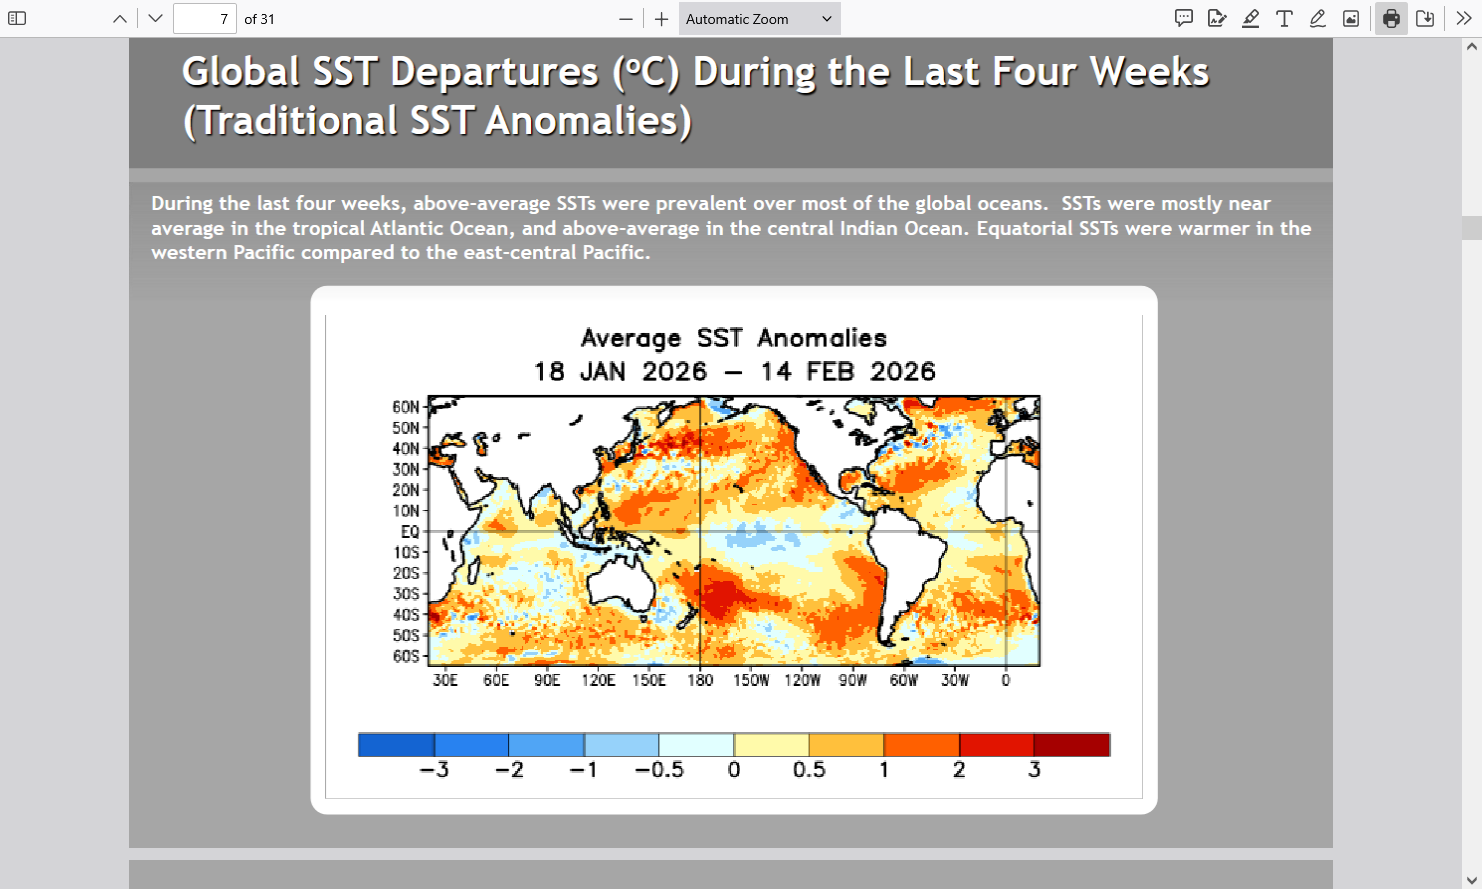
The images above give us the picture worth 1,000 words.
Odds are elevated this year for favorable growing conditions.
Update: Before we grow the crop, we need to get it planted/well emerged. I'm increasingly concerned that the blockbuster El Nino will cause excessive rains downstream in parts of the US before that happens.
Weather forecaster David Schlotthauer talks possible “super” El Niño heading to the Pacific Ocean this fall; what does that mean for surfers?
https://www.surfer.com/news/super-el-nino-2026-weather-expert-warning
I love this guy's comprehensive analysis and explanations!
This one is 3 weeks old and his temperature forecast for February is busting bad(not nearly warm enough). Regardless he still has some good explanations on how things work and what is probably coming up.
By Author Andrej Flis
I have high confidence (for a longer range forecast) that this rapidly developing El Nino will already be impacting the weather in the US early in the growing season.
https://iri.columbia.edu/our-expertise/climate/forecasts/enso/current/
+++++++++++++
https://iri.columbia.edu/our-expertise/climate/forecasts/enso/current/?enso_tab=enso-sst_table
| Season | La Niña | Neutral | El Niño |
|---|---|---|---|
| FMA | 4 | 96 | 0 |
| MAM | 1 | 90 | 9 |
| AMJ | 0 | 65 | 35 |
| MJJ | 1 | 41 | 58 |
| JJA | 3 | 39 | 58 |
| JAS | 4 | 35 | 61 |
| ASO | 6 | 33 | 61 |
| SON | 9 | 33 | 58 |
| OND | 10 | 30 | 60 |
Note above that the MAJORITY of models(58%) predict an El Nino by May/June/July, which means El Nino will be in place already by Spring and the entire Summer(June/July/August) will feature an El Nino.
This is my forecast right now, in fact, El Nino by AMJ is possible.
Soil moisture is low across large portions of the Cornbelt. The planting season isn't going to really get going until early April. Dry soils/weather early on is good for accelerating/advanced planting. However, this year could feature an elevated threat of beneficial, soil recharging rains that keep producers out of the fields BEFORE the planting season is over.
This is at a distant time frame that has LOW skill and during a transition to the El Nino so so rainfall forecast for this Spring is very low confidence.
Dry soils are a bigger impact on weather forecasts in Summer(when weather systems use some of that moisture and wet soils help suppress temperatures) , especially late Summer. Less impactful in the Spring.
Update: Before we grow the crop, we need to get it planted/well emerged. I'm increasingly concerned that the blockbuster El Nino will cause excessive rains downstream in parts of the US before that happens.
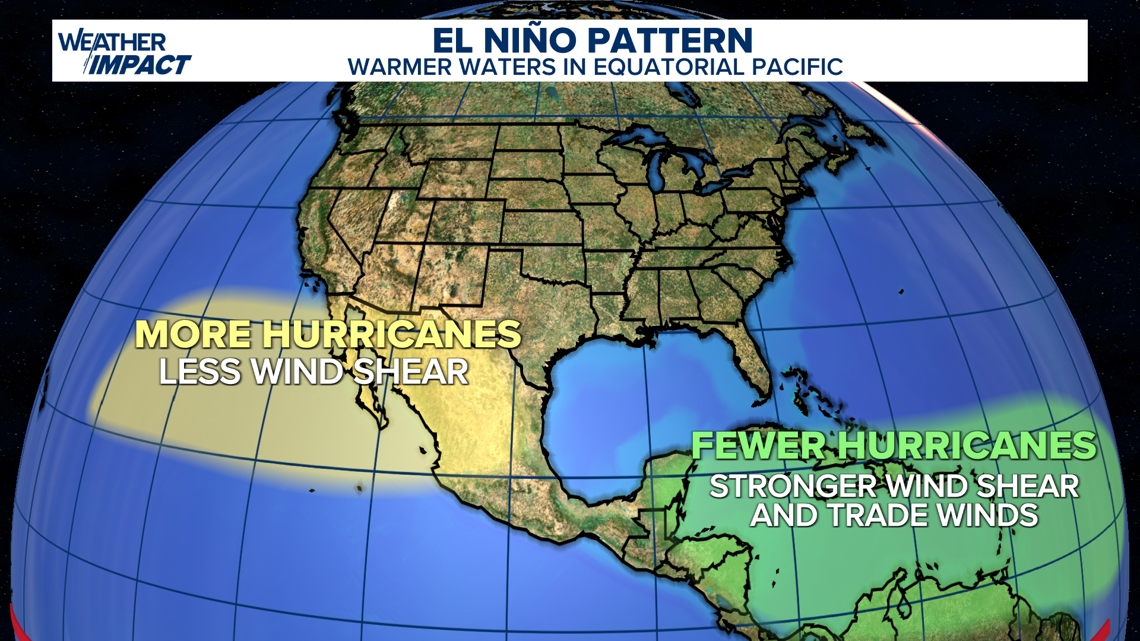
El Nino's tend to reduce Atlantic basin hurricanes because of the increased wind shear.
https://www.climate.gov/news-features/blogs/enso/impacts-el-nino-and-la-nina-hurricane-season

Extended Range Forecast for North
Atlantic Hurricane Activity in 2026
Issued: 11th December 2025
https://www.tropicalstormrisk.com/docs/TSRATLForecastDecember2026.pdf
https://www.trackthetropics.com/
++++++++
March is a little more certain that Baby Boy is coming.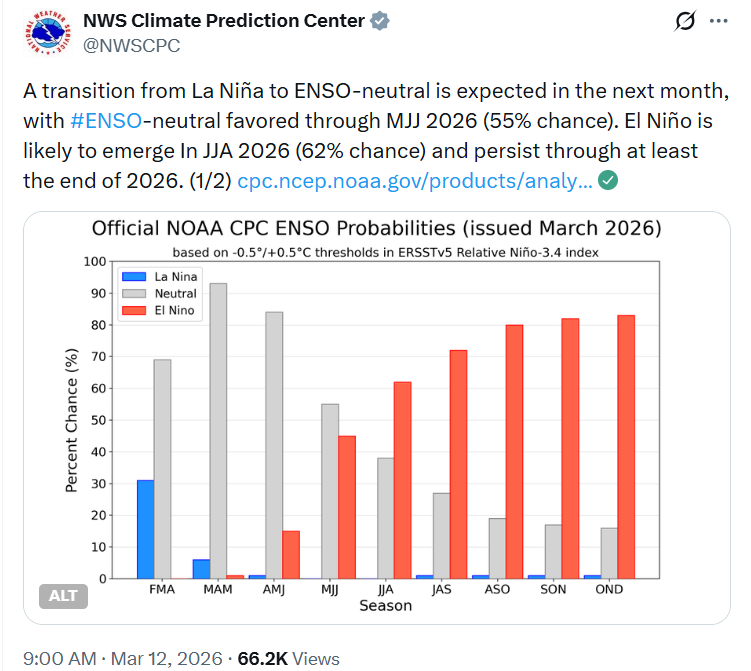
Thanks, Patrick!
Now you're speaking my language
Thanks very much for reminding me that I've been neglecting this important topic the past week.
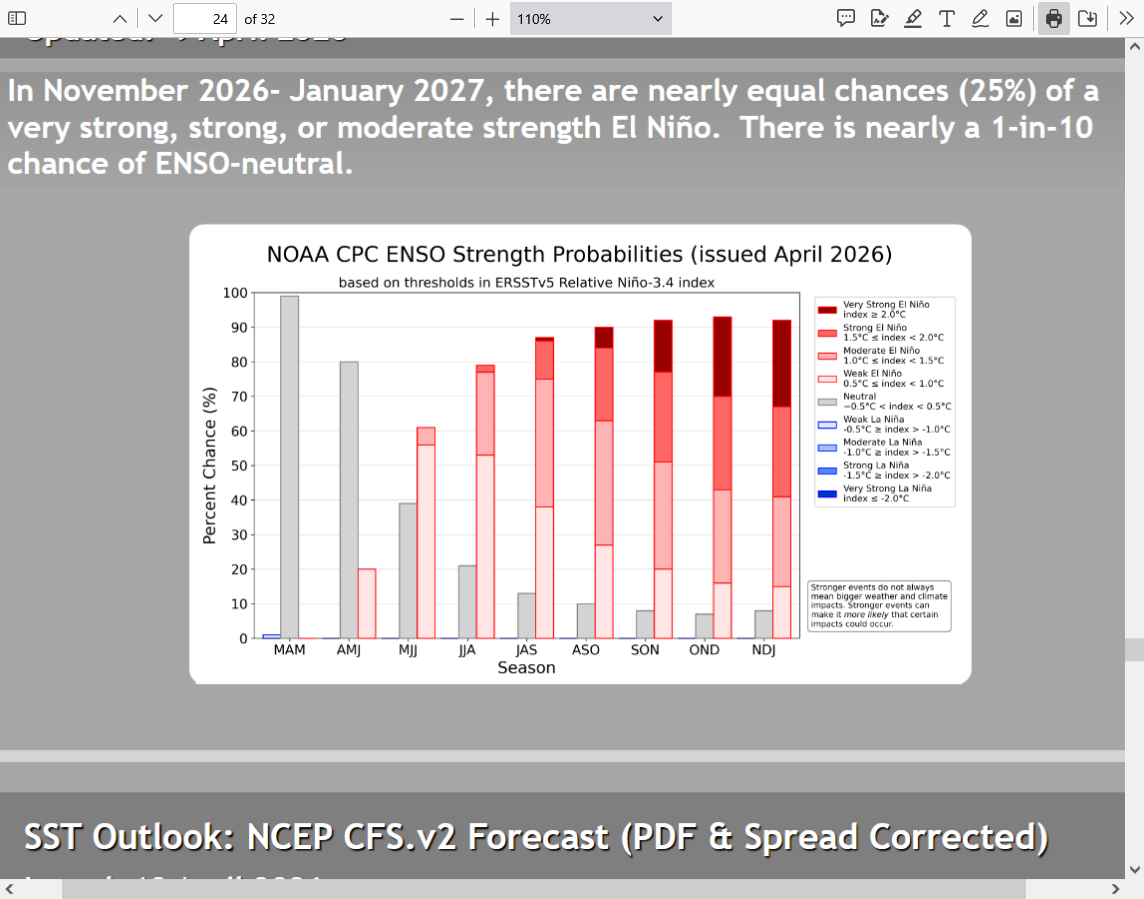
And as I explained earlier, the "official" El Nino is a lagging indicator because its a 3 month average.
The real world El Nino will start impacting the atmosphere BEFORE we are told it's an El Nino.
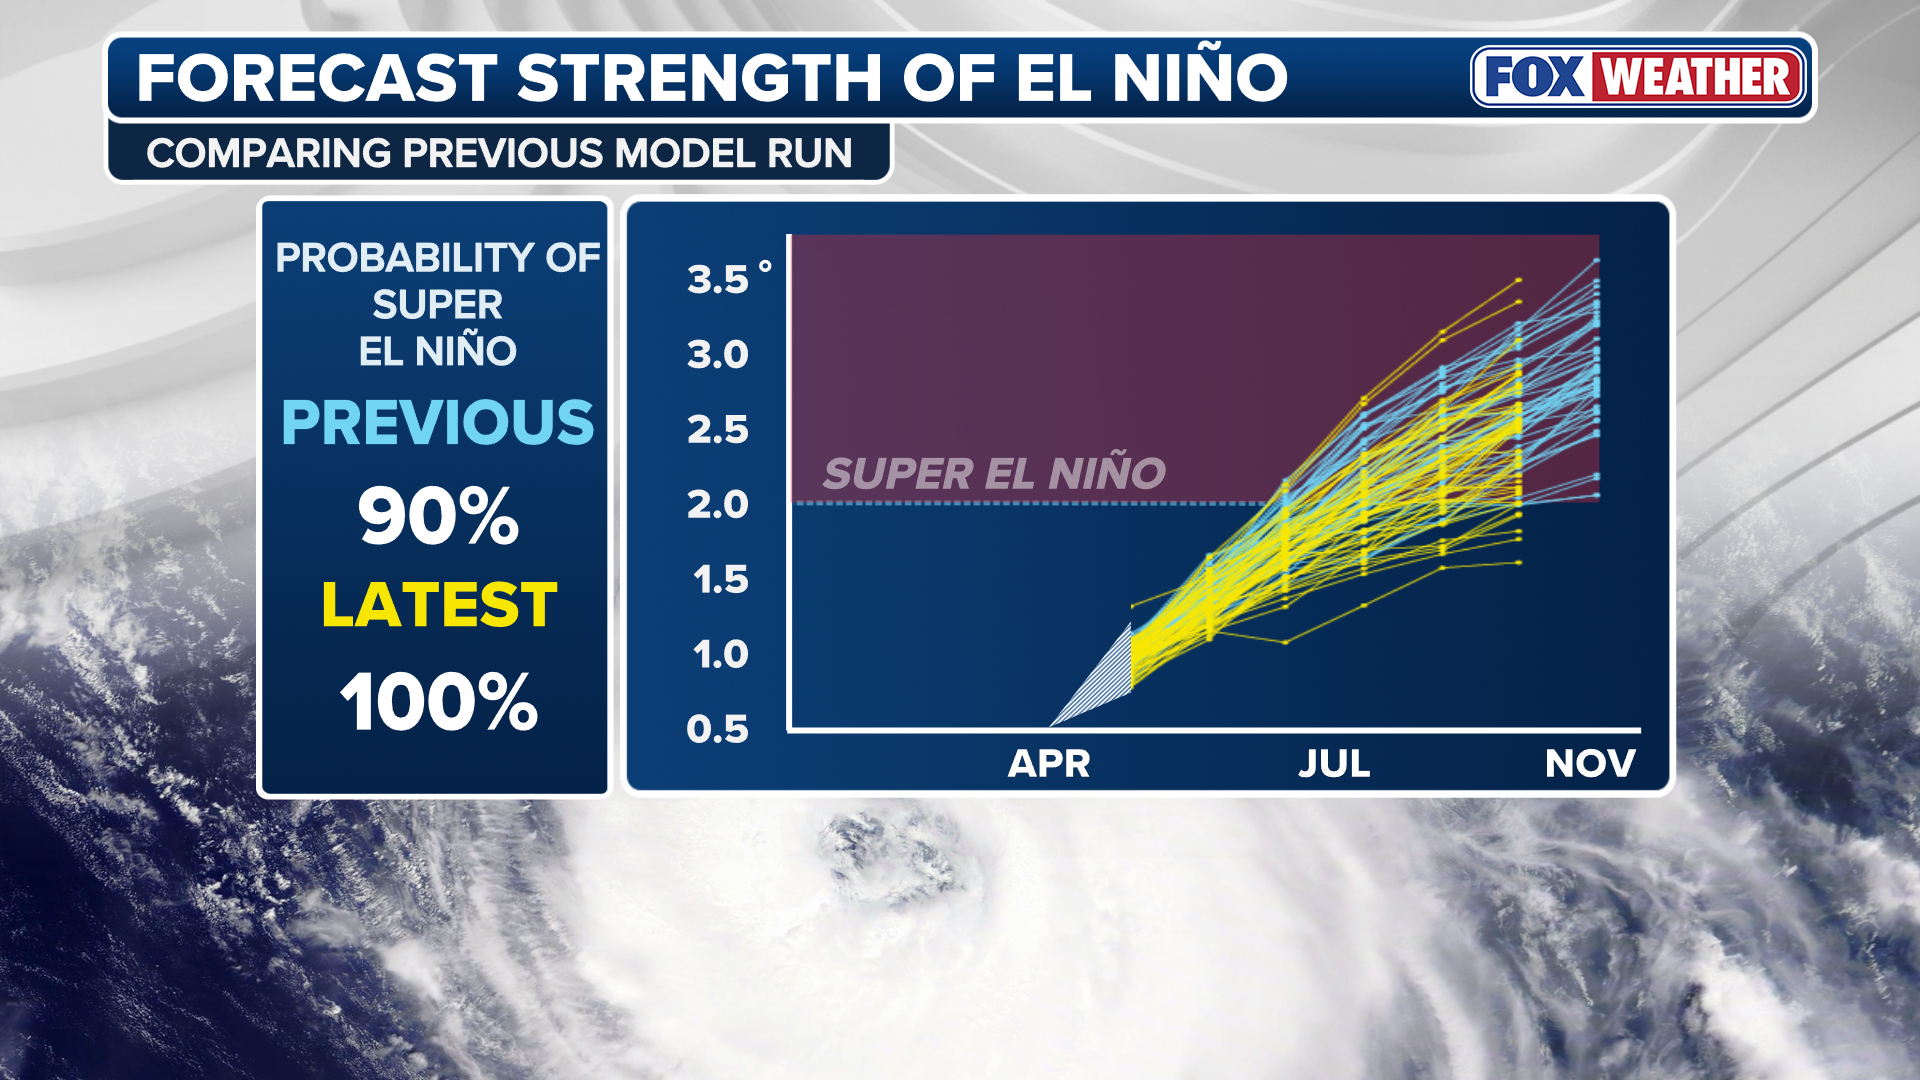
However, the initial impact will only be for weak conditions that amplifies (probabilities) with time this year as your great bar chart shows.
As you probably already know, the modest global cooling from the recent La Nina's will flip to modest global warming that will ADD to the greenhouse gas warming(from humans burning fossil fuels) which will likely result in global temperatures going back up again.
https://www.marketforum.com/forum/topic/118356/
Global temperature update for February 2026
Started by metmike - March 3, 2026, 12:23 p.m.
The Version 6.1 global average lower tropospheric temperature (LT) anomaly for February, 2026 was +0.39 deg. C departure from the 1991-2020 mean, up a little from the January, 2026 value of +0.35 deg. C.
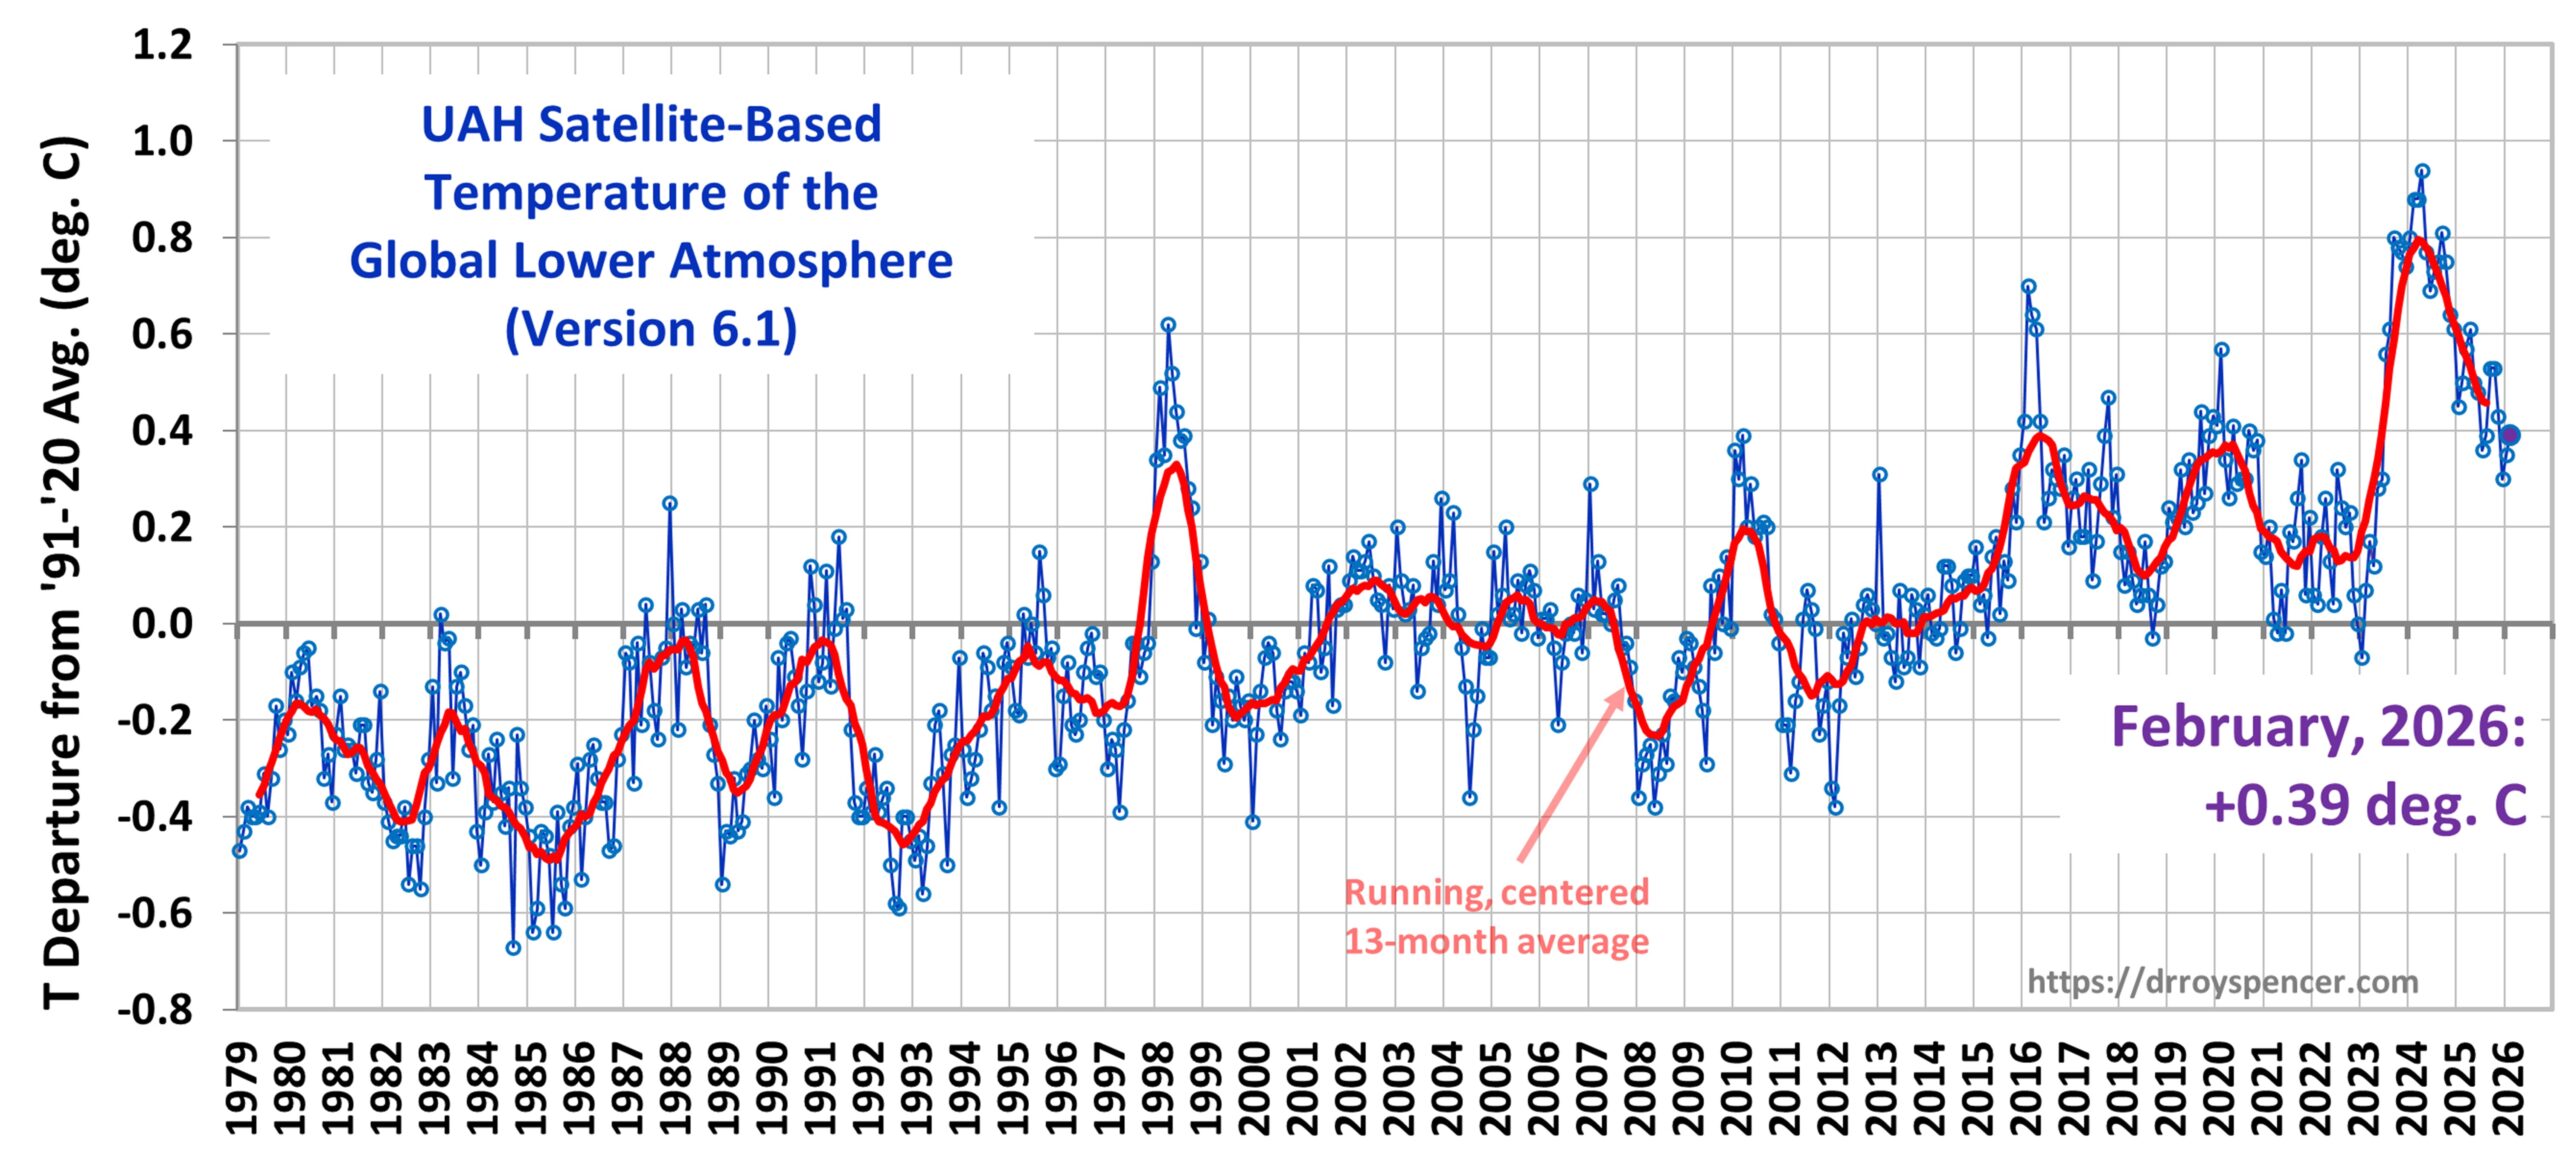
The Version 6.1 global area-averaged linear temperature trend (January 1979 through February 2026) remains at +0.16 deg/ C/decade (+0.22 C/decade over land, +0.13 C/decade over oceans).
+++++++++++++++
We should note that the drop in global temperatures the past year is likely connected to the almost dead La Nina(cool temp anomalies in the Eastcentral tropical Pacific).
We are rapidly warming temps at that location and should be in El Nino mode this Summer. This will likely assist with the greenhouse gas warming from CO2 and cause global temperatures to go back up.
Maybe not new record highs for awhile but the expectation (from me) is that the global temperature anomaly will be HIGHER a year from now.
By patrick - March 24, 2026, 2:07 p.m.
Mud time in New England, despite the long term drought. Not so much in the South-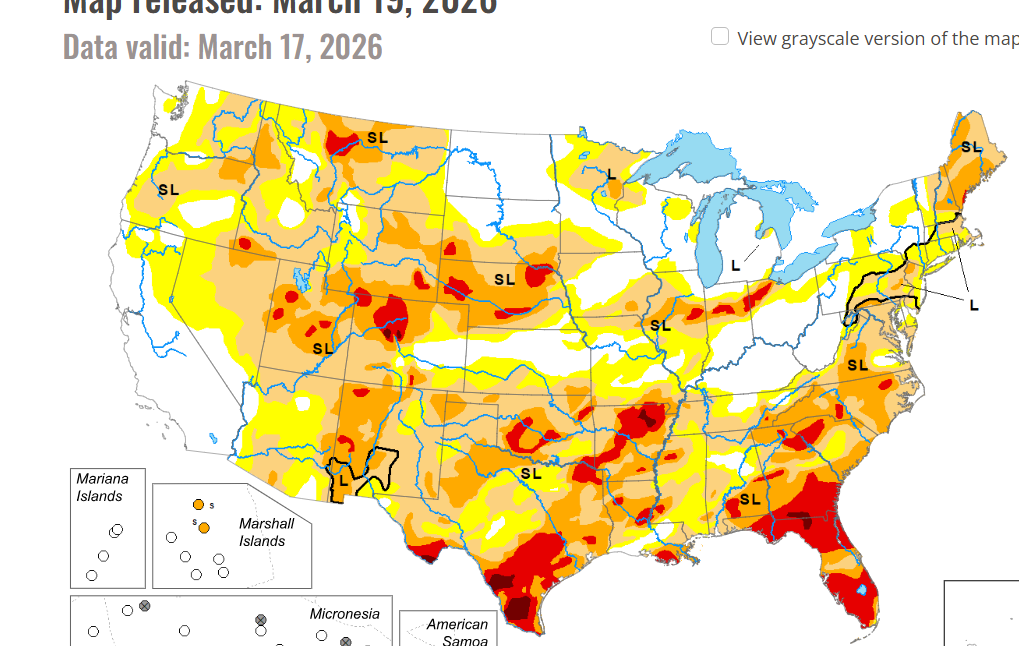
Just to note, the reservoir is 9' below normal.
The road there, otoh..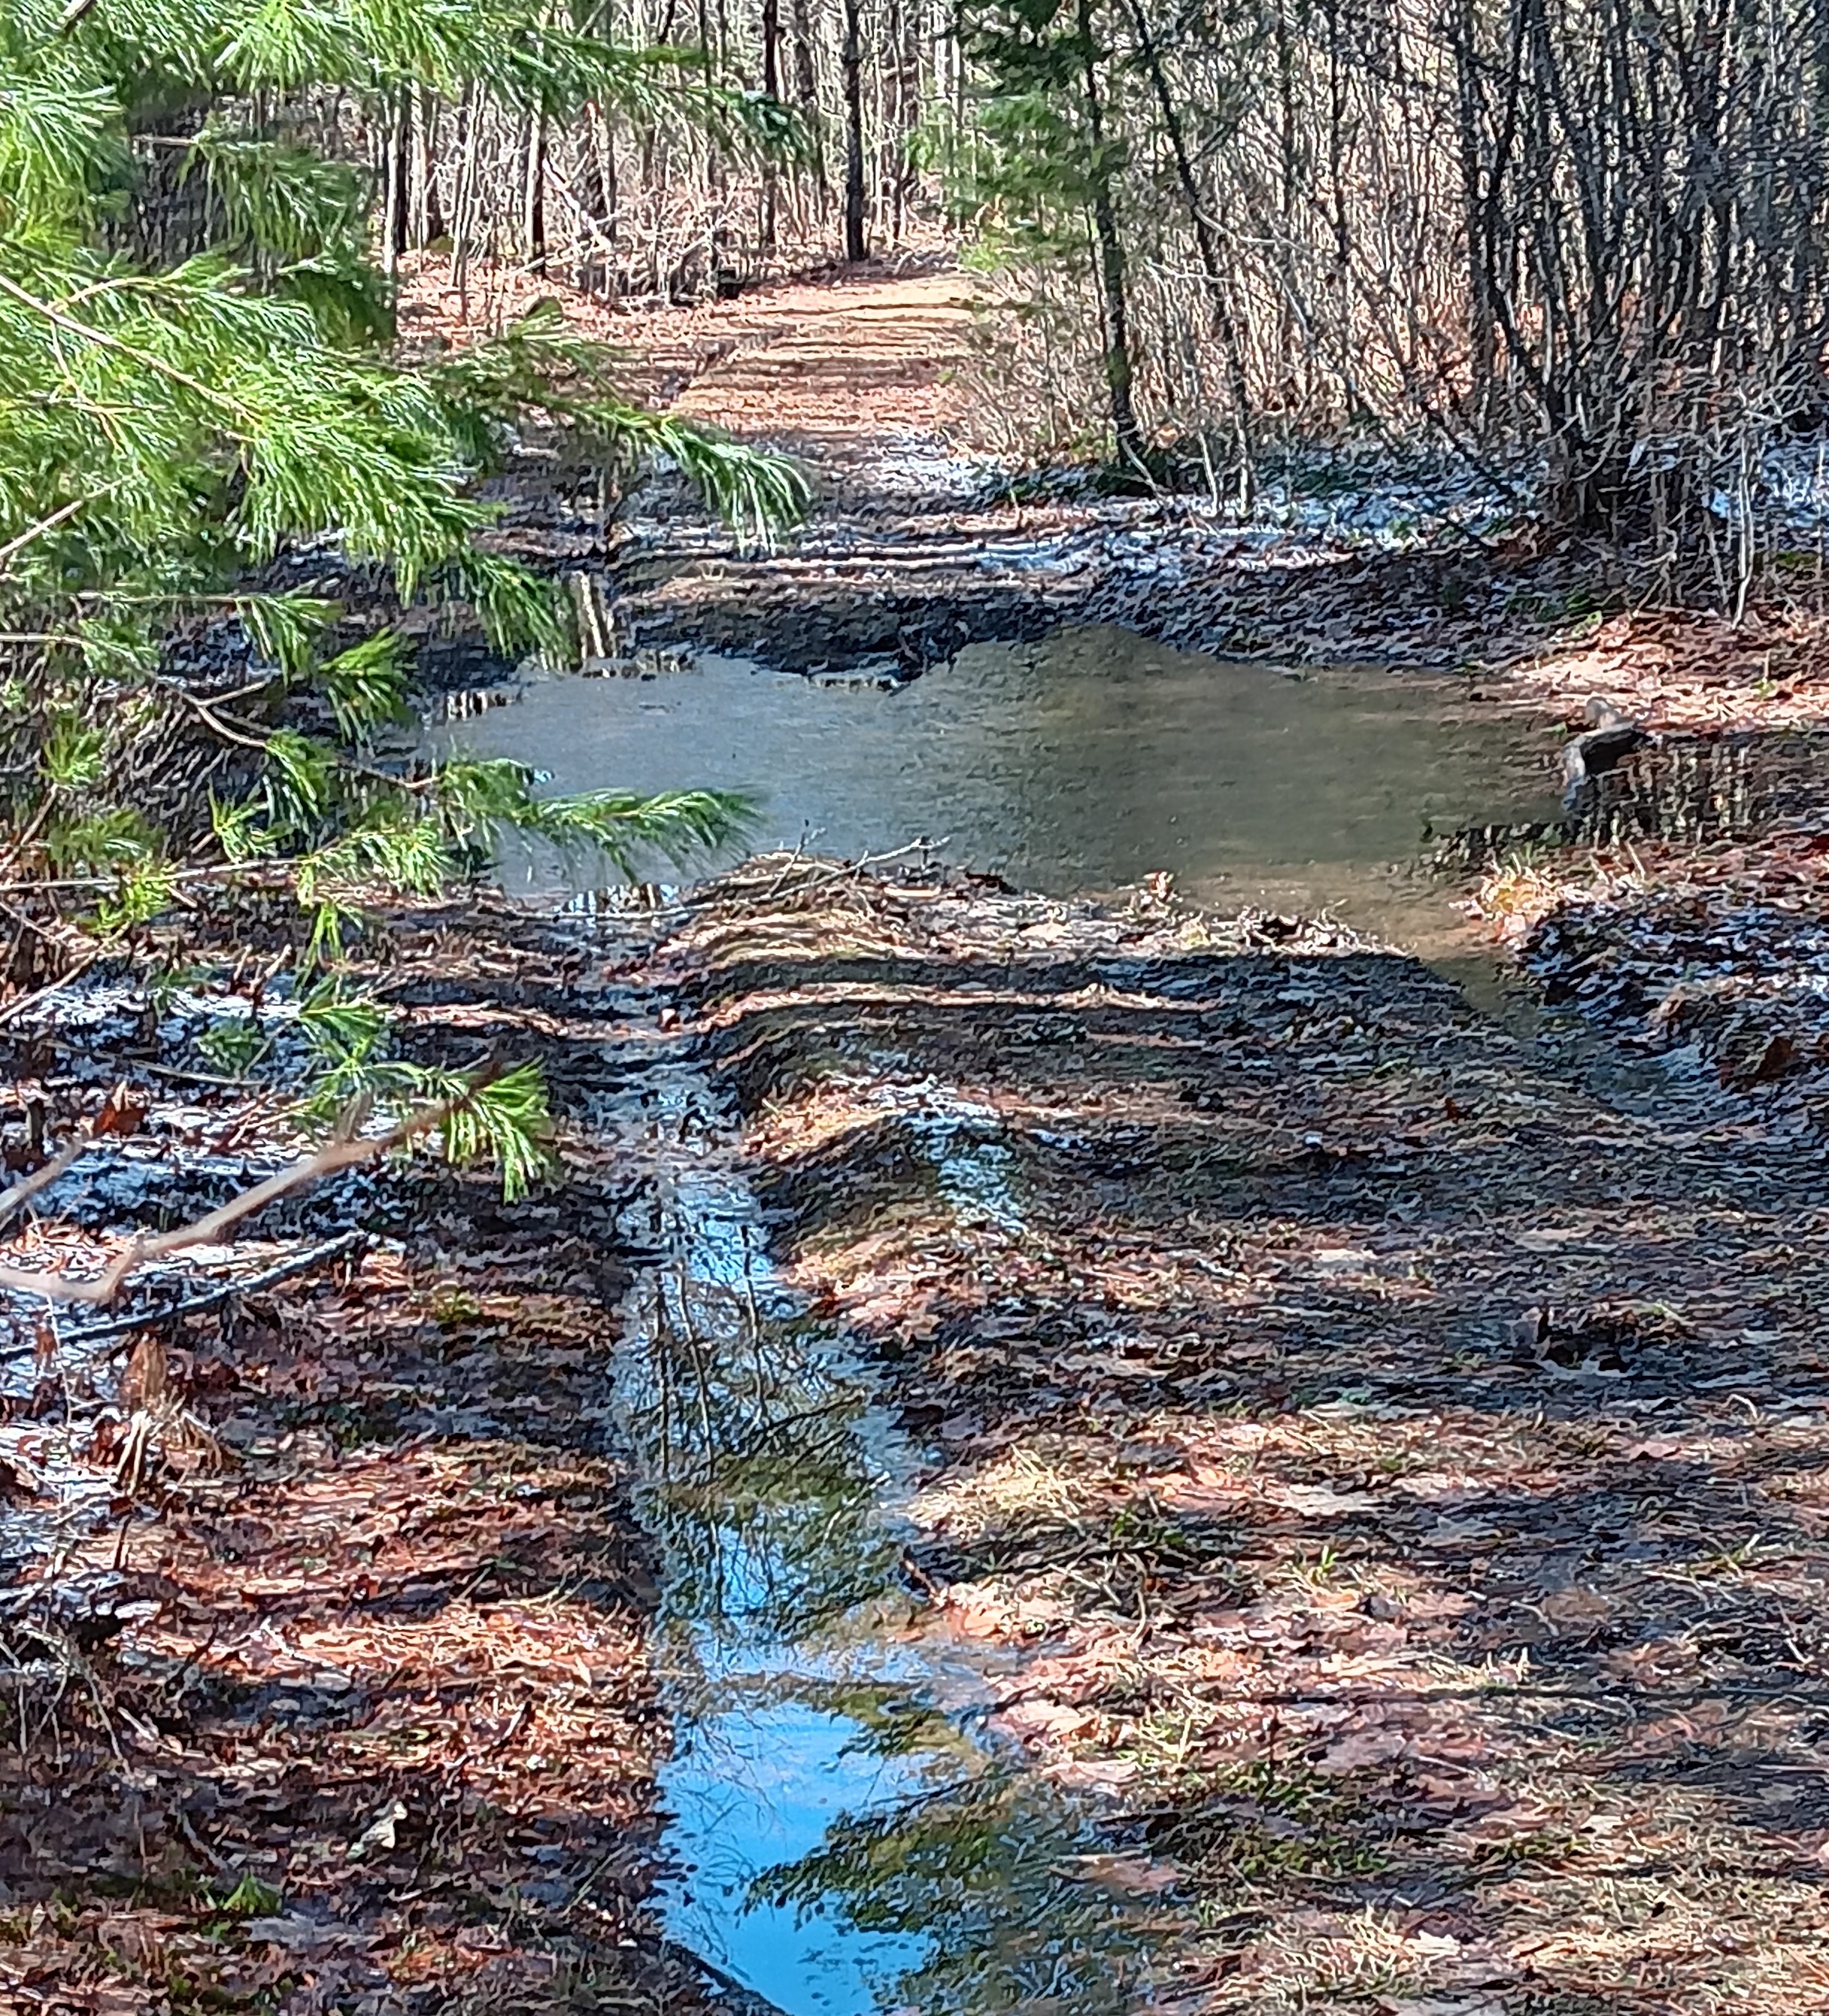
Hopefully the El Nino will replenish it with rains/water like it often does.
Thanks very much, Patrick!
I updated our drought page with that last week of data thanks to you.
https://www.marketforum.com/forum/topic/83844/#83853
We'll be tracking this drought week by week, very closely as we get into the growing season.
Each year is different but El Nino's (from a warmer eastern Pacific tropical ocean) greatly increases chances for decent rains.
From that page:
DROUGHT MONITOR NOVEMBER 1, 2022-After a long lived La Nina-BEFORE EL NINO wiped out much of the drought OUT WEST the Winter of 2022/23!
Contribution to the current drought in the eastern 2/3rd of the country from climate change? Negligible. The natural La Nina(which is colder water and actually the opposite of what global warming will do=more El Nino's) is mostly responsible.
Climate change has definitively PROTECTED the Midwest from droughts. Only 1 major/severe drought since 1988 in 2012. When that area was averaging a major drought every 8 years in the old, cooler climate with less CO2.
The Dust Bowl DECADE of the 1930s and the 1800's(that had 3 separate Dust Bowls) in the old climate were caused by colder climates and lower CO2(Higher CO2 makes plants more drought tolerant/water efficient).
https://www.marketforum.com/forum/topic/69258/#109795
However, the Western US has in fact been hotter and with higher evaporation rates from climate change because drier air has radiation absorption bands that are not saturated by H2O which is the main greenhouse gas that overlaps with the same bands as CO2.
Air that is heated more can hold more moisture but also increases the lifting condensation level to form clouds and NEEDS MORE moisture to saturate the air mass in order to start condensing out the moisture.
Warm/HUMID air can't be heated much more from added CO2 because their radiation absorption bands are saturated from the H2O!
CO2 warming is also logarithmic.
Re: Re: Re: Historic SW US March heatwave
By metmike - March 19, 2026, 1:17 p.m.
++++++++++++++
I greatly respect this atmospheric scientist and his work but he may be biased with his interpretation in this study that precipitation has remained steady.....or maybe I'm wrong.
https://phys.org/news/2022-12-long-term-western-precipitation-trends-stable.html
++++++++++++++
https://www.wunderground.com/cat6/us-precipitation-1901-2019-a-decade-by-decade-look

NOAA/NCEI breaks the contiguous U.S. into nine different climate regions as shown above. From the Climate at a Glance website, the average per-decade regional change in precipitation for the period of 1901-2019 has been as follows:
Northeast: + 0.44” per decade
Southeast: + 0.12” per decade
Upper Midwest: + 0.38” per decade
Ohio Valley: + 0.39” per decade
South: + 0.33” per decade
Northern Rockies and Plains: + 0.11” per decade
Southwest: - 0.01” per decade
Northwest: + 0.12” per decade
West: + 0.01” per decade
As can be seen, all regions of the country have seen an average decadal increase in precipitation since 1901, aside from the Southwest region, which has seen a slight decrease. The most pronounced increases have been in the Northeast, Ohio Valley, and Upper Midwest.
It is obvious that most regions of the country have seen an increase in precipitation over the past three decades, with this trend most pronounced in the northeast quadrant of the contiguous U.S. The southwestern quadrant of the country has not seen this increase; it also has not seen much, if any, decrease in precipitation,
+++++++++++
OK, I guess that I am wrong about the West being drier, however, the warmer temperatures in the Southwest are increasing evaporation/drying rates which HAS THE SAME IMPACT as less precip.
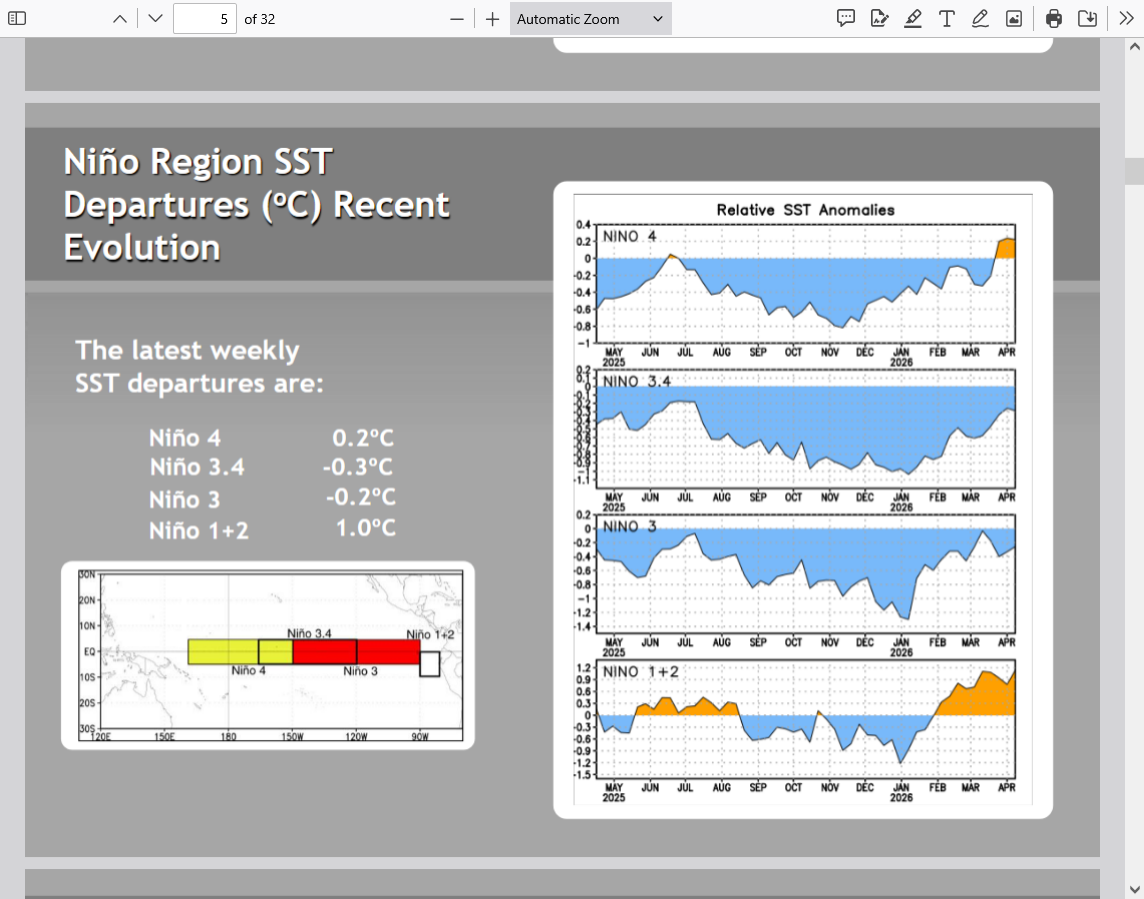
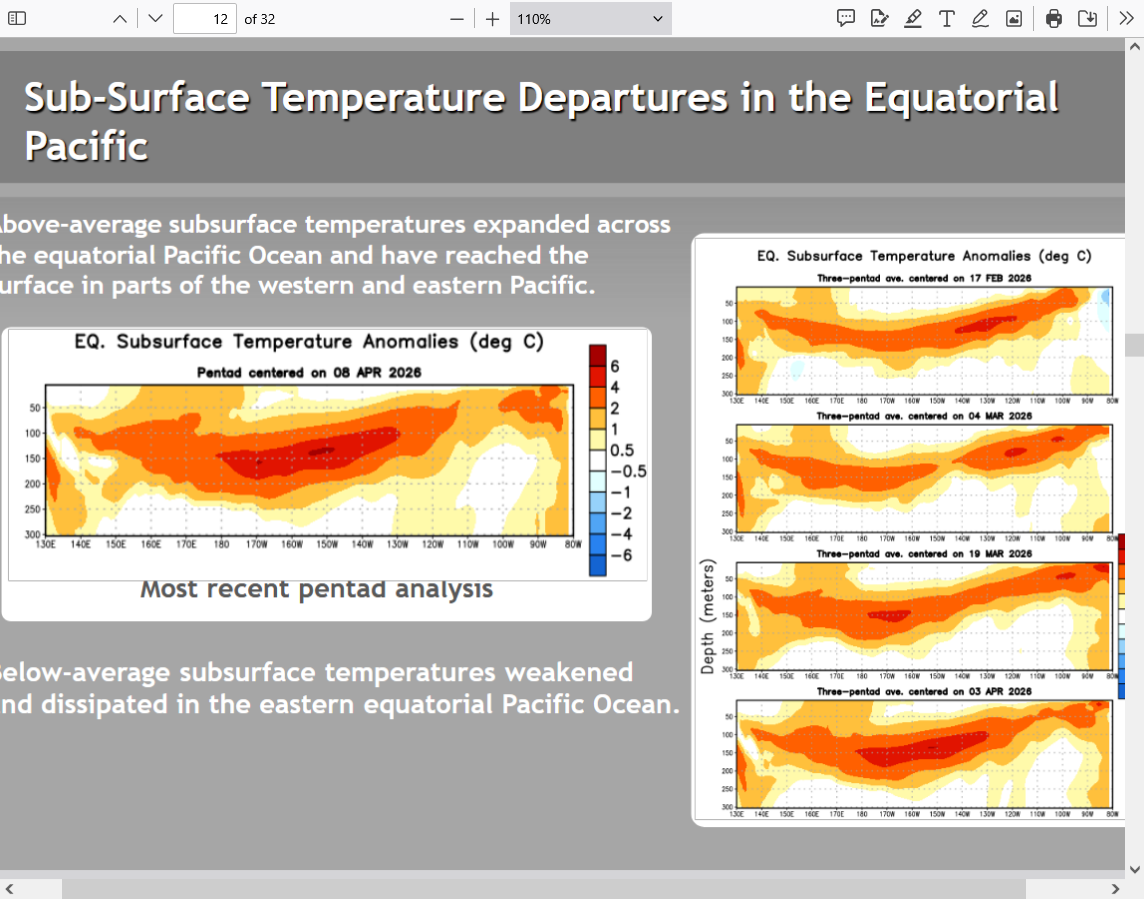
ENSO: Recent Evolution,
Current Status and Predictions
Update prepared by:
Climate Prediction Center / NCEP
30 March 2026
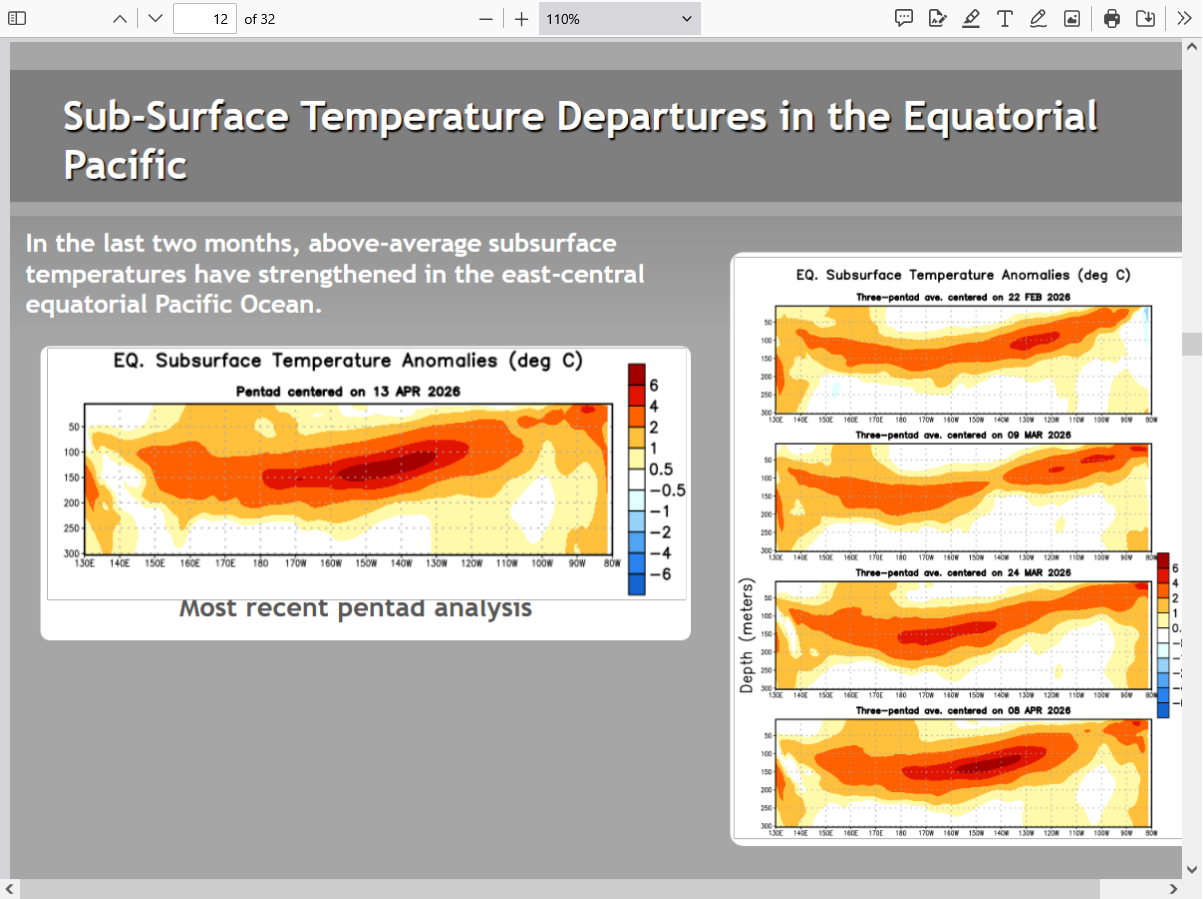
Look at region 1.2 at the bottom!!!(the first to warm up in the east and that warm water spreads west)
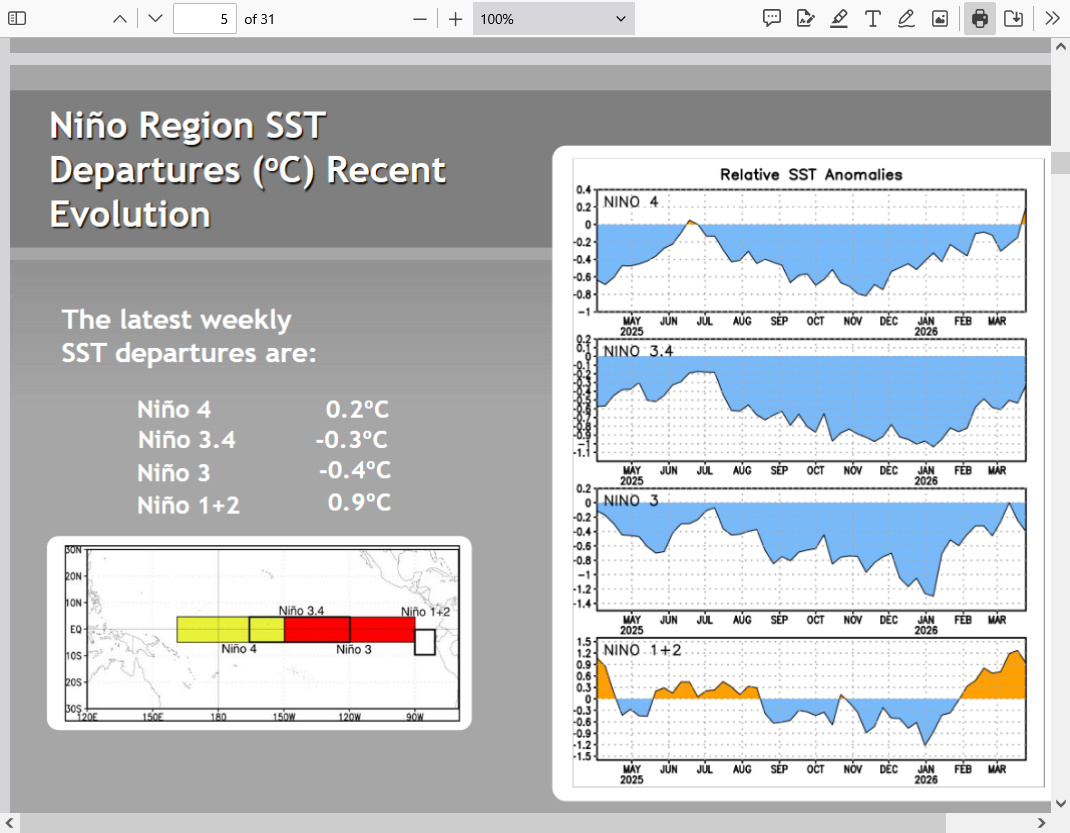
+++++++++++++++++++++++++++++
Look at the very warm water anamolies off the coast of Mexico that developed at a near record pace(from warming below)!
Rapid warming in the entire ENSO region.
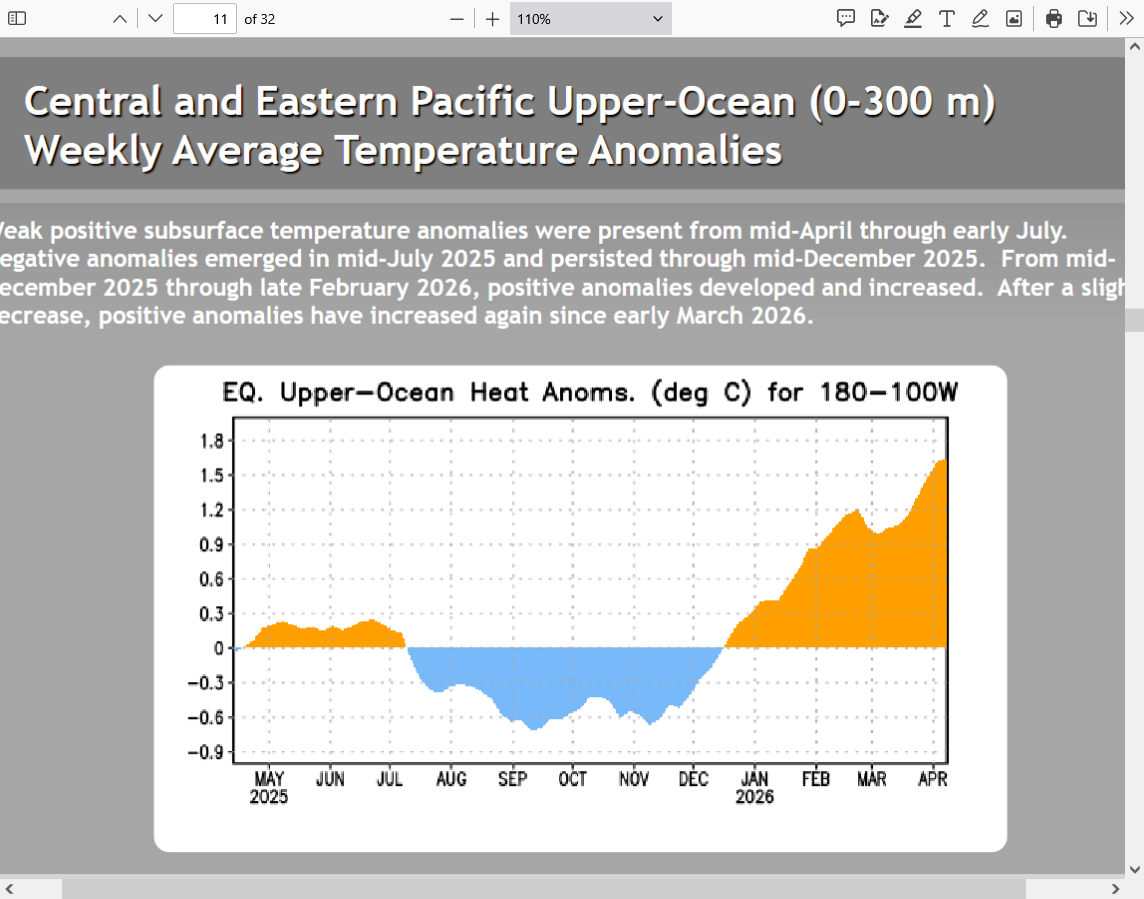
Upper ocean heat content has soared higher during the entire Winter.
Some very warm temp anomalies will be coming to the surface!
This is the prediction below. Clearly headed to El Nino land. However, as mentioned many times here, this is a 3 MONTH AVERAGE! That is a lagging indicator. Everybody that uses technical analysis involving cross overs of shorter term averages will understand this but with ENSO and water temperatures of a massive body of water its more indisputable because they don't whip saw back and forth.
The Pacific Ocean and atmosphere above it are already into El Nino mode!!!
But the metric to formally dub it "El Nino is here everybody" is when the average of a 3 month period meets the El Nino temperature standard set by the El Nino declaring gatekeepers.
Right now, that average is still dialing in the colder anomalies of January and February into the much warmer March.
But it's April 2nd and the atmosphere isn't waiting around for NOAA to tell it that we have an El Nino when ocean temperatures have already crossed the threshold. And even that threshold is not a magical mystery boundary which acts like flipping a switch.
The warmer it is, the stronger the El Nino type impact, whether its just under the El Nino threshold or a Super El Nino.
The colder it is in La Nina land, the more pronounced the La Nina type impact.
This is also very likely why rains have picked up in drought areas of the United States recently and odds favor us seeing more drought relief this Spring and having the potential for good growing season weather.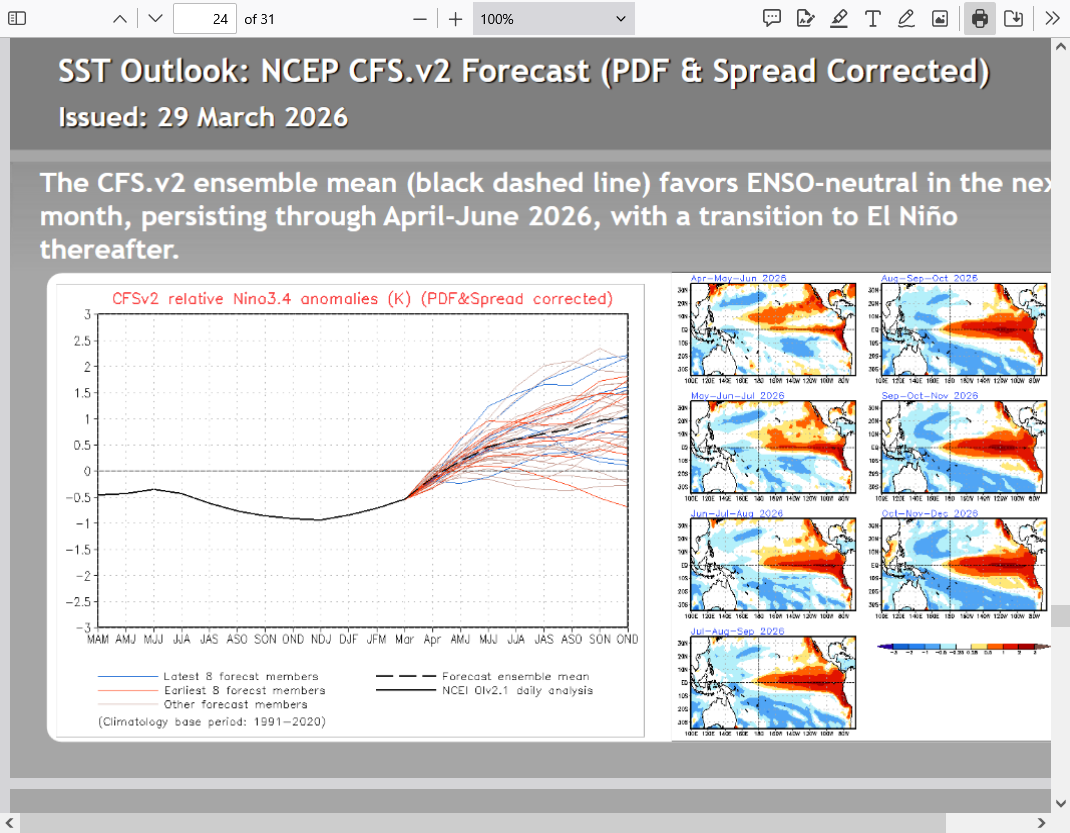
Update: Before we grow the crop, we need to get it planted/well emerged. I'm increasingly concerned that the blockbuster El Nino will cause excessive rains downstream in parts of the US before that happens.
This weeks ENSO update was just released. It confirms the previous forecast philosophy. There are some very impressive subsurface sea temperatures right now that will rise to the surface and cause near SUPER El Niño conditions to emerge at a record fast pace.
El Ninos increase odds for good growing seasons in the Cornbelt. This potentially anomalous El Niño, from NATURAL variation causes will hopefully not cause too much of a good thing with rains.
+++++++++++++++
ENSO: Recent Evolution,
Current Status and Predictions
Update prepared by:
Climate Prediction Center / NCEP
6 April 2026
https://www.cpc.ncep.noaa.gov/products/analysis_monitoring/lanina/enso_evolution-status-fcsts-web.pdf
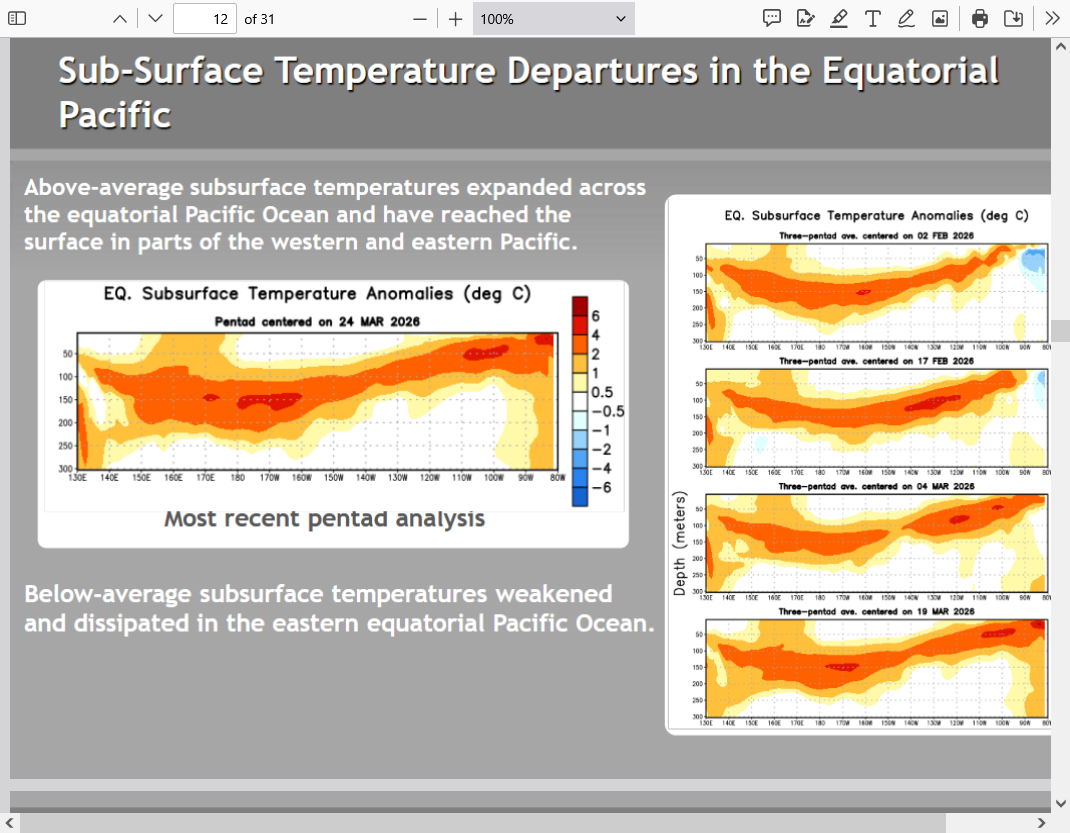
Pretty much a progression of last week's data/analysis. So I'll copy just 1 map below because there is actually a tiny speck of +6 Deg. C temperature anomaly(red in the center of the dark orange) that wasn't there last week which is the warmest temperature on the color bar chart.
+++++++++++++++++
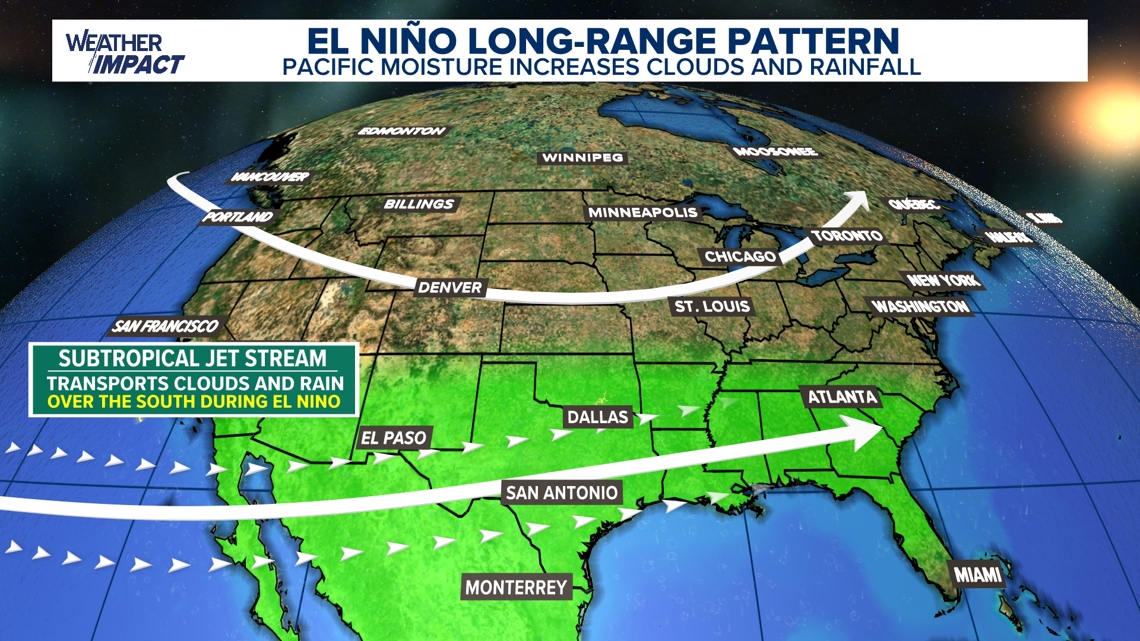
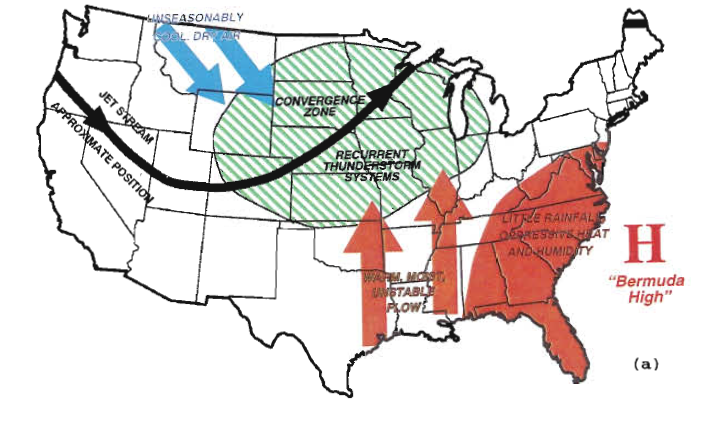
The map above is more for the cold weather season/Winter. If a Bermuda High builds in the East, the jet stream will be less zonal and get deflected northward, along with Gulf of Mexico moisture adding to the subtropical jet stream. Each year is different but Summer El Nino's increase the odds of favorable weather, mainly from greatly reducing the chances for a widespread drought.
The historical Mississippi River Valley flooding in the Summer of 1993 was during a modest El Nino but featured a block buster, blocking Bermuda High in the East that pumped in tons of Gulf moisture and caused weather systems to fizzle out as they tracked into the ECB. Corn yields that year took a hit in the ECB from HOT and DRY weather much of the Summer, even as flooding, record rains dumped constantly just 2 states to the west.
We were especially hot/dry here along the Ohio River.
I'm not sure how much that weak El Nino played a role:
The temperature configuration/extreme in the tropical Pacific right now is getting pretty anomalous. NOT from climate change/global warming(which mostly super imposes X amount of heating on the entire system) but from natural variation.
We're seeing some pretty extreme warming just northeast of the key Nino 3.4 region(the 1+2 region) as well as in the subsurface heat (which will likely be coming to the surface.
Where this comes together will determine how strong the El Nino is later this year. Some models predict a SUPER El Nino. The extreme warming in the Nino 1+2 region must have some analogs that would guide us in predicting the rest of Spring which I'll try to find.
ENSO: Recent Evolution,
Current Status and Prediction
I’ll have the update when back in my office. The subsurface warmth continues to build big time with the +6 Deg. C contour growing. When that extremely water naturally comes to the surface, it means a robust El Niño in short order and maybe a SUPER El Niño later this year!
The atmosphere will likely already be starting to respond in May with much wetter and cool weather in the US which is the most likely type of Summer weather that we have ahead with this analog.
Each year is different. Even strong Analogs and past correlations have years with big exceptions but this looks exactly like what the crop doctor and soil moisture doctor ordered For this upcoming growing season for much of the key growing regions.
Regardless, even in our wettest Summers we never eradicate all the drought. one question will be, where will this current drought persist even as many places get big relief?
A huge Bermuda high and blocking along the East Coast for instance (too much rain= 1993 was an extreme example) is a different outcome than systems moving progressively into that area and not lingering excessively in the Midwest.
April 20, 2026 update: Impressive pool of warm water(from natural processes) ready to come to the surface!
Last update for this week. Similar to last week. Unlike the atmospheric forecasts which can change completely in just a few days, the oceans change extremely slow and 7 days will rarely feature big changes.
https://en.wikipedia.org/wiki/Ocean_heat_content

Ocean heat content (OHC) or ocean heat uptake (OHU) is the energy absorbed


Surface air temperatures over land masses have been increasing faster than the sea surface temperature.
Surface air temperatures over land masses have been increasing faster than the sea surface temperature.

The greenhouse effect traps heat in the lower atmosphere and oceans, so that the upper atmosphere, receiving less reflected energy, cools.[41]
++++++++++++++++
The same story we've been advertising this year except the forecast is becoming more of a reality now.
Last update for this week. Similar to last week. It takes days for the atmosphere to conduct a pattern change. However, it takes MONTHS for the tropical Pacific to conduct a pattern change.
I copied just one map from this week's update. This heat WILL come to the surface.
2026's El Niño Will Be The Worst in 150 Years — And It's Terrifying
https://www.youtube.com/watch?v=IanNQPexDE8
++++++++++
I don't agree with the amount of alarm-ism in this video but the visuals are fun to watch and DOES have a lot of authentic facts. His carbon sink stuff is definitely alarm-ism.
https://pmc.ncbi.nlm.nih.gov/articles/PMC5668685/
++++++++++++++++
Keep in mind that the historic El Nino we are comparing this one to was WELL BEFORE the earth had experienced any global warming from human emissions of CO2 from burning fossil fuels. The planet was around 2 deg. F COOLER and had around 140 parts per million LESS CO2.
1876/1878 event. We have posted on that one numerous times before here:
Re: Re: Re: Re: Re: Death by GREENING!
By metmike - Feb. 2, 2025, 7:54 a.m.
https://www.marketforum.com/forum/topic/69258/#109795
You want a REAL climate CRISIS?
This is what it looks like:
Can you imagine if this below happened today? It's less likely because climate change and the current climate OPTIMUM is helping to PROTECT US!
The planet had a REAL climate crisis between 1876 and 1878.
50 million people died. 3% of the global population died from that real climate crisis!
https://news.climate.columbia.edu/2017/12/15/causes-great-famine-drought/

https://ui.adsabs.harvard.edu/abs/2017AGUFMGC51F..04S/abstract
The 1876-1878 Great Famine impacted multiple regions across the globe including parts of Asia, Nordeste Brazil, and northern and southern Africa, with total human fatalities exceeding 50 million people, arguably the worst environmental disaster to befall humanity.
++++++++++++
5-5-26: Here's the thing:
The planet will still be reeling from and recovering from the worst energy crisis in history caused by Donald Trump's unjustified, preventable war in Iran. The LAST thing we need is to get hit by the greatest REAL climate disaster in modern history!
Some of ocean warming from sources below?
Started by WxFollower - May 7, 2026, 10:28 a.m.
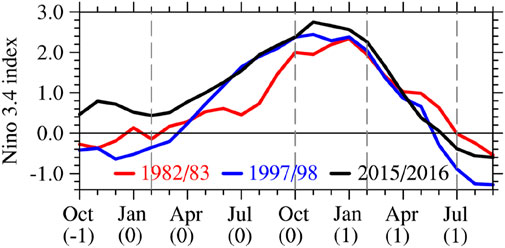
Super El Nino's always peak in the early Winter. There impact starts BEFORE then and lasts thru the Winter.
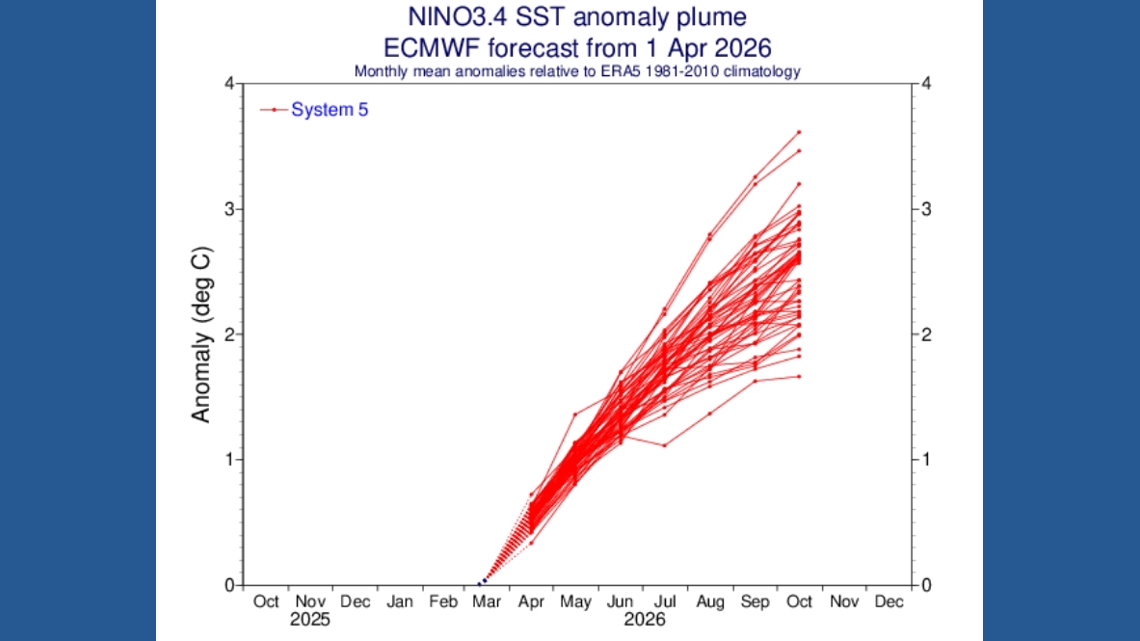
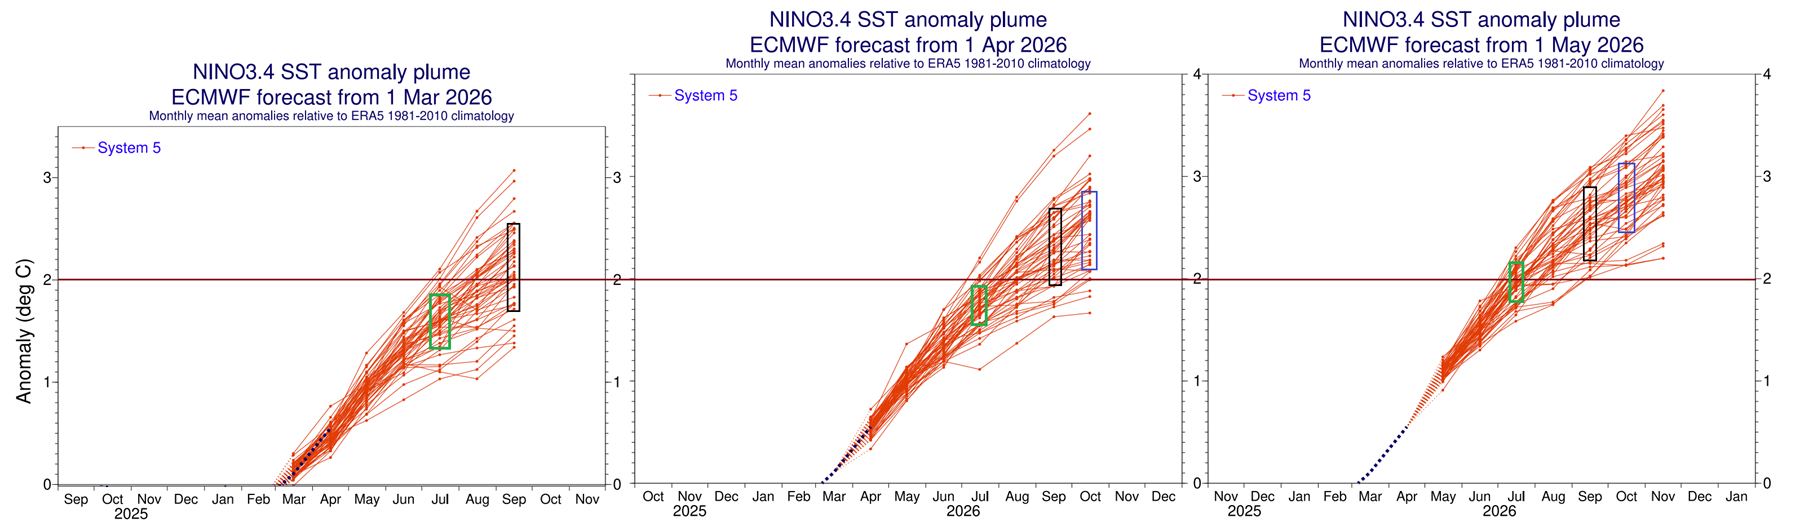
The ensembles in the forecast below
This guy is outstanding with comprehensive explanations!
Below is also the latest ENSO forecast from NOAA’s CFSv2 model. It shows a very similar story to the ECMWF, with a very strong El Niño developing, rivaling the strongest Super El Niño events of recent history. The development is also rapid enough to directly impact the summer weather patterns and the summer storm season across the United States, Canada, and Europe.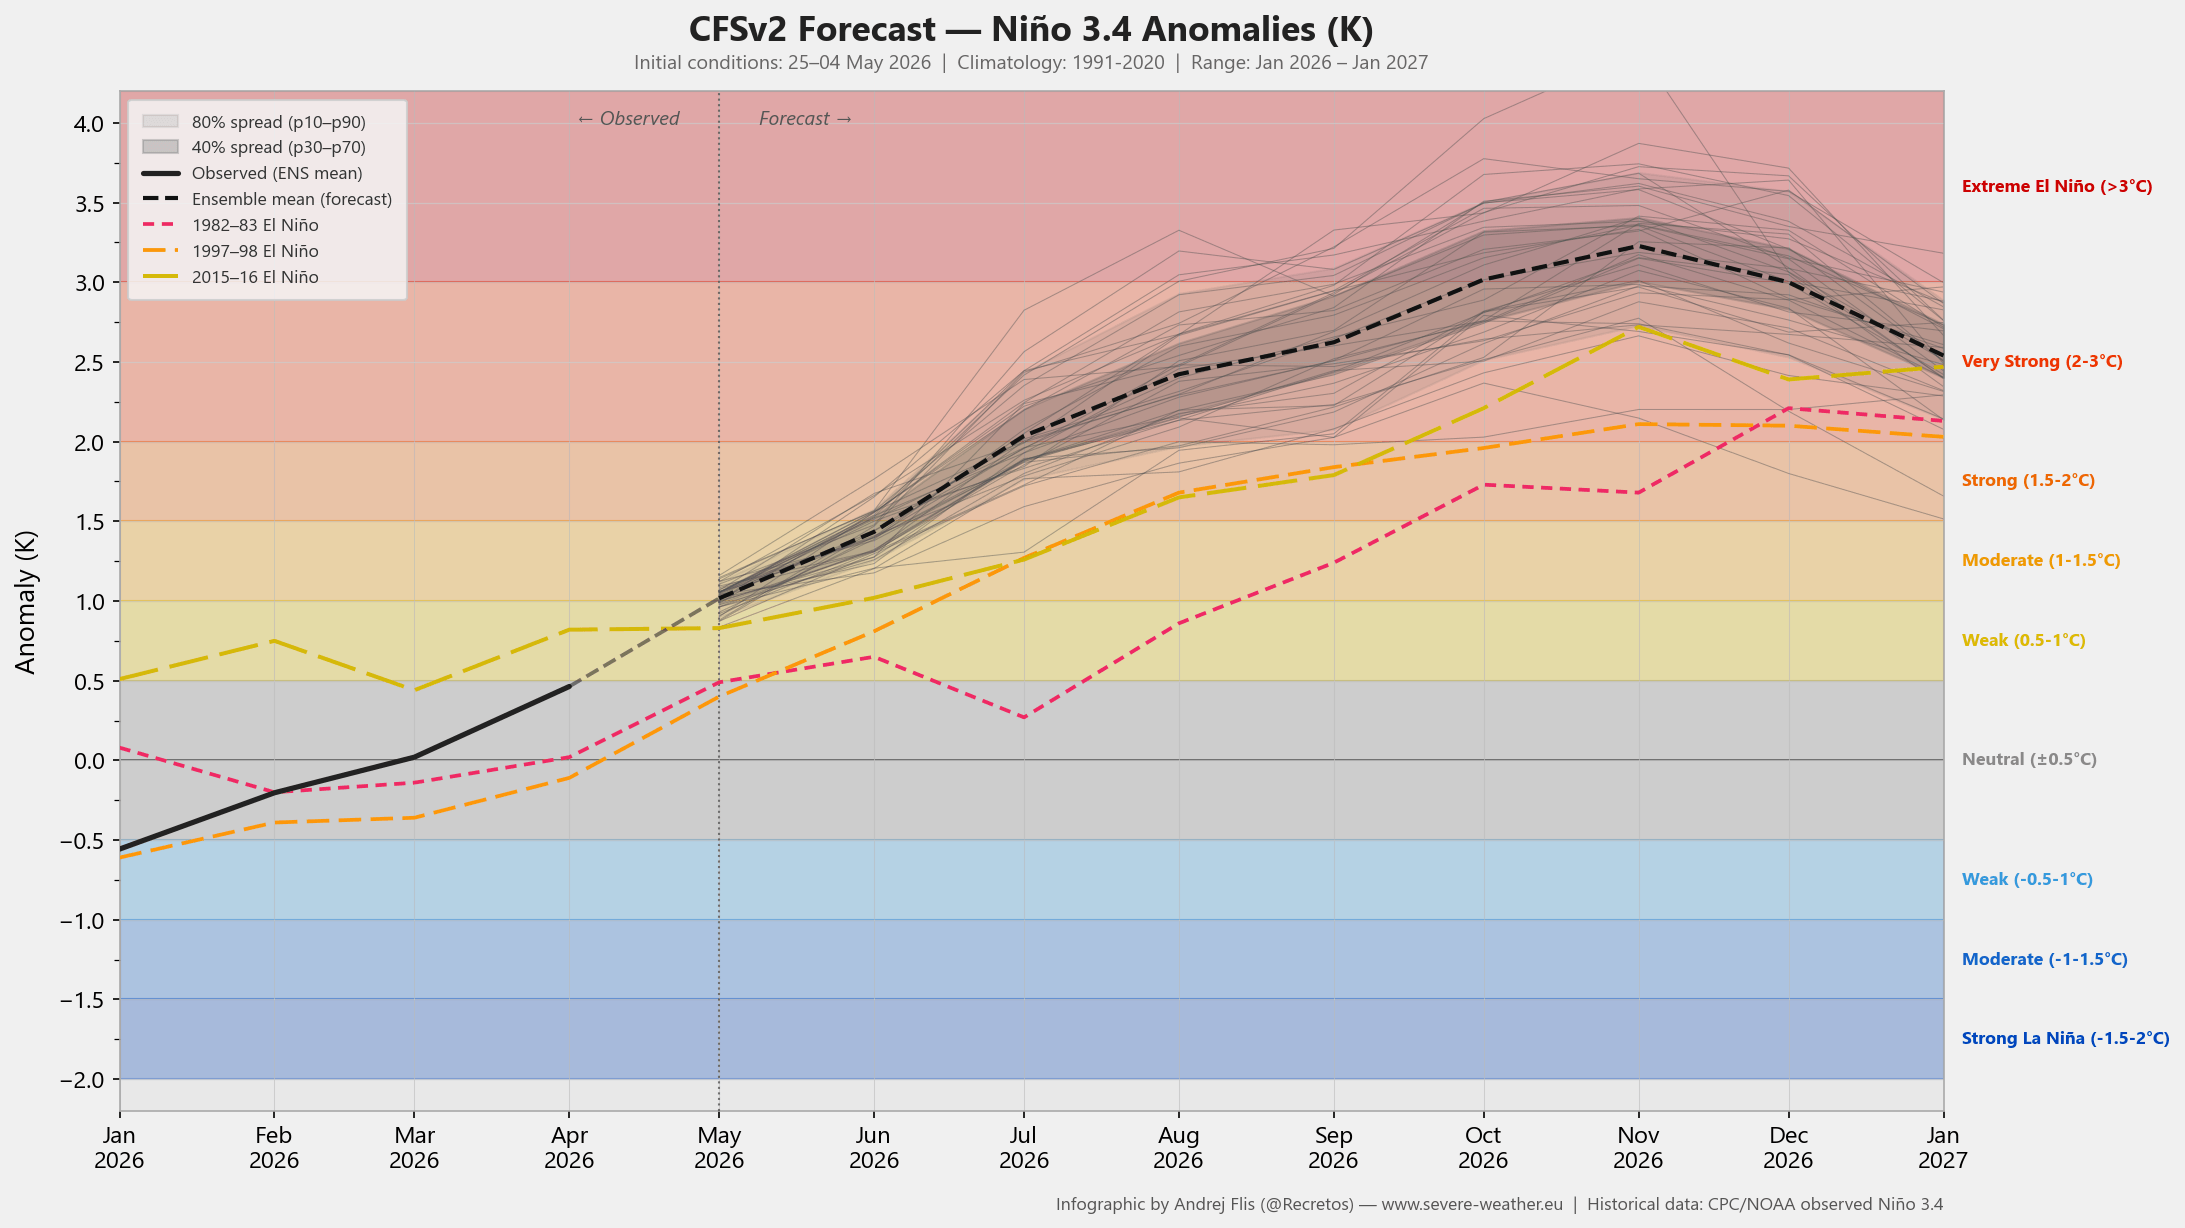
A Super El Niño event would lead to more extreme weather shifts, turning typical seasonal changes into high-impact events like massive flooding, severe droughts, and significantly altered storm tracks that can affect the entire planet.
+++++++++++++++++++++
Below is an example from the last three ECMWF forecasts for the main ENSO region, released in March, April, and May. You can clearly see that each new run shows a stronger event.
Today's ENSO update added nothing new:
Let's add a great discussion from an expert that explains what El Nino's and La Nina's are and how we determine them:
https://climatedataguide.ucar.edu/climate-data/nino-sst-indices-nino-12-3-34-4-oni-and-tni
++++++++++++++++
Some scientists believe the waning and weak El Nino in 1993 played a role in the record Midwest Summer flooding. Each El Nino is different depending on where the warmest water is (how warm it is) and what the temperature of the surrounding water. is.
When the El Nino/La Nina impact travels outward from the source, prevailing, large scale atmospheric circulations/weather patterns independent of the El Nino/La Nina can make all the difference in determining the exact impact path and the magnitude of it.
In 1993, for instance, we would not have seen the record flooding without the huge, persistent Bermuda High locked in from the WEST Atlantic to the far eastern US. That blocking high prevented Midwest storms from tracking normally from west to east with a progressive jet stream. Instead the jet stream remained aimed at the same Midwest areas with relentless waves/storms dumping on the same areas over and over. The weak El Niño at the time sort of hijacked the large scale circulation pattern and gifted the flow with extra energy and moisture from the source region Pacific Ocean.
One can imagine an extreme of even greater magnitude if the El Niño in the Summer of 1993 had been strong, instead of just barely reaching the minimal El Niño threshold.
+++++++++++
+++++
I'm not saying this rapidly developing El Nino is going to cause flooding in the Midwest this Summer! It just increases the chances a bit. El Nino's actually elevate the odds of favorable rains and temperatures in the Midwest during the growing season but again, each one is different.
The most notable feature with this one appears to be the potential for a record fast onset this Summer as well as the potential for record warm temperatures as a SUPER El Nino later this year. That's when the chances for the most extreme weather from a SUPER El Nino are highest.....during the cold weather season and not the Summer's. The temperature gradient from a warm anomaly is greatest in the Winter when it’s surrounded by the colder waters in that season.
This allows the atmosphere to become coupled(controlled) by this part of the tropical ocean. Studies have shown that Fall is the season for El Niños to become coupled strongest with the atmosphere. Usually, the closer a place is to the source region, the more potentially impactful the weather is, however teleconnections from ENSO conditions many thousands of miles away can result in more extreme weather because of regional or local dynamics that amplify that impact.
Flooding along the West Coast is common during strong El Niño years, for instance. In the Summer of 1993, the flooding was more than 1,000 miles downstream from the West Coast because the flow took on a blocked pattern because of the amplified East Coast Bermuda High.
Not too many folks know that corn yields in the far eastern corn belt were horrible that Summer……because it was so hot and dry!! Crops in the Southeast US were burning up, while crops along the Mid-Upper Mississippi Valley were pounded by record rains that Summer.
I’ll bet that cutworm in southeast IN remembers this. Storm after storm would dump huge rains in the western corn belt in 1993, then lift into the Upper Midwest. All the rains would dry up crossing the state of Illinois. The duration of this blocked pattern …..many weeks is what did most of the damage.
Take away or weaken the strength of the East Coast HIGH in the Summer of 1993 and excessive rains in the Midwest would have turned into progressive, BENEFICIAL rains farther east, while allowing the Midwest to dry out.
+++++++
So although the Super El Nino represents a powerful pre existing ocean/atmosphere coupling, its what ADDITIONAL large scale features it encounters when El Nino impacts travel outwards from the source region.
A progressive flow in the Midwest this Summer could yield record yields from wonderful, regular, widespread El Nino helped rains and lack of heat.
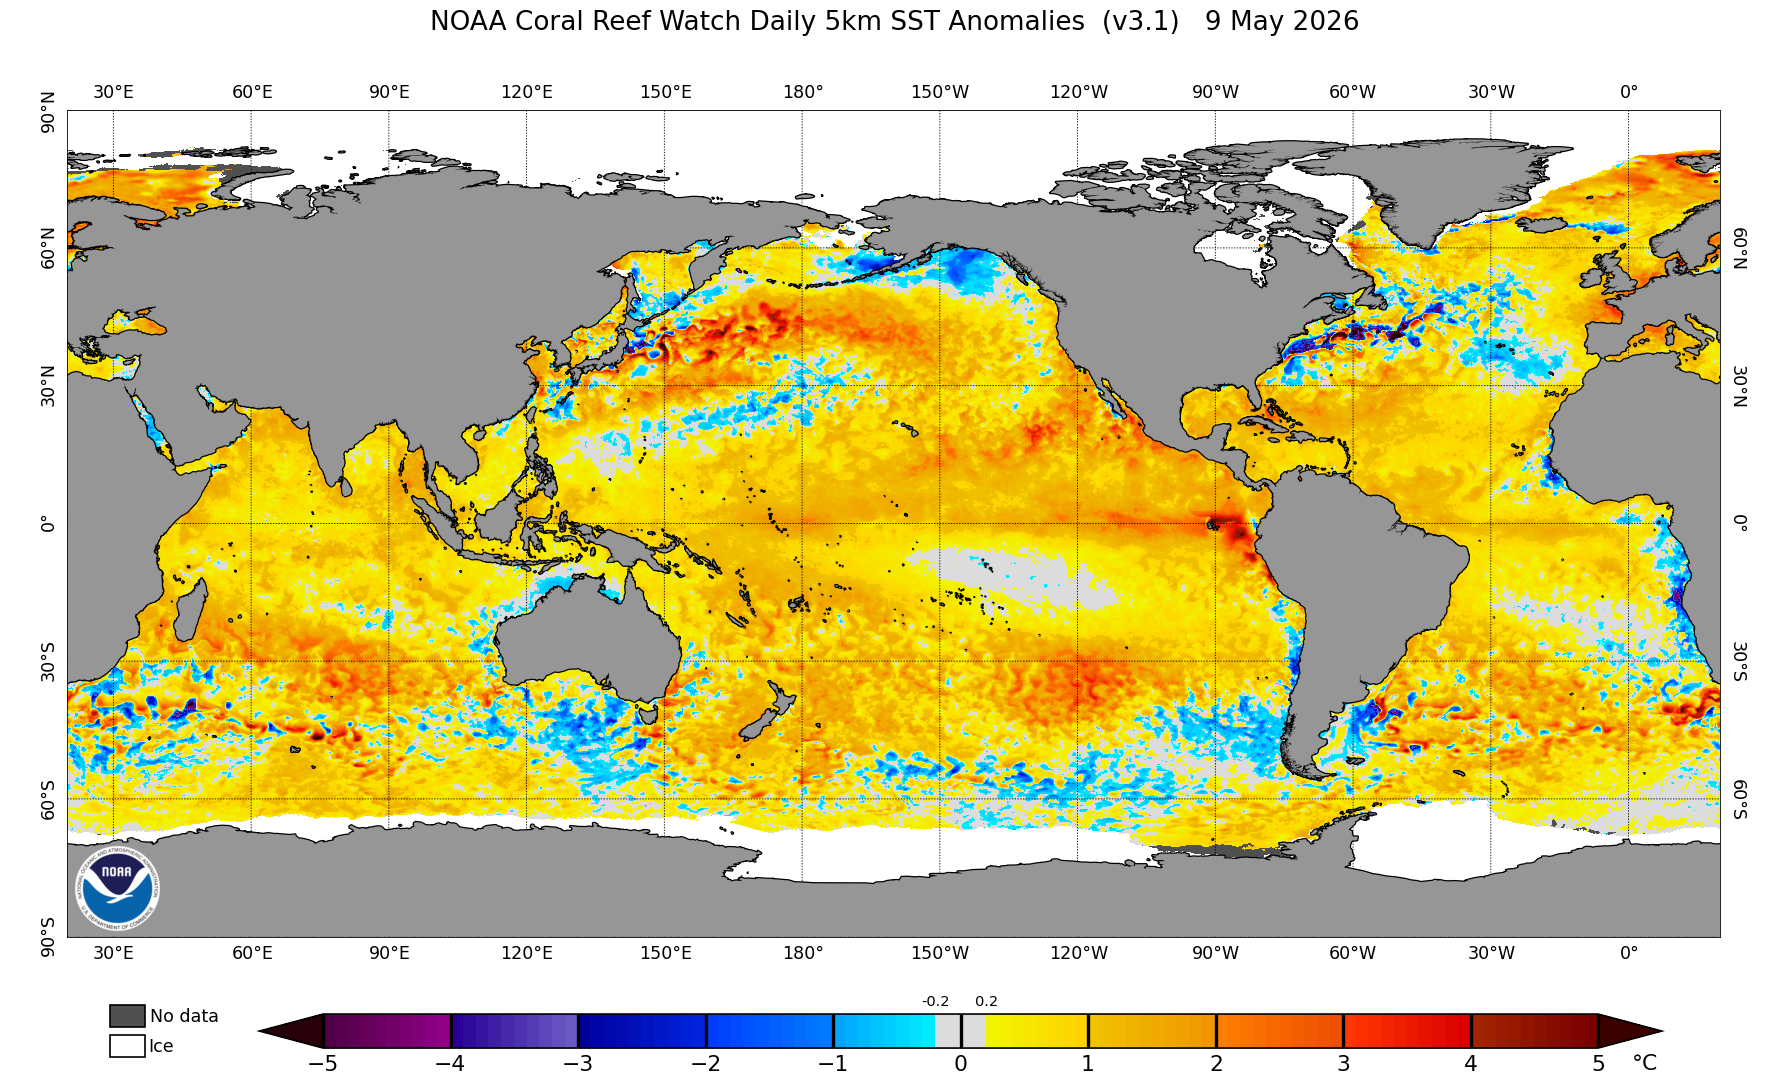 A couple images : The El Nino seems to be starting in the east & the Pacific Coast looks ready for hurricane season
Thanks, patrick!
Extra fuel for Pacific hurricanes this year for sure!
El Nino‘s typically start in the far eastern tropical Pacific and work their way west at least that’s the pattern for the surface warming.
Where the peak warm anomalies are and what the magnitude is matters, as well as the other large scale atmospheric features downstream that are steering, deflecting or enhancing the El Niño coupled waves that pulsate outward from the source region.
lots of uncertainty there but we can count on an increase in global temperatures later this year and in 2027. There’s a lot of extra energy-heat belching out into the atmosphere from a super El Niño.
The recent La Niña has cooled Global temperatures a bit the past year.
That WILL be coming to an end.
The La Niña has also been mostly responsible for the widespread drought that is pretty severe in many locations.
This El Niño should greatly reduce the areas of drought, especially in the West this upcoming Winter.
As always, El Niño Winters never feature a bunch of gentle soaking rains that are perfect. That almost never happens other than exceptions to the rule.
Strong El Nino Winters ALWAYS feature numerous powerful atmospheric rivers loaded with energy and moisture that bombard the West Coast with numerous times more rain at once than people want. The excessive run off causes major flooding and mudslides. This is just part of the climate they’ve had for hundreds of years.
The good news is that reservoirs will be filled and usually heavy mountain snowpack for the next years meltwater season.
The normal climate for California is to oscillate between not enough rain/drought to too much rain with more time at extremes combined than the optimal soil moisture in between.
The best solution would be to increase desalination plants along the West Coast of California and tap into an unlimited supply from the ocean. They are costly and consume a lot of energy.
Instead of spending an extra 500 billion of tax payer dollars to make more killing tools to enrich the military-industrial-political complex and empower Donald Trump on his mission of conquest, to make himself a legend, abusing his powers to control the most powerful military in the world, which he wants authorized
we could be using that money to Really help solve the growing water crisis or for a dozen other things to benefit humanity.
| EL NIÑO/SOUTHERN OSCILLATION (ENSO) |
| DIAGNOSTIC DISCUSSION |
| issued by CLIMATE PREDICTION CENTER/NCEP/NWS |
| 14 May 2026 |
ENSO Alert System Status: El Niño Watch |
https://www.cpc.ncep.noaa.gov/products/analysis_monitoring/enso_advisory/ensodisc.shtml
+++++++++++++++

++++++++++++++++++++
The start up stages of the forecast from earlier this year is turning into a reality. That doesn't mean that all sorts of atmospheric havoc is coming later this year with any degree of confidence. It greatly increases odds for extreme weather in some places. It also increases chances for good weather in some places.
Cornbelt weather in the growing season for instance is more likely during El Nino's. Or from wiping out widespread drought in the US and filling up reservoirs out West from rains(high elevation snows), that will always be excessive at times as part of the forever climate pattern out there.
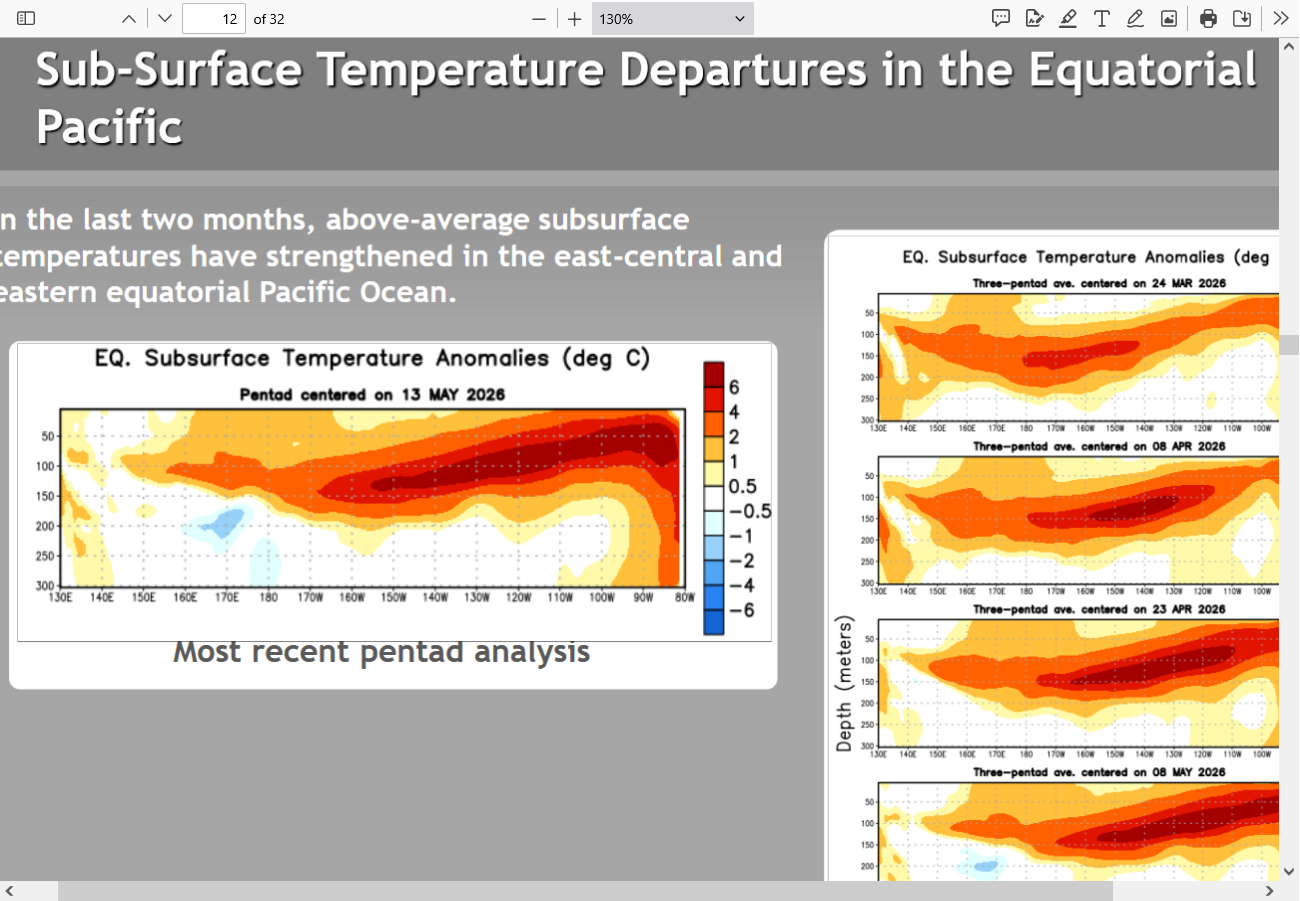
May 18, 2026: Conditions continue to move in tandem with the forecast!
ENSO: Recent Evolution,
Current Status and Predictions
Much of this warm water will be coming to the surface:
Daily RONI jumped past 1C - https://www.storm2k.org/phpbb2/viewtopic.php?f=31&t=125099&start=660
Thanks, Mike and Patrick
The ONI/RONI daily equivalent has warmed a whopping 0.5C over just the 5 day period May 31st to June 5th based on OISST SSTs, which is what Patrick’s post is based on. Although this is rapid, it’s not surprising per model consensus and the strong and long -SOI. I’ve found that often there are significant 3.4 warmings starting ~2-3 weeks after the start of a long, strong -SOI string, which we had starting on May 11th and is continuing.
Based on the steep warming this week, I’m expecting the weekly Monday release of the relative weekly 3.4 to rise to ~+0.8C from the +0.5C in this past Monday’s release.
I’m looking for Darwin’s SLP to peak higher than 1017 mb tomorrow with it possibly being as high as ~1017.5 mb. If it were to get to 1017.5 mb, that would make it the 7th highest Darwin daily on record (records only back to June of 1991 though). The 6 highest are not surprisingly from other El Niños: 1994 (2 days), 2004, and 2023 (3 days).
Thanks very much, Larry!
Yep, the Super El Nino forecast is proceeding as expected.
ENSO: Recent Evolution,
Current Status and Predictions
 ++++++++++++