Please move this thread to TR if this should be there, which I think is the case.
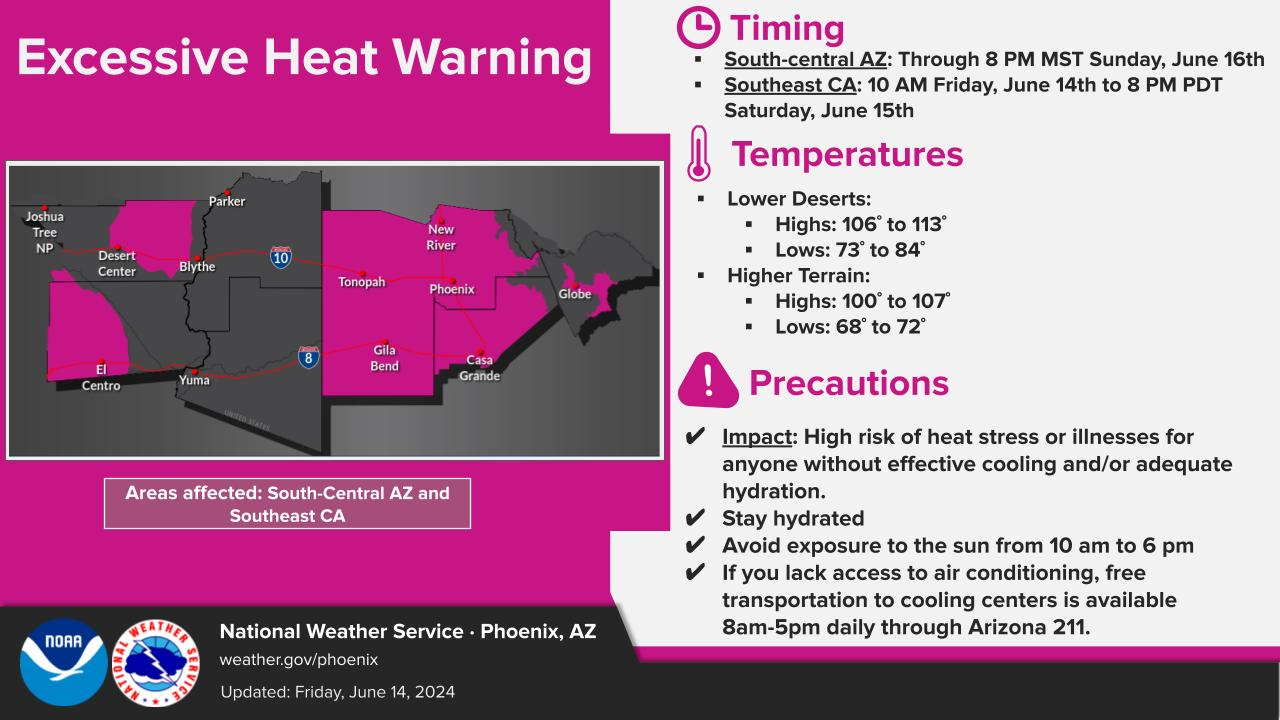
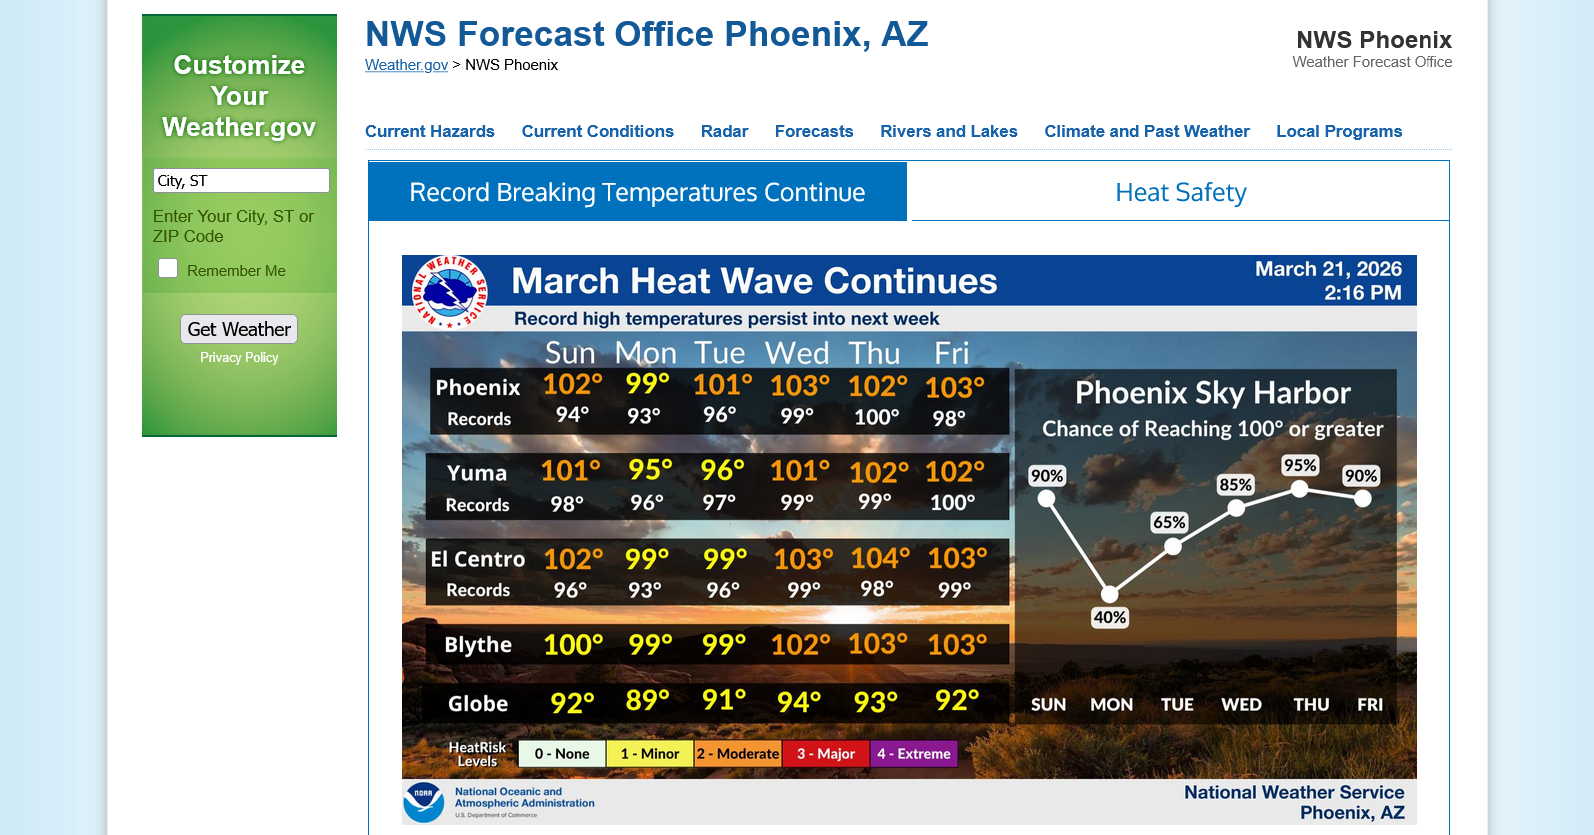
The SW US is being forecasted to have a record shattering heatwave late this week into early next week with a progged record strong 500 mb high for March. This was released by the Phoenix NWS office:
REACHING 100 DEGREES IN MARCH IS HIGHLY
UNCOMMON, WITH THE AVERAGE FIRST 100 DEGREE DAYS BEING IN LATE-
APRIL TO START OF MAY. SO, OVER A MONTH EARLY AND THE PHOENIX
CLIMATE SITE WILL SET A NEW RECORD EARLIEST 100 DEGREE, WITH THE
CURRENT EARLIEST SITTING AT MARCH 26TH. IT GOES WITHOUT SAYING,
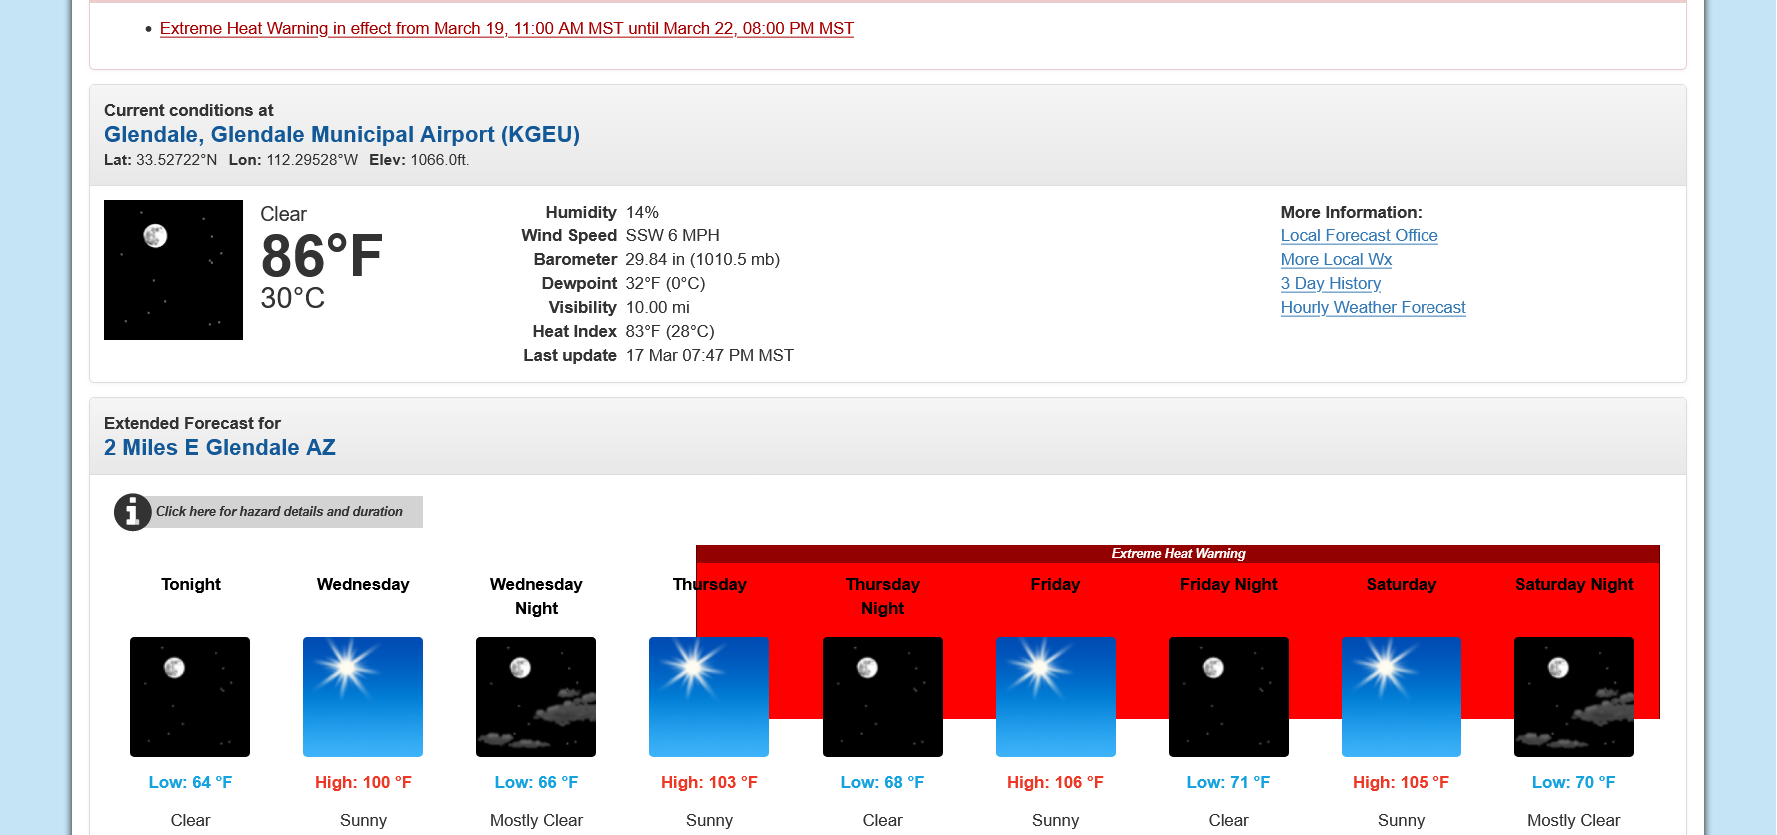
THIS WILL BE AN IMPACTFUL HEATWAVE. EXTREME HEAT WARNINGS BEGIN ON
WEDNESDAY ACROSS SOUTHEAST CALIFORNIA AND THE REST OF THE AREA
STARTING THURSDAY.
LONG TERM /THURSDAY THROUGH MONDAY/
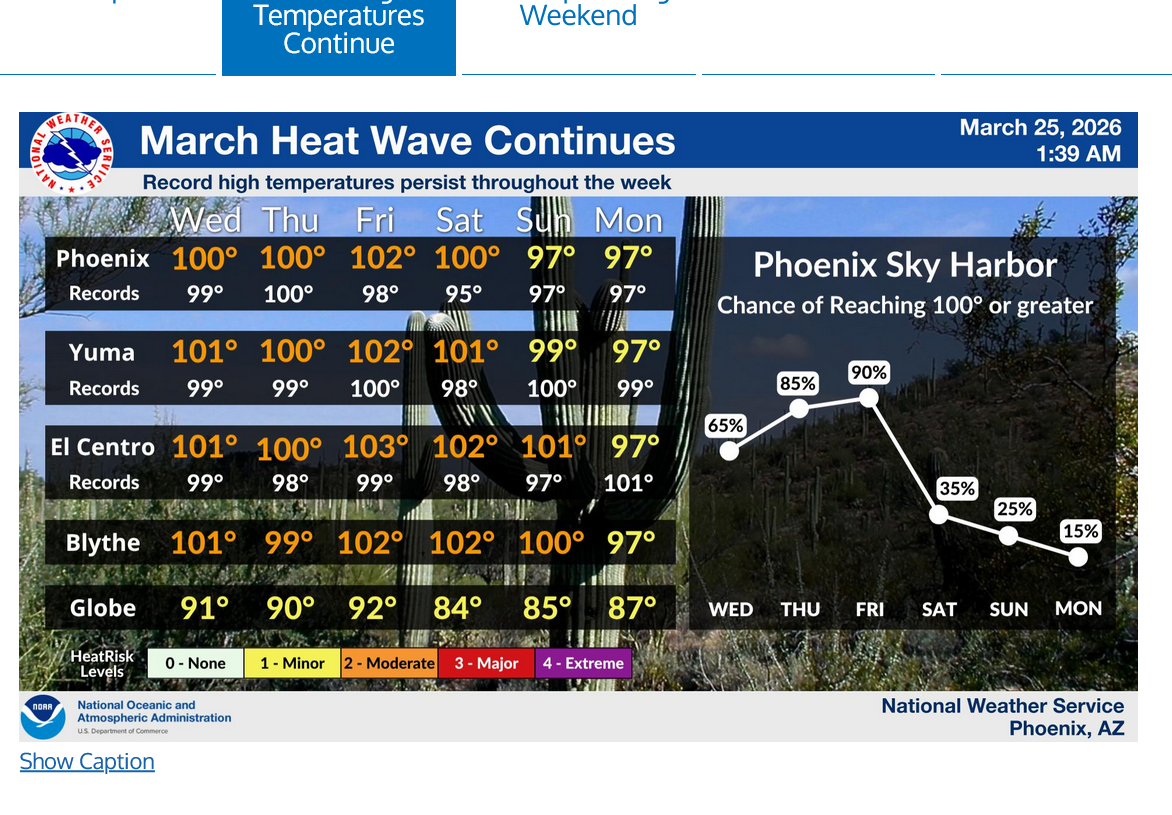
MODELS ALL AGREE THIS RIDGE WILL BECOME THE STRONGEST RIDGE THE
SOUTHWESTERN U.S. HAS EVER EXPERIENCED DURING THE MONTH OF MARCH
AND POTENTIALLY EVEN DURING THE ENTIRE WINTER/EARLY SPRING TIME
FRAME. H5 HEIGHTS ARE NOW FORECAST TO PEAK AT AROUND 595-596DM ON
THURSDAY BEFORE GRADUALLY LOWERING FRIDAY AND THROUGH THE WEEKEND
AS THE RIDGE CENTER BARELY MOVES. NBM FORECAST TEMPERATURES ARE
STILL SHOWING HIGHS PEAKING ON FRIDAY AND SATURDAY BETWEEN 103-109
DEGREES ACROSS THE LOWER DESERTS, WHICH IS BETWEEN 7-10 DEGREES
ABOVE DAILY RECORDS. WIDESPREAD HIGH-END MODERATE HEATRISK TO LOW-
END MAJOR HEATRISK WILL IMPACT THE AREA FROM THURSDAY THROUGH AT
LEAST SATURDAY BEFORE THE WEAKENING RIDGE FINALLY ALLOWS
TEMPERATURES TO START TO DECREASE.
...EXTREME HEAT WARNING IN EFFECT FROM 11 AM THURSDAY TO 8 PM MST
SUNDAY...
TONIGHT
CLEAR. LOWS 59 TO 67. WEST WIND 5 TO 10 MPH IN THE EVENING
BECOMING NORTHEAST AROUND 5 MPH AFTER MIDNIGHT.
WEDNESDAY
SUNNY AND HOT. HIGHS 97 TO 101. EAST WIND AROUND 5 MPH
IN THE MORNING BECOMING WEST IN THE AFTERNOON.
WEDNESDAY NIGHT
CLEAR. LOWS 62 TO 69. NORTHWEST WIND 5 TO 10 MPH
IN THE EVENING BECOMING NORTHEAST AFTER MIDNIGHT.
THURSDAY
SUNNY AND HOT. HIGHS 100 TO 105. EAST WIND 5 TO 10 MPH IN
THE MORNING BECOMING SOUTHWEST AROUND 5 MPH IN THE AFTERNOON.
THURSDAY NIGHT
CLEAR. LOWS 62 TO 70. NORTHWEST WIND AROUND 5 MPH
IN THE EVENING BECOMING NORTHEAST 5 TO 10 MPH AFTER MIDNIGHT.
FRIDAY
SUNNY AND HOT. HIGHS 103 TO 108.
FRIDAY NIGHT
CLEAR. LOWS 64 TO 71.
SATURDAY
SUNNY AND HOT. HIGHS 103 TO 108.
SATURDAY NIGHT
CLEAR. LOWS 65 TO 71.
SUNDAY
PARTLY SUNNY AND HOT. HIGHS 98 TO 104.
SUNDAY NIGHT
PARTLY CLOUDY. LOWS 62 TO 68.
MONDAY
PARTLY SUNNY AND HOT. HIGHS 95 TO 101.
MONDAY NIGHT
CLEAR. LOWS 61 to 67.
TUESDAY
SUNNY. HIGHS 94 TO 100.
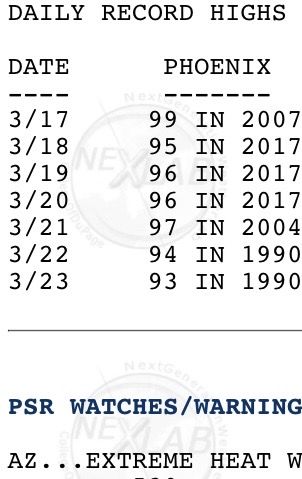
So, the forecast is for record highs tomorrow through Monday! Also, the earliest 100+ on record (records back to 1896) is March 26th. So, the forecasted 100+ on 3/19 would beat that by a week. In addition, March 20-21 are forecasted to possibly exceed 105! The record for all of April is 105 with April 20th being the earliest 105. The earliest 106+ is May 2nd. Wow, folks!
Extremely impressive, Larry!
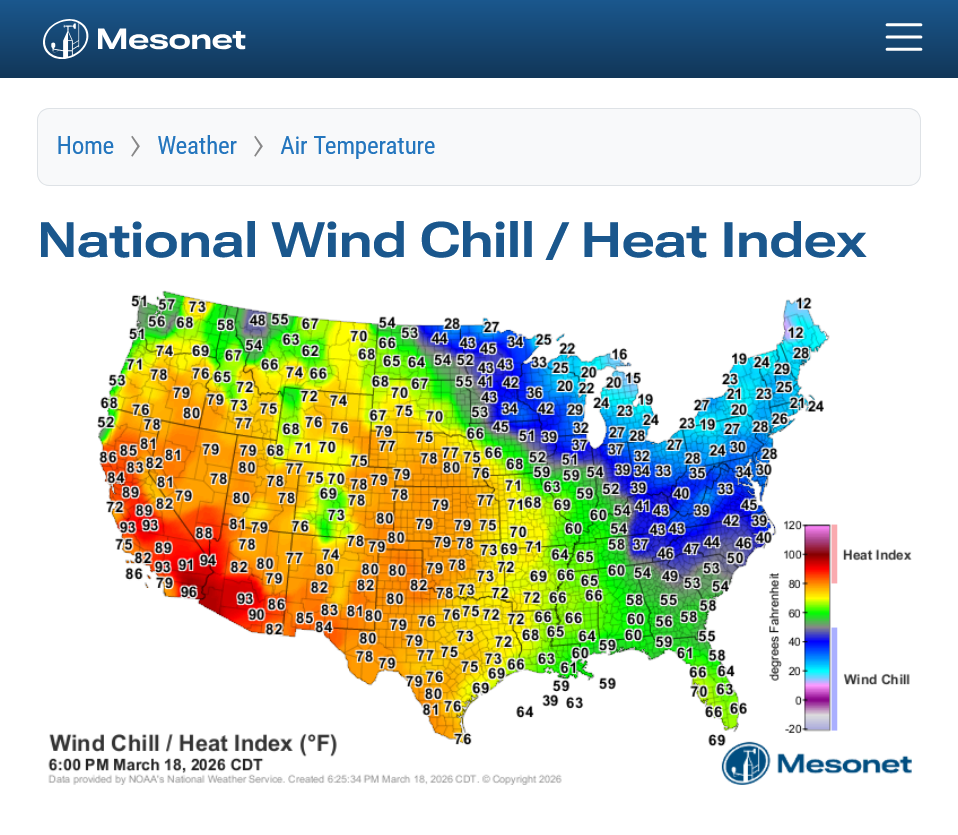
When it's very cold in the East, it's usually HOT in the West but this heat is off the record charts!
https://www.mesonet.org/weather/air-temperature/national-wind-chill-heat-index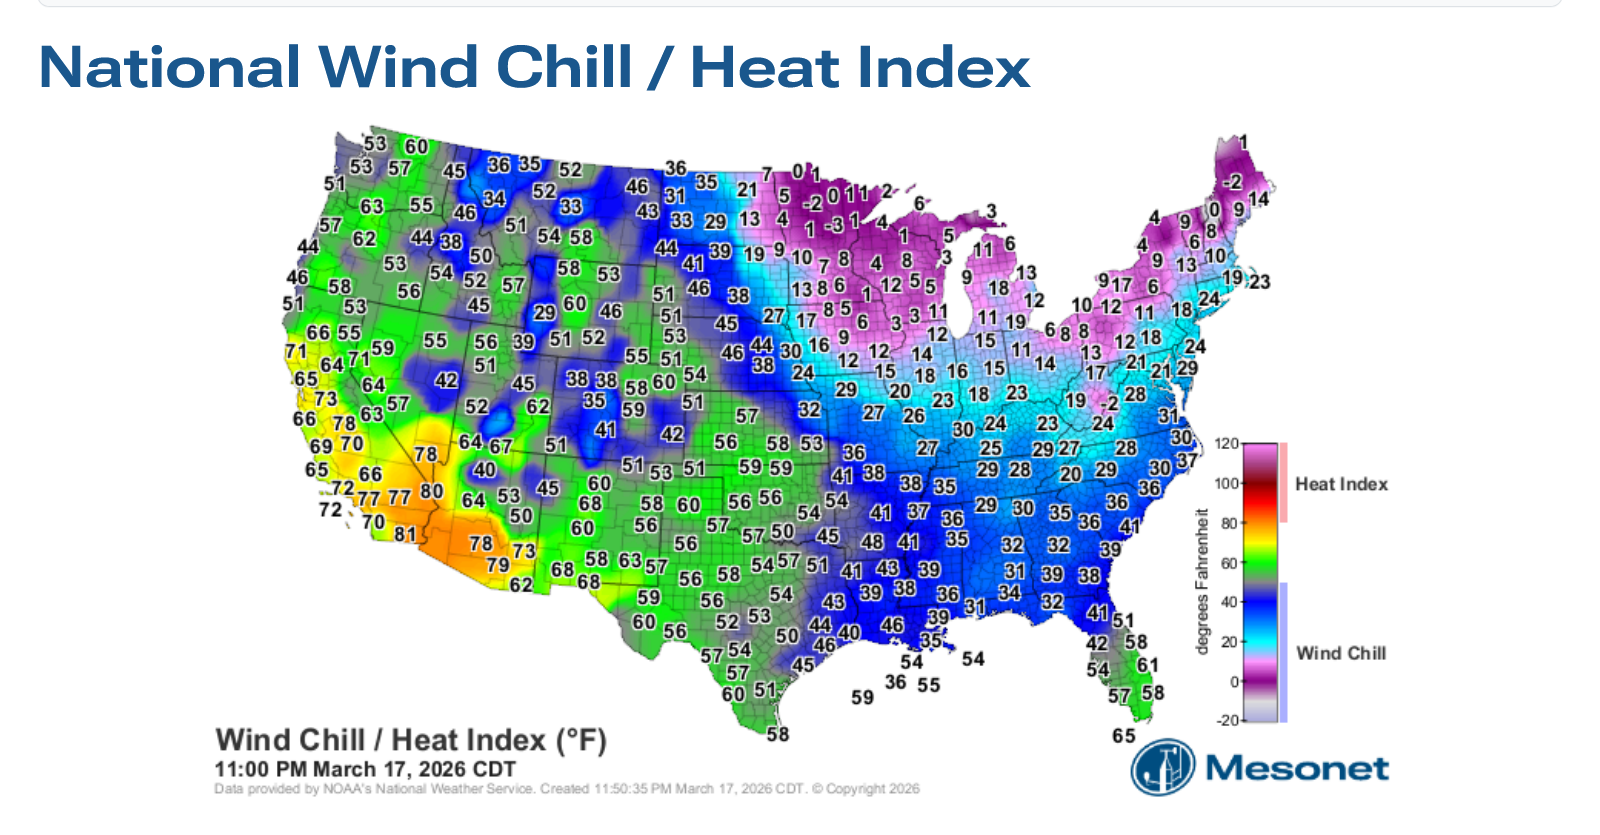
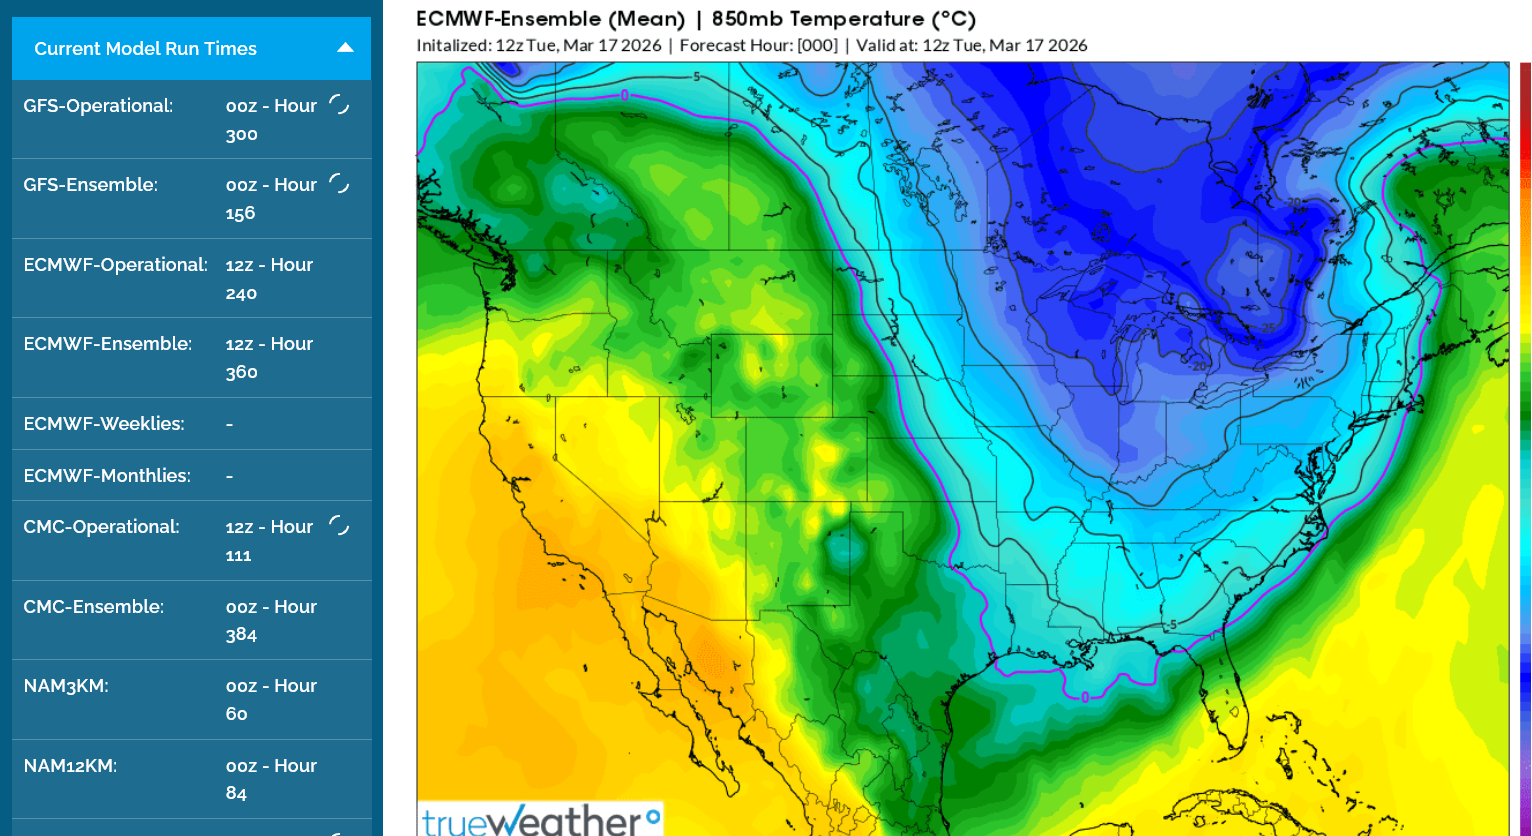
850mb temperatures from the European Ensemble model
850mb from the GEFS model
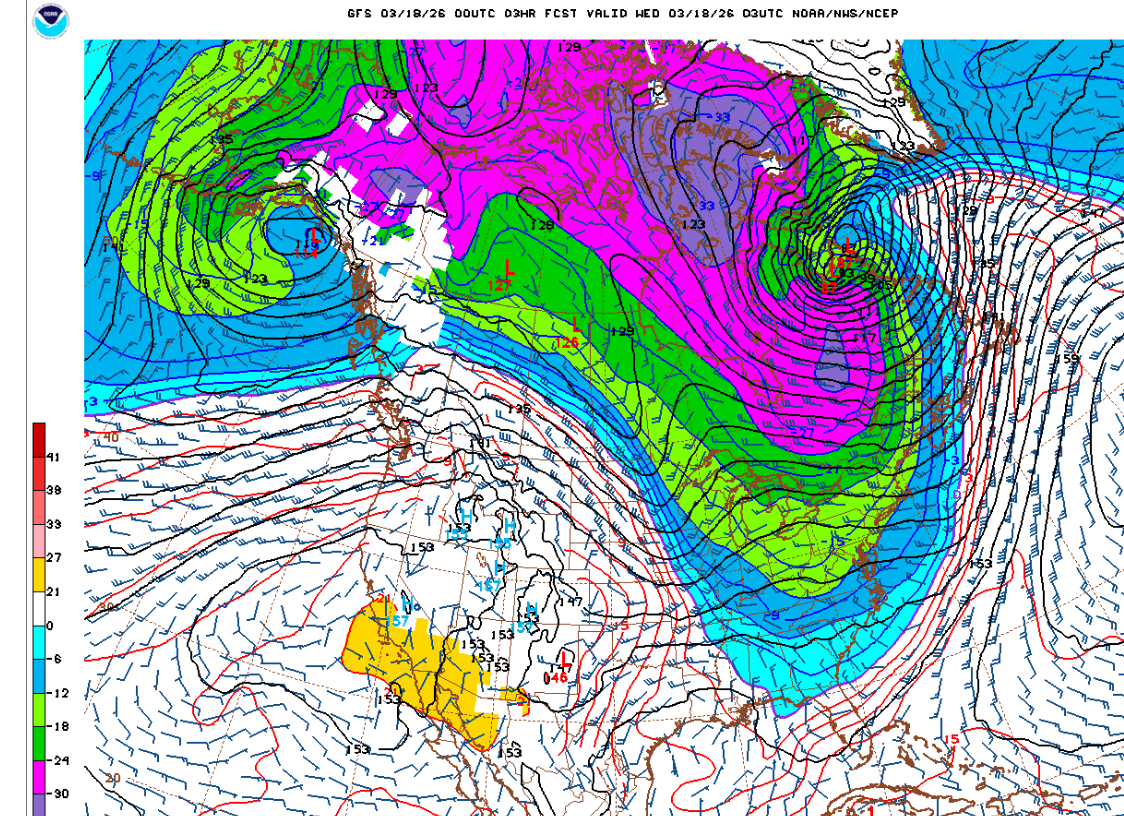
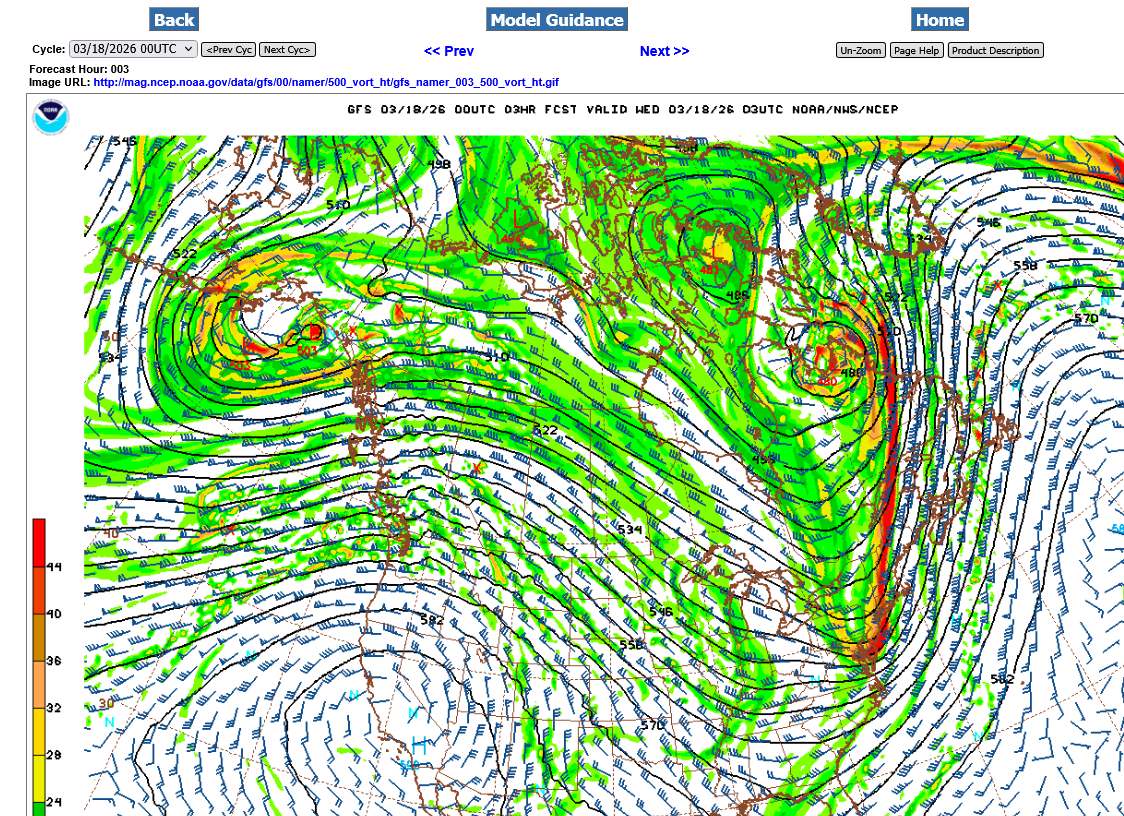
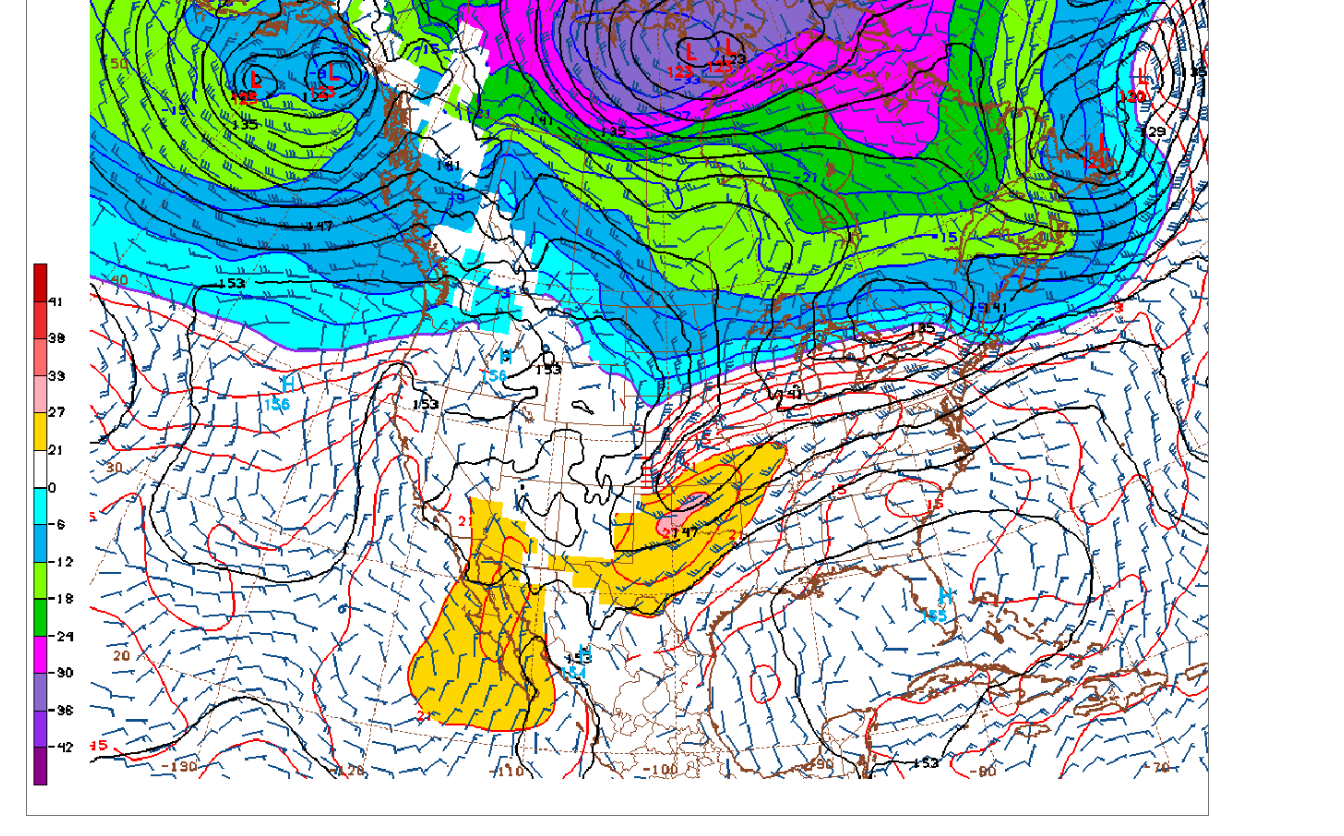
500mb from the GEFS model
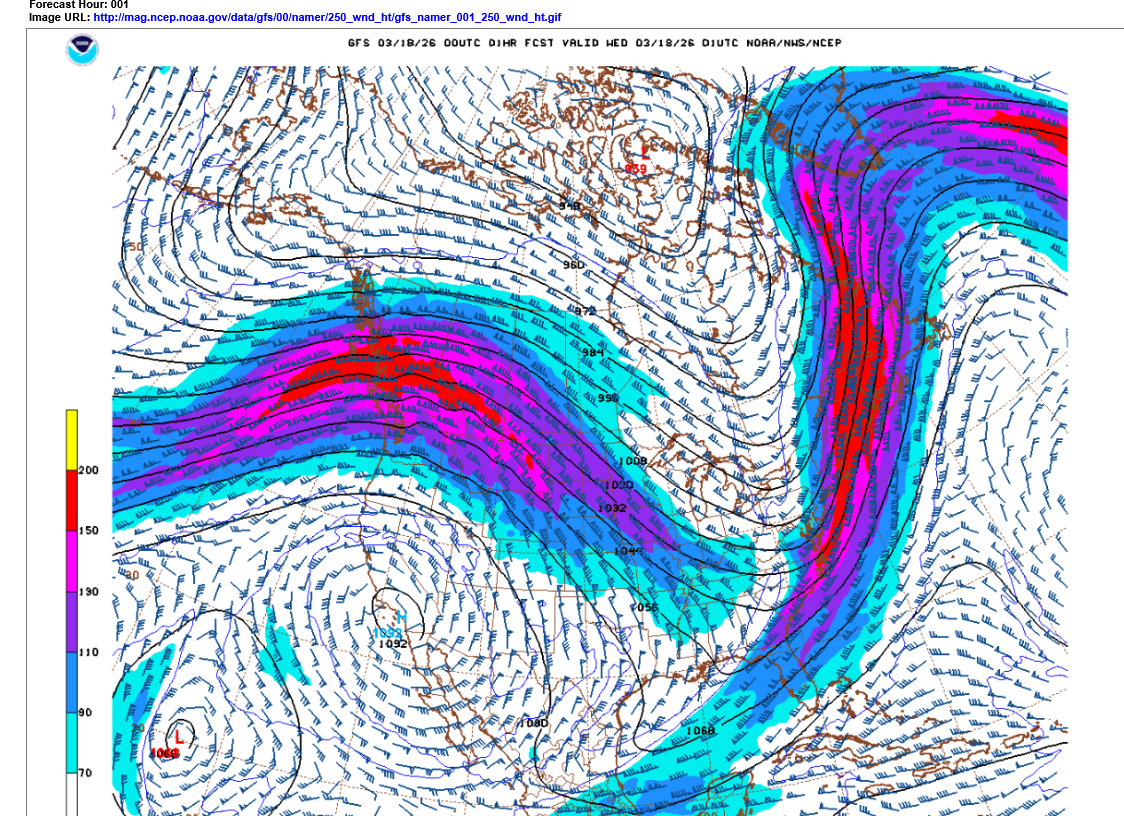
250 mb and jet stream from the GEFS
ASSESSING ATMOSPHERIC PRESSURES
AND HEIGHTS
Current Hazards at the link below.
For your NWS and county, go to the link below.
Then you can hit any spot on the map, including where you live and it will go to that NWS with all the comprehensive local weather information for that/your county.

What's interesting about the heat index in desert and very dry climates is that the extremely LOW humidity/dew point makes it feel COOLER.
So the Heat Index/feels like temperature is LOWER.
https://www.noaa.gov/sites/default/files/2022-05/heatindex_chart_dp.pdf
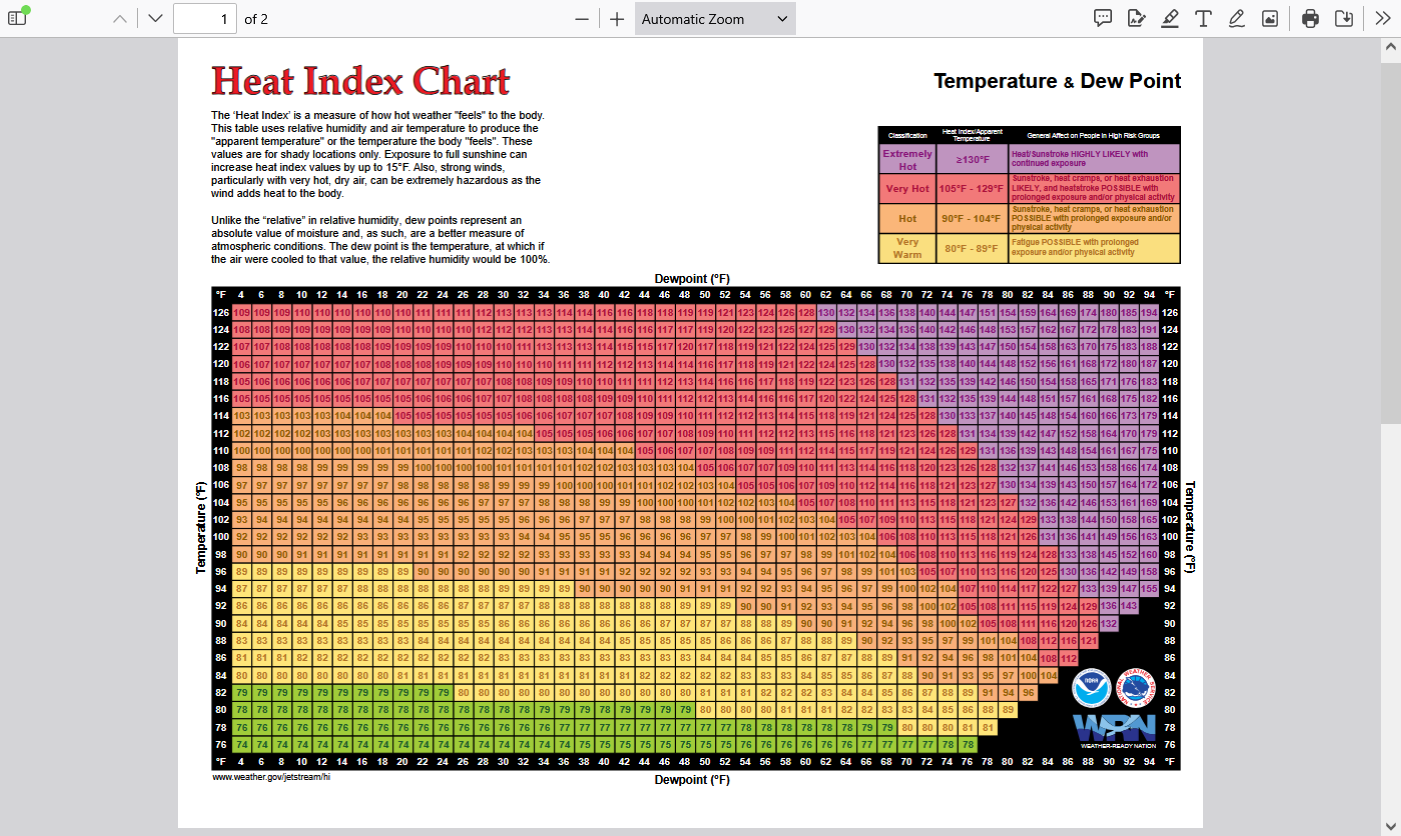
For instance the current temperature at this location near Phoenix is 100 degrees with a dew point of 20 degrees in the bone dry air. This results in a Heat Index of 94 degrees?
https://forecast.weather.gov/MapClick.php?x=211&y=190&site=psr&zmx=&zmy=&map_x=211&map_y=190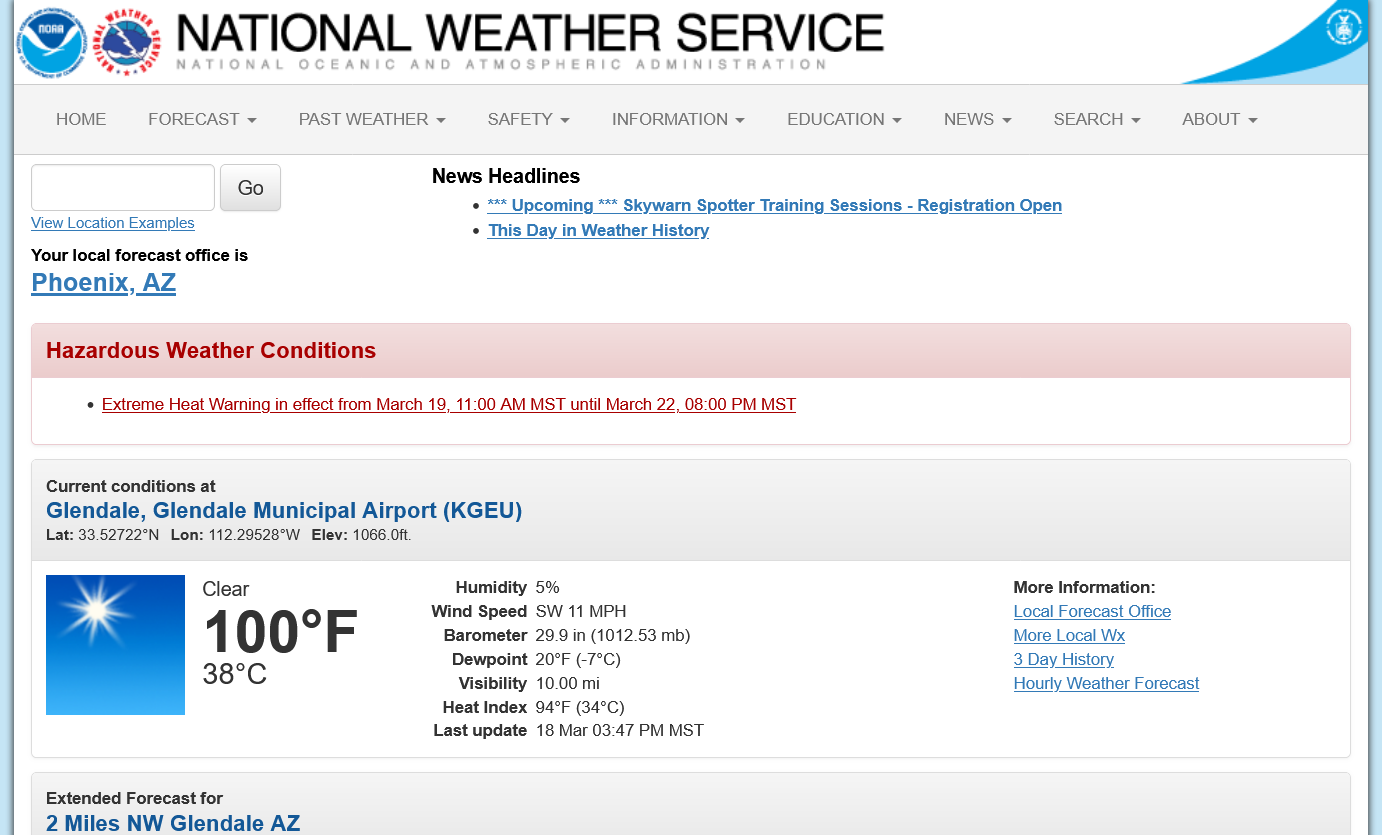
The accelerated evaporation of sweat(a cooling process) in the extremely dry air causes this.
Humid air has much less room for additional water vapor so it results in less evaporation and less cooling.
http://hyperphysics.phy-astr.gsu.edu/hbase/thermo/sweat.html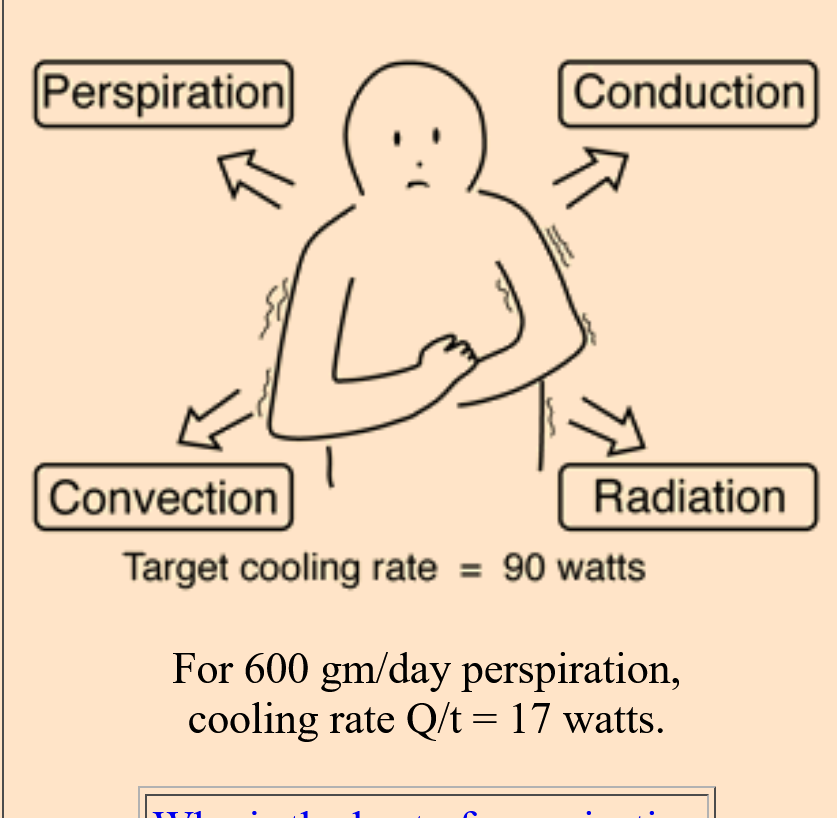
Phoenix was 102 yesterday (3/18), which is the earliest 100+ there by 8 days and that record was right at 100, which is the old hottest on record in March. The next record to watch is the alltime April record of 105, which has a pretty good chance to at least be matched during the next 3 days.
This is an unprecedented heat wave for this location in March!!!!
+++++++++++++
I'll make numerous, detailed comments on this in just a minute.
https://gml.noaa.gov/ccgg/trends/
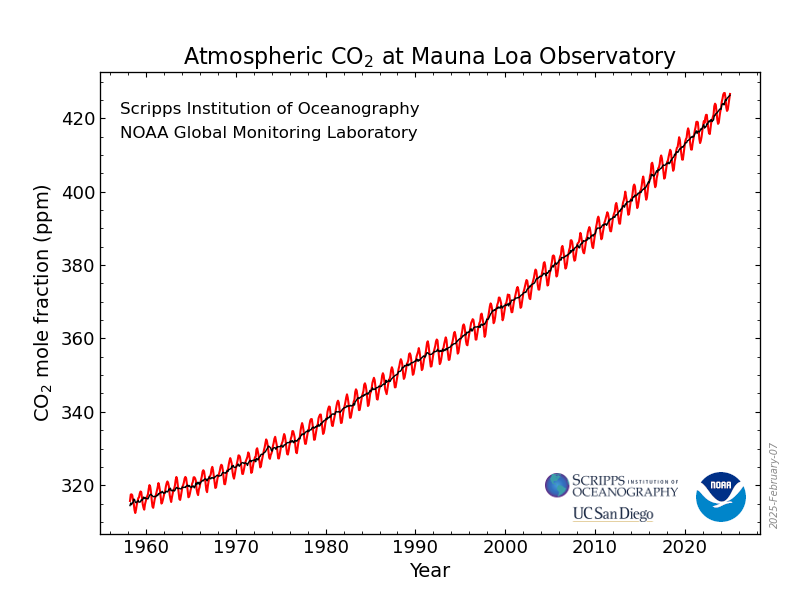
The increase in CO2 from ~290 ppm to close to 430 ppm over the last 150 years is mostly from the emissions of humans burning fossil fuels.
No question that the majority of the global warming in recent decades has been caused by the indisputable atmospheric physics from the increase of the BENEFICIAL greenhouse gas, CO2.
https://www.marketforum.com/forum/topic/118356/
However, the vast, VAST majority of people, including some climate scientists don't COMMUNICATE accurately what is really going on with the actual warming.
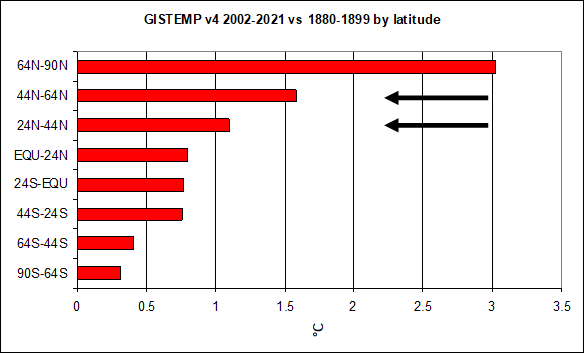
The pattern below shows that its the very high latitudes of the Northern Hemisphere that are being warmed the most by a wide margin. (the coldest places in the coldest times of year).
A huge part of this is:
1. The Southern Hemisphere is more water/ocean that takes longer to warm than land.
2. There are MANY more high population centers that are causing heat islands that are releasing "waste heat" in the mid latitudes of the Northern Hemisphere.
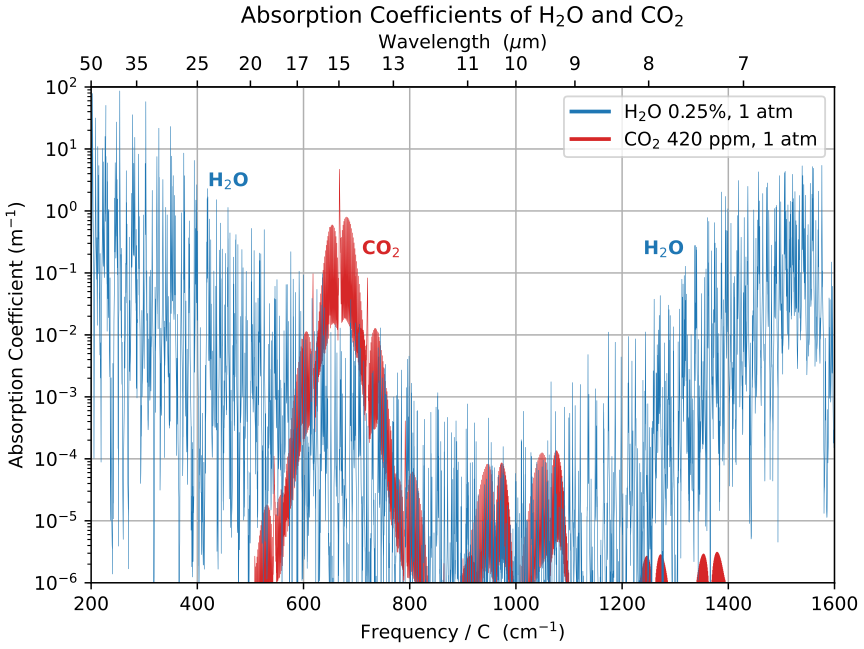
3. Now the big one. Many of the radiation absorption bands for CO2 OVERLAP with H2O. H2O is 95% of the planet's greenhouse gas effect(we would be a frozen wasteland without the BENEFICIAL greenhouse effect). Turns out that in areas with higher dew points, those overlapping absorption bands ARE ALREADY SATURATED by H2O!! In those cases and in those bands, it doesn't matter how much CO2 that you add. When they are already absorbing 100% of the long wave, heat radiation of what they are capable of because of water vapor/H2O, adding CO2 in those bands will have near 0 impact.
4. Now the kicker. Cold places lack water vapor in the dry air so CO2 will be impacting bands that are NOT saturated from H2O absorbing. We can see that on the graph above. However, DESERTS also lack water vapor, so they too are seeing a greater impact from CO2 than the rest of the planet at the same latitude. Even DESERTS located in already hot places, like Phoenix.
5. Turns out that DESERTS are warming at a similar, elevated rated to the Arctic.
6. The impact of increasing CO2 on temperature is also LOGARITHMIC. The more that you add, the less the impact.
++++++++++++++++++++++++++=
Why the Forcing from Carbon Dioxide Scales as the Logarithm of Its Concentration
https://romps.berkeley.edu/papers/pubdata/2020/logarithmic/20logarithmic.pdf
The radiation absorption bands of CO2 are almost saturated in the warm/humid areas of the planet because they overlap with the H2O absorption bands. This is why the warming has mostly been in the higher latitudes(and DESERTS).
https://commons.wikimedia.org/wiki/File:Longwave_Absorption_Coefficients_of_H2O_and_CO2.svg
And the warming in the tropics(where cocoa is grown) is MUCH LESS than that of the high latitudes of the Northern Hemisphere.
I will also add this from one of my favorite meteorologists:
By metmike - July 6, 2025, 6:42 p.m.
It really boils down to this, once again(CliffMass can be counted on as an elite source for using objective, authentic science)
https://cliffmass.blogspot.com/2016/03/the-golden-rule-of-climate-extremes.html
The GoldenRule
Considering the substantial confusion in the media about this critical issue, let me provide the GOLDENRULE OF CLIMATE EXTREMES. Here it is:
The more extreme a climate or weather record is, the greater the contribution of natural variability.
Or to put it a different way, the larger or more unusual an extreme, the higher proportion of the extreme is due to natural variability.
+++++++++++++++
So we are dealing with the same planet, same atmosphere, same weather systems, same laws of physics but with X amount of warming superimposed on it.
This is what that means.
1. Weather is still dominated by natural variability and this particular extreme would have happened with the old climate 100 years ago.
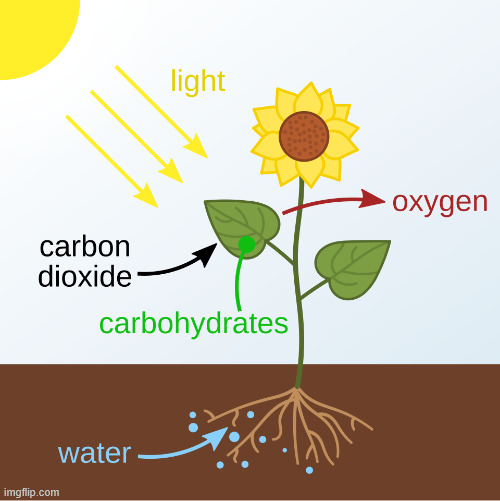
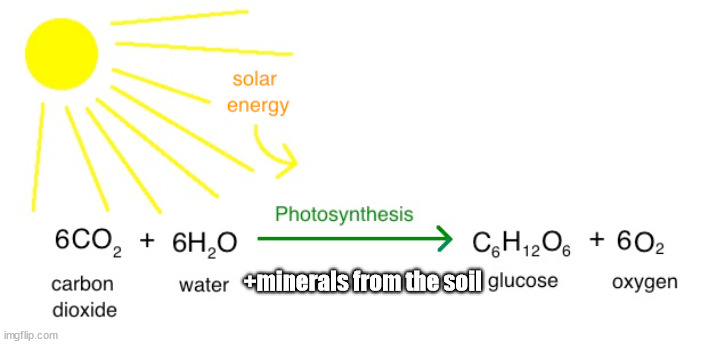
2. However, the planet IS warmer almost everywhere at variable rates. Some places, like in the US Cornbelt during the growing season the high temperature records have dropped because of the extremely high water vapor added by tightly packed rows of corn. This is an exception but CO2 warming is minimal at those times with really high dew points. Photosynthesis also,converts photons of powerful short wave radiation and kinetic enrgy(heat) into stored, potential chemical energy in the plants, as well as sequestering carbon that it extracts out of the CO2, releasing O2 as a waste product. It’s a miracle of nature and why CO2 is a massive beneficial gas to double the current amount which would be the OPTIMAL level for most life on this rapidly greening planet.
3. Deserts are seeing the complete opposite from having extremely LOW water vapor. Add that to the fact that dry air heats faster than moist air and we may be seeing as much or even more heating in the deserts as we have in the Arctic at certain times.
4. This current extreme weather pattern was NOT caused by climate change/global warming. However climate change with 100% confidence contributed to a good part of the extreme magnitude of the record highs. This is indisputable using the laws of atmospheric physics with the higher CO2 in this very dry location.
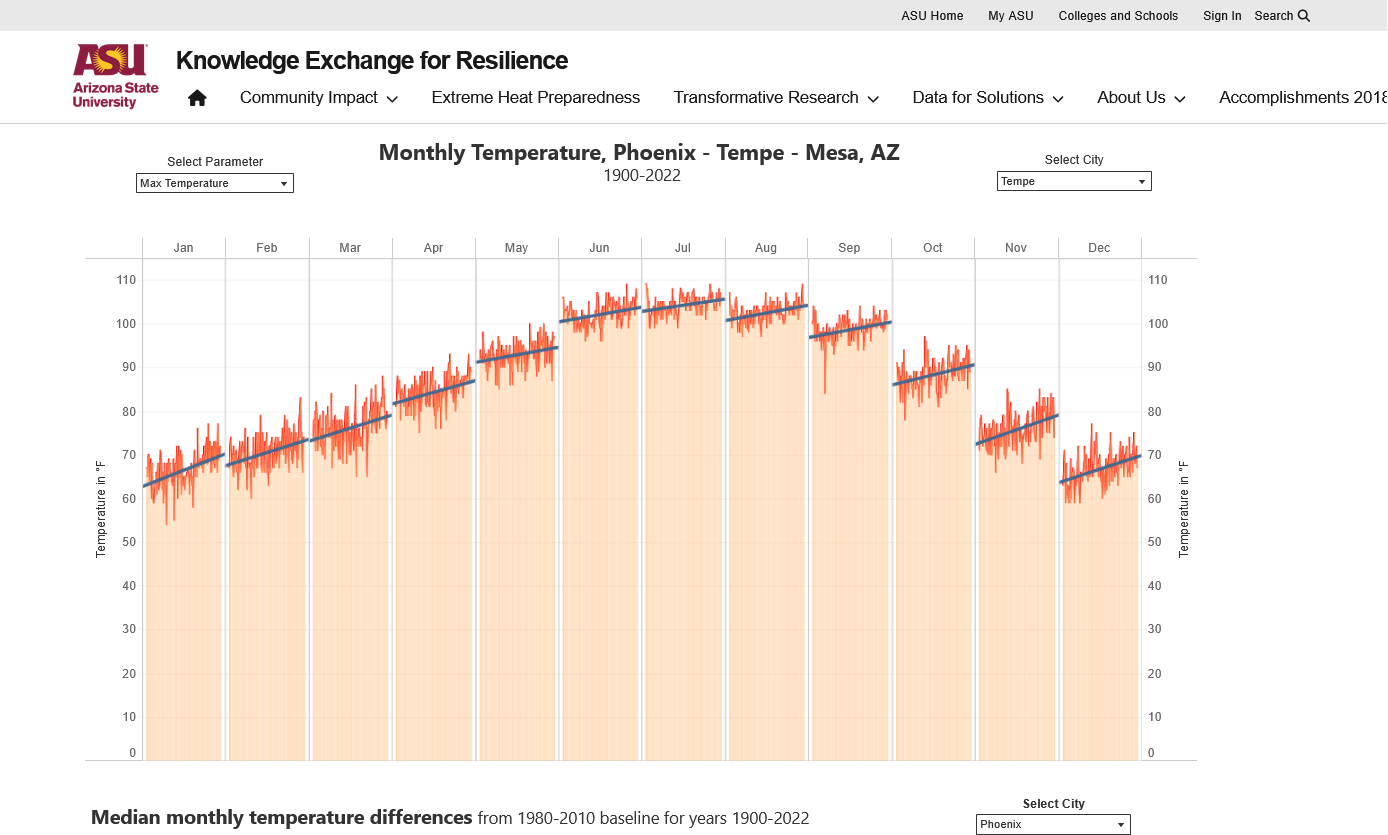
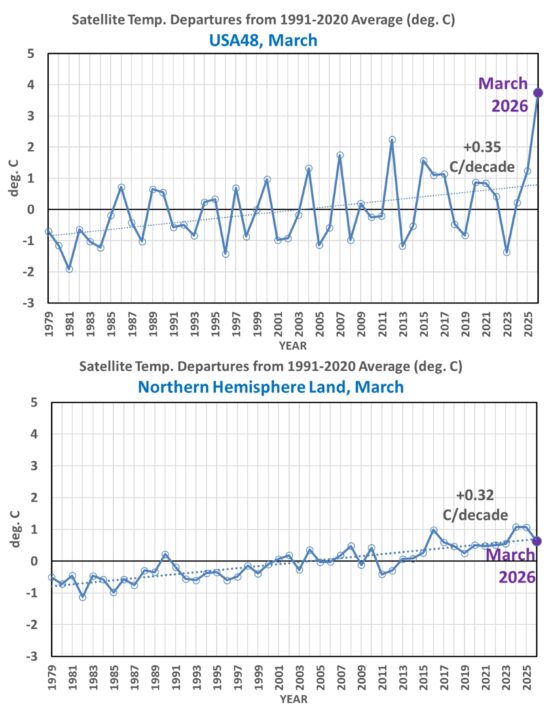
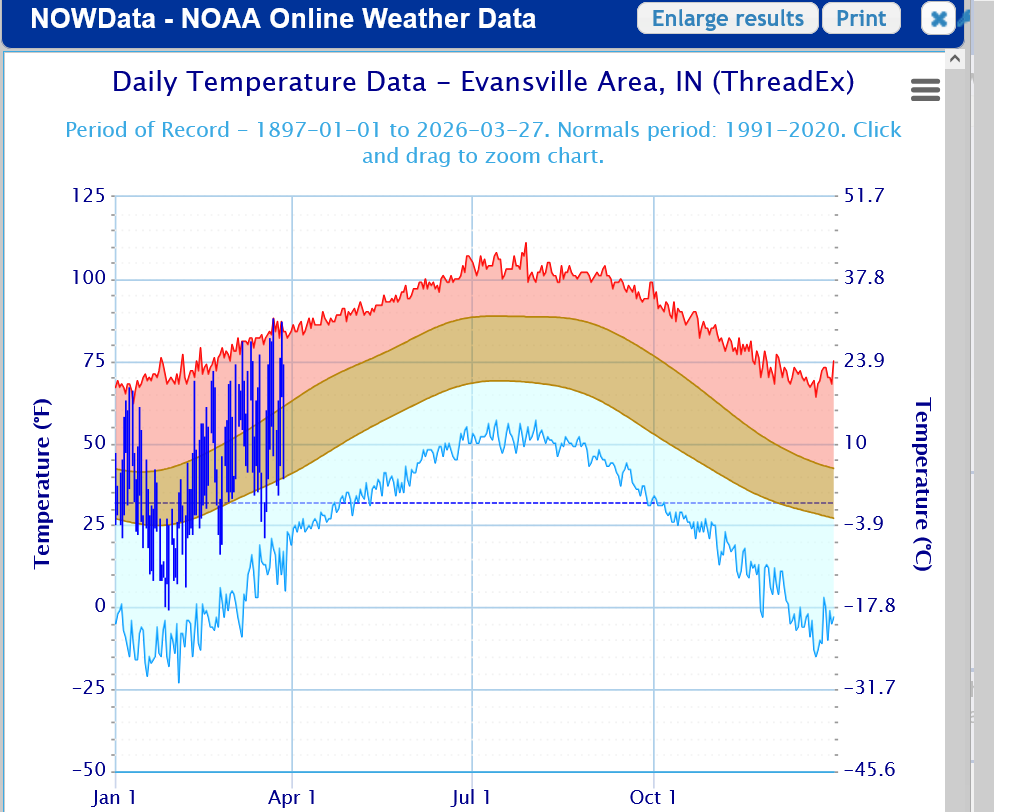
ADDED: 5. We can use authentic, empirical data below to estimate with confidence how much hotter it is with this current heat wave in this location(because of the greatly amplified greenhouse gas effect in the bone dry air) by looking at the graph below. THIS AUTHENTIC SCIENCE! Looking at the graph for March and the actual trendline going from ~73 to ~79, I feel confident in stating that we are 6 Deg. F hotter than 100+ years ago at this location. Granted, we were recovering from the natural Little Ice Age and there has been some local heat island effect adding to the greenhouse effect but the VAST, VAST majority is from the increase of CO2 in this very dry air. So attributing 5 deg. F of this heat wave to the added CO2 should be a very liberal assessment to assign ALL the impact from the added CO2.
6. The rest of the planet is heating up at less than half this rate and the majority of the heating is during the cold weather seasons when the AIR IS DRY. Warm, humid times of year are NOT seeing as much heating. Mainstream science, instead of telling us that and explaining the authentic science, uses this heat wave as an example to apply to the entire planet.
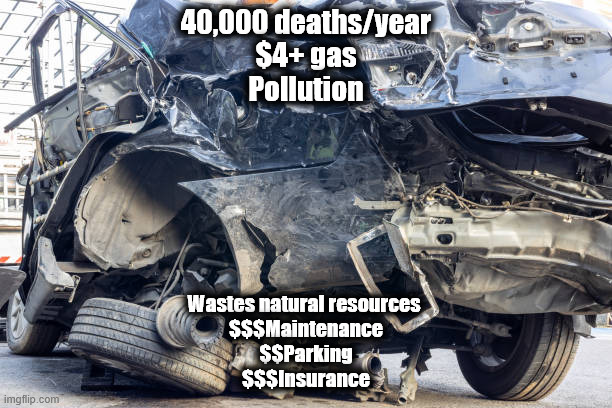
7. We know how biased they are in doing this, not just from the lack of explaining the authentic science of very dry(cold) air having greatly amplified heating which could just be ignorance but they intentionally leave out the massive benefits CO2 which is greening up the planet, the complete opposite of killing it with a FAKE climate crisis. This would be like reporting on the use of automobiles since they replaced horses 150 years ago by only telling us about how many people get killed in car accidents every year and leaving out ALL the benefits that automobiles have gifted the human race with the past century+. Automobiles should be banned because they kill 40,000 people every year!!!
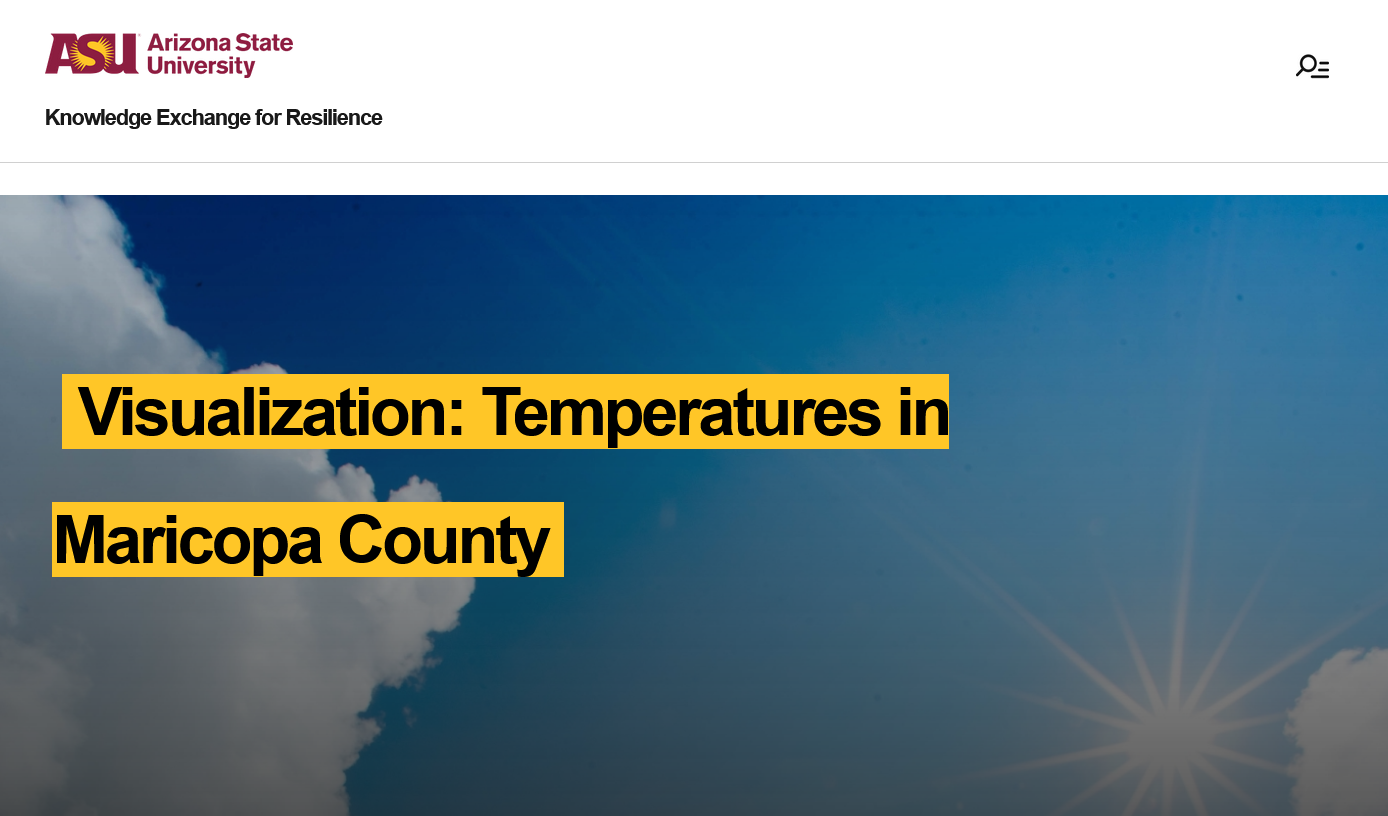
https://resilience.asu.edu/temperature
The biggest problem that we have is one side telling us ONLY about the bad things from the increase in beneficial CO2. As if there isn't anything good about a beneficial gas, at only half the optimal level for life going up.
Like.............25% more food thanks to atmospheric fertilization of crops and 25% more greening of the planet which is providing more food for ALL the creatures on this planet isn't worth mentioning.
Instead, LIE about climate change and tell us that models are predicting smaller crop yields from heat and/or droughts. WRONG!
Programming models with bad equations to simulate, impossibly extreme scenarios out to 2100 is NOT authentic science.
Taking observations of empirical data of the REAL world is.
The verdict was in decades ago. The increase in beneficial CO2 has at least an order of magnitude more benefits to life than negatives. When it was bit warmer than this between 9,000 to 6,000 years ago, it was called the Holocene climate OPTIMUM ...........and that was without the massive increase in CO2.
So this current age is a climate OPTIMUM on CO2 steroids for almost all the life on this planet.
Is it slightly worse if you live in a desert? Yes, but what did we expect in a desert???
Is it slightly worse if you live along a coastline? Yes, but what did people that developed along a coast and in hurricane alley expect?
Is it massively better in many places, especially the extra CO2 in the US Cornbelt where we actually grow crops EVERY year and where weather matters the most by a Grand Canyon wide margin?
Yes and that crushes the negative of more heat waves in deserts where people who moved there, did it because they ACCEPTED HEAT and expected it to be a desert not a place to grow crops.
This is 2026 not 1926 with adaptation in the especially hot places. Cold still kills 10 times more humans than heat on this planet every year (used to be 20 times until climate change made it better) and 200 times more life with climate change making that better.
During the Summer, we will be bombarded by stories about how climate change is making heat waves worse(not so in the Midwest) but during the Winter, when the temperature drops to 0, we don't ever read stories about how it would be EVEN COLDER without climate change. That NEVER happens.
In fact, they will often try to convince us that the extreme cold was caused by climate change.
The point is that all the media stories tell us about the bad things only, that includes greatly exaggerating them and using JUNK science to convince people that the current climate OPTIMUM is actually a climate CRISIS.
The main thing that I want is to use empirical data/facts/principles to educate people with authentic science that gives people the objective, comprehensive picture in an honest form.
Death by GREENING!
52 responses |
Started by metmike - May 11, 2021, 2:31 p.m.
https://www.marketforum.com/forum/topic/69258/
++++++++
Here's another recent discussion:
CO2 Finally Exonerated!!
33 responses |
Started by metmike - March 2, 2025, 8:56 p.m.
https://www.marketforum.com/forum/topic/110244/
Thanks, Mike.
——————
Fwiw this article was just released:
https://www.yahoo.com/news/articles/early-southwest-heat-latest-parade-070743575.html
Note this paragraph:
“Climate scientists at World Weather Attribution did a flash analysis — which is not peer-reviewed yet — of whether climate change was a factor in this Southwest heat wave. They compared this week's expected temperatures to what's been observed in the area in March since 1900 and computer models of a world with climate change. They found that ‘events as warm as in March 2026 would have been virtually impossible without human-induced climate change.’”
Any opinions about this article?
Thanks very much, Larry!!!
This is a great topic!
I added this to my previous assessment based on authentic climate science and the objective truths. Apply that to this article which misses the mark on honest OBJECTIVE science by suggesting the entire planet is seeing this unique greatly amplified (by a factor of 5 compared to warm/humid places in the hottest times of year) impact.
They decided to add the impacts from flooding and hurricanes in addition to heat and absurdly(this is when they really show that they are not reporting authentic science but instead, are a mouthpiece of fake climate crisis propaganda it) that climate change is causing more extreme cold.
Yet, according to them...............not 1 benefit on a massively greening planet experiencing a climate OPTIMUM for life.
From the article:: "The area of the U.S. being hit by extreme weather in the past five years has doubled from 20 years ago, according to the National Oceanic and Atmospheric Administration's Climate Extremes Index, which includes various types of wild weather, such as heat and cold waves, downpours and drought."
metmike: Anybody counting cold waves as part of the climate crisis from global warning is clearly not presenting honest science. This is up = down science. There is much more warming from REAL climate change during the coldest times of year and coldest times of day(night time lows). This has REDUCED the number of deaths from cold on the planet but its still 10 times more than deaths from heat. I'm well aware of what Arctic Amplification can do but ALL the honest weather records show LESS extreme cold and LESS record cold temperatures compared to the climate before CO2 warmed it. It's absurd science to cherry pick individual cold waves and blame them on climate change but ignore the vast, VAST majority of the Winters that feature LESS cold.
++++++++++++++++++++++
Added comments below:
Re: Re: Re: Re: Historic SW US March heatwave
By metmike - March 19, 2026, 2:37 p.m.
ADDED: 5. We can use authentic, empirical data below to estimate with confidence how much hotter it is with this current heat wave in this location(because of the greatly amplified greenhouse gas effect in the bone dry air) by looking at the graph below. THIS AUTHENTIC SCIENCE! Looking at the graph for March and the actual trendline going from ~73 to ~79, I feel confident in stating that we are 6 Deg. F hotter than 100+ years ago at this location. Granted, we were recovering from the natural Little Ice Age and there has been some local heat island effect adding to the greenhouse effect but the VAST, VAST majority is from the increase of CO2 in this very dry air. So attributing 5 deg. F of this heat wave to the added CO2 should be a very liberal assessment to assign ALL the impact from the added CO2.
6. The rest of the planet is heating up at less than half this rate and the majority of the heating is during the cold weather seasons when the AIR IS DRY. Warm, humid times of year are NOT seeing as much heating. Mainstream science, instead of telling us that and explaining the authentic science, uses this heat wave as an example to apply to the entire planet.
7. We know how biased they are in doing this, not just from the lack of explaining the authentic science of very dry(cold) air having greatly amplified heating which could just be ignorance but they intentionally leave out the massive benefits CO2 which is greening up the planet, the complete opposite of killing it with a FAKE climate crisis. This would be like reporting on the use of automobiles since they replaced horses 150 years ago by only telling us about how many people get killed in car accidents every year and leaving out ALL the benefits that automobiles have gifted the human race with the past century+. Automobiles should be banned because they kill 40,000 people every year!!!

How many people will read that article and be able to recognize the flawed and dishonest science presented from actual experts??
The sad thing is that this is actually the blatantly biased view of MAINSTREAM CLIMATE SCIENCE and I strongly disagree with them for the authentic science reasons presented here using indisputable empirical data from an OBJECTIVE atmospheric scientist for over 4 decades.
In the 1990's, I was on that side but was baffled about how there was never a mention regarding the massively beneficial role of increasing CO2 and photosynthesis. After the internet allowed me to gain access to the EMPIRICAL DATA, I was able to see the scientific truths and appreciate that the entire field of climate science has been horribly corrupted. Young scientists have been indoctrinated into climate religion that uses simulations of the atmosphere based on flawed models going out 100 years and worship that instead of actually looking at the planet massively greening up. Year after year after year. The empirical data/observations keep trumping the simulations of a modeled/predicted climate crisis that never happens
They twist and distort interpretations, exaggerate the frequency of extremes and most importantly, NEVER present the other side of a greening planet with life on the planet BEGGING FOR MORE CO2 up to the optimal level of 900 ppm with is more than double the current level and there is not chance of us getting that high because fossil fuels will be RUNNING OUT before this century is over. They project out to 2100 with the assumption that CO2 will keep going up at this same rate. There is a near 0% chance of that!
Besides the impact of increasing CO2 on warming being logarithmic (less and less as you add more and more) the crisis will happen later this century when we start running out of fossil fuels and atmospheric CO2 starts dropping.
I won't be around for it but its a near certainty, that when CO2 levels start plunging that we will then start to see the REAL CRISIS and look back at this age of junk climate science, the same way as we see science in ignorant human history that thought the sun revolved around our planet and that the earth was flat.
I described it in more detail here:
Re: Re: Re: Re: Re: CO2 Finally Exonerated!!
By metmike - Feb. 13, 2026, 10:15 a.m.
Hey Mike,
If they had said that CC had caused an increase in cold waves, I’d also protest. But they weren’t saying that. They were just saying that the Climate Extremes Index includes cold. For the Southwest, extreme cold has all but disappeared in recent years. Admittedly, this was confusingly worded.
The new hottest in CA in March, set today, is 112. That’s only 1 short of the April hottest!
Yuma’s hottest on record in March prior to 2026 was 102. Yesterday was 106 and today was 109!! The earliest 109 prior to today was May 2nd (1947), when it was 111!
CC is almost certainly a major contributor to allow for this insanity to happen.
-Phoenix has set new (or tied) daily record highs 28 times during the last 365 days.
-94 of the 366 days have record highs there set in 2023-6 due mainly to CC but with UHI also being a factor although UHI is normally more of a factor for warm lows.
-There are a mere 3 record lows set since 1980!
Today was the 3rd day in a row of Phoenix hitting 105, which not only obliterates another daily record but also again ties with the hottest on record in April. The day prior to the 105 string was 102. Prior to this string, the hottest on record in all of March was only 100, set on March 26th in 1988.
More 100+ days are quite possible next week! Crazy!
"If they had said that CC had caused an increase in cold waves, I’d also protest. But they weren’t saying that. They were just saying that the Climate Extremes Index includes cold. For the Southwest, extreme cold has all but disappeared in recent years. Admittedly, this was confusingly worded."
Thanks very much, Larry!
Not 1 bit confusing to me.
"The area of the U.S. being hit by extreme weather in the past five years has doubled from 20 years ago, according to the National Oceanic and Atmospheric Administration's Climate Extremes Index, which includes various types of wild weather, such as heat and cold waves, downpours and drought."
++++++++++++
They are peddling a climate crisis and clearly NOT educating readers with authentic, objective science.
Like you said, one of the benefits of climate change is an equal and opposite impact(benefit) in the Winter from less cold, the flip side of the coin, just as the Summers are worse from more heat.
Educating with honest science would at least mention that benefit of less cold in the WInters but instead, they did the opposite by including the cold as part of the negative. That Climate Extremes Index is not LIMITED by those 4 elements either but they decided to list those 4.
I would also disagree with an increase in drought.
If they wanted to be honest, they would have just listed the REAL elements that are increasing. Heat and heavy downpours.
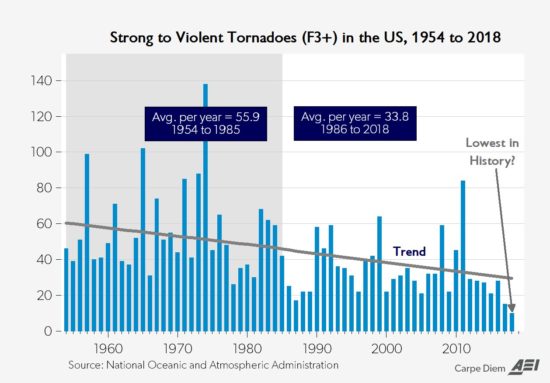
Added: They could have mentioned violent tornadoes which is as extreme as it gets. That decreased by 50% because of warming the highest latitudes the most. When will that ever get a mention in a discussion like this?
During a severe weather outbreak?
Nope.
During a non severe weather event?
Nope!
Answer: NEVER.
In what world does the huge reduction in violent tornadoes deserve to NEVER be discussed?
The one being manufactured to get people to believe thclimate optimum is a climate crisis.
As mentioned earlier, this would be like a discussion about cars only telling us:
1. They kill 40,00O people each year.
2. They cost a lot of money. Not just to buy one. You need insurance. Look at gas prices right now. OMG, we have an automobile crisis that’s getting worse! They use up natural resources and cause pollution. You have to pay for parking and it’s hard to find in big cities. Clearly, we should ban vehicles. We MUST ban vehicles to save the planet!
That actually makes way more sense than vilifying a beneficial gas at half the optimal level in the middle of a climate OPTIMUM.
That’s last sentence makes no sense to most people because up has been defined as down for people indoctrinated into climate crisis religion.
The only reason that we all know that my description of cars is a 1 sided biased, manufactured reality and complete nonsense is because we all USE CARS EVERY DAY. We understand what they are and what they do for us.
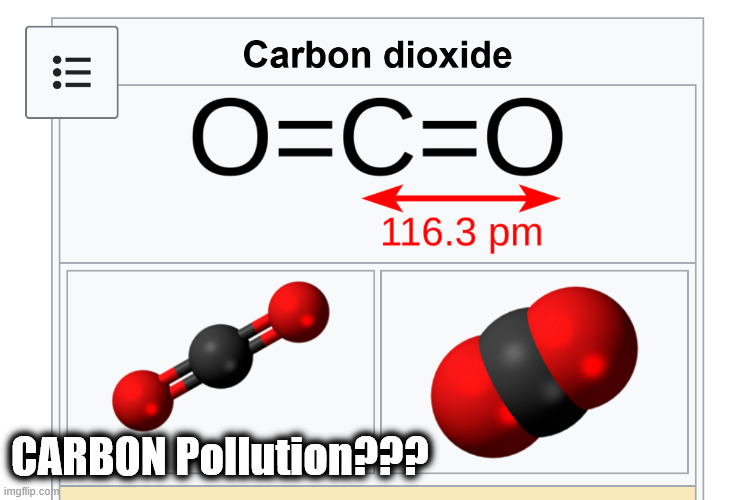
The reason that they can get away with this same tactic in climate science is that people are not atmospheric scientists that understand the physical laws of the atmosphere. They don’t have the data that I just shared. What they know about it comes from thousands of biased articles that intentionally only tell us bad thing about a climate crisis and climate pollution or absurdly, carbon pollution because the beneficial GAS CO2 has an atom of carbon in it(just like our food and bodies that are not carbon pollution)
This comes from message gatekeepers that have HIJACKED CLIMATE SCIENCE. They have even rewritten climate history to take out the medieval WARM period, 1,000 years ago and the Holocene Climate OPTIMUM from around 9,000 to 5,500 years ago That’s why last was WARMER than this is the higher latitudes with less Arctic sea ice.
Intentionally, because that warmer weather contradicts the fake climate crisis narratives.
People don’t have weather and climate records, or a vast understanding of the climate. That’s why we are all told to believe the experts. Believe the (hijacked) climate science. The version that only tells us bad things, and greatly exaggerate those, ignoring ALL the much bigger good things.
++++++++++++++++
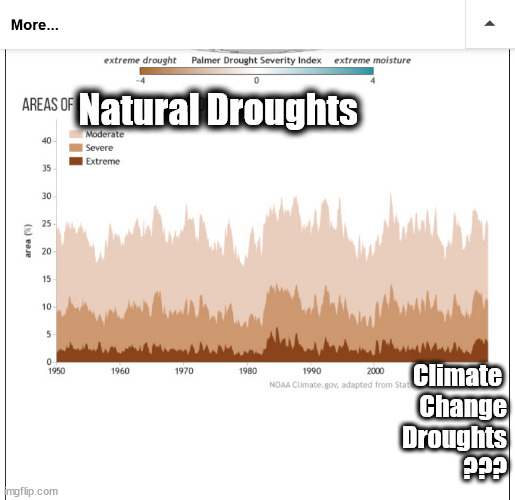
Tell me which droughts in the last 35 years were natural and which were from climate change? The Western US has had an increase in drought, while the US Midwest (where crops are grown) has had the least amount of drought in history
https://www.climate.gov/news-features/featured-images/2017-state-climate-global-drought
Look at how all that supposed extreme weather is impacting humans:
+++++++++++++++++
T H E L A N C E T C O U N T D O W N O N C L I M AT E C H A N G E
THE NEED FOR CONTEXT
The Global Warming Policy Foundation
Report 41
https://www.thegwpf.org/content/uploads/2020/05/LancetCountdown-1.pdf
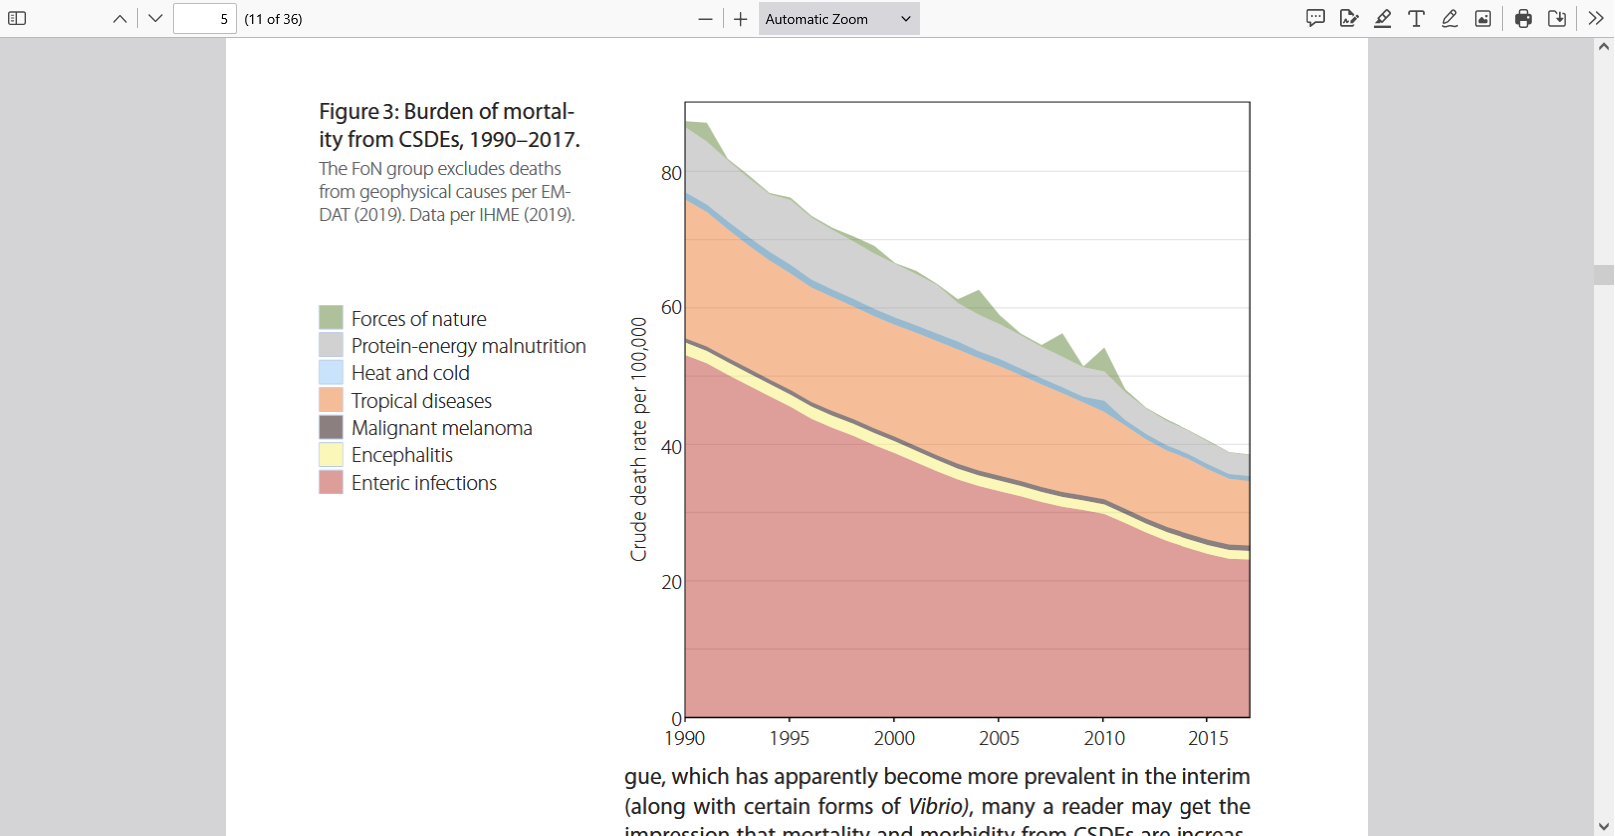
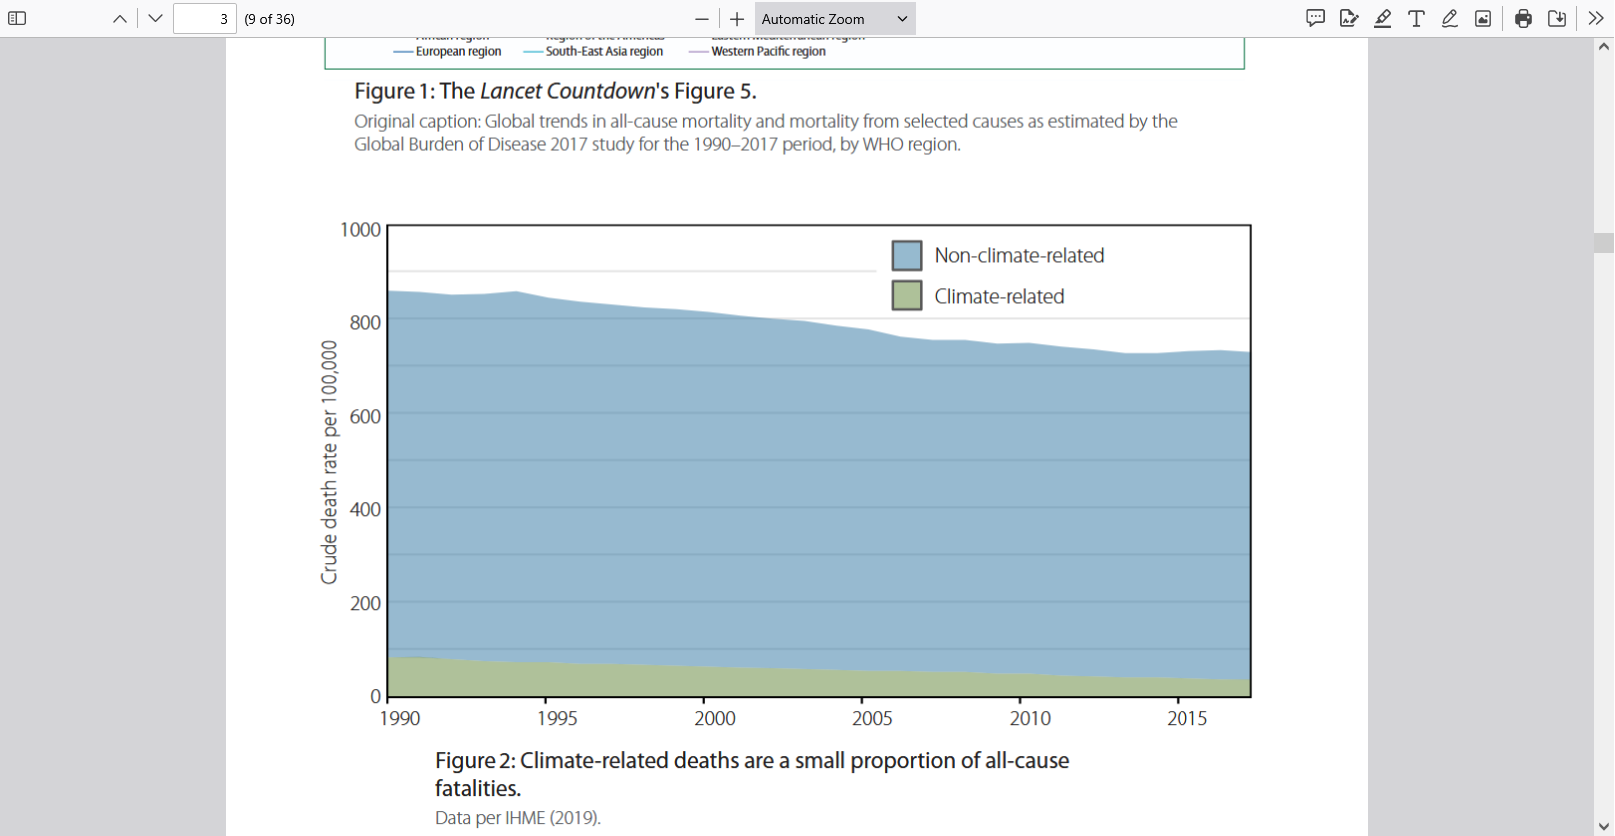
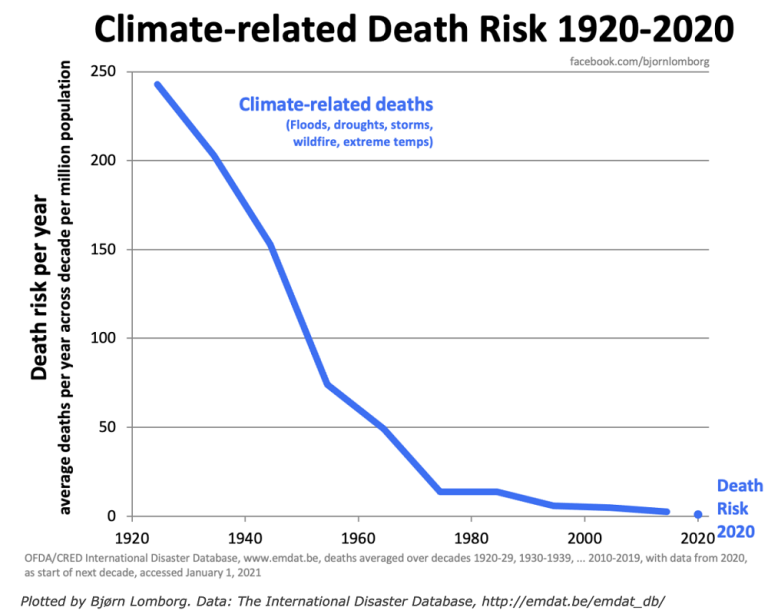
Climate related deaths and non climate related deaths from 1990 to 2017. There are 2 main things to note:
1. Climate related deaths are a small fraction of non climate related deaths.
2. Climate related deaths have dropped 50% over the last 3 decades.
If you also dial in the massive increase in food from atmospheric fertilization from beneficial CO2 and the continuation of the slow beneficial warming on this greening planet, you clearly have a climate OPTIMUM not a crisis.
This is the empirical data that defines the authentic science. Anybody that says something different is either ignorant of the authentic science or deceiving ......that includes any brilliant scientists with numerous degrees.
++++++++++++
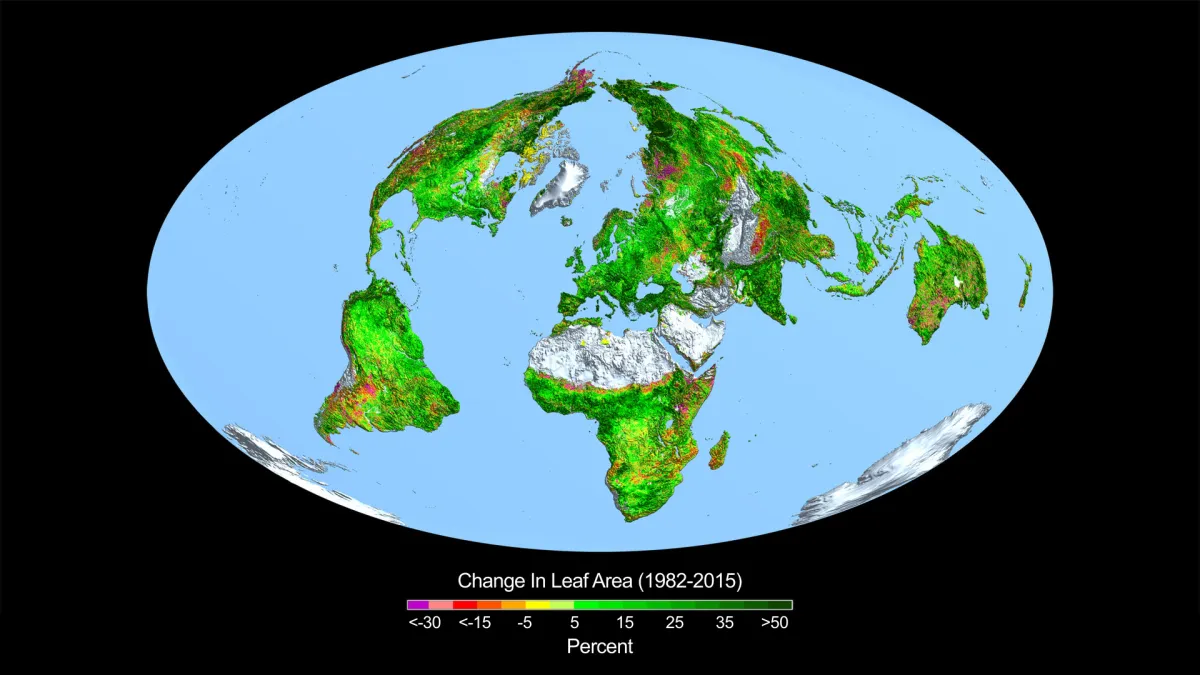
https://earthobservatory.nasa.gov/images/146296/global-green-up-slows-warming
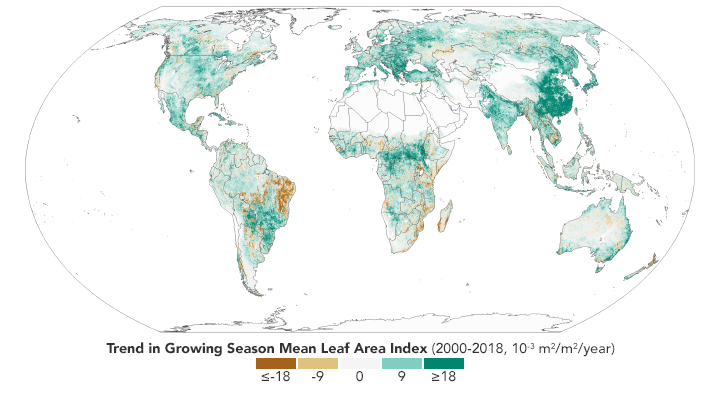
"The paper’s authors reviewed more than 250 published articles that have used satellite data, modeling, and field observations, to understand the causes and consequences of global greening. Among the key results, the authors noted that on a global scale greening can be attributed to the increase of carbon dioxide in the atmosphere. Rising levels of carbon dioxide increase the rate of photosynthesis and growth in plants."
metmike: Why isn't this paper, based on 250........let me repeat that number 250 published articles using the best technology known to science............getting much news coverage?
Because they don't want you to know this.
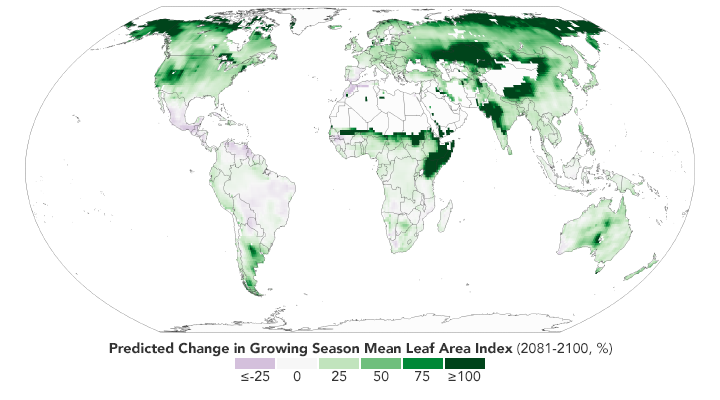
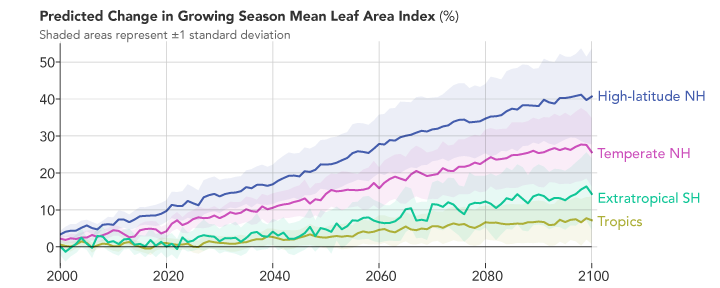
From the projections: According to climate models, the future looks even greener. The second map shows what the green-up might look like in the future based on the Coupled Model Intercomparison Project (CMIP5) climate model, under a scenario in which increases in greenhouse gases lead to almost 5° Celsius (9° Fahrenheit) of warming by the end of the 21st century. Specifically, it shows the predicted change in the growing season’s “leaf area index” from 2081-2100 relative to 1981-2000. The chart below the map shows the predicted changes by latitude. Notice that high latitudes in the Northern Hemisphere are still expected to change the most.
metmike: There is almost no chance we will see that amount of warming.
+++++++++++++=
Turns out that increasing CO2 makes all plants more drought tolerant/water efficient, so DESPITE the additional heat in deserts, they are GREENING UP from the additional CO2.
https://phys.org/news/2013-07-greening-co2.html

Satellite data shows the per cent amount that foliage cover has changed around the world from 1982 to 2010.
Increased levels of carbon dioxide (CO2) have helped boost green foliage across the world's arid regions over the past 30 years through a process called CO2 fertilisation, according to CSIRO research.
+++++++++++++
https://www.nasa.gov/technology/carbon-dioxide-fertilization-greening-earth-study-finds/
From a quarter to half of Earth’s vegetated lands has shown significant greening over the last 35 years largely due to rising levels of atmospheric carbon dioxide, according to a new study published in the journal Nature Climate Change on April 25.
An international team of 32 authors from 24 institutions in eight countries led the effort, which involved using satellite data from NASA’s Moderate Resolution Imaging Spectrometer and the National Oceanic and Atmospheric Administration’s Advanced Very High Resolution Radiometer instruments to help determine the leaf area index, or amount of leaf cover, over the planet’s vegetated regions. The greening represents an increase in leaves on plants and trees equivalent in area to two times the continental United States.
Results showed that carbon dioxide fertilization explains 70 percent of the greening effect, said co-author Ranga Myneni, a professor in the Department of Earth and Environment at Boston University. “The second most important driver is nitrogen, at 9 percent. So we see what an outsized role CO2 plays in this process.”
++++++++++++
You want to see a real climate crisis?
Drop CO2 and temperatures back to where they were in the 1800's!!!!!
The current climate optimum is PROTECTING US
Re: Re: Re: Re: Re: Death by GREENING!
By metmike - Feb. 2, 2025, 7:54 a.m.
Added: They could have mentioned violent tornadoes which is as extreme as it gets. That decreased by 50% because of warming the highest latitudes the most. When will that ever get a mention in a discussion like this?
During a severe weather outbreak?
Nope.
During a non severe weather event?
Nope!
Answer: NEVER.
In what world does the huge reduction in violent tornadoes deserve to NEVER be discussed?
The one being manufactured to get people to believe this climate optimum is a climate crisis.
As mentioned earlier, this would be like a discussion about cars only telling us the bad things.
We should ban cars to save lives and save the planet!!!!
That actually makes way more sense than vilifying a beneficial gas at half the optimal level in the middle of a climate OPTIMUM.
That last sentence makes no sense to most people because up has been defined as down for people indoctrinated into climate crisis religion.
The only reason that we all know that my description of cars is a 1 sided biased, manufactured reality and complete nonsense is because we all USE CARS EVERY DAY. We understand what they are, how they work and what they do for us.
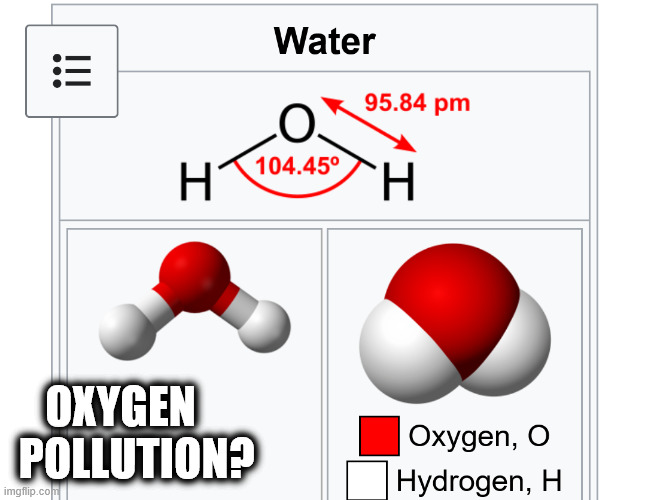
The reason that they can get away with this same tactic in climate science is that people are not atmospheric scientists that understand the physical laws of the atmosphere. They don’t have the data that I just shared. What they know about it comes from thousands of biased articles that intentionally only tell us bad things about a FAKE climate crisis and climate pollution or absurdly, carbon pollution because the beneficial GAS CO2 has an atom of carbon in it(just like our food and bodies are carbon). So H2O, the main greenhouse gas must be Hydrogen pollution.
This comes from message gatekeepers that have HIJACKED CLIMATE SCIENCE. They have even rewritten climate history to take out the medieval WARM period, 1,000 years ago and the Holocene Climate OPTIMUM from around 9,000 to 5,500 years ago that was WARMER than this is the higher latitudes with less Arctic sea ice.
Intentionally, because that warmer weather contradicts the fake climate crisis narratives.
People don’t have weather and climate records, or a vast understanding of the climate. That’s why we are all told to believe the experts. Believe the (hijacked) climate science experts. The version that only tells us bad things, and greatly exaggerate those, ignoring ALL the much bigger good things.
https://en.wikipedia.org/wiki/Carbon_dioxide#See_also
Optimal level for life is 900 parts per million. Current level is 430 parts per million.
+++++++++++
https://en.wikipedia.org/wiki/Water
Optimal for life but using the junk science climate crisis, molecular definition means that we should STOP DRINKING WATER???
+++++++++++++++++=
++++++++++++++++++++
https://en.wikipedia.org/wiki/List_of_compounds_with_carbon_number_1
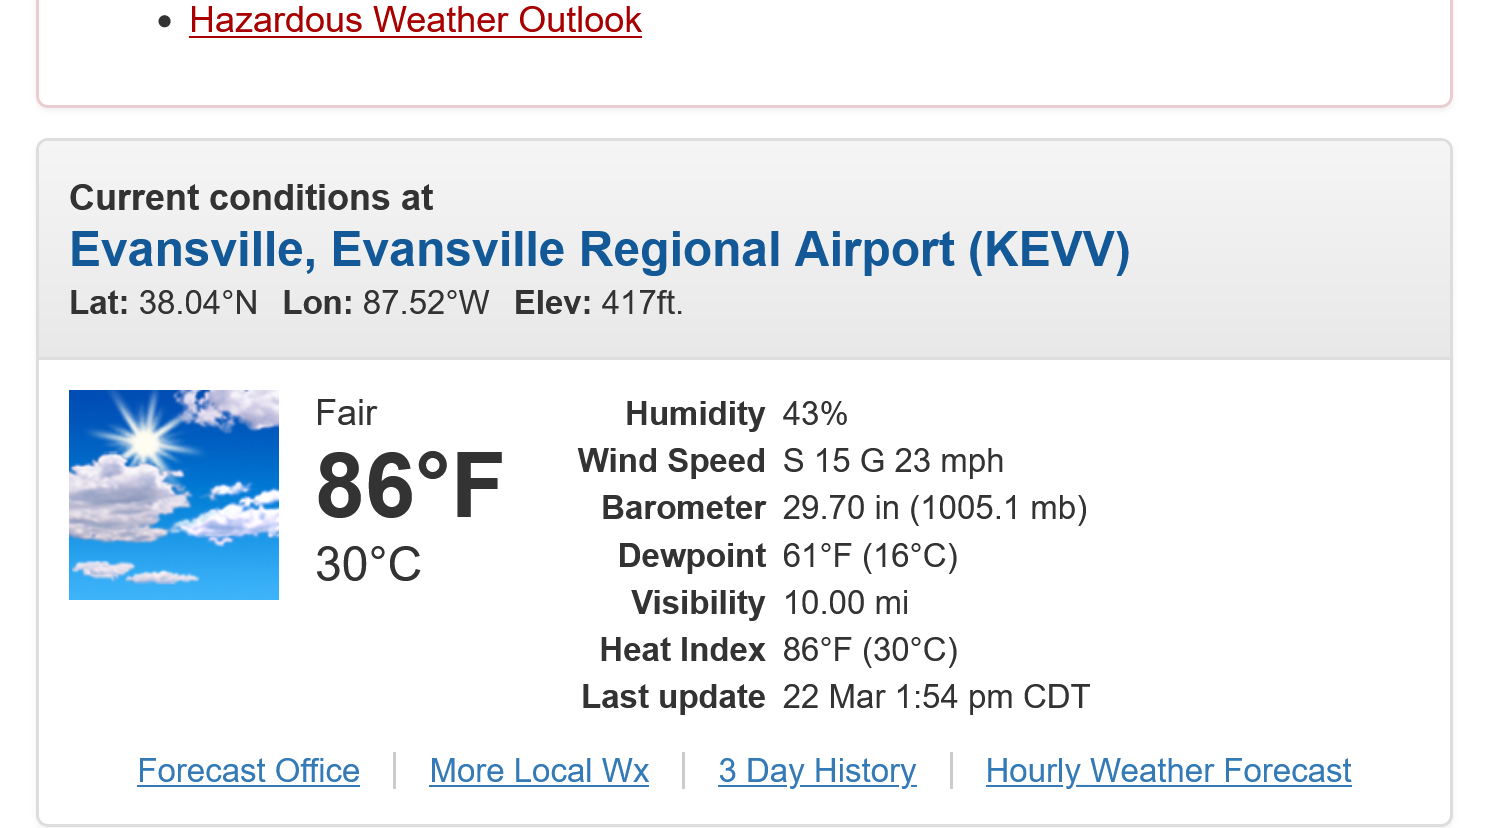
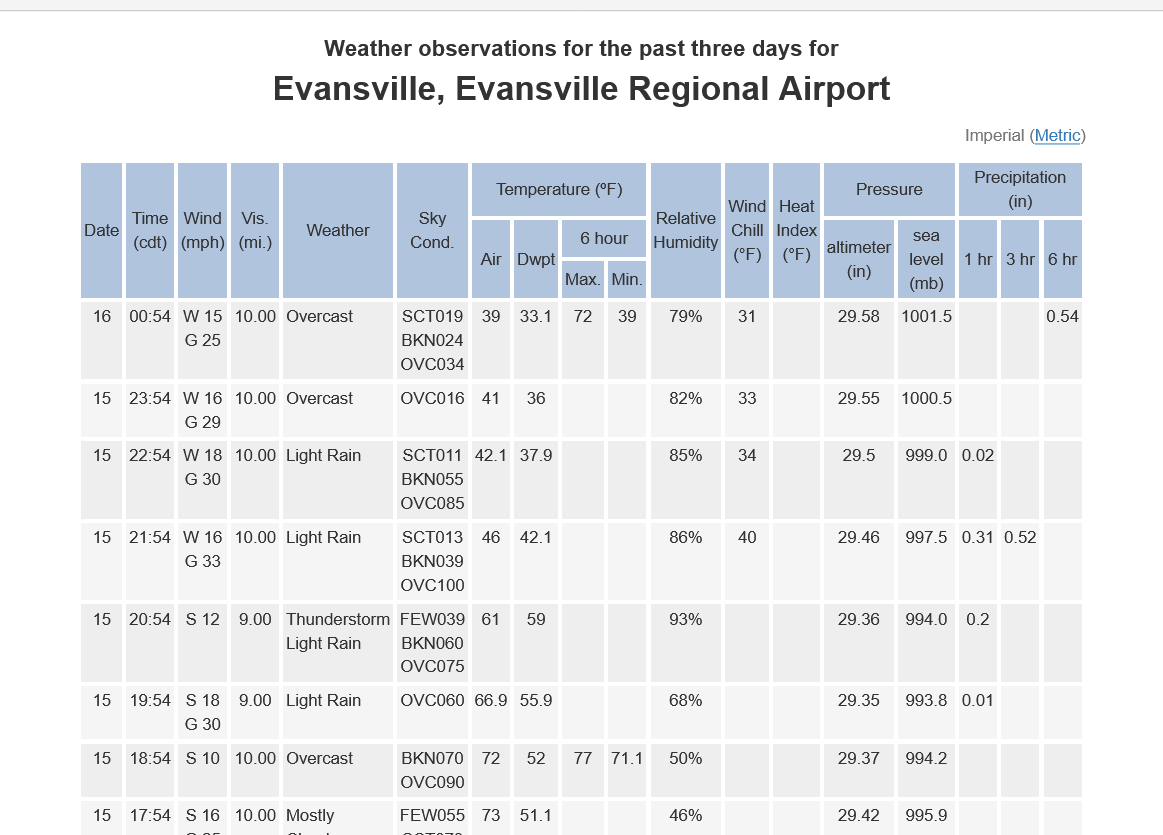
A tongue/chunk/slug of that record heat has been grabbed by the approaching weather system and transported from the Southwest to the Southern Plains and is now aimed at the Ohio Valley.
This will result in one HOT hot day in Evansville IN. We'll easily smash the daily record early in the afternoon and probably have the hottest day in March history. The current March record is 87 set on March 24, 1929. So it took 97 years to break it!
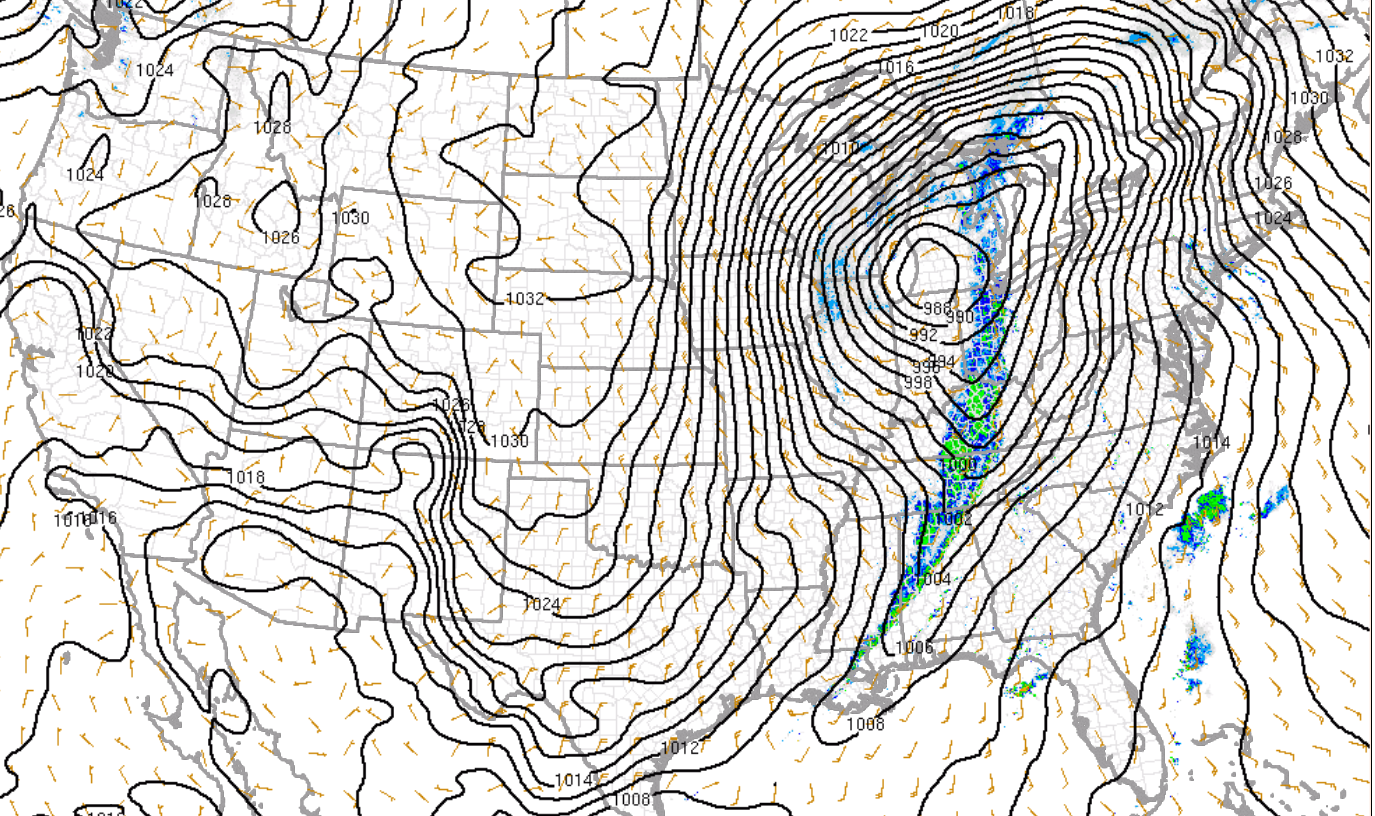
This is the current 850 mb map which is around 1 mile above the ground.
Despite this current unprecedented March heat wave in the Southwest, it doesn't hold a candle to the Summer of 1936, 90 years ago in the OLD climate.
The length of time, lasting 3+ months and the massive geographical location blows this current heat wave away. Happening during the hottest time of year made it especially devastating.
And worst of all is that this is the most productive agricultural region on the planet. Record heat in a desert, like Arizona where not much grows in March is a bad thing. Record heat and record dry where we grow crops DURING THE ENTIRE GROWING SEASON is a bad thing X 100!
Summer (June–August) 1936 average temperature, in degrees Fahrenheit. Record warmest and coldest is based on a 112-year period of records (1895–2006)
++++++++++++++++

Summer (June–August) 1936 precipitation, in inches. Record wettest and driest is based on a 112-year period of records (from 1895 until 2006).
https://cliffmass.blogspot.com/2016/03/the-golden-rule-of-climate-extremes.html
The GoldenRule
Considering the substantial confusion in the media about this critical issue, let me provide the GOLDENRULE OF CLIMATE EXTREMES. Here it is:
The more extreme a climate or weather record is, the greater the contribution of natural variability.
Or to put it a different way, the larger or more unusual an extreme, the higher proportion of the extreme is due to natural variability
1. I agree with Mike that CO2 isn’t “pollution”.
2. There’s as expected misinfo being circulated about this historic SW heatwave. Here’s an example from Chris Martz:
“In March 1879, there was a heatwave in the central and western U.S. that was comparable to the one going on currently. On March 3, 1879, it hit 100° in Phoenix On March 27th, it was 89° in Kansas City, and 105° in Phoenix. It hit 99° in San Diego and Los Angeles both on the 29th, and Phoenix was 106°. The following day, Phoenix reached 112°. In fact, Phoenix hit 100° seven times that month. Yuma and Tucson also reached the mark.Many sites in Northern California reached the mid-80s, in some cases recording temperatures higher than the modern ‘records” set this week. So, contrary to the reporting, there does appear to be some precedent for this early season heatwave, but I don’t expect the media to do much digging.
https://x.com/ChrisMartzWX/status/2035351511404863609?
———————
Chris is correct about the 99s on 3/29/1879 in SD/LA. However, he’s tweeting false info about Phoenix and Tucson.
The following is from Don Sutherland at AmericanWx:
As was the case last year when Phoenix reached an August monthly record high of 118°, an ignorant handful are attempting to dismiss the magnitude of the ongoing unprecedented March heatwave. In this case, the effort is to transform what was very likely a localized heat event in southern California due to possible offshore winds into an epic regionwide heat event that surpassed the ongoing heat event that has toppled March and April records in many locations in the West.
The above post also applies projection, accusing the news media, of not doing "much digging." In fact, the post demonstrates dismal research skills.
The question concerns whether Phoenix ever reached 112° in March during 1879. That heatwave was likely referenced, because Phoenix's daily records go back to August 1895. Thus, the underlying assumption was that one could not credibly question the claim.
That's not true.
Below is the Monthly Weather Review report for March 1879.
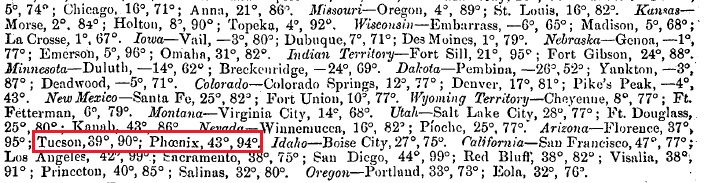
Yuma's climate record goes back to January 1878. Yuma's monthly maximum temperature for March 1879 was 100° on March 29, 1879. Yuma's highs are typically above those of Phoenix. For example in the current heatwave, Yuma had a peak high of 109° vs. Phoenix's 105°.
—————
I found Yuma’s 100 on 3/29/1879 here:
Great work, Larry!
You're ability to find relevant statistics in our conversations is unmatched by others!
Temps at 1pm below.
https://www.mesonet.org/weather/air-temperature/national-wind-chill-heat-index
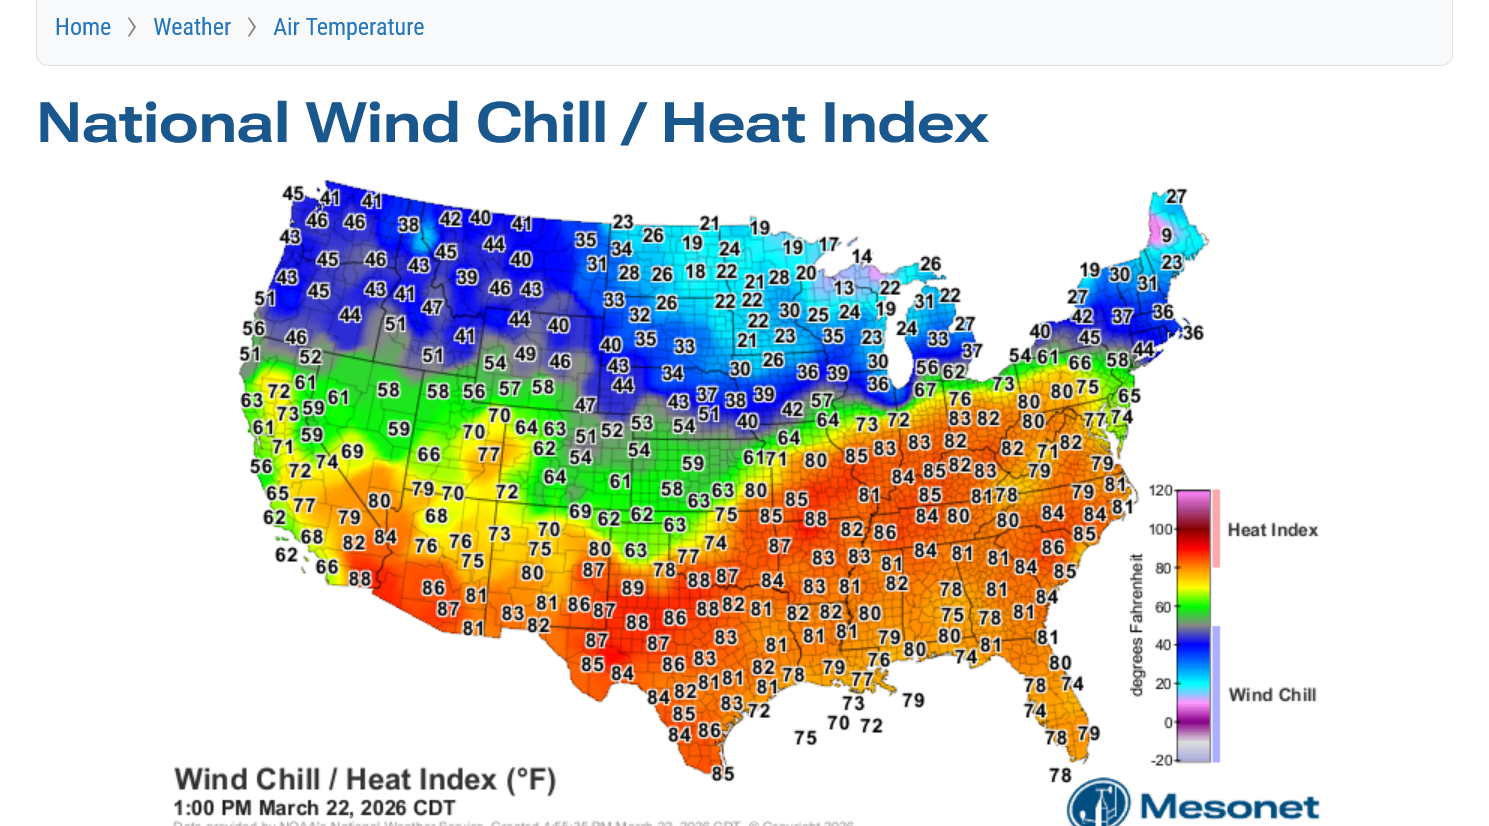
At 2pm, we already obliterated the old record for the date. On Central DAYLIGHT time, our solar noon occurs at this location around 1:36 pm so we should be able to hit 90 degrees today and smash the old record because this temp was less than 30 minutes after solar noon!
https://forecast.weather.gov/MapClick.php?x=290&y=91&site=pah&zmx=&zmy=&map_x=290&map_y=91
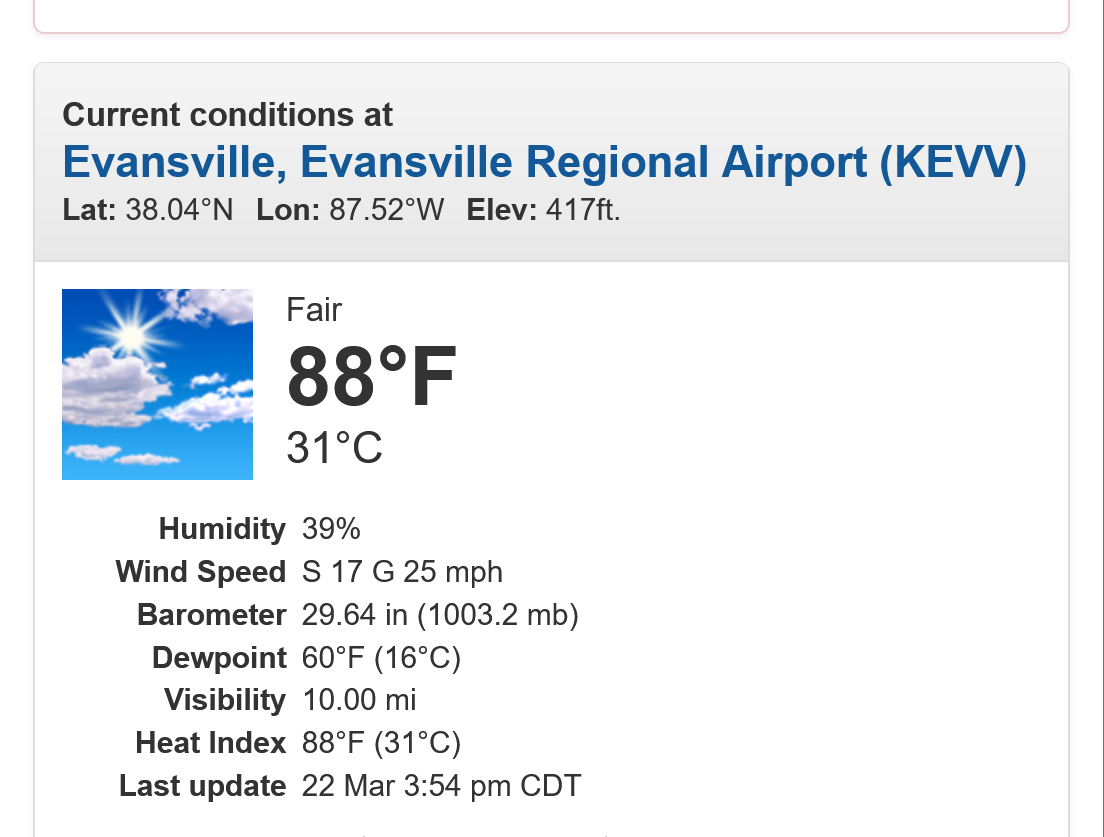
Wow! Look at this March heat expanding east at 2pm!! Feeling 60+ colder in the Upper Midwest!

New all time March high temperature for us at 88 degrees!!!
+++++++++++++++++++++++++++++++++
Daily Climate Normals and Records - Evansville, IN
Record highs:
https://www.weather.gov/pah/EvansvilleDailyNormalsAndRecords
For our Summer/hottest 3 months, I counted 20 out of the 92 record highs the past 130 years in Evansville coming since 1990, which would be the 35 HOTTEST years for global temperatures.
In Evansville:
Last 35 years, 20 record highs JJA=1 record high every 1.8 years
Previous 95 years, 72 record highs JJA=1 record high every 1.3 years
++++++++++++++++++++++++++++++++
Look at the 60 degree contrast from south to north in the states of IL and IN right now, at 5pm!!!!
https://www.mesonet.org/weather/air-temperature/national-wind-chill-heat-index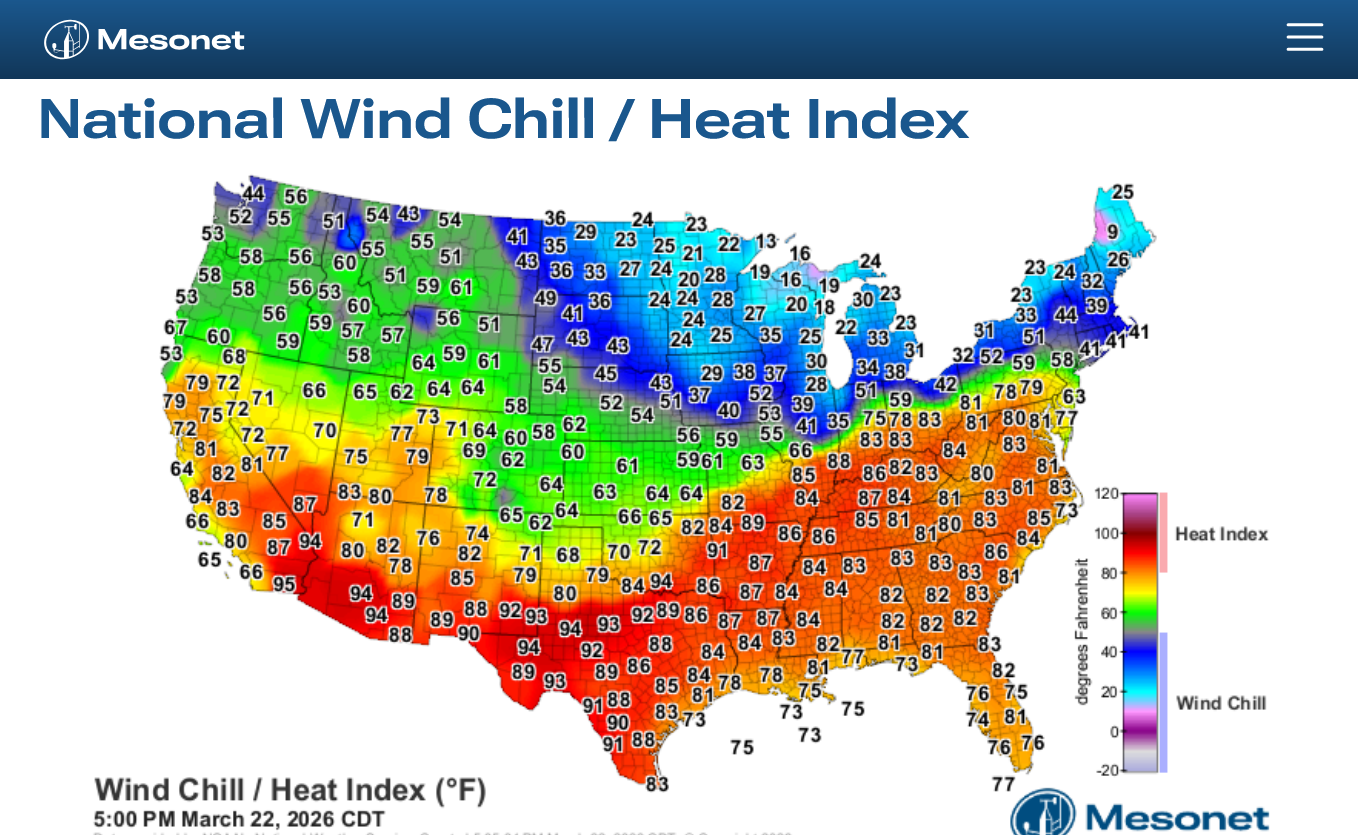
Making headline news has been the flooding rains in Hawaii.
Worst in 2 decades!
In Maui, so-called kona storms are affecting the areas where wildfires have grown more frequent and intense, creating a feedback loop of environmental consequences.
https://www.nbcnews.com/weather/storms/hawaii-rain-storms-wildfire-scars-flooding-rcna264167
++++++++++++
Global warming is adding around 7% more moisture to air masses that are 1 Deg. C(1.8 Deg. F) compared to a century ago.
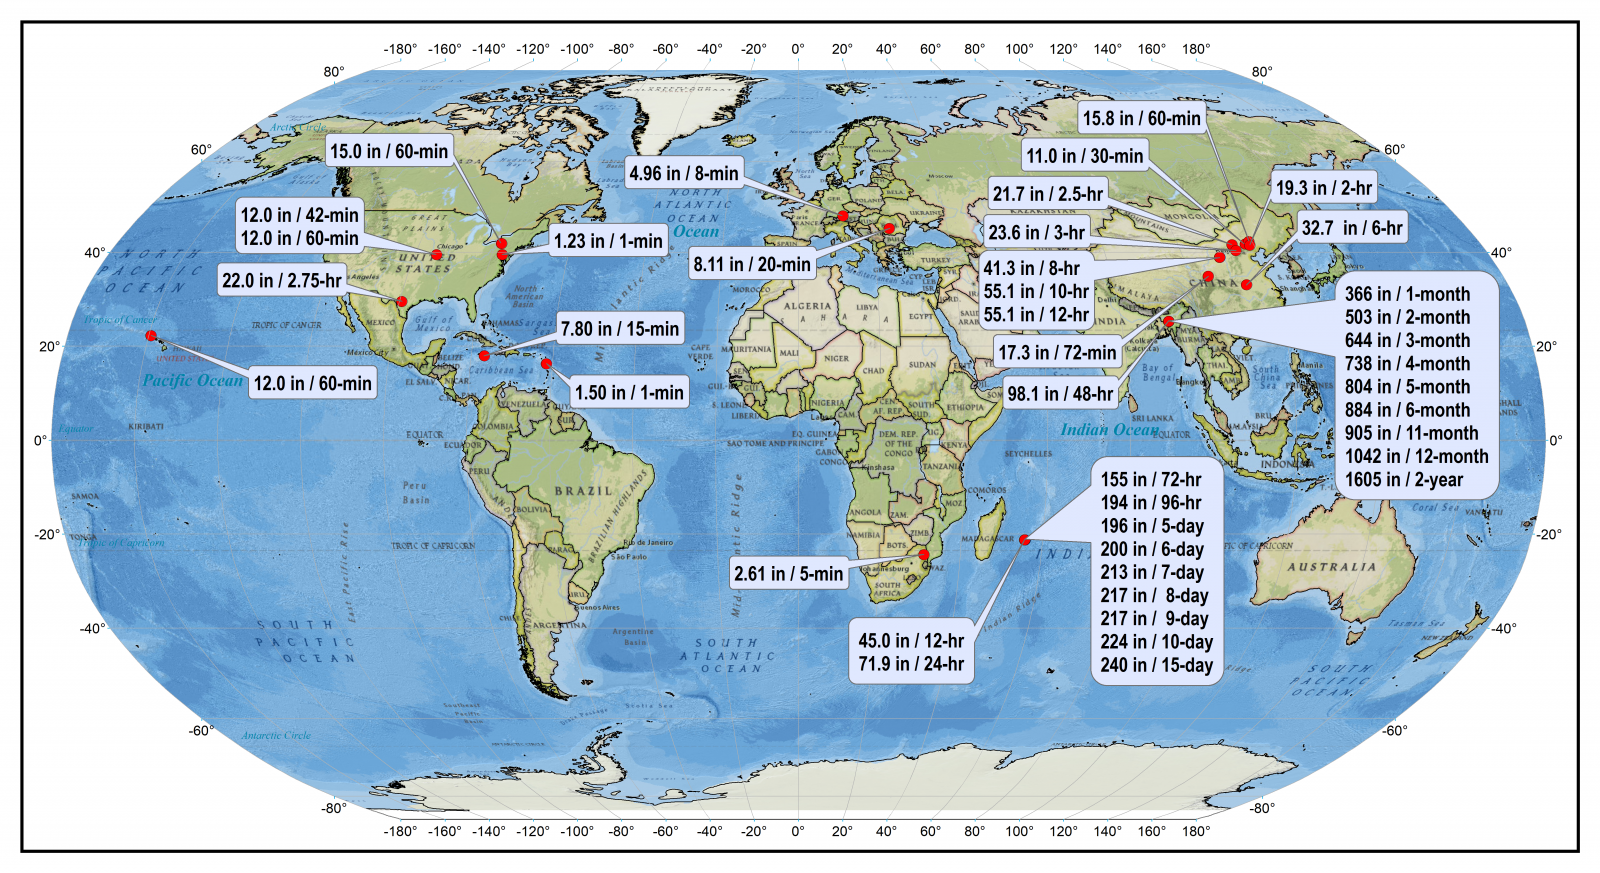
However, note this extensive map of rainfall records and the specific list below it that includes the year of the records.
Almost all the records were set during the OLD climate!!
https://www.weather.gov/owp/hdsc_world_record
Thanks, Mike!
Not to minimize the historic March conus heat, but I just realized this morning that Fairbanks has a good shot at its coldest March! I just posted this elsewhere:
“Looking at Mar 1-23 actuals and the NWS forecast for the next 7 days, Fairbanks has a decent shot at its coldest March on record with records going back to 1906! The current coldest mean is -6.6F (1959). The MTD mean through 3/23 is ~-13! So, even with the next week forecasted to average near +8F, the MTD may not get up to -6.6F!”
https://www.weather.gov/wrh/Climate?wfo=afg
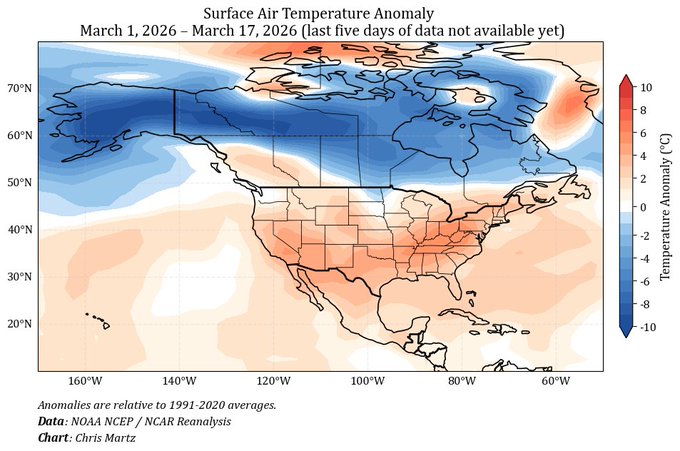
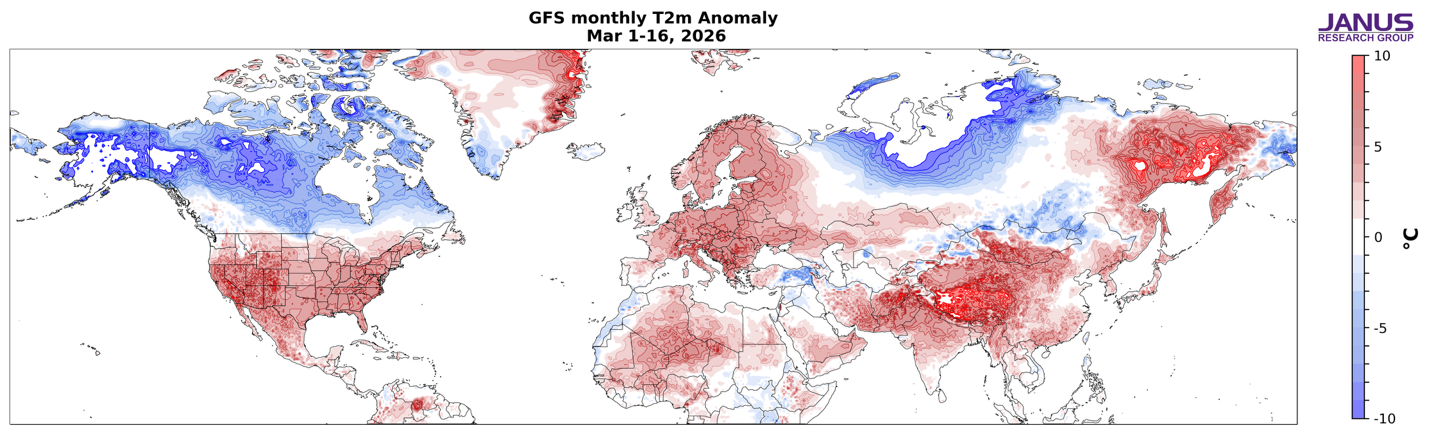
At that board, I had just posted a tweet with the following map showing a large area of extremely intense cold anomalies for March 1-17 in NW Canada and Alaska, which lead to another poster posting Fairbanks’ extreme cold for March 1-20:
Give that Larry a a big cigar!
https://cliffmass.blogspot.com/2016/03/the-golden-rule-of-climate-extremes.html
The GoldenRule
Considering the substantial confusion in the media about this critical issue, let me provide the GOLDENRULE OF CLIMATE EXTREMES. Here it is:
The more extreme a climate or weather record is, the greater the contribution of natural variability.
Or to put it a different way, the larger or more unusual an extreme, the higher proportion of the extreme is due to natural variability
Thanks, Mike!
Again not at all to minimize the great SW US heatwave of this month:
In addition to Fairbanks, cities such as Anchorage and Yellowknife, NW Territories as well as the area in between and surrounding have a chance to have their all time record coldest Marches. That’s ~2,000 miles long and 400 miles wide area or ~800K square miles. That’s ~18% of the combined square miles of Canada and Alaska or ~25% of the size of the lower 48!
Does anyone have a link to monthly records for Canadian cities and more specifically Yellowknife? Anyone have a link to maps showing historic temperature anomalies by month for Canada like we have for the US?
Yellowknife in March of 2026:
Mean temp March 1-23: -26C
Normal for entire month: -16C
March 2026 so far:
https://www.predictwind.com/weather/canada/northwest-territories/yellowknife/march
Normals in C:
Great work, Larry!
See below:
Cross polar flow sending air from the coldest place on the planet (usually) Siberia directly into Alaska and Canada. This has been going on much of the Winter.
While the Southwest USA has had an incredible dome of upper level high pressure on top of them this month.
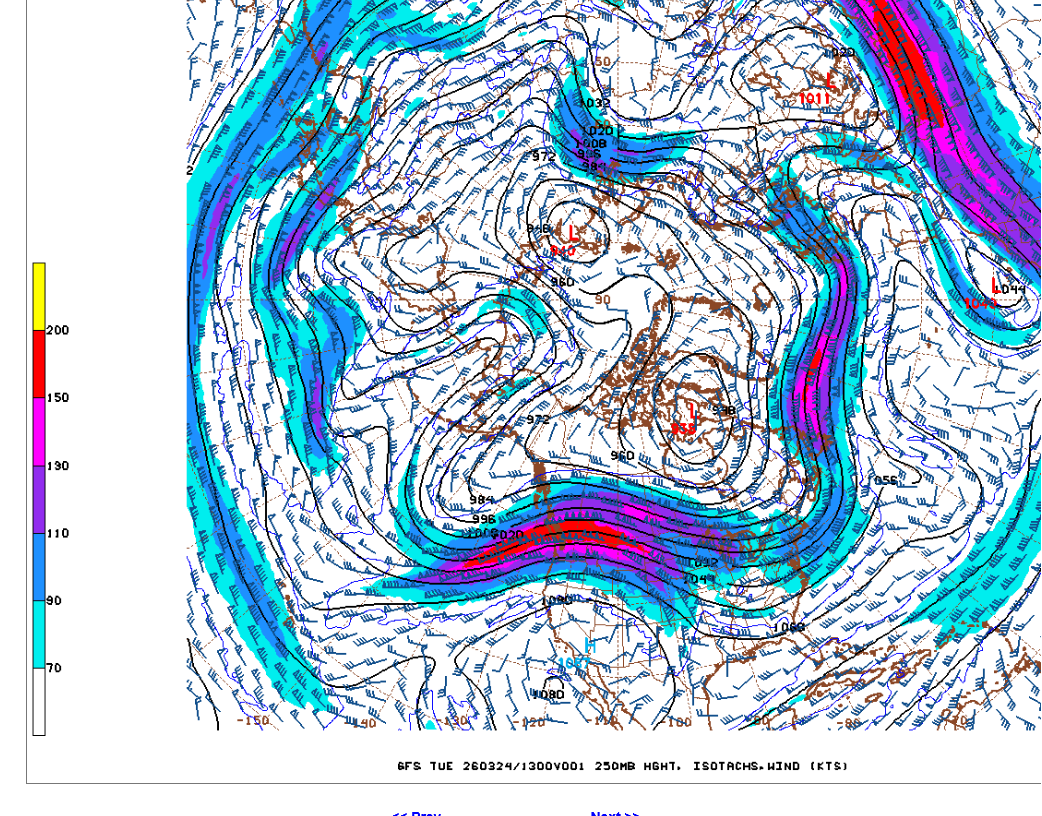
This was the last 250 mb chart(30,000+ feet) from the GFS for the high latitudes of the Northern Hemisphere. We consider winds at this level to be the main steering currents for large air masses that travel thousands of miles from 1 place to the next……then continue to the next place after that.
Air masses take on the characteristics of their origin But will moderate as they travel downstream over new geographical regions.
Right now, the Siberian air masses are not moderating much before hitting Alaska because they are tracking across extensive snow and ice covered ground and the sun is still low in the sky but is certainly starting to have a substantial impact but it’s the same one that Alaska always has from the sun in March and we are coming THIS March to previous March’s.
Powerful Pacific jet stream in between these extreme temperature patterns which as it turns out is strongly correlated with extreme cold to its north and extreme warmth to its south.
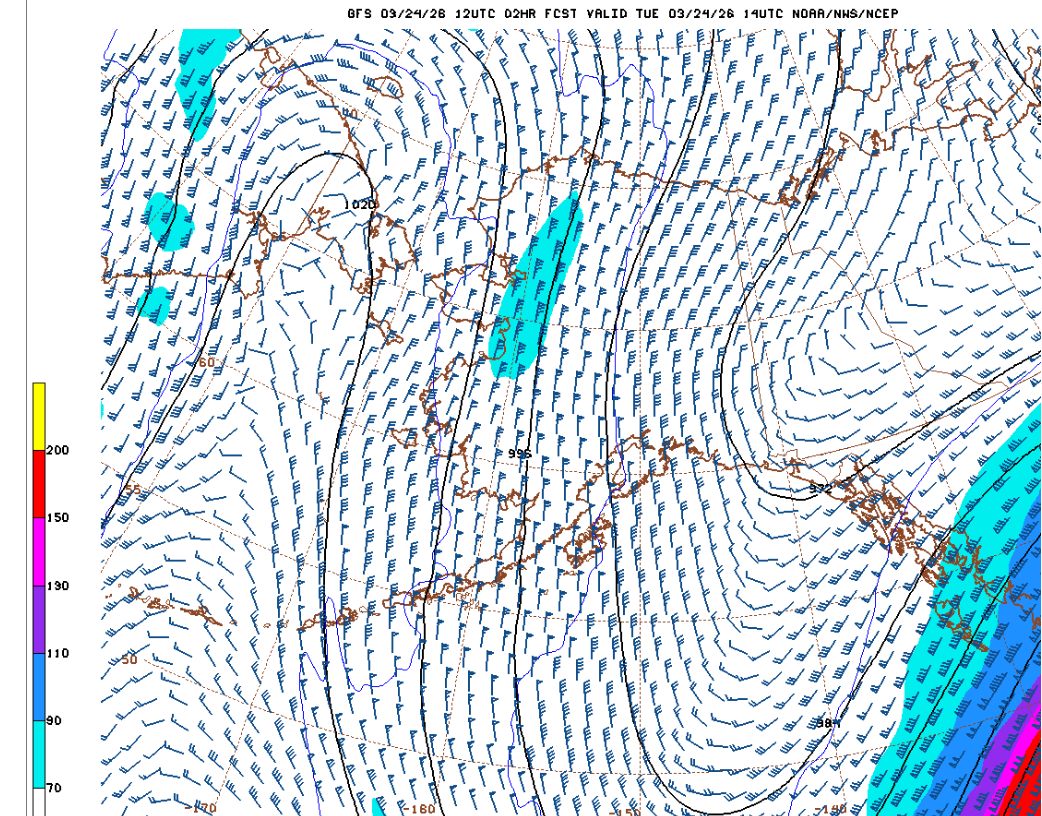
Here's a look at Alaska:
Streamlines straight from the north. CROSS POLAR flow from Siberia blowing in Siberian origin air masses with some wiggles/kinks in the jet stream along the way.
I forgot that we’ve been experiencing a Sudden Stratospheric Warming event(s) in March!
More when back in my office.
Thanks, Mike.
I just saw that March of 1964 at Yellowknife was -17.6F. With them currently at -15F and when looking at the rest of this month’s progs, they won’t end up as cold as that month.
Unlike 2026, that month was post El Nino, opposite of 2026. That month was also quite cold further N, N of 80N (<-30C):
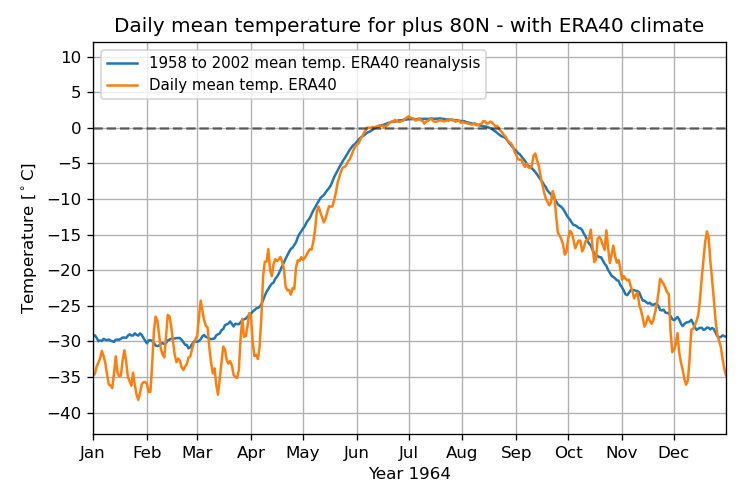
Compare that to the current March so far, which is ~-20C or >10C warmer!!
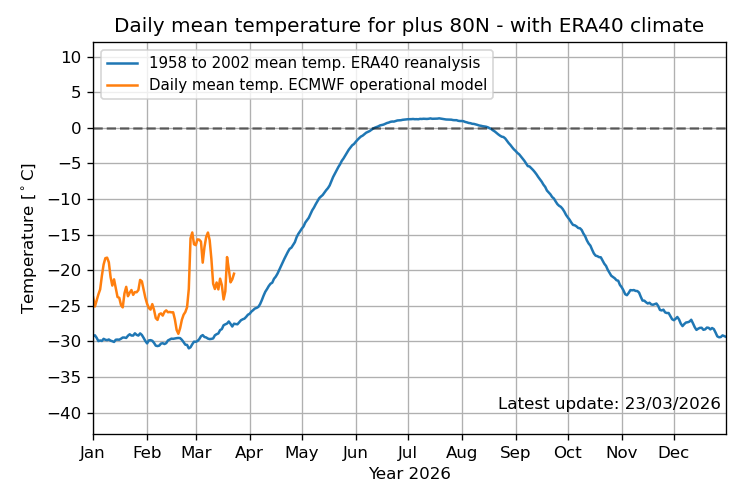
That's profound because of this current pattern, Larry!
In 1964, apparently there was widespread cold across most of the higher latitudes to south of the Arctic Circle??
This year, we've been dumping the highest Arctic cold southward into Alaska and Canada, originating from the other side of the Northern Hemisphere/Siberia!
Director, Seasonal Forecasting
Atmospheric and Environmental Research
JANUS Research Group
March 17, 2026
https://published.aer.com/aoblog/aoblog.html
+++++++++++++++++
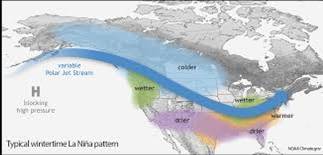
This is a (dying) La Nina type pattern shifted northward:
La Nina Winters have more amplified, meridional type flow........from north to south and a Greenland Block/warmth is more likely during a La Nina.
The pattern we've often had recently was an AMPLIFIED version of the La Nina signal depicted below, alternating with an El Nino type jet stream that shifts the jet stream farther north and allows the heat to gush east for a few days, followed by another cold intrusion from Canada where all the cold air has been getting dumped..
Definitely an extreme temperature yo yo for the Midwest and East.
https://www.hometownforecastservice.com/2020-2021-winter-outlook/
Phoenix had a high of 100 today, the 8th day in a row of 100+! Before 2026, there had been only one March day of 100+ and that was right at 100 on March 26th! Holy cow!
This is probably going to the be the hottest March by numerous degrees more than any previous March(in the Southwest).
Do you have any guesses, Larry now that we're getting close to the end??
https://www.cpc.ncep.noaa.gov/products/tanal/temp_analyses.php

The first 7 days were not that hot:….in the southwest. More so farther east

Coldest ever recorded in March anywhere on the globe occurred yesterday in Vostok, Antarctica with -76.4C or -105.5F!
Thanks a ton, Larry!
This is the most extreme isolated anomaly of course.
Mostly beneficial global warming of almost 2 deg. F superimposed on our planet(most on the coldest places of the Northern Hemisphere-and also on the deserts) is for real from human emissions of CO2 caused by burning fossil fuels but this is a reminder that COLD still kills 10 times more humans than heat(it used to be 20+ times but the climate optimum made it better) and cold kills something like 200 times more life than heat every year.
I have no agenda in stating this. Other than educating people about authentic science and the truth.
Re: Re: Re: Re: Historic SW US March heatwave
By metmike - March 22, 2026, 10:56 a.m.
Phoenix is headed to a full March mean that will miss the warmest April on record only by just over 1F! March of 2026 will end up warmer than all Aprils on record except one, April, 1980!! It will even be slightly warmer than the mean of all Mays since 1895 and fairly recent Mays like 2019, 2010, 2008, 1998, 1995, and 1994!!
Long lasting heat doesn't get much more impressive than that in March!
https://www.cpc.ncep.noaa.gov/products/tanal/temp_analyses.php

+++++++++++++
We got in on that in Southern Indiana at times, setting our warmest March high temperature ever with 88 degrees last week in Evansville as slugs of heat from the Southwest are pulled up here ahead of cold fronts. .
On Thursday, we spiked back up to 86, just 1 shy of the old record. In between the shots of heat, we've had brief shots of cold. This morning was down to 33 degrees.
This is the temperature graph for 2026 for our city, Evansville, IN. The brown in the center is the average high/low range.
Look at the numerous spikes close to the top of the pink(1 of them getting ABOVE the hottest day in March last week). Wow! But making it even more impressive is that the heat spikes were separated by cold spikes down.
Thanks, Mike:
1. How about this? Phoenix had its coolest high in 11 days by a good margin (96) and yet it was still another record high, the 14th of this month!
2. Believe it or not, the next two days’ record highs of 97 are forecasted to be close to being hit. So, two more daily record highs are possible!
3. The morning low was 75. IF it doesn’t cool down to 74 by midnight local time, it would be not only a new record high low for today, it would become the new monthly record high low and the earliest 75 low by far with the current earliest being way out on April 19th! The current record for the day and month is 74, set way back in 1986.
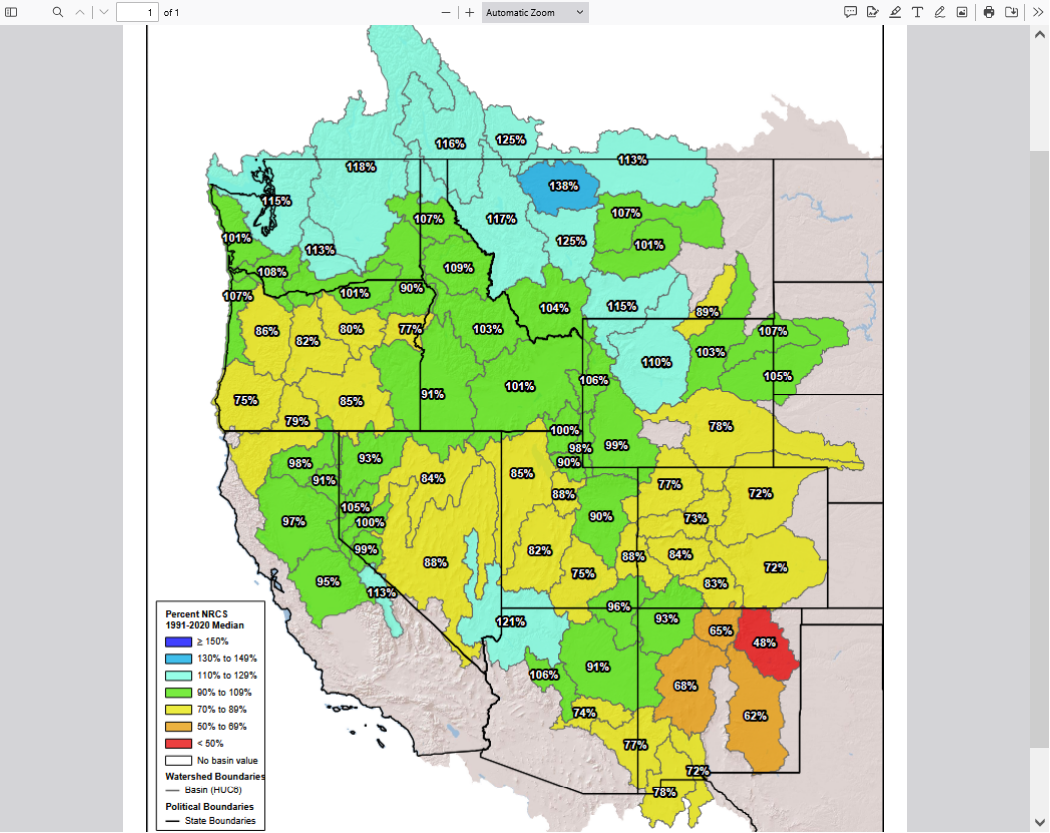
The lack of snow in the Rockies & upper Colorado watershed is national news today.
Figured you guys are way ahead of this story, but worth noting when it hits the AP.
Yes, great point, Patrick.
It doesn't get much worse than this:
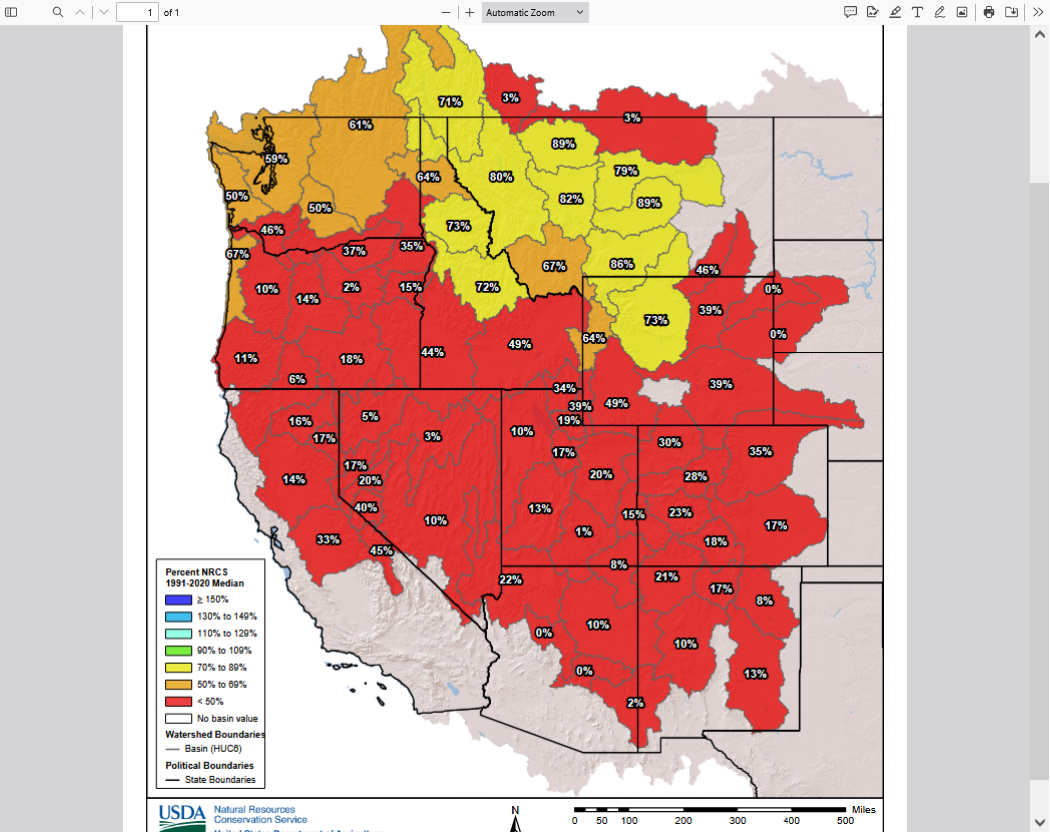
Because of the record warmth, much of their precip fell as rain instead of snow.
Most interestingly, although I attribute some of the warming in the Southwest to the amount of greenhouse gas warming imposed on the entire atmosphere(amplified in cold/dry areas). In doing a more comprehensive evaluation, the extreme nature of this pattern was no question about it from natural variation.
How do I know that?
Because global warming from greenhouse gas warming is greatly amplified in the highest latitudes(which is why the Arctic in warming 3 times faster then the lower latitudes.
The extraordinarily extreme temperature pattern from this last month of March was the diametrically opposed, polar OPPOSITE of that, featuring near record COLD in the highest latitudes where global warming has been causing more and more record WARMTH. The large scale features and temperatures in March were from an ANTI global warming pattern!!!
It's completely flip flopped from global warming.
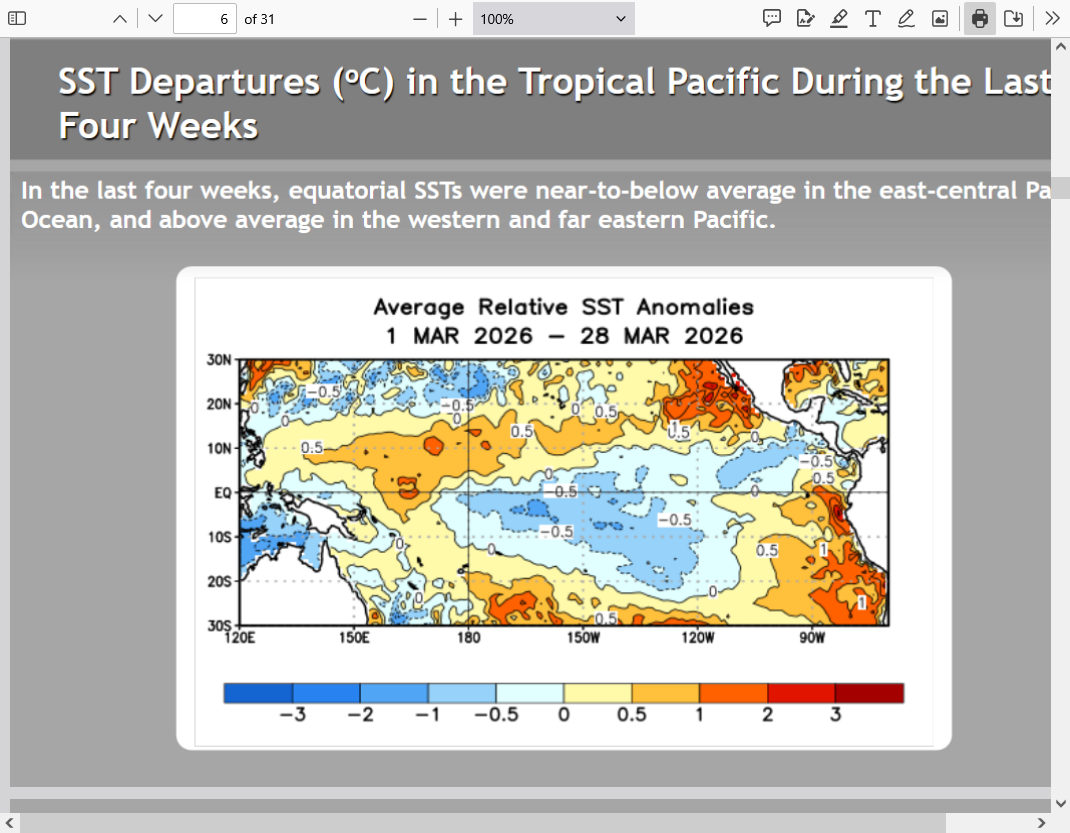
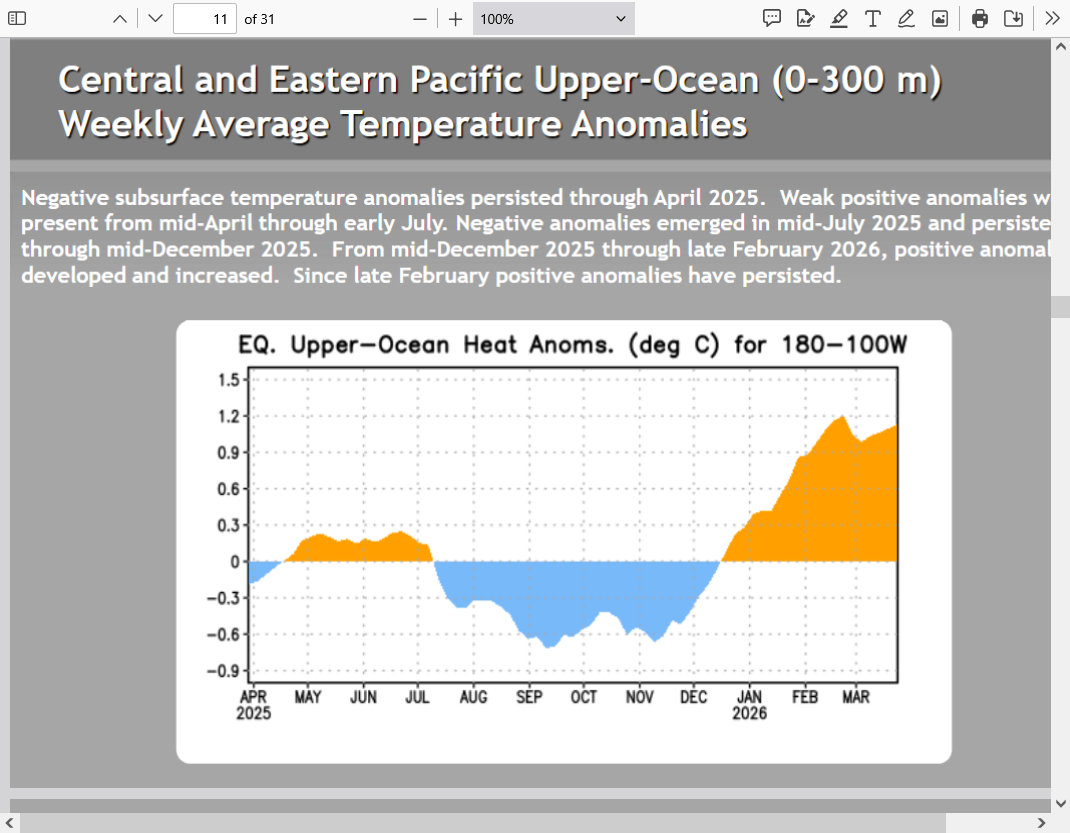
I feel confident that it's related to the rapid collapse of the La Nina, with temperatures in the region of the eastern/central Tropical Pacific already in El Nino land.
I'll update the El Nino page in a minute. It's impressive.
Director, Seasonal Forecasting
Atmospheric and Environmental Research
JANUS Research Group
March 30, 2026
https://published.aer.com/aoblog/aoblog.html
Noon: Here's that update. It's an excellent one to read!
Re: Re: Re: 2-17-26 El Nino, here we come-FAST!
By metmike - April 2, 2026, 1:11 p.m.
This WAS the warmest March by a lot for many places in the Southwest 1/3rd of the US!
And for the entire country as a whole, with March 2012 being the previous warmest. The last year that featured a major drought because of a La Nina.
This year's warmth featured El Nino like temperatures in the far eastern tropical Pacific. It takes 3 months of that to make it an official El Nino but the atmosphere doesn't wait for NOAA. It starts reacting to the actual sea water temperatures when they go up.
https://www.cpc.ncep.noaa.gov/products/tanal/temp_analyses.php

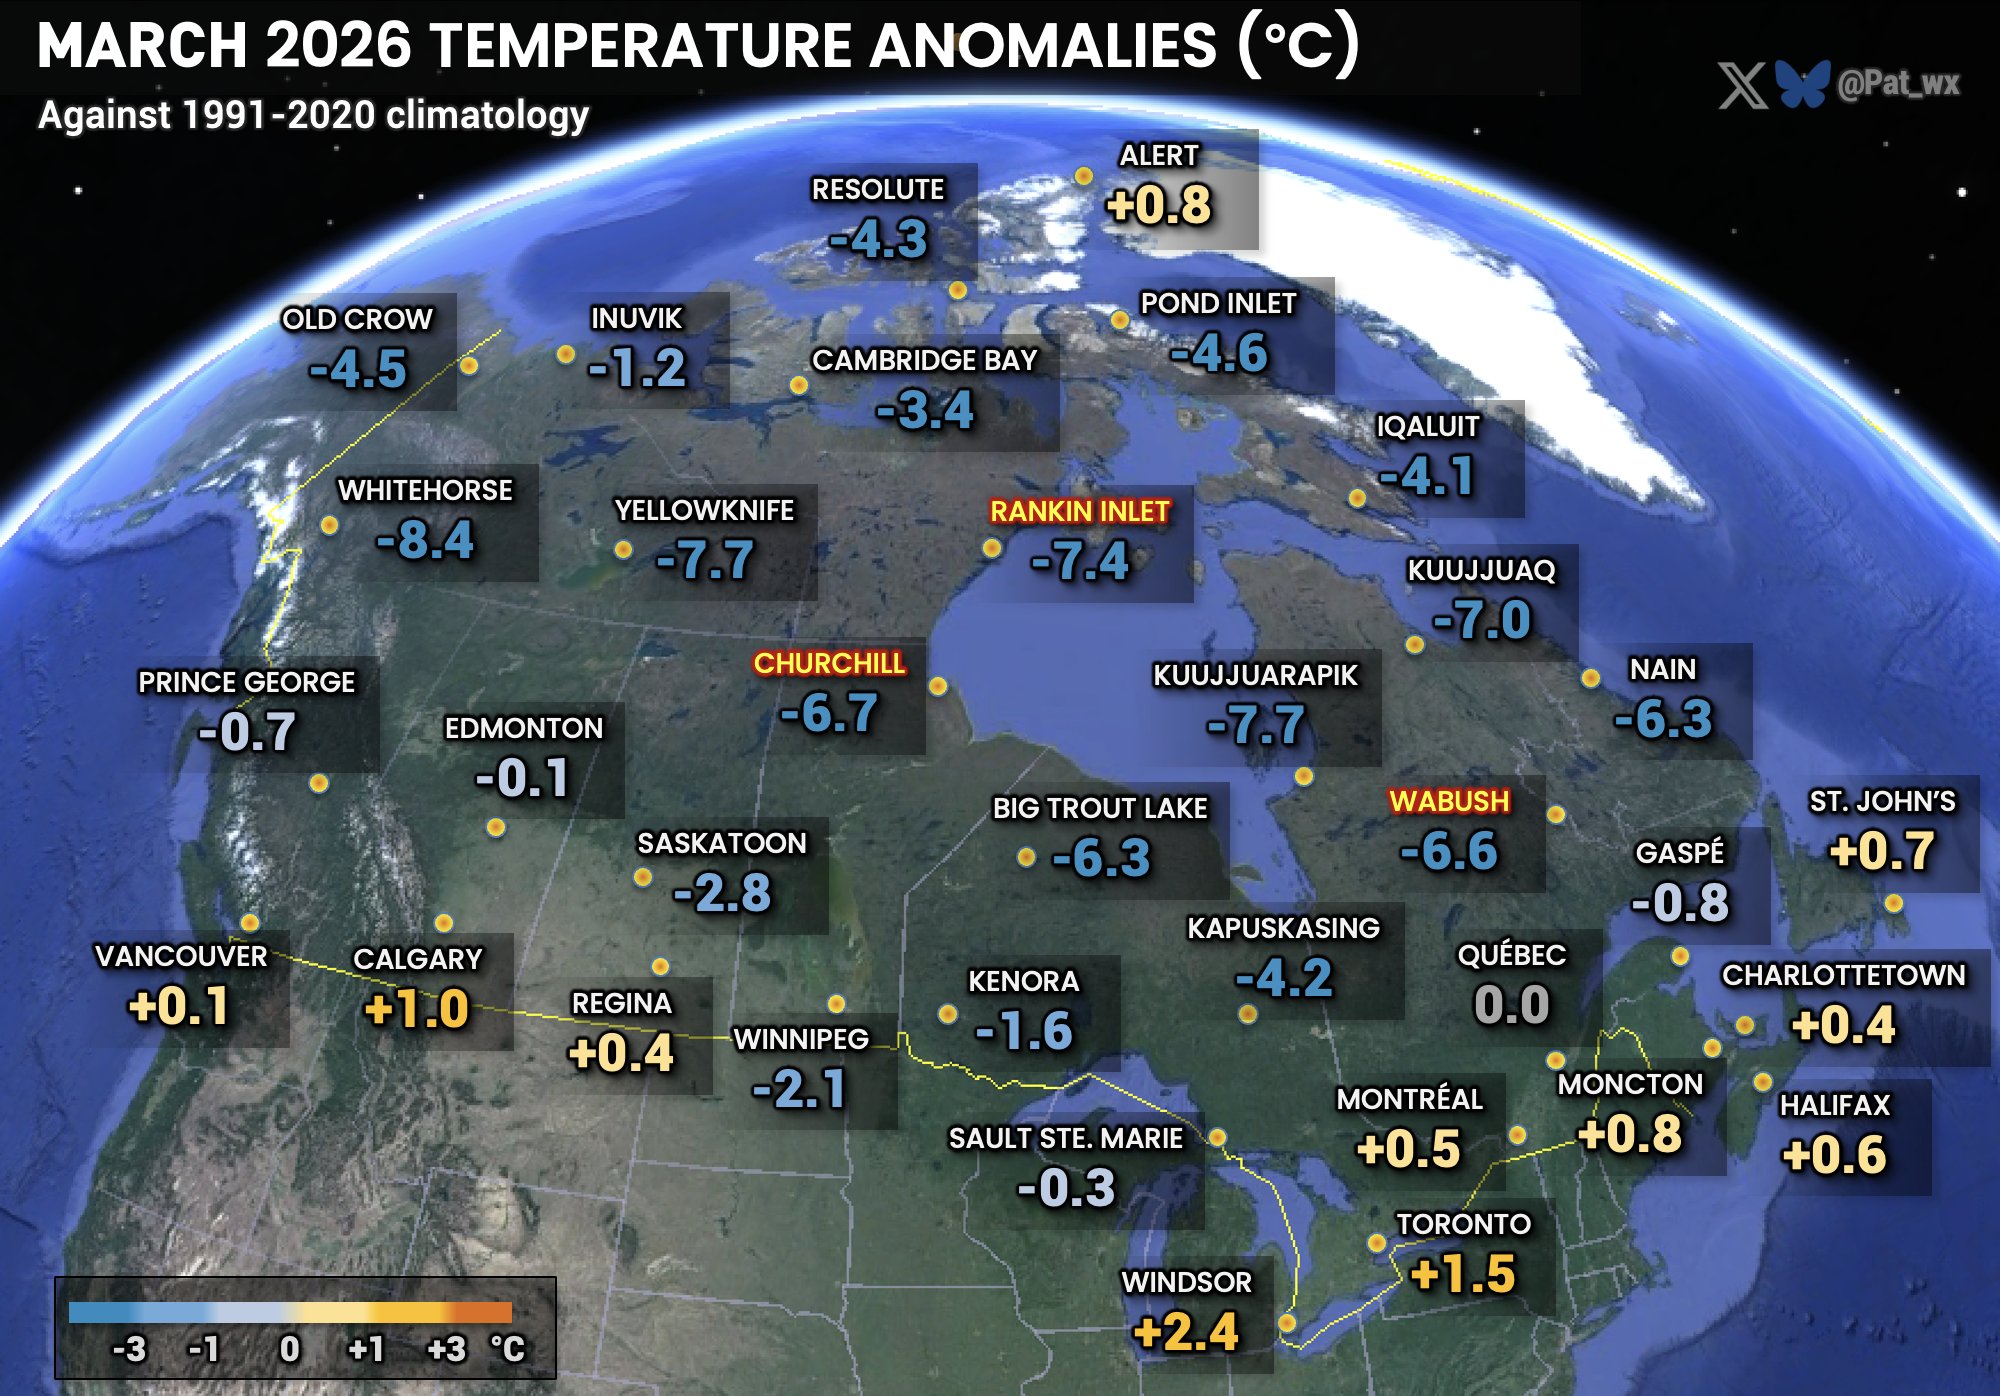
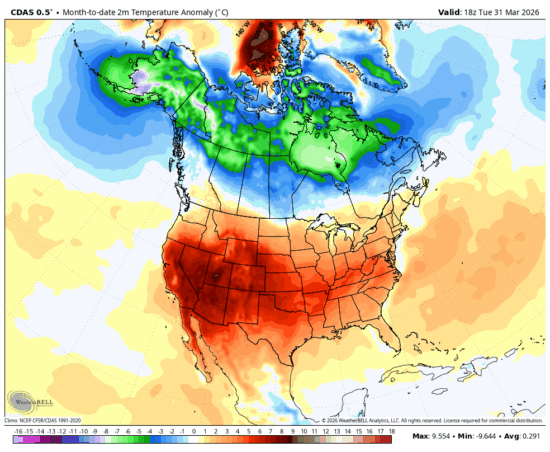
March ‘26’s incredible US warmth was enough to make it the warmest month anomalywise on record back to the late 1970s due to a combo of an extreme pattern and GW with the extreme pattern superimposed on a warmer globe. In other words, had there been no GW the US still could have had their warmest month since late 1970s but with not as warm temps. The extremeness of the pattern is seen well by considering how cold much of Canada and Alaska was with some of those areas having their coldest March onrecord (they would have been even colder with no GW):
The following tweet doesn’t go back as far as the warmth of the 1950s and 30s but is still very noteworthy of course:
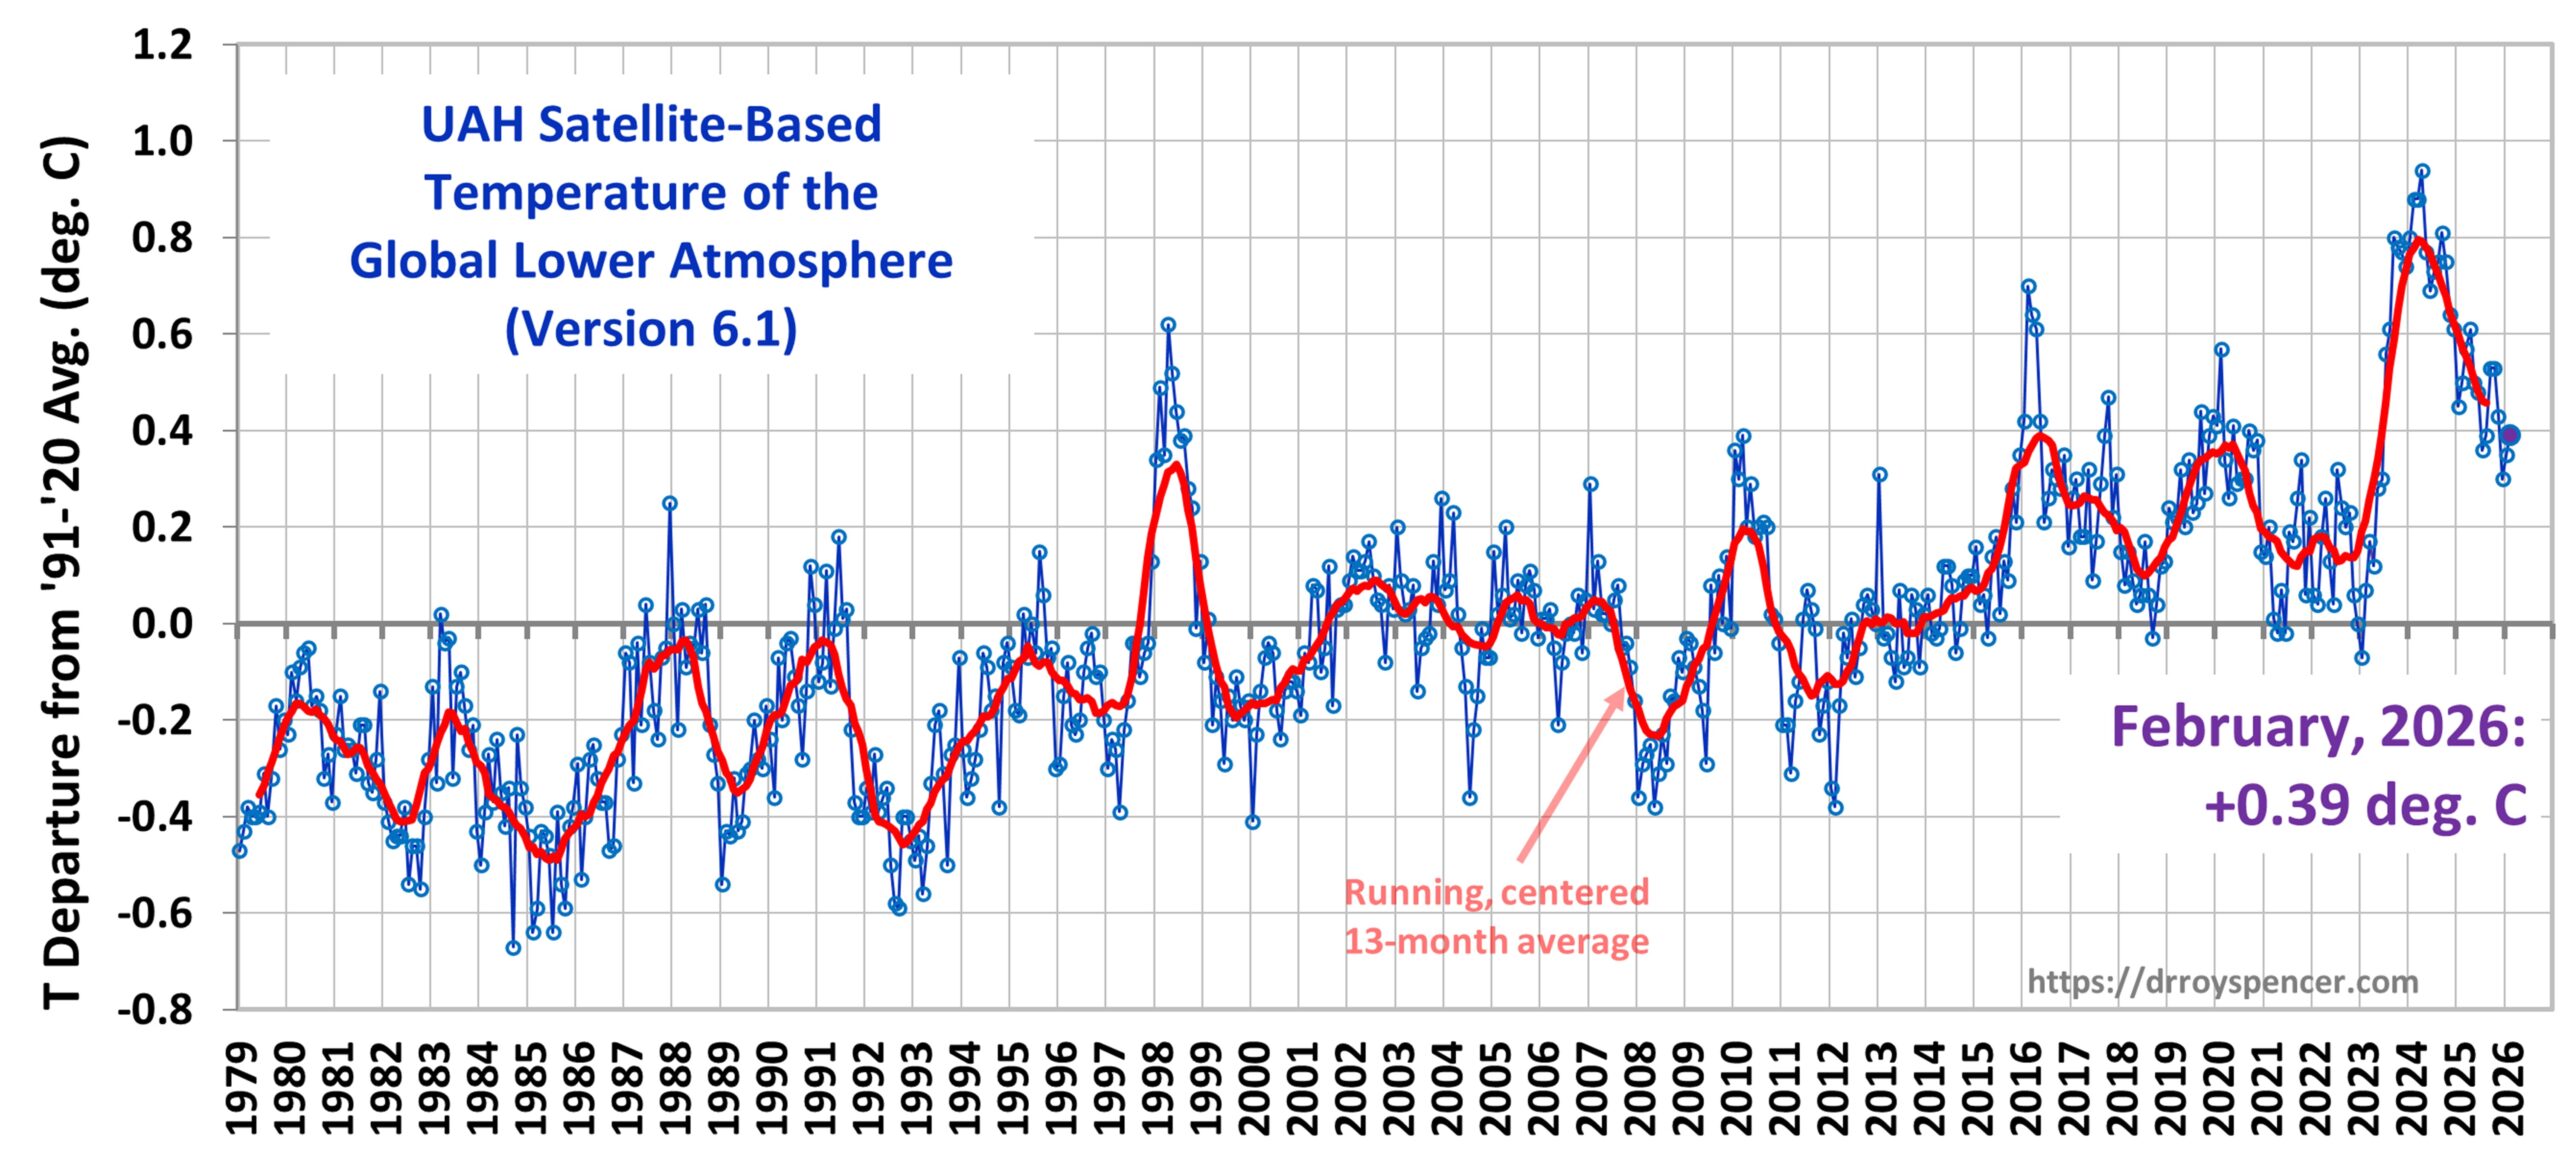
“Following up on March 2026…Here are the 6 warmest months ever recorded (UAH, CONUS):March 2026 — +3.74°C
March 2012 — +2.24°C
December 2025 — +2.10°C
February 2017 — +2.06°C
April 1981 — +1.97°C
February 2026 — +1.91°C
Incredibly, 3 of the last 4 months make the list.We’re not just breaking records, we’re stacking them. This is what a shifted climate baseline looks like.”
“This is absurd.Satellite data (UAH) shows March 2026 shattered the all-time US record, coming in more than 1.5°C warmer than March 2012, which was already legendary.We didn’t just break the record. We obliterated it.”
Source: http://drroyspencer.com
Thanks very much, Larry!
I contend that the incredibly rapid warming in the east/central tropical Pacific burping out heat into the atmosphere was likely the biggest factor for the extreme pattern. This is entirely from natural variation with greenhouse gas warming superimposed on top of it.
Re: Re: Re: 2-17-26 El Nino, here we come-FAST!
By metmike - April 2, 2026, 1:11 p.m.
We should also note that the greenhouse gas warming that was superimposed on Canada was EVEN GREATER because of the higher latitude/colder and drier air which has LESS H2O and more room in the same radiation absorption bands that overlap between H2O and CO2.
Reality: The temperature extremes between the south and north this year would have been even MORE extreme without global warming as a result of the increase of CO2 from humans burning fossil fuels.
In case that isn't clear to others.
Without global warming, Canada would have been colder by a greater magnitude than the US would have been less warm.
April 3rd, 2026 by Roy W. Spencer, Ph. D.
++++++++++++++++++
This is what the temperature changes/anomalies look like from global warming the past 140 years. Highest latitudes warming the most because the cold, DRY air doesn't have much H2O to saturate the radiation absorption bands compared to the warm, humid areas, where those absorption bands are nearly saturated from H2O which overlaps with the CO2 absorption bands.
https://www.youtube.com/watch?v=haBG2IIbwbA

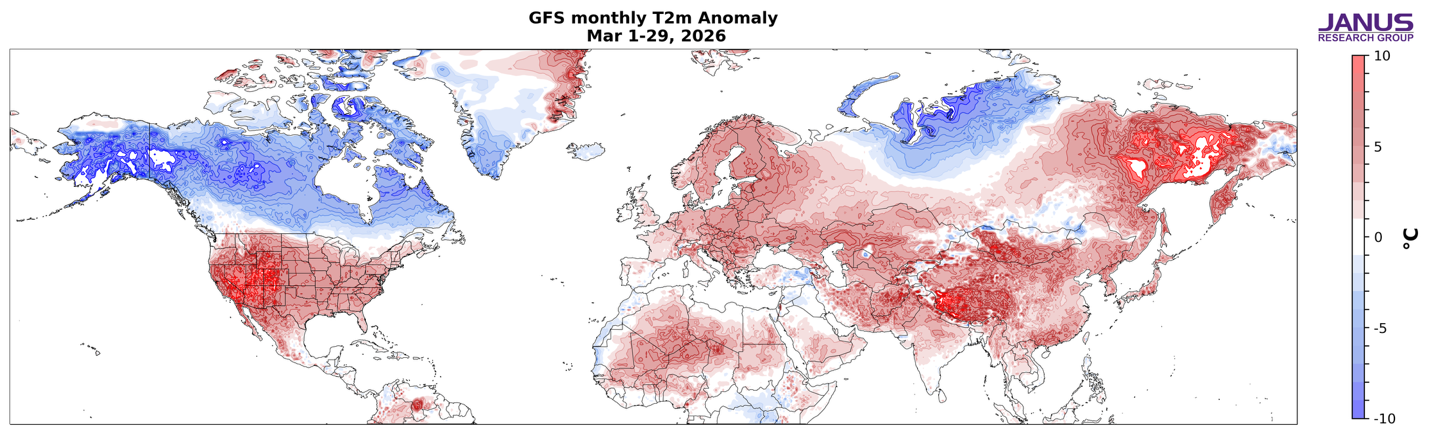
Compare that to the extreme, record breaking anomalies we just had in March 2026 below.
This is the polar OPPOSITE of the pattern that climate change is causing. This is evidence that climate change likely did NOT cause the weather from the stalled position and extreme anomalies of large scale features in March 2026. In fact, climate change made the gradient/contrast LESS extreme from this pattern which occurred from natural variation.
Temperatures in the US were even warmer because of global warming being superimposed on the entire atmosphere but the amount of warming was much greater in Canada, so that 100 years ago in the old climate, temperatures would have been colder by a much greater magnitude in Canada than the US was less warm from the anti global warming pattern that we just had in March 2026.
++++++++++++++++
The extreme cold in Canada was caused by an unusually long lasting cross polar flow anomaly described earlier this month.
Re: Re: Historic SW US March heatwave
By metmike - March 24, 2026, 12:03 p.m.
I really have no idea what caused this long lasting cross polar flow, other than natural variation but there was a physical reason for that too. Also, the amount of wind that we've experienced because of this incredibly steep temperature gradient(causing tight pressure gradients) much of the month has been unusually high.
++++++++++++
Added: From our Paducah, KY NWS for this region:
https://www.weather.gov/pah/March2026ClimateSummary
Evansville observed 7 days with highs reaching 80, which tied 2012 for the most on record in the month of March.
It was also a very windy month with numerous days with wind gusts reaching 30 to 40 mph and even higher. Paducah registered 213 hours with wind gust of 20 mph or greater. This was the most on record for any month of the year, with hourly wind data available back to 1997 (previous record was 200 hours in March 2025). Evansville also broke their all-time record, with 219 hours with 20 mph or greater gusts (previous record was 190 hours set in March 2025).
To give you a perspective on how long 219 hours is. 9 days of 24 hours/day is 216 hours. There were 744 total hours in the month. 219 hours is almost 30% of the hours in the month of March 2026 being windy.
And we beat the old windy record by 29 hours, which is more than 10% higher than the previous record. It's not clear if they only went back to 1997 for Evansville. Regardless, the incredible temperature gradient between our warmth and the cold to the north is what caused it. The cold, dense air in Canada was associated with some huge high pressure systems with numerous DEEP low pressure systems developing along the steep temperature gradient between the cold and warm. The main storm track for those cyclones/storms was to our northwest which resulted in very strong south/south winds winds ahead of them. After they passed, the winds would shift to strongly northwest on the back side of the departing deep low pressure system. This caused several very brief but significant cold snaps from Canadian air that had continually pooled/collected in Canada from its original source region of Siberia, being steered in with cross polar flow from Siberia(the source region).
This was an example of that:
Re: Re: Re: Higher risk severe weather threat 3-15/16-2026
By metmike - March 16, 2026, 2:36 a.m.
The cold air is dumping in fast!
https://www.mesonet.org/weather/air-temperature/national-wind-chill-heat-index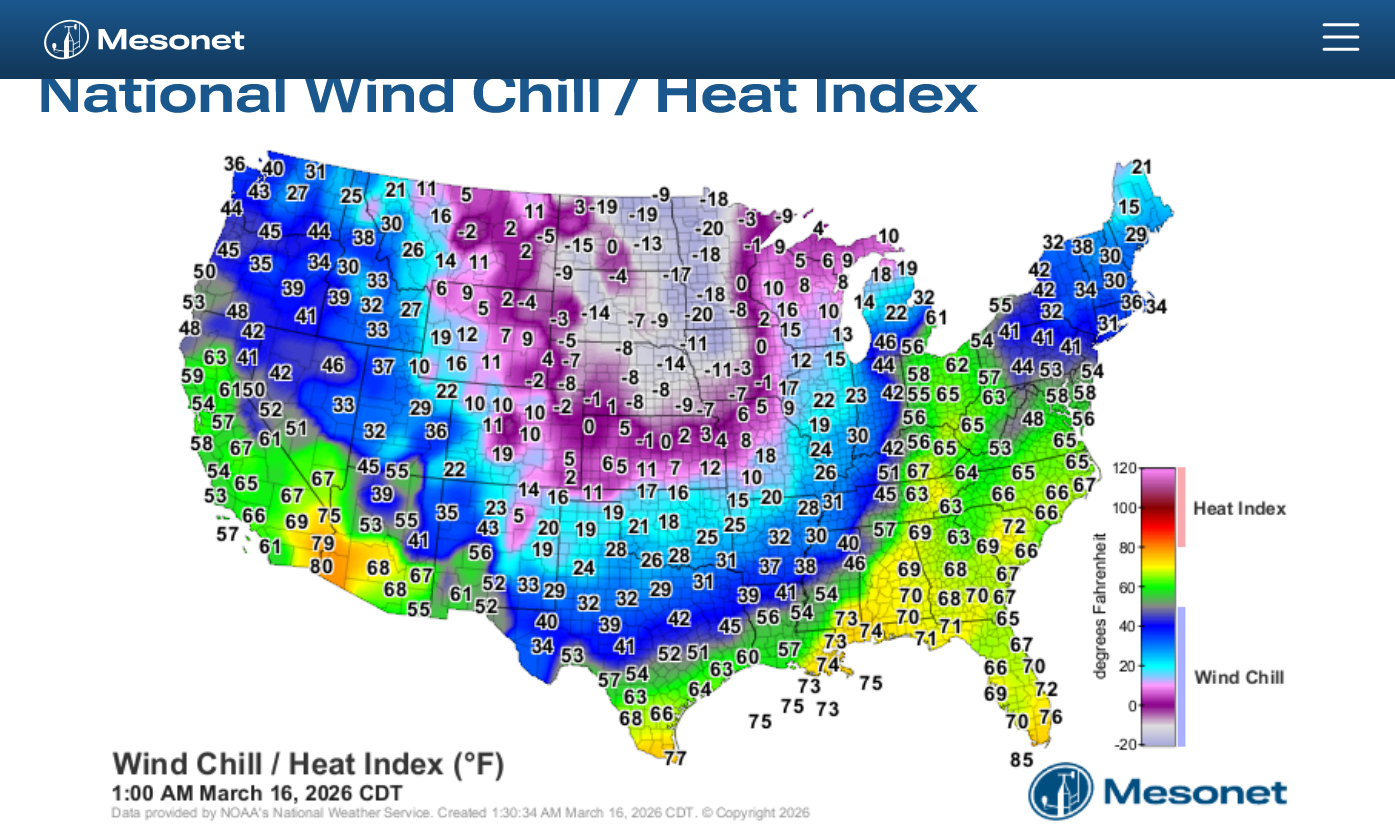
Temperatures have dropped 34 degrees this evening.
https://forecast.weather.gov/data/obhistory/KEVV.html
Current Conditions below updated every few minutes.
https://www.spc.noaa.gov/exper/mesoanalysis/new/viewsector.php?sector=19
2am surface map below
Extremely deep low pressure center and tightly packed isobars!
Re: UAH Global Temperature March 2026
By metmike - April 4, 2026, 1:54 p.m.
https://en.wikipedia.org/wiki/Contiguous_United_States
The contiguous United States, also known as the U.S. mainland, officially referred to as the conterminous United States, consists of the 48 adjoining U.S. states and the District of Columbia of the United States in central North America
If just the contiguous United States were a country, it would be fifth on the list of countries and dependencies by area, behind Russia, Canada, China, and Brazil.
+++++++++++++++
The contiguous United States (the 48 lower states and D.C.) covers an area of roughly 3.12 million square miles (8.08 million
 ). This area constitutes approximately 1.5% to 1.6% of the Earth's total surface area and roughly 5.4% to 6% of the world's total land area (approx. 57.5 million sq miles).
+++++++++
Let me repeat that: This area constitutes approximately 1.5% to 1.6% of the Earth's total surface area


