The following is very interesting as regards the controversial topic of potential significant deep ocean heating from sources independent of AGW:
Apr 28, 2026
by David Appell, Phys.org
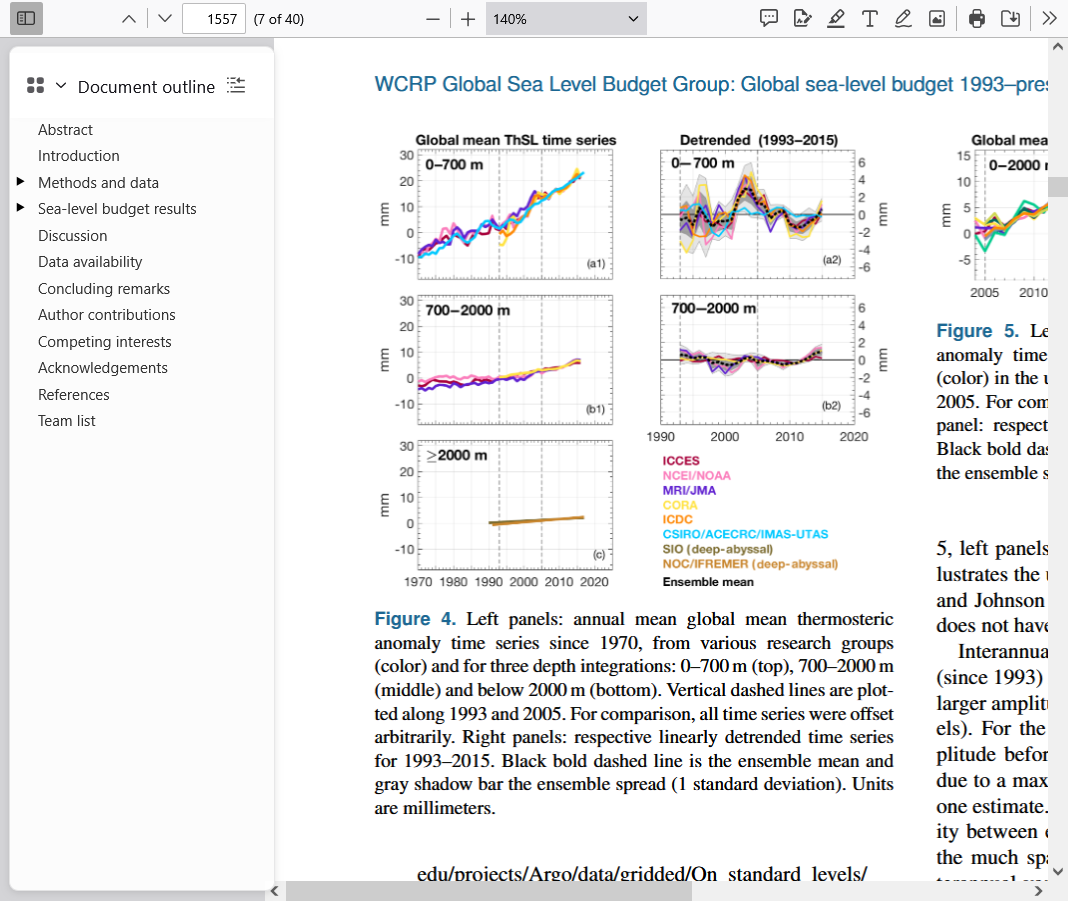
Scientists found that up until 2016 that the global mean sea level (GMSL) "budget," accounting for all the energy flows that create sea level rise, was "closed," but since then it has developed a hole in it. The budget is no longer closed, at least according to ocean heat data, down to 2,000 meters. Where was the missing cause for the latest sea level rise?
Now a new examination of sea level in the global ocean since 2016 has closed the GMSL budget and brought the sea level books back into order. The new researchappears in the journal Earth's Future. The paper is important for showing that deep ocean heating can no longer be ignored when considering sea level rise and its acceleration.
Deep ocean heat's growing role
In particular, the researchers, with lead author Anny Cazenave, an emeritus scientist at the Laboratory of Space Geophysical and Oceanographic Studies (LEGOS) at Toulouse, France, found that accounting for sea level rise from expansion due to added heat in the deep ocean, below 2,000 meters, allowed the GMSL budget to be "almost closed" since 2016.
"The next step," they write, "will be to determine whether the recent deep ocean change is due tointernal climate variability, forced anthropogenic response or a combination of both."
https://phys.org/news/2026-04-anomaly-global-sea-deep-ocean.html
———————————————
Does this imply that deep ocean seismic activity MAY actually be an independent nontrivial source of ocean warming? Perhaps this may help explain the pockets of extreme ocean warming such as has been the case in the W PAC? Keep in mind that David Appell is not an AGW skeptic and this isn’t at all minimizing the warming effects of AGW, itself, as regards ocean warming nearer to the surface due to GW from AGW.
This is an awesome, very profound topic, Larry!
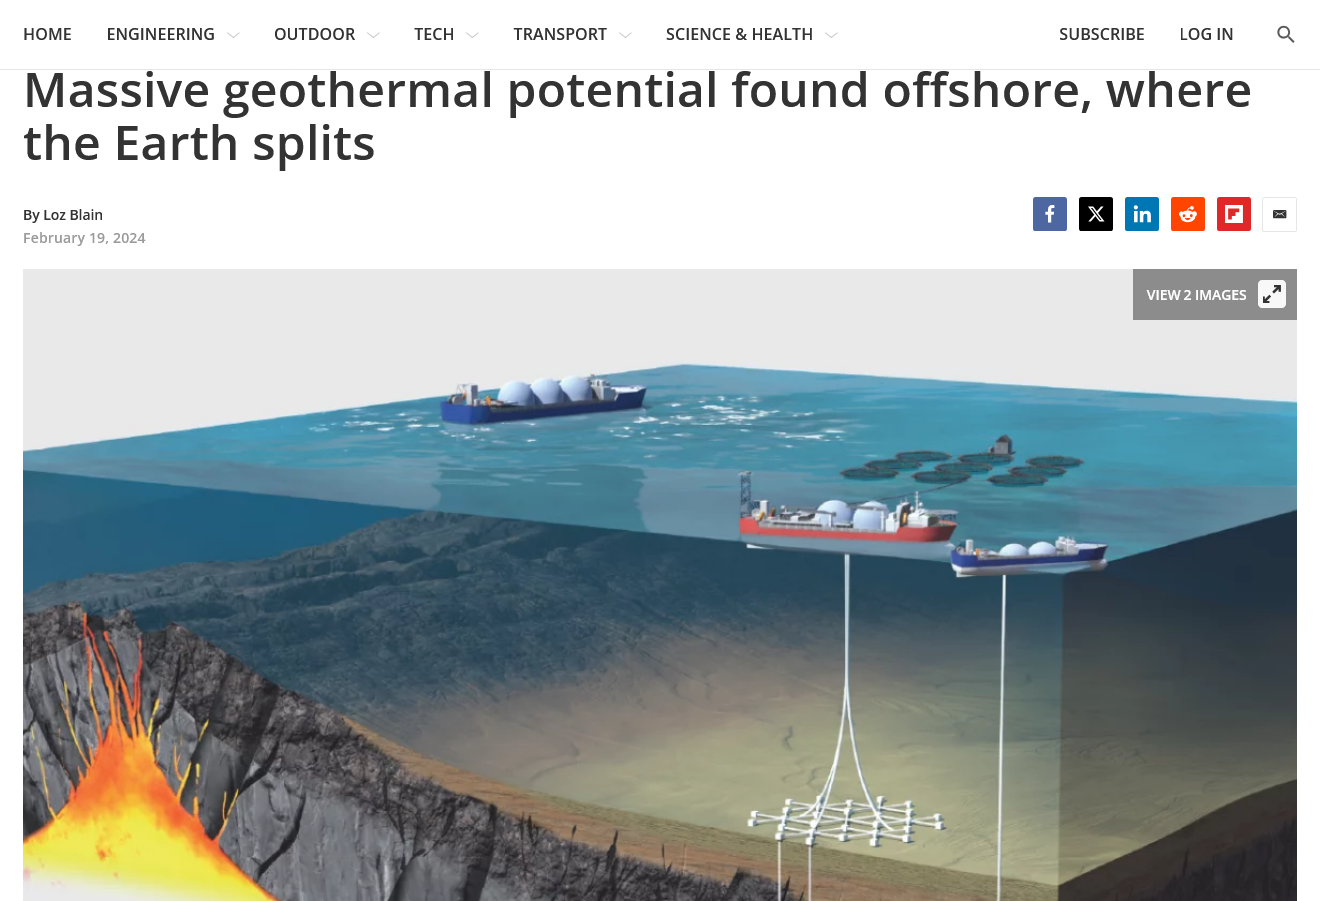
I have wondered many times about the potential contribution from geothermal activity at the bottom of the ocean floors but there isn't enough empirical data/measurements to use in order to have an informed opinion.
Previous posts that discuss "The Blob"
Re: Re: Re: Re: Re: 6-18-23 the next tropical depression
By metmike - June 18, 2023, 4:40 p.m.
El Niño/ENSO update May 16, 2023
By metmike - May 23, 2023, 1:57 p.m.
Turns out that my search for past posts on this, resulted in me stumbling on these links/awesome videos from that last thread.
With the Super Duper El Nino approaching, there couldn't have been a better find!!!!
Your contribution/gift to us 3 years ago, Larry is coming back to really contribute here in 2026!
Re: Re: Re: El Niño/ENSO update May 16, 2023
By metmike - May 23, 2023, 1:17 p.m.
Thanks much, Larry!
This is really impressive and something I've been neglecting so thanks for your persistence and wonderful, very insightful contributions.
From the site that you provided a link to earlier:
https://www.cpc.ncep.noaa.gov/products/precip/CWlink/MJO/enso.shtml#current
https://www.cpc.ncep.noaa.gov/products/analysis_monitoring/enso_update/sstanim.shtml
 |
 |
https://www.cpc.ncep.noaa.gov/products/analysis_monitoring/enso_update/wkxzteq.shtml
 |
 |
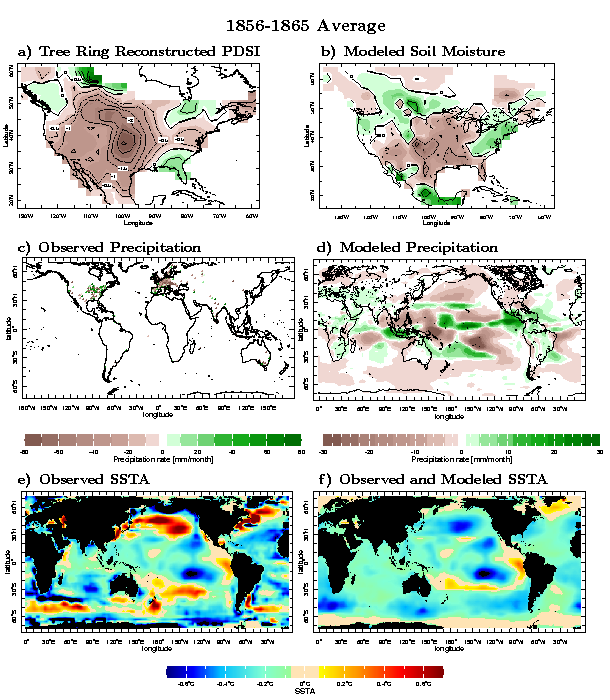
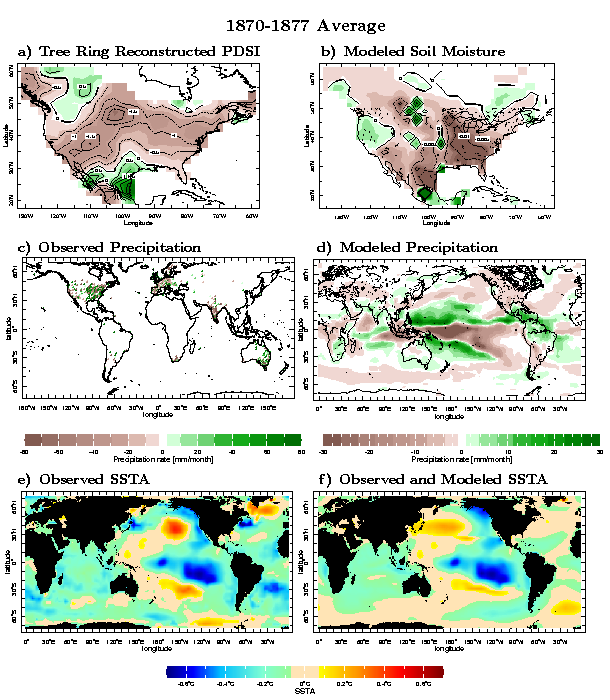
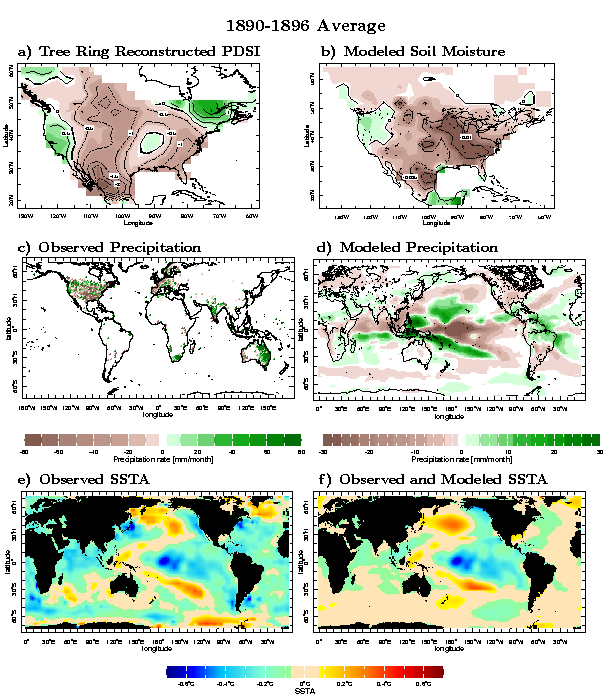
Just to note for everybody (Larry knows)that the article is focused on accounting for the missing explanation for why sea levels increased a bit more than expected using the currently known contributions.
More than 30% of the increase in sea levels is from the oceans warming that causes thermal expansion. We are accurately measuring the top layers and can accurately calculate how much that contribution is. As well as from melting ice on the planet and from runoff that comes from land that includes sources, like rainfall and ground water used by humans that makes its way to the oceans.
I wonder if they could be off on runoff from land since we are massively drawing down aquifers and having record rain events?
Regardless, it’s a fascinating topic. We actually know much more about the moon that’s 238,000 miles away than we do about the bottoms of deep oceans, miles below the surface and much closer to intense heat sources below the bottom of the ocean.
I was under the impression that water had a maximum density at 4C. Turns out that's wrong in deep salt water, which maxes at 0C. Nice to learn something today! Thanks, guys.
Some links at a Reddit page - https://www.reddit.com/r/askscience/comments/1yiuh4/how_cold_is_the_water_at_the_bottom_of_the/
Thanks very much for that fascinating tidbit, patrick.
I didn't know some of that!
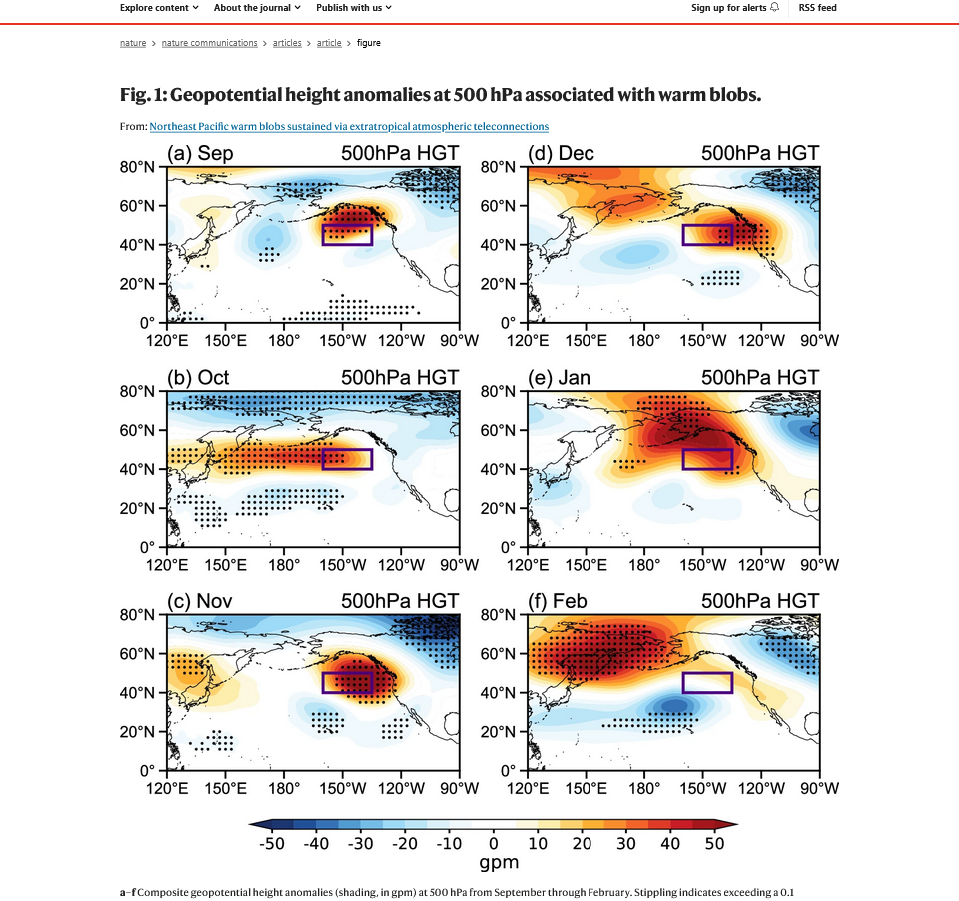
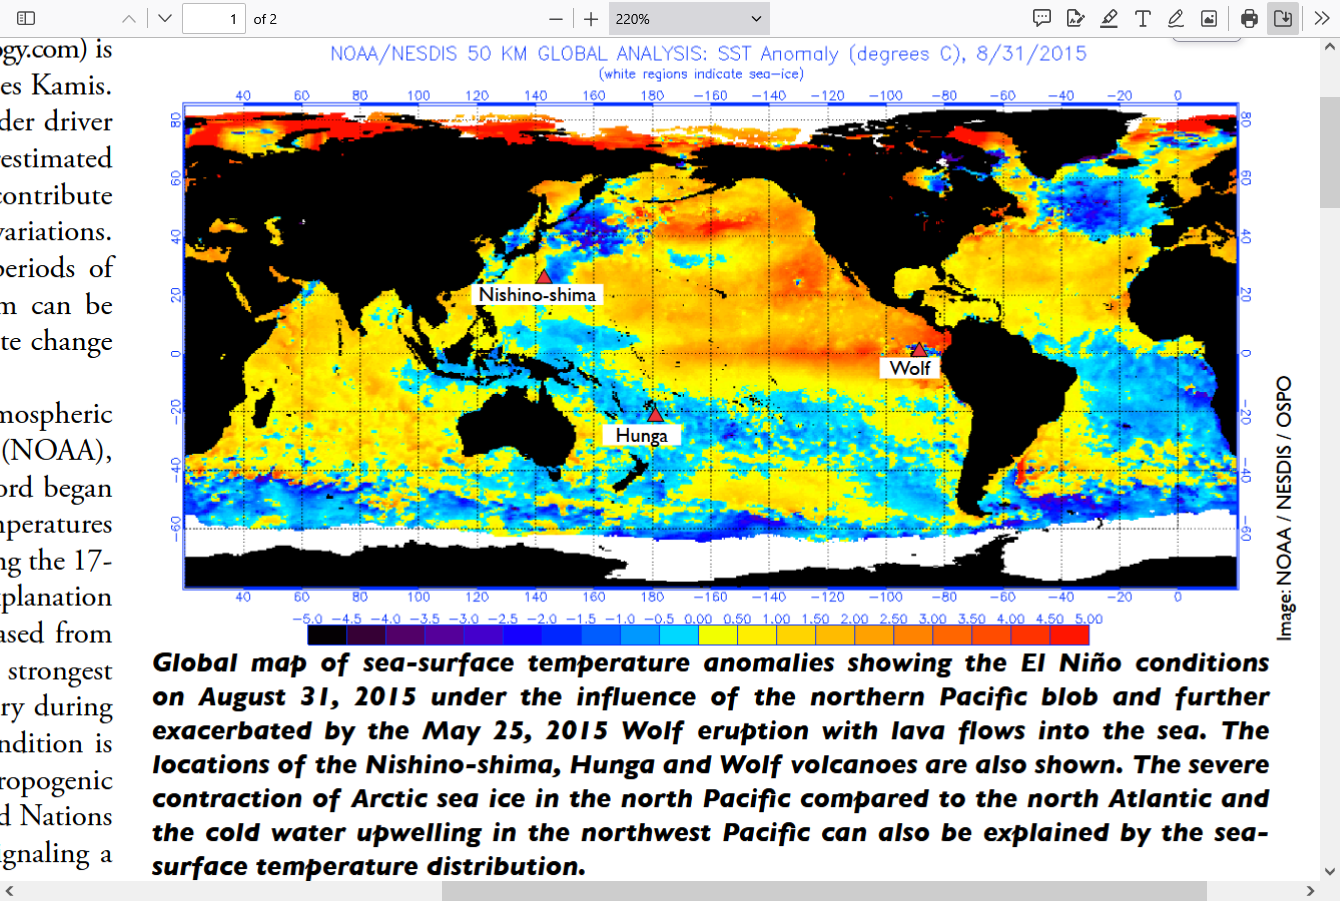
Most of these blobs are explained by circulations in the atmosphere and water!
https://www.nature.com/articles/s41467-024-47032-x
https://www.cnn.com/2025/09/19/climate/pacific-ocean-blob-hot-water-global-warming
++++++++++++++
https://www.science.org/doi/10.1126/sciadv.adx9452

I don't expect people to read all this but am just sharing what I read most of in case there is interest in learning more.
This is a wonderful topic. Thanks again, Larry! The oceans are 2/3rds of the surface area of the planet and contain the VAST majority of heat and water. They mean EVERYTHING when it comes to our weather patterns, short and long term. Most water vapor/precipitable water in the air for rain/snow making came from the oceans!
Geothermal heat: an episodic heat source in ocean
file:///C:/Users/Mike/Downloads/ImpEng2017S.pdf
https://sky-lights.org/2018/10/15/qa-thermal-expansion-and-sea-level-rise-part-1/

Ocean Thermal Stratification: The oceans are warming mostly on the surface, where heat from the Sun and atmosphere is absorbed and diffused through the first 200 meters. This surface layer has an average temperature of 17 °C, so it has a lower density and floats on top the cooler water below. The layer is well-mixed by the action of wind, waves, currents, convection, and the addition of fresh water from rain, rivers, and melting ice. Sometimes called the mixed layer, it is essentially isolated from the water below.
Under that lies the thermocline spanning from 0.2–1.0 km depth on average. Temperature decreases linearly with depth from 17 °C at the top to 4 °C at the bottom. Heat from the warm surface layer diffuses downward slowly, by conduction only. The bottom of the thermocline is defined by the temperature at which water is most dense.
Below that lies the cold deep water. Its temperature starts at 4 °C just under the thermocline and decreases to near 0 °C at the ocean floor. Note that water at temperatures less than 4 °C is normally less dense than water at higher temperatures, and thus would float to the surface. However, water at the ocean floor is subjected to a pressure of 1000 bar (16,000 psi) compressing it to a density 5% greater than normal, so this water remains at the bottom.
+++++++++++++
Since our calculation will focus on the top-most layer of water, we’ll set H = 0.2 km. Measurements reported by the IPCC were made to depths averaging 2 km, so data in this range are reliable.
Volumetric Thermal Expansion: Ocean surface temperatures have been rising about 0.12 degrees Celsius per decade on average over the past 50 years — a total ΔT of +0.6°C. That will be the baseline for our calculation. We’ll convert back to units of mm/yr at the end. First thing we need is the volume of water (Vo) that’s doing the expanding. From the model that would be:
Vo = π R2H = π(1.07×10⁴ km)2(0.2 km) = 7.2 × 10⁷ km3
As that volume of water warms it will expand. The volumetric thermal expansion of water is given by:
ΔV = βV0ΔT
where ΔV is the change in volume, β is the (substance-specific) coefficient of volumetric expansion, V0 is the original volume, and ΔT is the temperature change in °C. But it’s not quite that simple …
Coefficient of Thermal Expansion: For water, β is not constant. It’s not even linear. β = 0.88 × 10⁻⁴/°C at T = 10 °C, but it climbs to β = 2.07 × 10⁻⁴/°C at T = 20 °C. By the time the temperature reaches 60 °C, β will climb to 5.16 × 10⁻⁴/°C. In short, the warmer water gets, the faster it expands. The average ocean temperature above the thermocline is 17 °C, so we’ll interpolate (see thumbnail below) to get β = 1.78 × 10⁻⁴/°C. But these numbers are for pure water.
For seawater of average salinity (3.5%), β is about 25% higher compared to pure water. So we’ll use β = (1.25)(1.78 × 10⁻⁴/°C) = 2.23 × 10⁻⁴/°C. Thermal expansion is mechanically driven by Brownian motion via particle-to-particle collisions. The mutual repulsion of ions dissolved in seawater adds to that effect.
Calculation: We can now find the increase in volume from thermal expansion.
ΔV = βV0ΔT = (2.23 × 10⁻⁴/°C)(7.2 × 107 km3)(0.6 °C) = 9.63 × 10³ km3
That’s almost half the total volume of the Great Lakes! All that “extra” water has to go somewhere, and unfortunately the only possible direction is up. We can calculate the increase in H as:
ΔH = ΔV/πR2 = (9.63 × 10³ km3) / π(1.07 x 10⁴ km)2 = 2.2 × 10⁻⁴ km = 27 mm
That’s the sea level rise over a 50 year period, so the average rate has been 27/50 = 0.54 mm/yr.
This is just over half the value of “1 mm/yr” cited by your source. Fact is, these were all approximate calculations based on averages and partial data sets. Starting from first principles and getting so close to the cited value makes me confident in my model’s predictions.
Uncertainties: My model ignored thermal expansion within the 0.8 km thick thermocline, where the temperature steadily decreases from 17 °C at the top to 4 °C at the bottom. We could use calculus to find this additional volume of expansion inside the thermocline, but I leave that as an exercise for the curious reader. Suffice it to say this will further increase ΔH.
More recent data indicate ocean thermal expansion is now contributing 42% of the total sea level rise, rather than the 33% suggested by your source — or the 18% predicted by my model. The expansion rate is increasing for three reasons: increase of β with increasing T, melting of sea ice that reflects sunlight back into space, and greater heat input from the warming atmosphere.
So yes, TKL, thermal expansion of seawater is a significant part of sea level rise. Especially troubling to me is the melting of sea ice in polar regions. Open water absorbs far more sunlight than highly reflective ice. This warms the water and melts even more ice — it’s a vicious feedback cycle that might already be too advanced to stop.
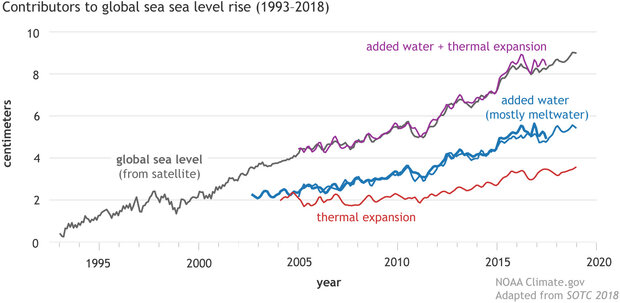
Global sea-level budget 1993–present
file:///C:/Users/Mike/Downloads/noaa_65580_DS1.pdf

It dawned on me from thinking about this more that they are overlooking key element.
How much water is evaporated from the oceans compared to how much is returned to the oceans from rain//snow with the amount stored on land taken away.
Every year, that should result in a LOSS of water from the ocean because some of that amount evaporated out will be stored in lakes, massively stored in soils or locked up in snow.
Severe droughts over large regions would reduce that amount lost compared to saturated vertical moisture soil profiles.
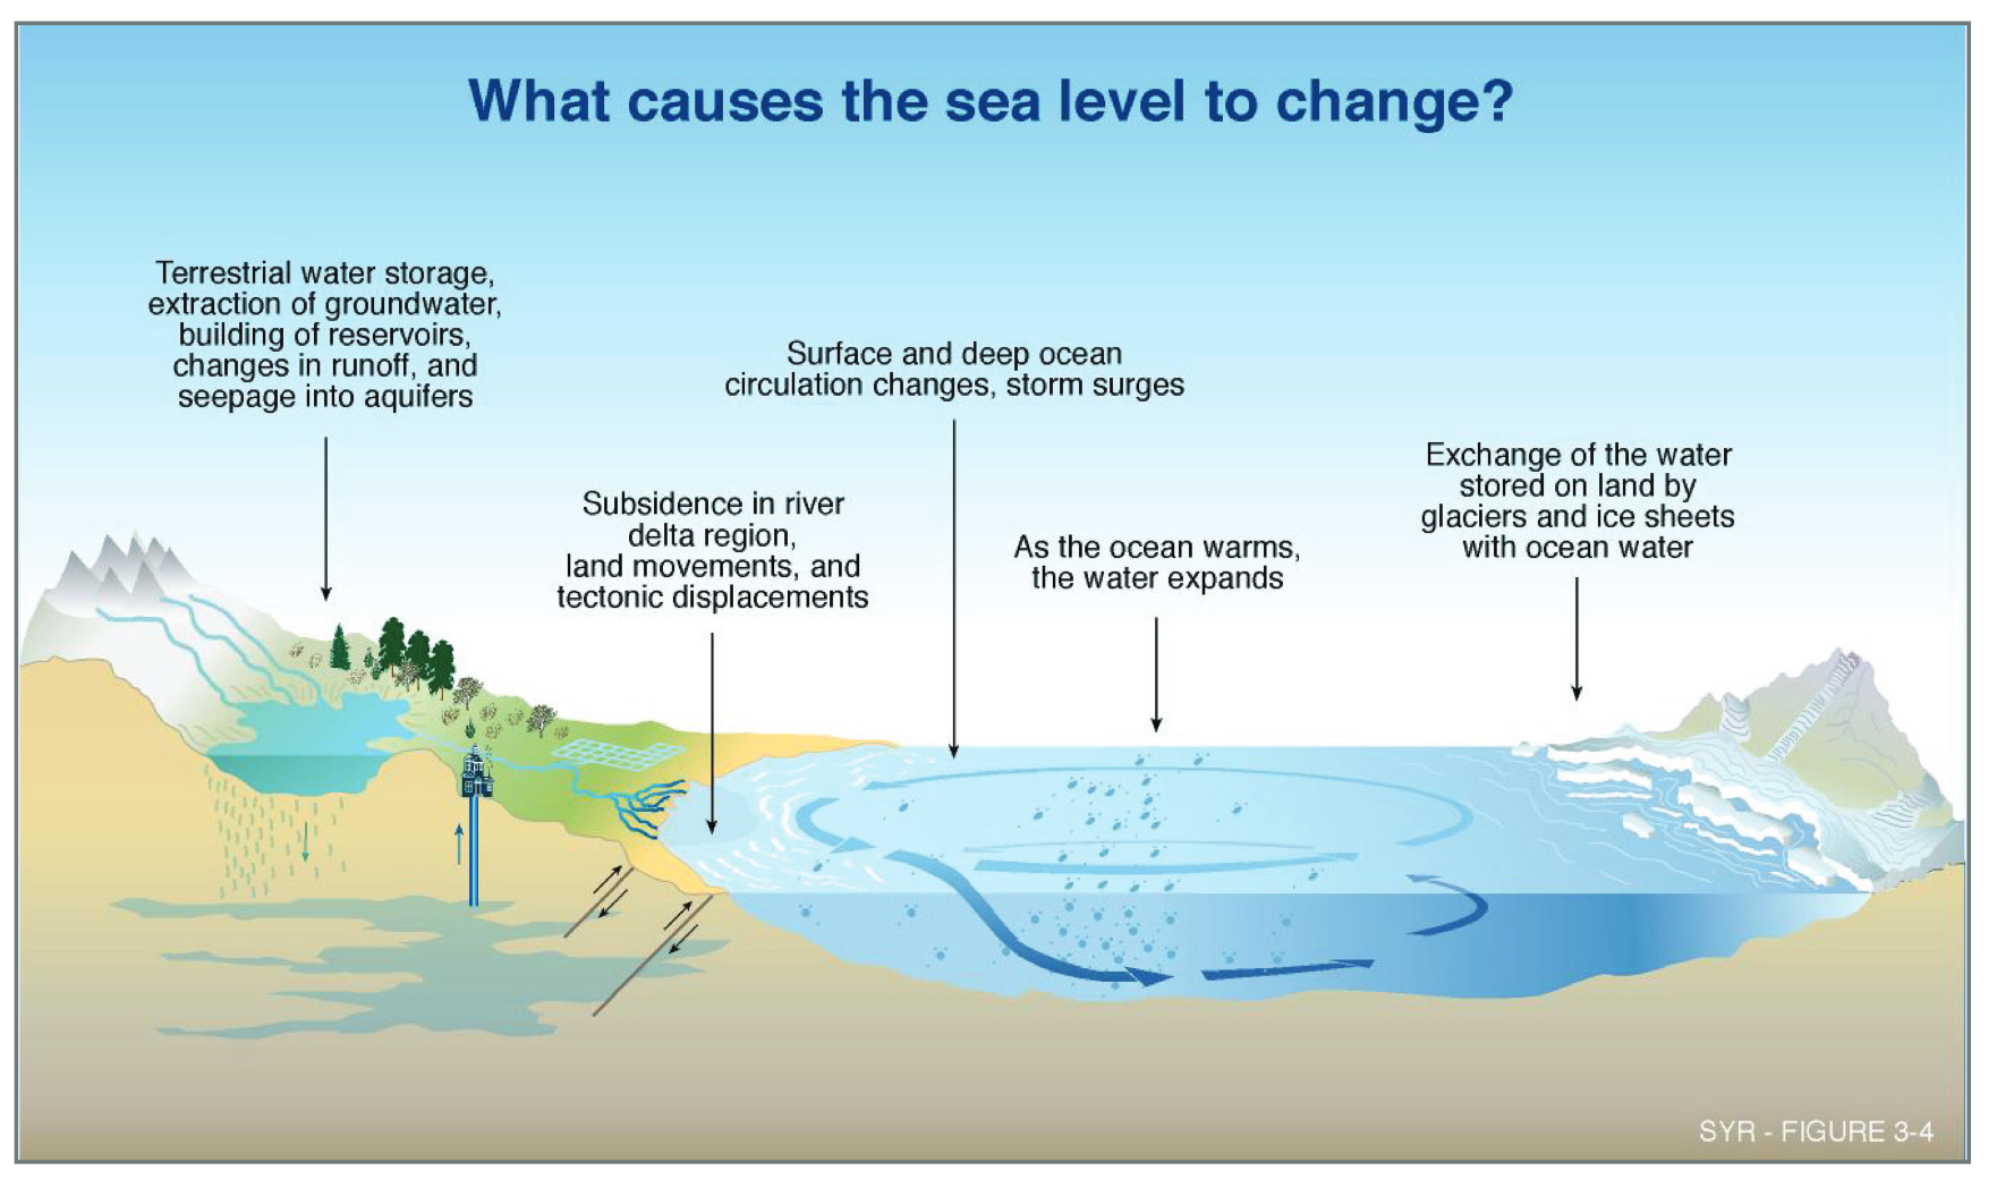
Here are some images to help us think about this more! We call this the WATER CYCLE.
In the previous pages that calculate sea level changes, the water cycle is apparently assumed to be in a steady state but this seems flawed to me.
Part of the sea level increase could be resulting from an imbalance in the water cycle. Maybe the sea level increase would be even greater but because oceans are losing more from evaporation than they are gaining back it's reducing that? That would be the case in years with MORE SUNSHINE over the oceans.
Or it could be the other way around in some years when there is MORE CLOUD COVER over the oceans (less sun to power evaporation).


https://scienceinsights.org/what-role-does-the-ocean-play-in-the-water-cycle/
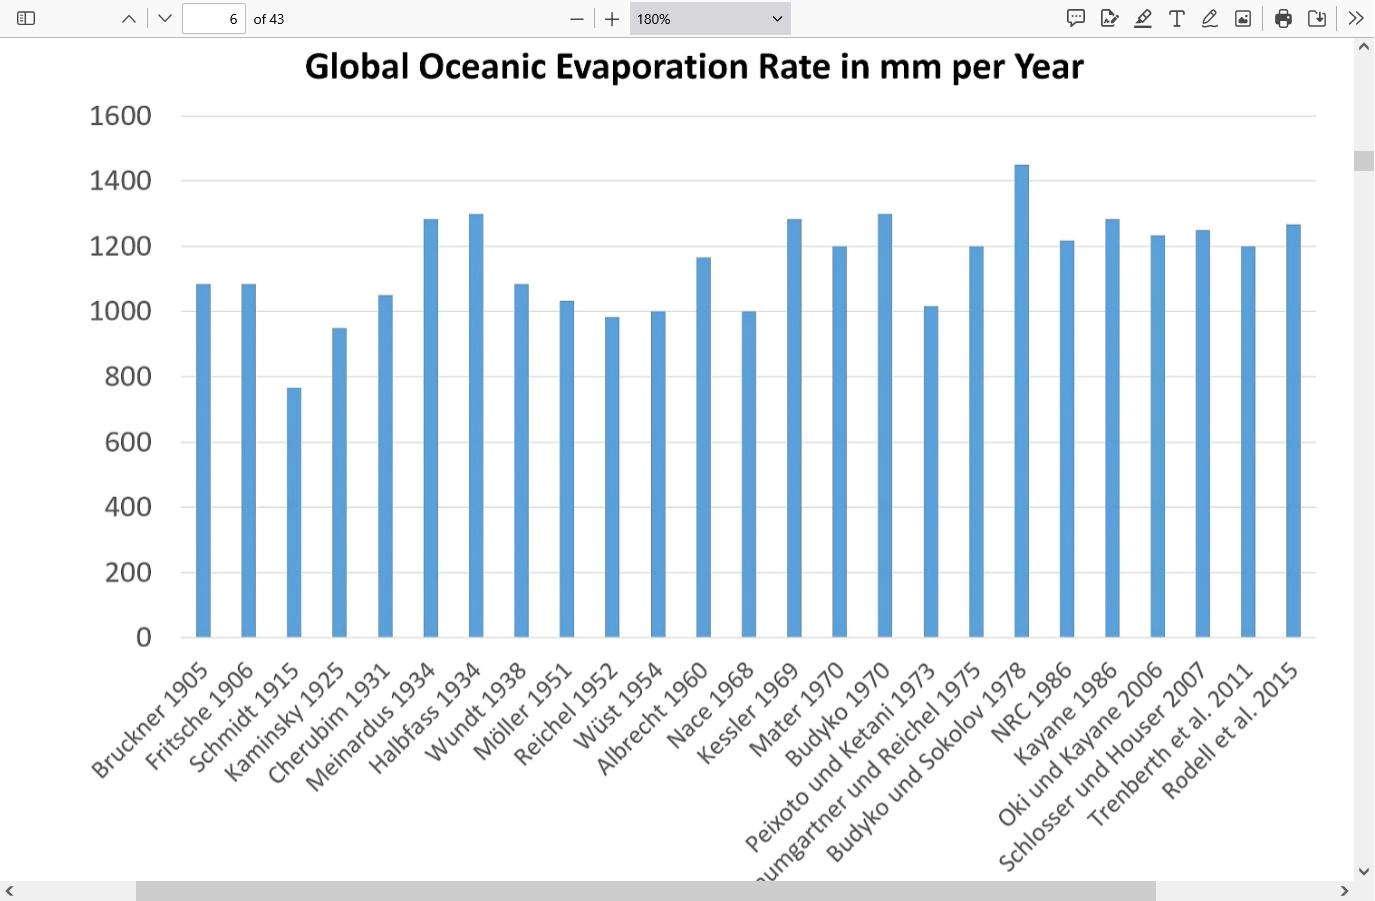
Evaporation is an essential and mysterious part of the water cycle. Solar energy drives evaporation of water from oceans, lakes, moisture in the soil, and other sources of water. In hydrology, evaporation and transpiration (which involves evaporation within plant stomata) are collectively termed evapotranspiration. Evaporation is ultimately caused when water is exposed to air and the liquid molecules turn into water vapor which rises up and forms clouds. Although this value will vary considerably from location to location, hydrologist and climatologists estimate that an average of about 5 feet or 60 inches of water evaporates from the oceans each year.
+++++++++++++
metmike: That amount is HUGE! I can't image that there isn't variation each year, just based on small changes in the amount of cloud cover, which would increase or decease the powerful sunshine which powers most evaporation!
The range from high to low on the bar graph below is around 400 mm which is around 16 inches of water. The range in recent years is much more narrow and just over and inch.
But that’s as much as the total annual increase! You shouldn‘t have a margin of error as great as the magnitude of the changes.
+++++++++++++++++++=
Relative Humidity: A Control Valve of the Steam Engine Climate
file:///C:/Users/Mike/Downloads/Feistel_Hellmuth_2021_RH_valve.pdf
| 400 mm * | 0.0393700787 in | = 15.7480314961 in |
https://mm-to-inches.appspot.com/400-mm-to-inches.html
https://science.nasa.gov/earth/earth-observatory/earths-clouds-on-the-move-154443/

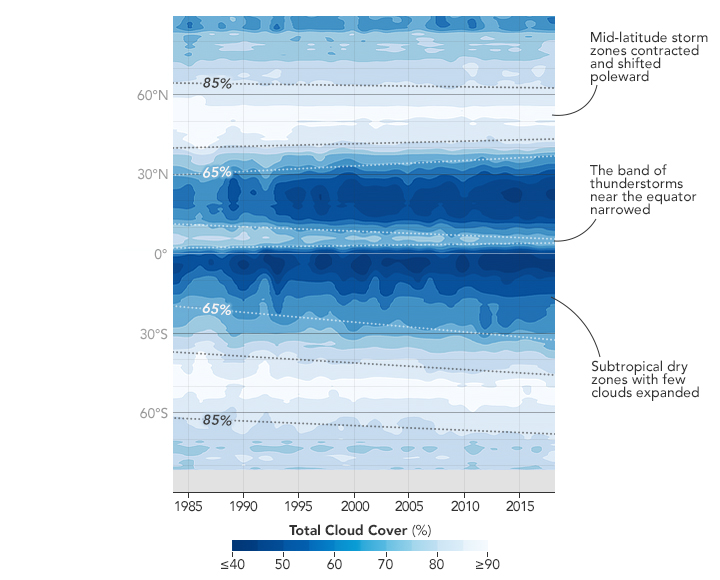
The new research shows that areas over the ocean where storm clouds often form have contracted by between 1.5 to 3 percent per decade. The ITCZ narrowed, and the mid-latitude storm zones moved poleward as they contracted. Meanwhile, subtropical zones with fewer clouds expanded.
These changes are depicted in the chart above: white areas show where storm clouds were common, and shades of blue indicate less cloudy areas. The trend line colors depict the degree of cloudiness. Areas that were cloudy 85 percent or more of days are bounded by black dotted lines. Drier areas that were cloudy on 65 percent or less of days are bounded by white dotted lines. The chart is based on data from the combined record of several geostationary and polar-orbiting satellites that are part of the ISCCP (International Satellite Cloud Climatology Project).
In a second analysis published in May 2025, Tselioudis and colleagues examined the effect of these cloud changes on Earth's energy budget. They found that the shift increased the amount of energy absorbed by the oceans by about 0.37 watts per square meter per decade—a substantial amount on a planetary scale.
+++++++++++++++++
This is profound!
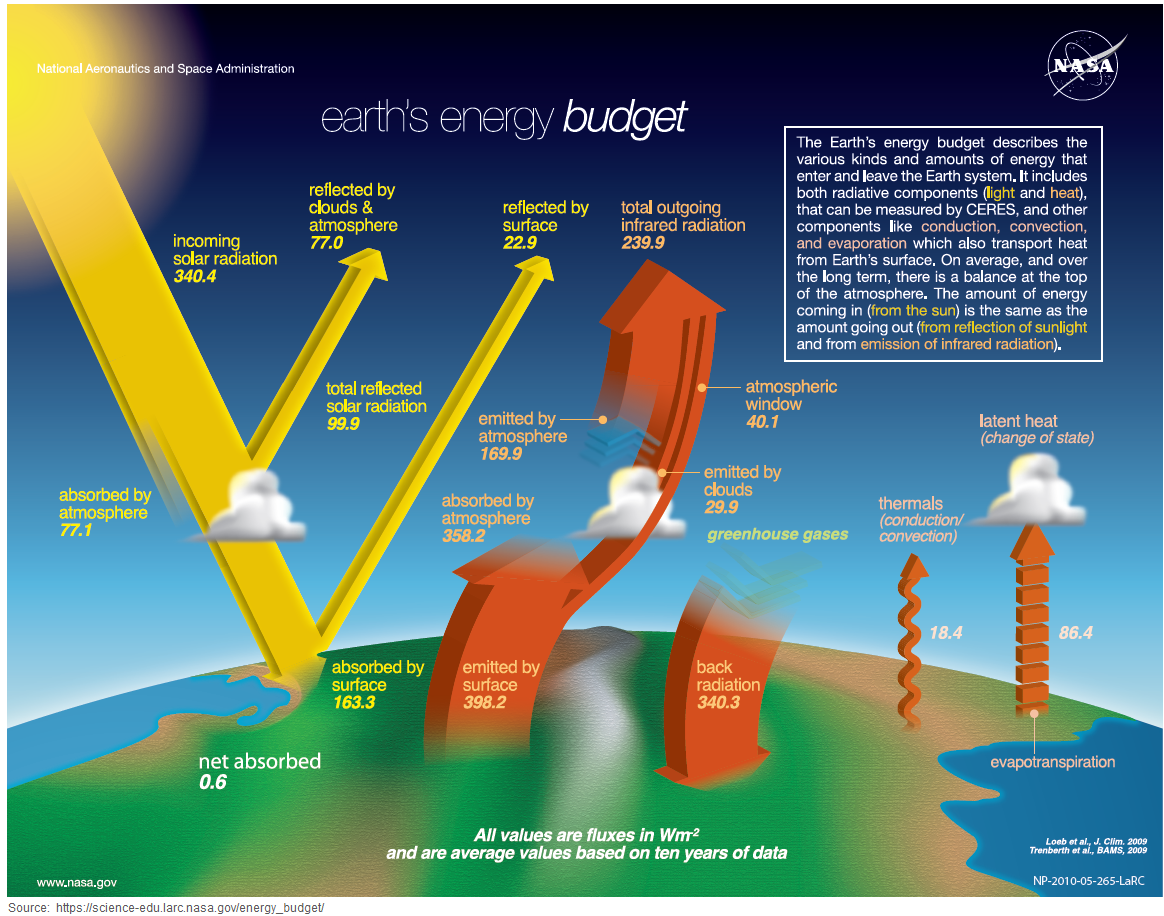
.37/decade = 3.7 watts/sq.meter over 100 years from solar forcing above. ……if that number were constant which it isn’t.
https://www.sealevel.info/Radiative_Forcing.html

2.NASA's estimate of outgoing radiation at TOA is 239.9 W/m² IR + 77.0 + 22.9 = 339.8 W/m², which is 0.6 W/m² less than the incoming solar radiation. That figure is called the “radiative imbalance.” ↑
So how much of this is from the MEASURED/OBSERVED less cloud cover/increased solar radiation?
It's possible that global warming from CO2 is causing a positive feedback which is reducing cloud cover but in that case the forcing being assigned to the direct CO2 physics is TOO HIGH.
This one I've followed off and on for many a year! The biggest chunks of non-ocean water are of course on Greenland & Antarctica, and are being tracked pretty carefully.
https://forum.arctic-sea-ice.net/index.php/topic,4299.0.html
You know better than any of us do the trend (if any) in the total weight of the atmosphere that would occur from change in humidity is spit in the ocean.
On your main point, if you scrounge around, you'll find occasional looks at major changes in the amount of water in the ground due to long term droughts or floods. They do get measured for effect on sea level, and tend to be part of the cause of year to year noise in the trend. I haven't heard anything about the Ogallala in a while. Has something been done? NASA tracks aquifers all over the world, and it seems to have levelled off, or I'm misreading.
https://gracefo.jpl.nasa.gov/resources/48/map-of-groundwater-storage-trends-for-earths-37-largest-aquifers/
That looks like oodles of great data from Greenland, Patrick but I can't seem to get anything that includes this past Winter.
Global warming has impacted the coldest places of the Northern Hemisphere during the coldest times of year the most. So although Summers have been warmer its Winters being MUCH LESS COLD that stand out the most.
The radiation absorption bands of CO2 overlap with H2O. Places that are warm and humid have almost saturated the bands that CO2 uses.
So the DRIER it is, the less H2O there is and the less absorption of radiation there from H2O and the more absorption can take place from CO2. The colder the air is, the drier it is. It's during the bitter cold Winters in the Northern Hemisphere that feature the driest air masses which allow CO2 to maximize its ability to absorb long wave radiation emitted from the surface(and re radiate some of it back down).
So the ice recovery is not as great after each cold season, even as many of the Arctic sea ice melt seasons are not as impressive in comparison.
++++++++++++++
Related to this. The link below was a go to site on ice information related to this but unfortunately, the Trump administration CUT FUNDING!!!
Instead of spending our tax dollars on science, he wants to increase spending to fund the Department of War by 500 billion!!!
https://nsidc.org/sea-ice-today/analyses/sea-ice-today-services-reduced-0
WEDNESDAY, OCTOBER 15, 2025
Beginning October 15, 2025, NSIDC’s Sea Ice Today services will be reduced because of non-renewed funding. This means no new monthly and mid-month analysis posts, limited comparison tools, and reduced user support. Learn more here: https://nsidc.org/data/user-resources/data-announcements/user-notice-sea-ice-today-services-reduced
If you rely on these services, we would like to hear from you. Share your story at nsidc@nsidc.org. Your input can help us demonstrate the importance of sustaining Sea Ice Today into the future.
++++++++++++++
Here's the main link:
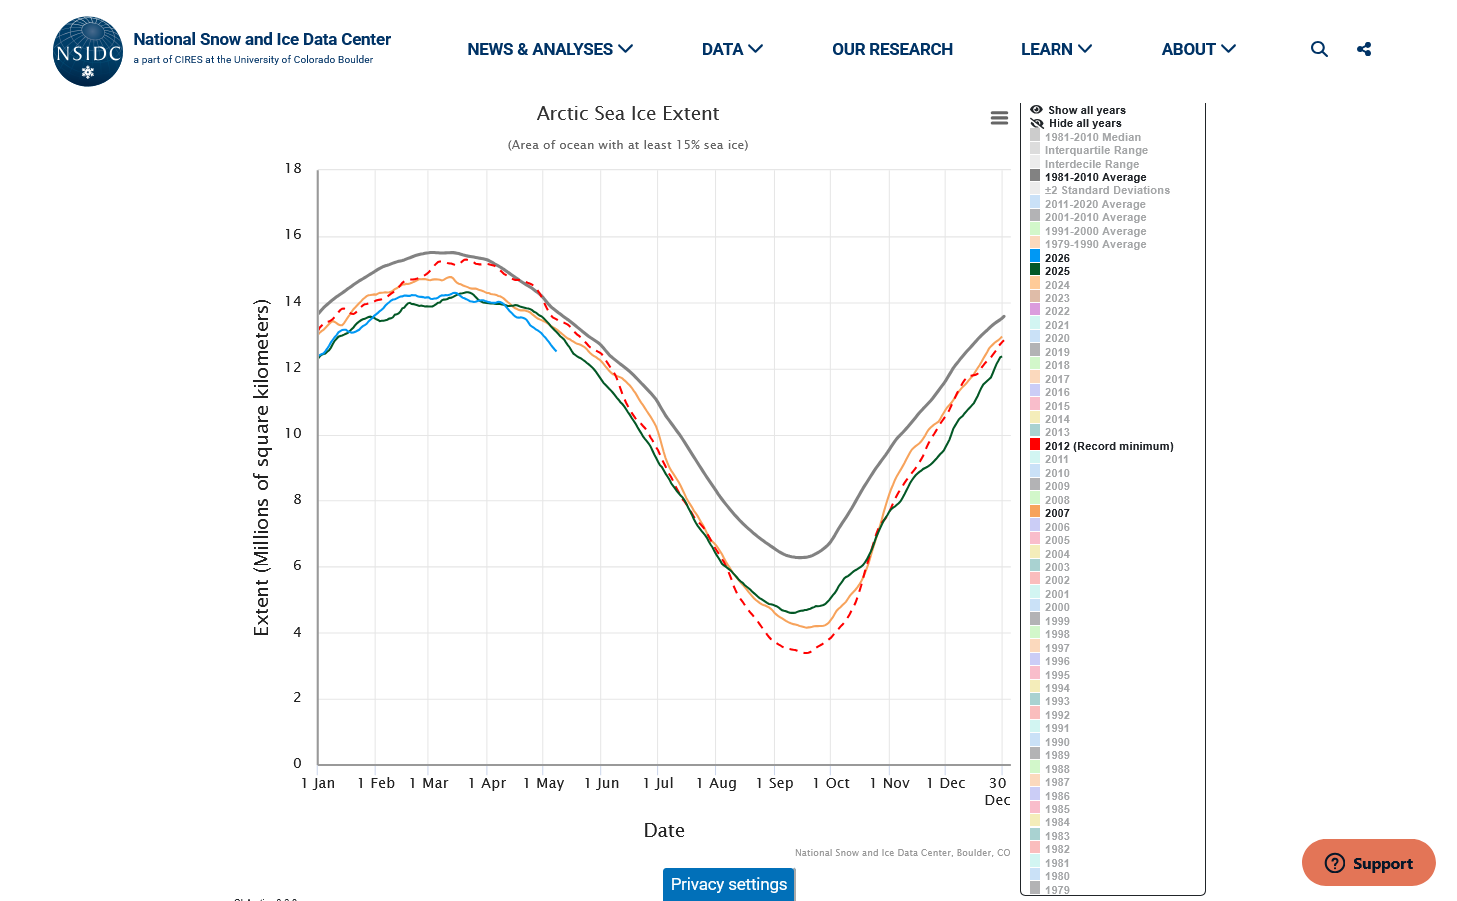
https://nsidc.org/sea-ice-today
This is a favorite that allows us to plot individual seasons going back to 1979 as well as averages. It's awesome! Just hit the years/boxes on the right you want plotted and have fun.
I plotted just the record low year, 2012(dashed red). The previous record low in 2007(orange). The 2025 season in green and the current season in blue.
We have definitely lost ice in this region, however the main point in plotting those years was to demonstrate how far off the alarmist predictions were. Like that of Al Gore that predicted in 2007 that all the Arctic sea ice would be gone by the Summer of 2013.
The bottom/low last year was still below the average but was still ABOVE the lowest in 2012 and 2nd lowest of 2007. So the ice loss has stabilized and not accelerated in the death spiral that was predicted.
That's all I ask for from the world is the objective, SCIENTIFIC facts about global warming that includes the benefits from photosynthesis.
patrick, this appears to be a great link on loss of ground water.
However, I'm baffled like you about why they show the Ogallalla aquifer recovering??? This is NOT good data! This makes me wonder about the rest of the data.

43-foot decline the year before. Let's be real here, that acceleration is terrifying for farming communities.
47-foot drop between January 2023 and 2024. The numbers aren't just statistics on a government report.
S. Geological Survey data from 2024 reveals that some areas, particularly in western Kansas and the Texas Panhandle, have seen water table declines exceeding 150 feet since the 1950s.
")
Each year, the Ogallala recharges by one inch on average, and if fully drained, models estimate that the aquifer would take six thousand years to refill naturally.
There's no technological fix that can speed that up.
++++++++++++
+++++++++++
This is NOT like the fake climate crisis. It's REAL water that is FINITE and REALLY being depleted at an unsustainable rate by many millions of people that have grown extremely dependent on the water.
patrick,
I'm grateful to you for bringing up the Ogallalla! This is probably the biggest coming environmental crisis to our country which appears inevitable at this point.
A U.S. agricultural powerhouse now draining before our eyes.
https://storymaps.arcgis.com/stories/52bd0cd2a448492e85f24292c380ead7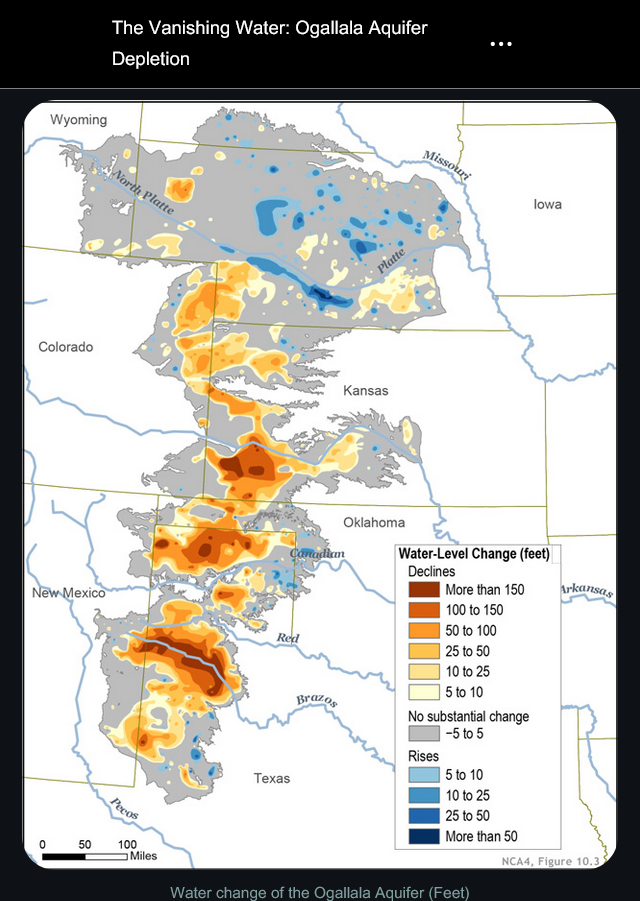
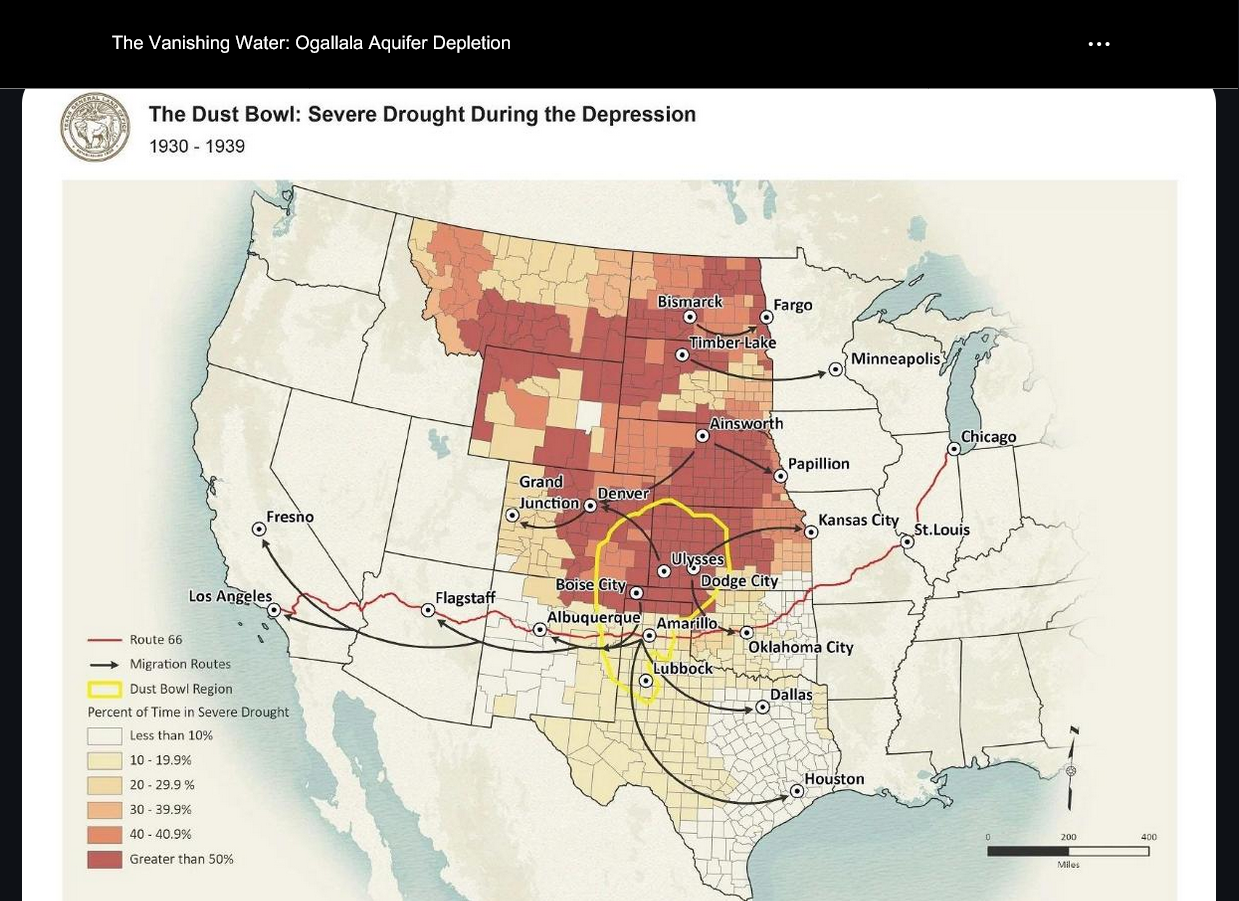
Some of these articles mention that climate change is making this worse. They are DEAD WRONG!
Not only does higher CO2 cause plant requirements for additional rain to be LESS (because it reduces loss of water from roots) but climate change in the Midwest in the Summer has featured cooler and wetter Summers!
Climate change in the United States, with 100% certainty is helping to protect us from widespread severe droughts.
Summer Climate Change in the Midwest and Great Plains due to Agricultural Development during the Twentieth Century
https://journals.ametsoc.org/view/journals/clim/32/17/jcli-d-19-0096.1.xml

++++++++++++++++++++++++++++++++++++++++++++++++++++

++++++++++++
Global cooling and LOW CO2 levels are what cause widespread, extremely long lasting droughts with catastrophic global and huge regional famines!
Here in 2026, we are living in a climate optimum with absolute, scientific certainty!!
Causes and consequences of nineteenth century droughts in North America
https://ocp.ldeo.columbia.edu/res/div/ocp/drought/nineteenth.shtml
+++++++++++++
Regardless of all that, as the Ogallalla Aquifer dries up, the people that dependent on it will SUFFER A CRISIS!!!
Previous related thread:
Therealenvironmental crisis's
31 responses |
Started by metmike - April 10, 2019, 7:11 p.m.
https://www.marketforum.com/forum/topic/27498/
++++++++
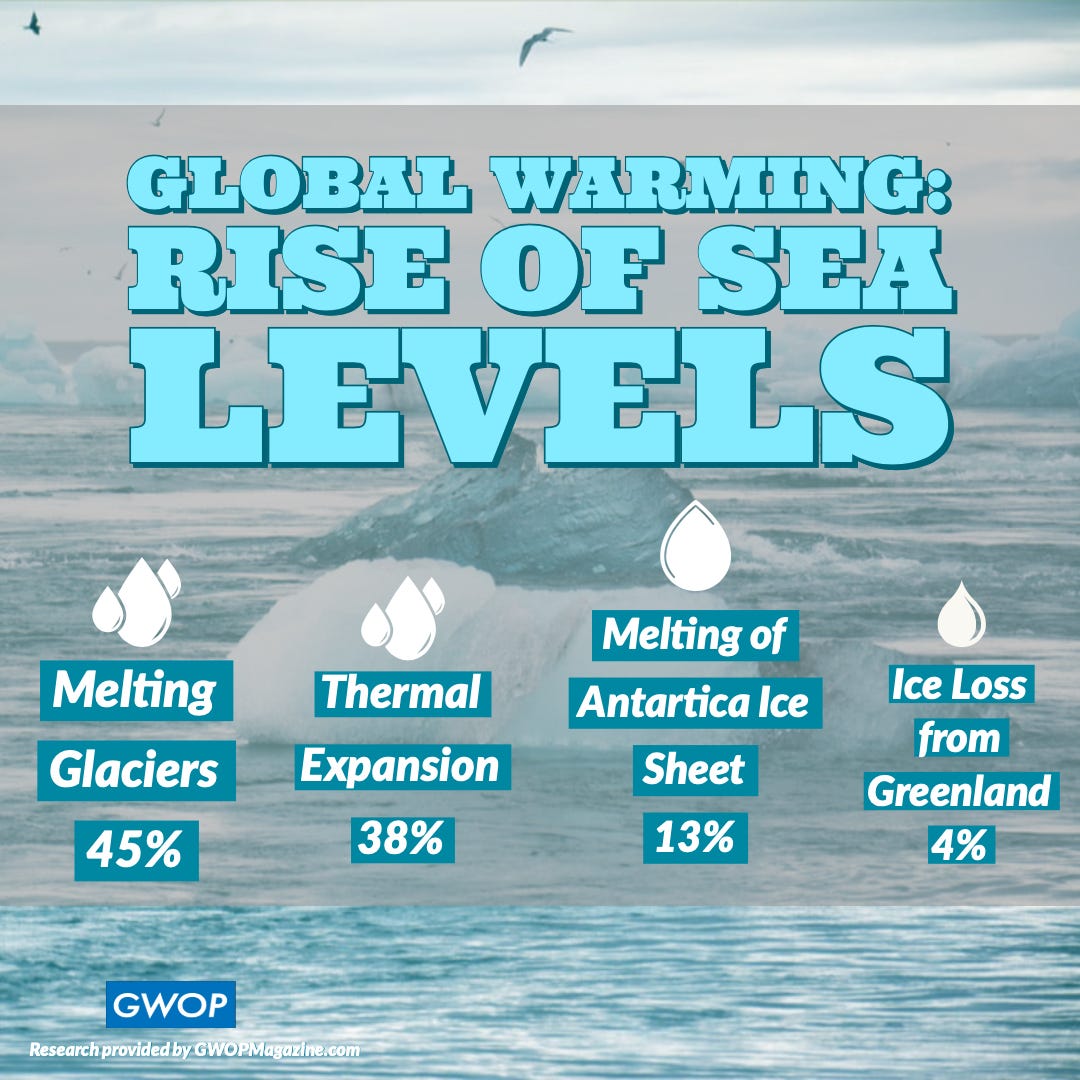
I just noted too that some of the previous images showing contributions to sea level increase do not include ground water that makes it into the ocean.
https://agupubs.onlinelibrary.wiley.com/doi/10.1029/2023GL103509
Connecting groundwater depletion to the drift of the North Pole was not something I expected to see!
Figured you'd be inspired, but going all the way from 1856 drought to geophysics is extra effort.
Thanks!
YW, patrick!
It's always fun to find new tidbits along the way that confirm and contradict what we think that we know.
And interpretations from others that should always be considered, especially if we can't prove them wrong immediately with authentic data.
Another factor mentioned previously is the amount of stored or lost water from lakes, reservoirs, dams and soils. This one is challenging to monitor in a uniform fashion.
We should all agree strongly that melting ice and thermal expansion is an indisputable contributor to rising seas.
It's DUGH science because water expands with temperature and more snow/ice melts than is created when you superimposed enhanced warming on the higher latitudes.
After that, it's complicated and tricky.
Larry started this awesome thread off with an article about the potential for the deep ocean warming contributing to seas increasing to explain some of it increase..............but maybe it really came from more runoff as a result of draining stored water under the surface? Opinions on that are widely varied and reading the evidence from both sides are just as compelling to me. Maybe they are equal contributors? I lean strongly towards the contribution of ground water to be significant and your post/link reminded me of that.......thank YOU!
https://groundwater.org/what-is-groundwater/


We can see below that public water mostly comes from rivers and lakes while crop irrigation is almost all from groundwater. 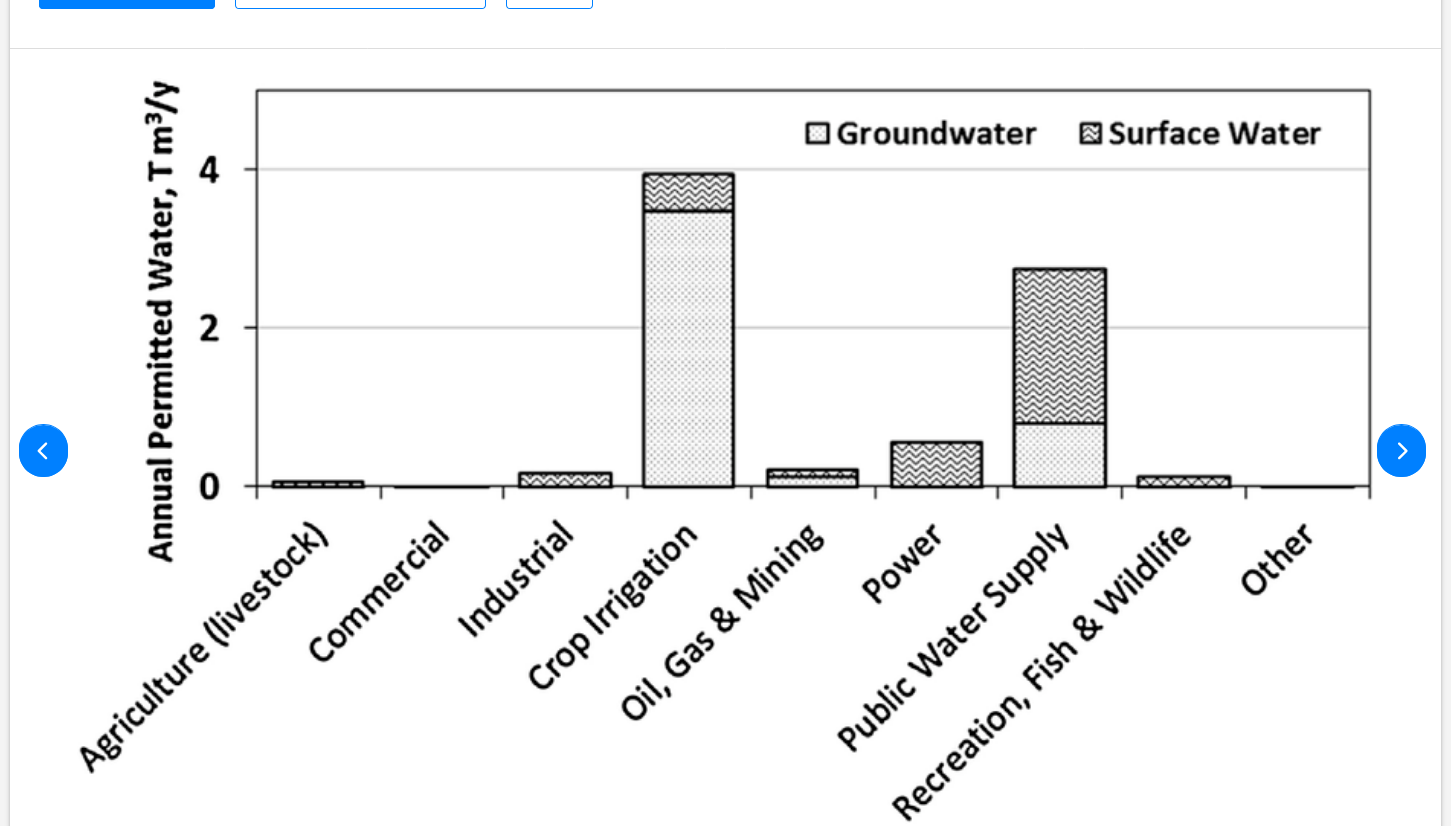
++++++++++++++++++
https://www.usgs.gov/water-science-school/science/groundwater-flow-and-water-cycle


Previous threads: The top one is loaded with great stuff:
The Water Crisis
Started by metmike - March 29, 2024, 10:21 a.m.
https://www.marketforum.com/forum/topic/102853/
SE US: rapid acceleration of sea level rise since 2010
Started by WxFollower - May 2, 2024, 3:56 p.m.
https://www.marketforum.com/forum/topic/103748/
Water Facts - Worldwide Water Supply
Started by metmike - Dec. 6, 2020, 1:14 a.m.
https://www.marketforum.com/forum/topic/62303/
Therealenvironmental crisis's
31 responses |
Started by metmike - April 10, 2019, 7:11 p.m.
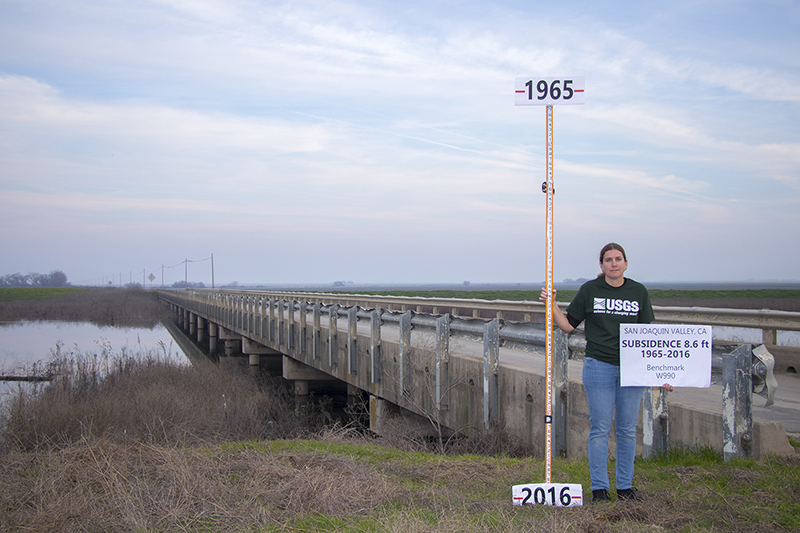
To throw in another random effect : Sinking cities
Around the world, megacities are sinking -
https://www.sciencefocus.com/planet-earth/cities-sinking
Especially Tehran, which has other problems besides sinking a foot a year -
https://www.renewablematter.eu/en/subsidence-tehran-is-sinking-the-hidden-cost-of-water
Subsidence and water scarcity are not the only environmental issues surrounding the capital. Tehran sits in a highly seismic zone. Its location, over 1,000 metres above sea level in a semi-arid region, combined with uncontrolled urban sprawl and heavy traffic, makes it one of the most polluted capitals in the world.
This combination of risks led the government last March to dust off a project that had been dreamt of since the Islamic Revolution of 1979: relocating the capital to the Makran region, on the coast, in what is seen as a strategic position. After Indonesia, Iran would become the second country to move its main city (also) due to subsidence.
Post of the week-patrick 5-10-26
Started by metmike - May 10, 2026, 11:15 a.m.
https://www.marketforum.com/forum/topic/120144/
++++++++++++++++
https://www.dri.edu/scientists-map-loss-of-groundwater-storage-around-the-world/
patricks post/article is awesome enough to be elevated to post of the week, however it links to this study:
Computer models show melting ice sheets in West Antarctica and Greenland could cause 100cm of sea level rise in the next 130 years.
https://www.sciencefocus.com/news/climate-change-sea-level-rises-net-zero-carbon
++++++++++++++==
metmike: This is another example of the anti scientific alarmism that I speak out against. Telling us about how bad things will be in the year 2156 because of increasing CO2 levels...........when we will be RUNNING OUT OF FOSSIL FUELS LONG BEFORE THAT and CO2 levels will start dropping fast later this century.
Re: Re: Re: Re: CO2 Finally Exonerated!!
By metmike - Feb. 13, 2026, 9:10 a.m.
https://www.marketforum.com/forum/topic/110244/#117897
+++++++++++++
This is not an attack on the good points about subsidence in the original article. However, it is correcting the junk science that authors link to because of their own ignorance on the topic. An ignorance that has been pounded into the brains of everybody with climate crisis religion/propaganda, repeated over and over and over.
Here's one of the high priests of fake climate crisis religion:
++++++++++++++
Fact: The current level of the beneficial gas, CO2 is 430 parts per million. The OPTIMAL level of beneficial CO2 for life on this planet is 900 ppm, so we are only approaching half of that and most life is BEGGING FOR MORE.
Death by GREENING!
54 responses |
Started by metmike - May 11, 2021, 2:31 p.m.
https://www.marketforum.com/forum/topic/69258/
++++++++++++++++
Fact 2:
$300 Million
https://www.celebritynetworth.com/richest-politicians/democrats/al-gore-net-worth/
/2009/10/Al-Gore-1.jpg)
Related discussion:
Latest global ice 1-3-25
Started by metmike - Jan. 3, 2026, 2:07 p.m.
