


Get all the comprehensive weather here:
https://www.marketforum.com/forum/topic/83844/
One reason this heat wave will feel especially impactful is that it's early in the Summer and following a very cool period so we're not acclimated to hot/humid weather yet!
Temperatures the previous 7 days below:
https://www.cpc.ncep.noaa.gov/products/tanal/temp_analyses.php

++++++++++++
Previous thread:
Historic Heat wave in Europe
Started by metmike - June 24, 2026, 8:07 a.m.
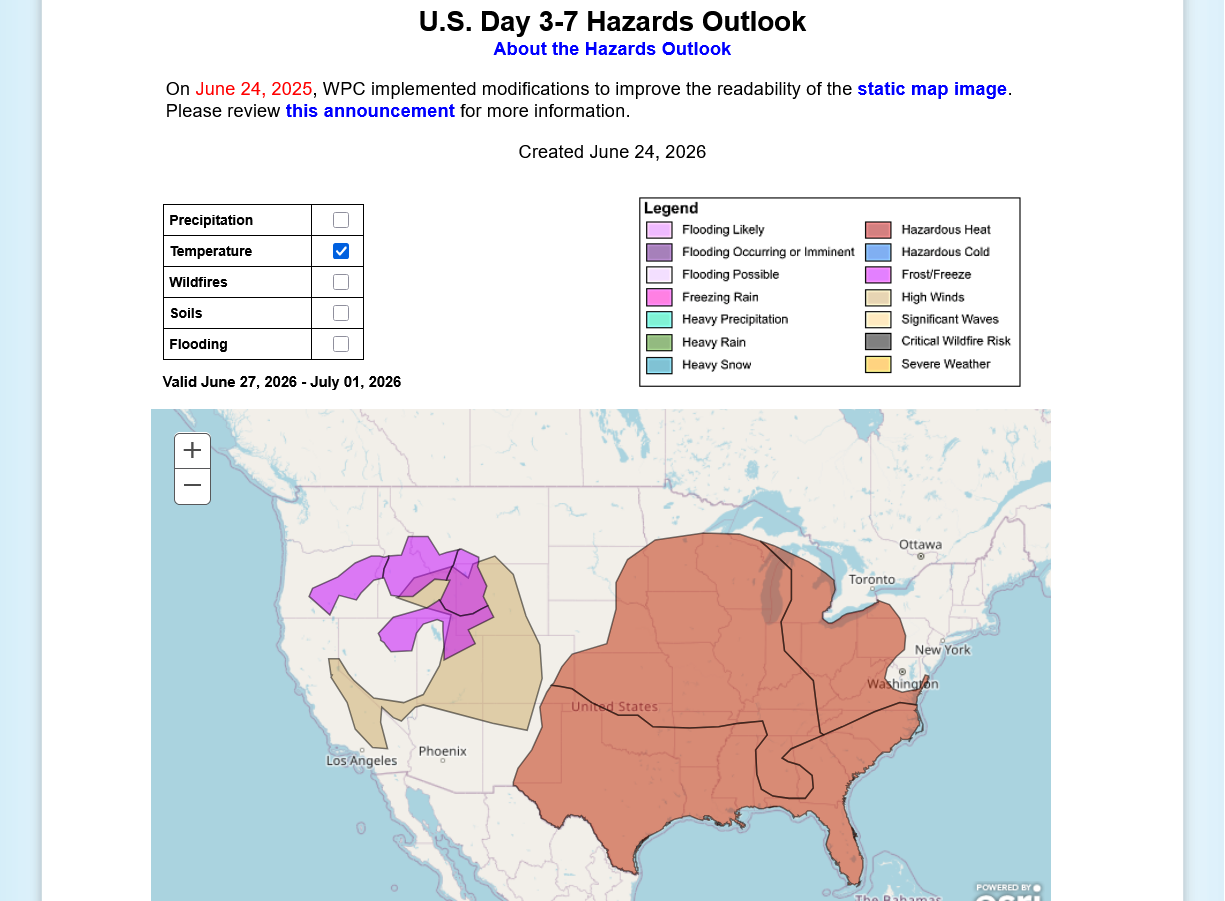
Top map is for June 27-July 1.
https://www.wpc.ncep.noaa.gov/threats/threats.php
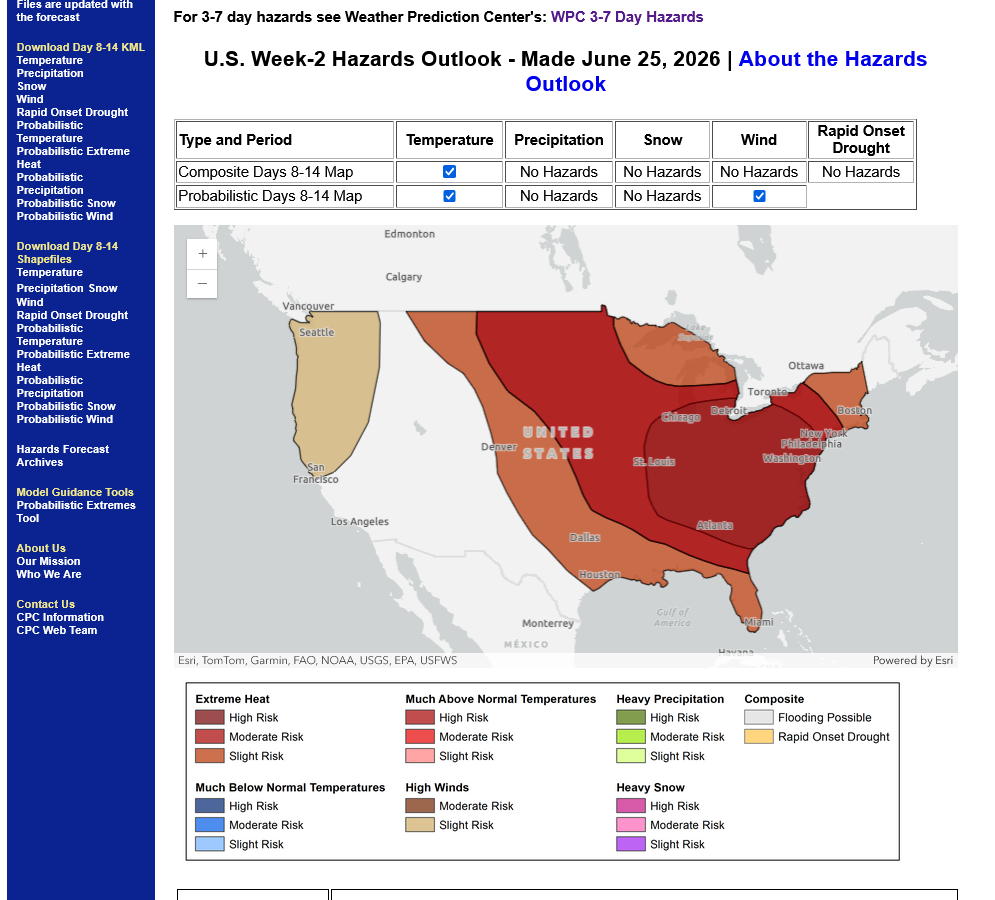
2nd map is July 2-8, 2026. Darkest red is a HIGH risk for Extreme Heat!
https://www.cpc.ncep.noaa.gov/products/predictions/threats/threats.php
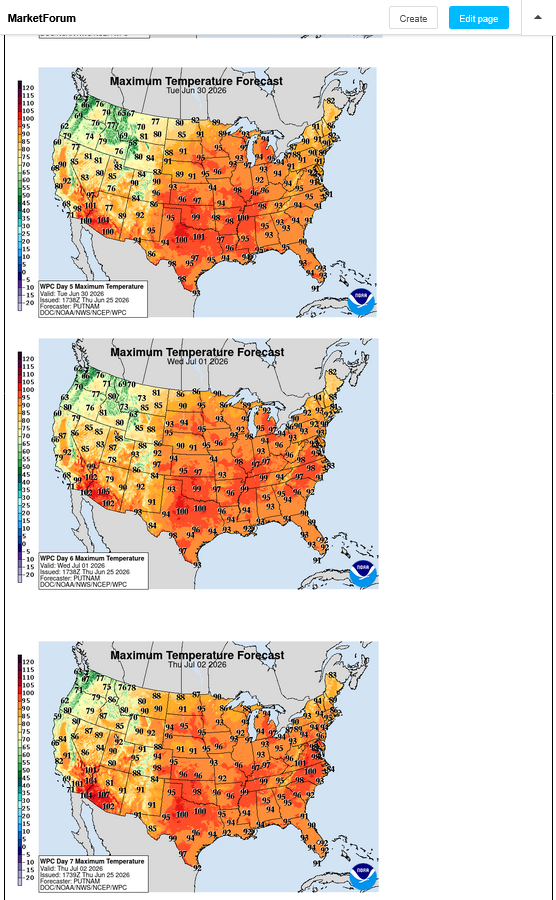
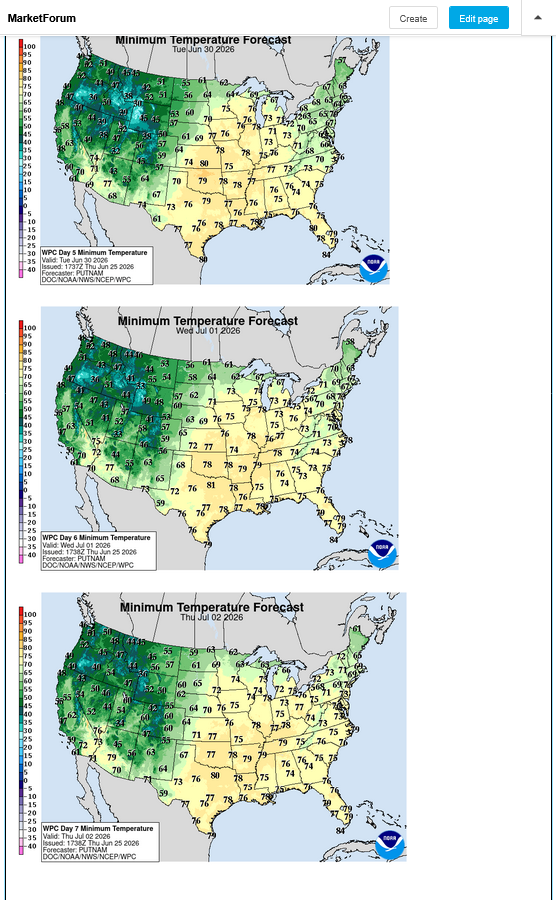
Highs and lows next week:
https://www.marketforum.com/forum/topic/83844/#83851
Forecast for the hottest days next week, Wed/Thu/Fri:
The red(darkest shade) is 96 deg. F or hotter!
Dial in the high dew points and the heat index will reach 110+ in many places.
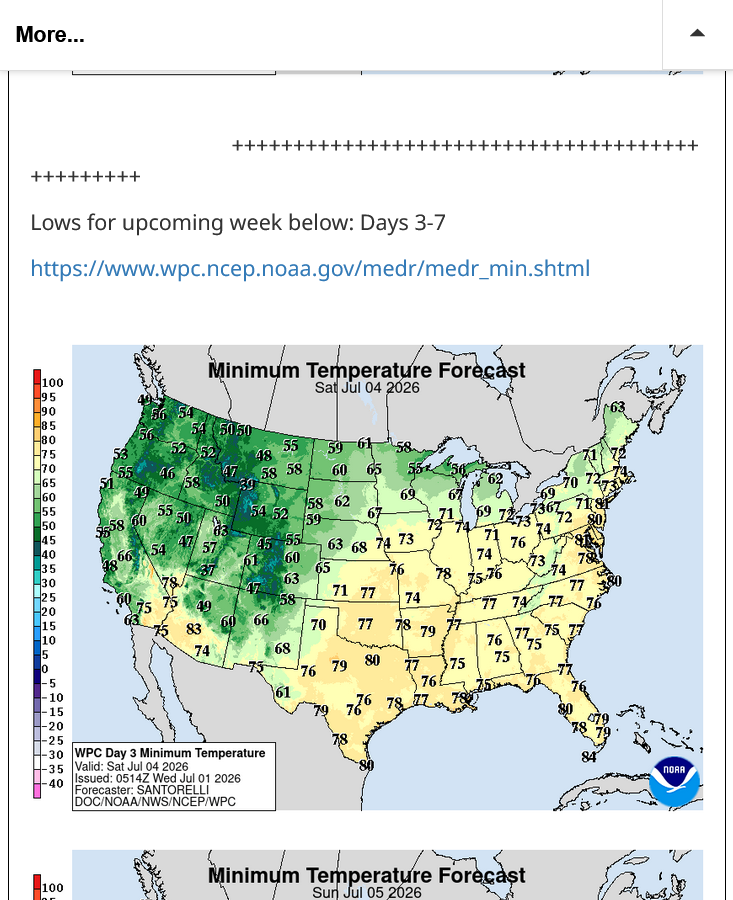
Lows at night will barely drop below 80 in many places in the steamy air mass!
https://www.noaa.gov/sites/default/files/2022-05/heatindex_chart_dp.pdf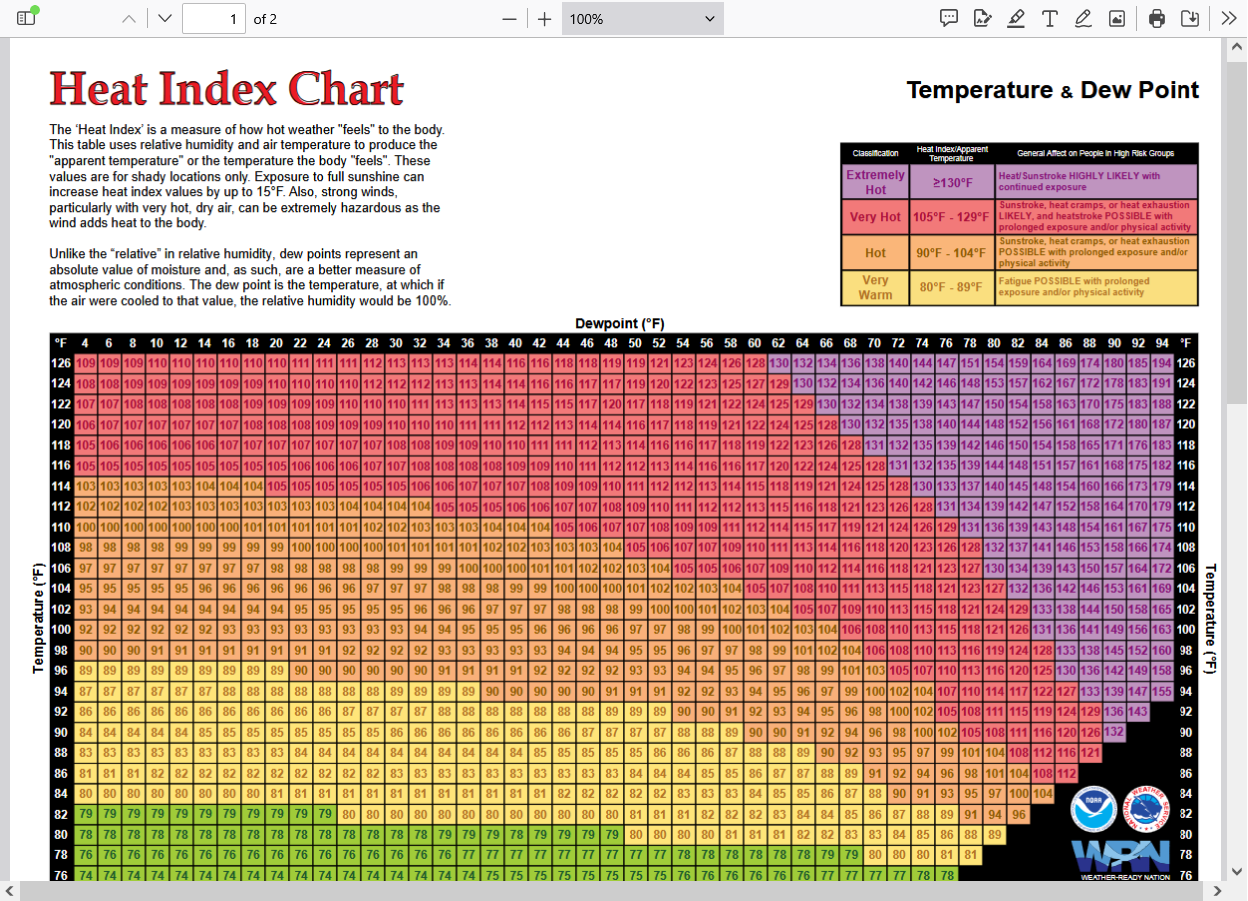
++++++++++++++++
A temperature of 96 deg. F, along with a dew point of 76 deg. F equates to a heat index of 110 deg. F. This is the temperature that it feels like and how the body responds.
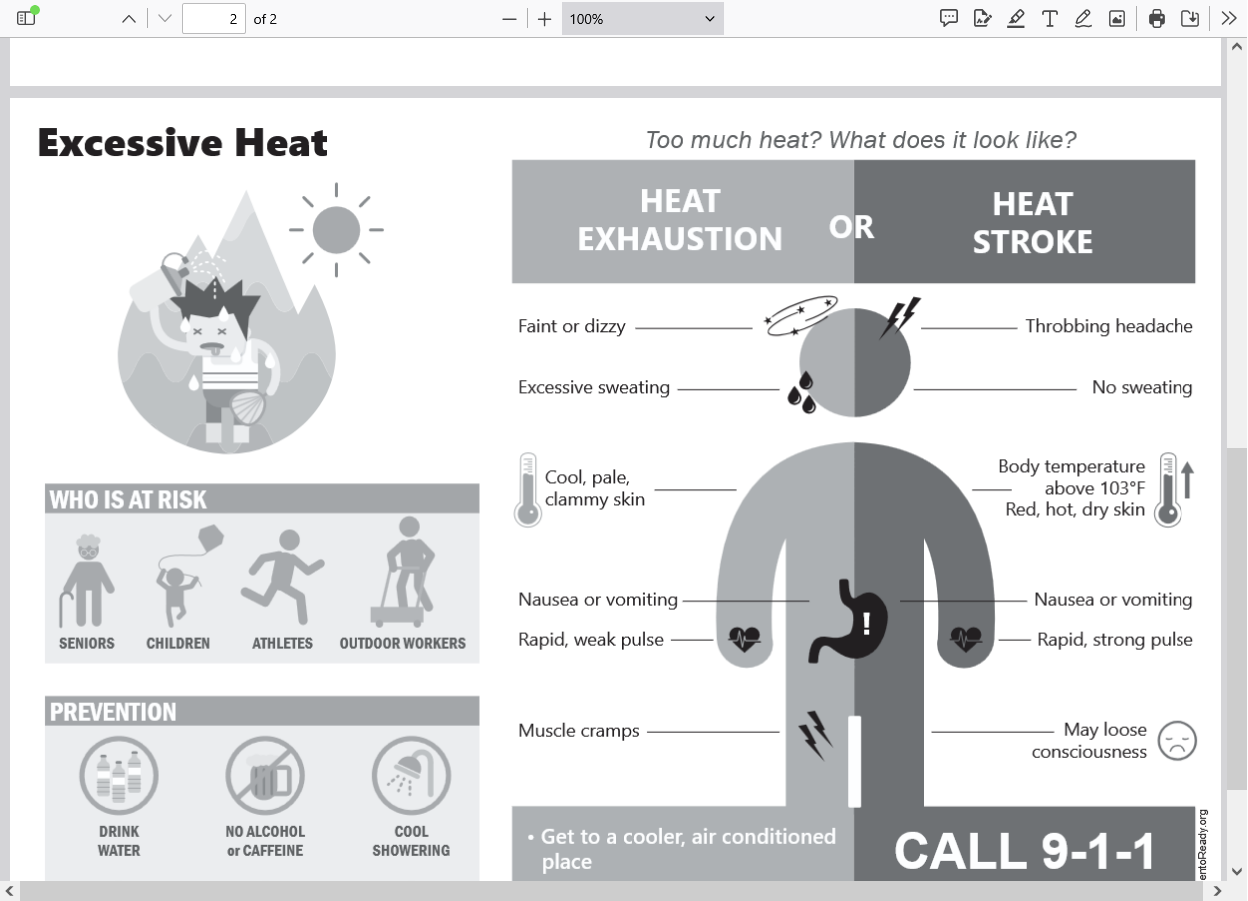
Learn how humidity affects how hot you feel, why humid air makes heat harder to tolerate, and which cooling methods work best in different climates.
+++++++++++++++
There is no single threshold — it depends on the combination of temperature and humidity, expressed as the heat index. The NWS issues heat advisories when the heat index reaches 105°F and excessive heat warnings at 110°F+.
++++++++++++++++
metmike: Next week, starting Monday in Evansville, IN for instance, look for the NWS to issue AT LEAST a heat advisory every day and on some days, especially late in the week an excessive heat warning!
Over 5.6 inches of rain now since Thursday evening!!!!
I intentionally didn't empty my rain gauges because I wanted to track the total, not each event but had to empty them because the last mark near the top is 5.5 inches!!!
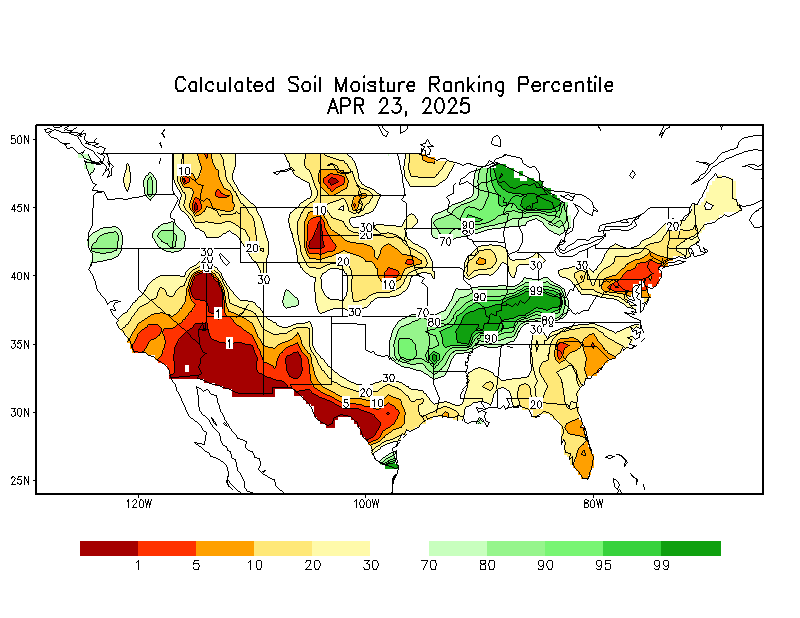
This area will appreciate the dry weather for the next week. With the soils now water logged, it will be near impossible for actual temperatures to get close to 100. A bit more humidity/higher dew points, with a heat index still approaching or hitting 110 deg. F but not as extreme heat.
Dry soils with the same atmospheric high pressure would assist the drier lower levels to heat up 5-10+ degrees hotter. This is part of where the expression, "drought begets drought comes from".
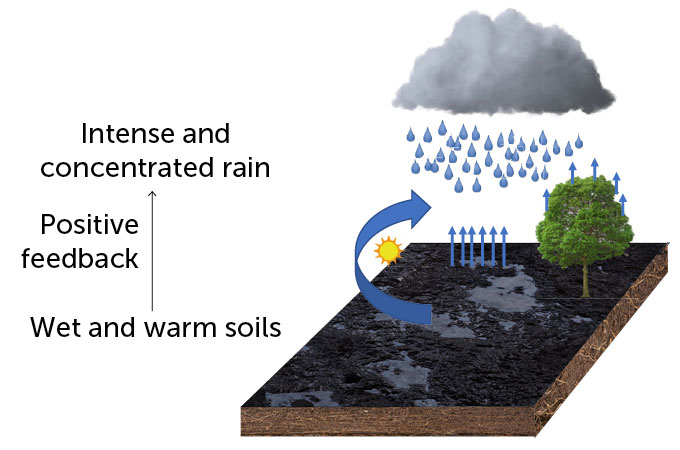
The other part is that weather systems dry up in the super dry air of a drought but this weather system is tracking over a "brown ocean" of saturated soils and standing water.
https://www.youtube.com/watch?v=0oLRJVqx3Xs
++++++++++++
Characterizing the Relationship between Temperature and Soil Moisture Extremes and Their Role
in the Exacerbation of Heat Waves over the Contiguous United
file:///C:/Users/Mike/Downloads/noaa_55437_DS1.pdf
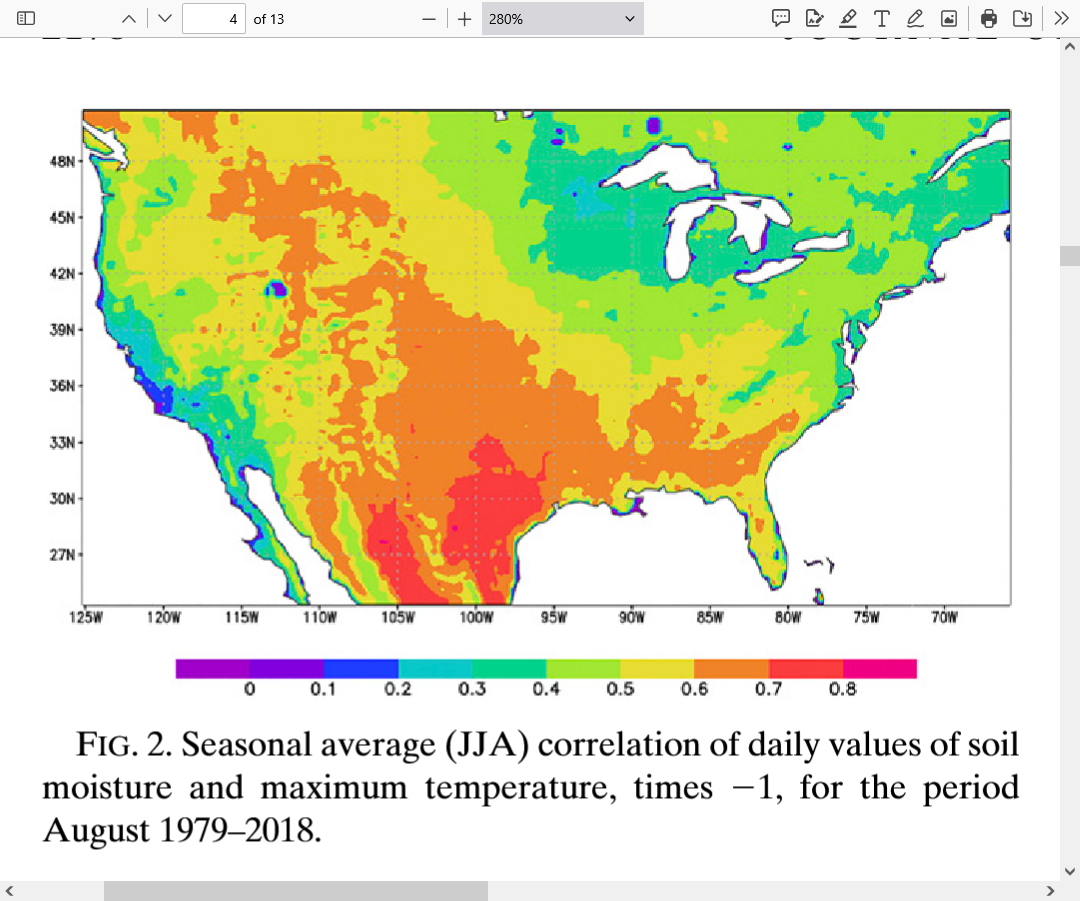
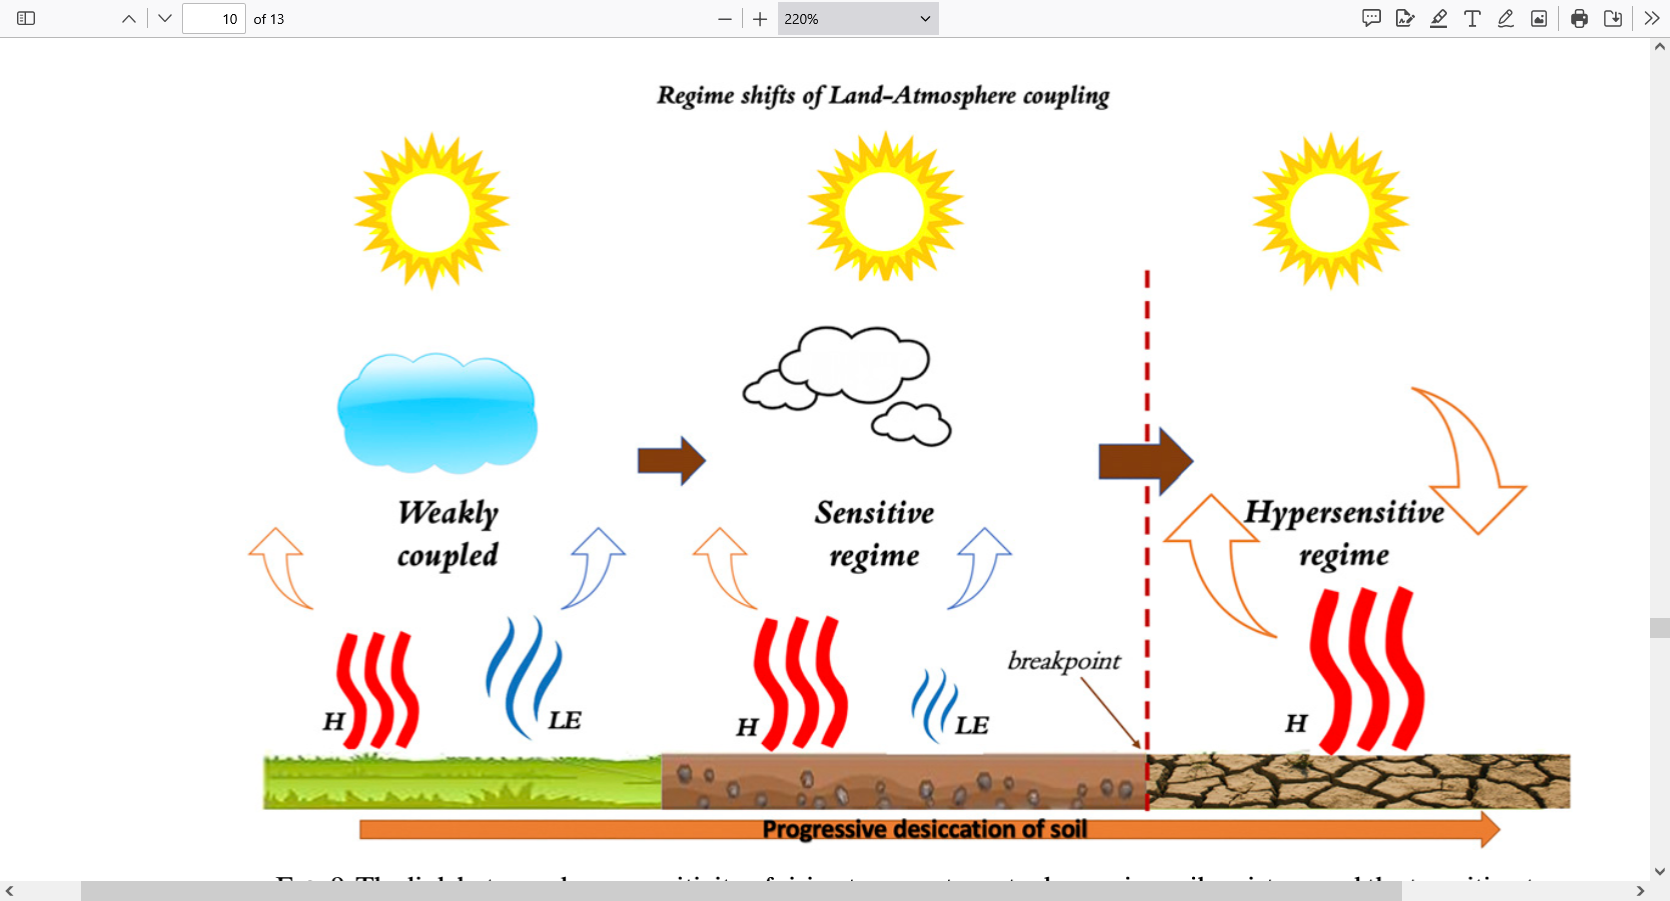
ABSTRACT: Increased heat-wave frequency across the United States has led to the need for improved predictability of heat-wave events. A detailed understanding of land–atmosphere interactions and the relationship between soil moisture and temperature extremes could provide useful information for prediction. This study identifies, for many locations, a threshold of soil moisture below which there is an increase in the sensitivity of atmospheric temperature to declining soil moisture. This shift to a hypersensitive regime causes the atmosphere to be more susceptible to atmospherically driven heat-
wave conditions. The soil moisture breakpoint where the regime shift occurs is estimated using segmented regression applied to observations and reanalysis data. It is shown that as the soil gets drier, there is a concomitant change in the rate of decrease in latent heat flux and increase in sensible heat flux leading to a strong positive feedback of increased air tem-perature near the surface, which further dries out the soil. Central, southwestern, and southeastern parts of the United States seem to have regions of clear regime shifts, while the eastern part of the United States generally does not get dry enough to reveal significant breakpoints. Sensible heat flux is seen to be a primary driver of this increased temperature sensitivity aided by the drop in latent heat flux. An investigation of flux tower sites verifies the breakpoint–flux relationships found in reanalysis data. Accurate estimation of these breakpoints can contribute to improved heat-wave prediction.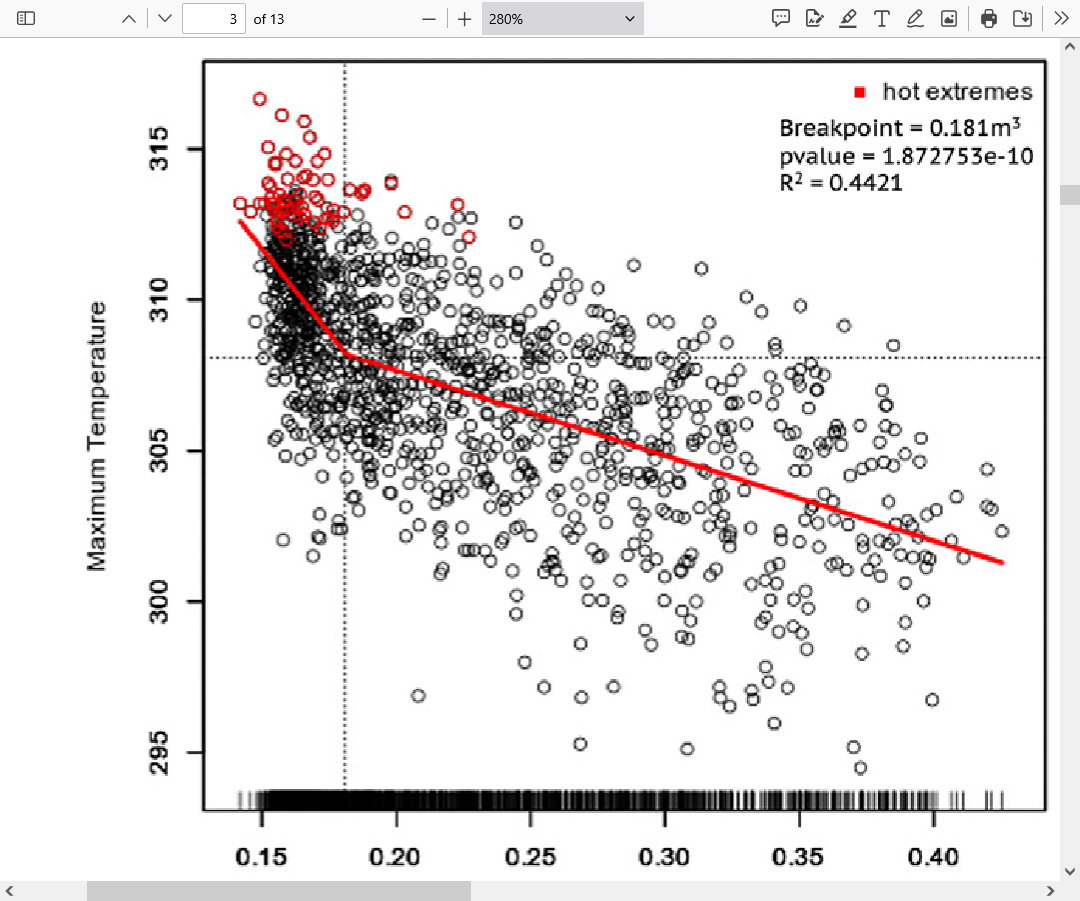
+++++++++++++++++++++
https://www.climate.gov/news-features/blogs/beyond-data/steam-baths-and-ovens-soil-moisture-summer
The punchline of this blog is pretty straightforward: for much of the interior United States, the precipitation you get in the late spring can make a difference in temperature outcomes for the summer.
Here’s some background: in the summer, because the sun is high in the sky and days are long, the Earth’s surface (that’s where we live) absorbs a heck of a lot of energy. The amount of moisture in the soil can control how much of that incoming energy goes into raising the surface temperature (“sensible heat”) and how much goes into evaporating water (“latent heat”).
As you might guess, and have probably experienced, drier soils mean more sensible heating and less latent heating, which means higher temperatures. This is the “dry oven” scenario - almost all of that incoming energy is devoted to making the temperature go up. With wet soils, temperatures stay lower as more energy is consumed by the process of evaporating water. This is the “steam bath” scenario—the temperature stays lower, but there’s more water vapor added to the air.
Understanding the effect could help forecasters determine whether a hurricane may strengthen after landfall
https://www.sciencenews.org/article/water-soil-hurricane-land-brown-ocean-effect
More on heatwaves here:
https://www.marketforum.com/forum/topic/121072/
Many recent posts with authentic science:
By metmike - June 27, 2026, 1:46 a.m.
We ended up with right at 8 inches of rain in less than 72 hours from this weather system. On might ask, how much rain would the same system dumped 100 years ago with the "old" climate.
For every +1 Deg C of warming, the atmosphere can hold around 7% more moisture. With saturated air masses like this one, we might speculate that means 7% more rain in 2026 or +.56 more compared to 7.44 in 1926.
All things are definitely NOT equal and this is a great discussion that explains why.
https://www.carbonbrief.org/guest-post-investigating-climate-changes-humidity-paradox/
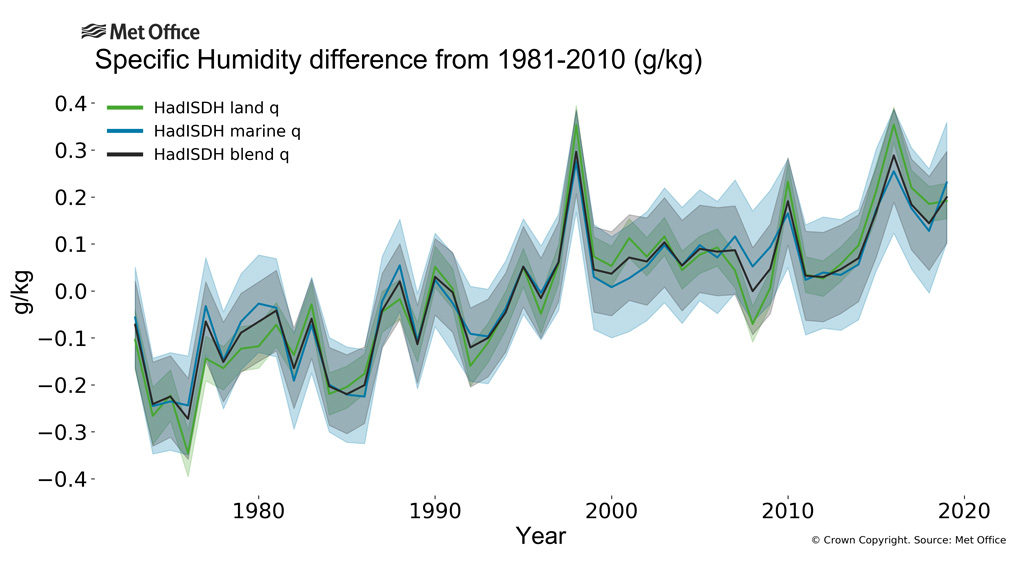
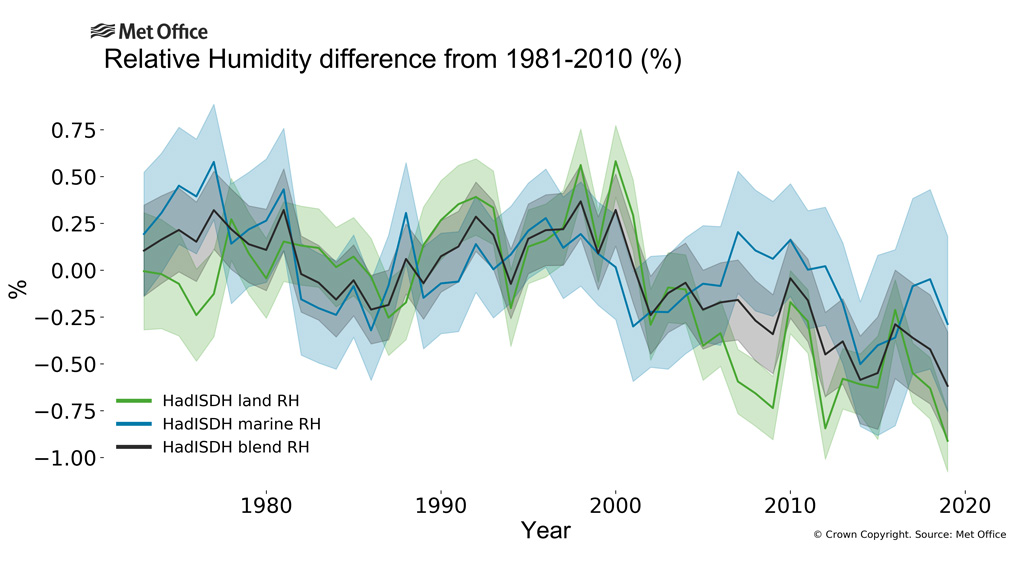
So the point above is that the total moisture is increasing in most places but to get moisture to come out as rain, you often need to SATURATE the air mass. At 1 deg. C warmer the air can hold 7% MORE moisture but if it only has 4% more moisture in it, then it's 3% LESS saturated. This can actually reduce marginal rain events but increase rain amounts of SATURATED air masses. If there's something we know with certainty, a warmer atmosphere, all things being equal will INCREASE the total rain in many of the saturated air rain events, which are the extreme/heaviest ones.
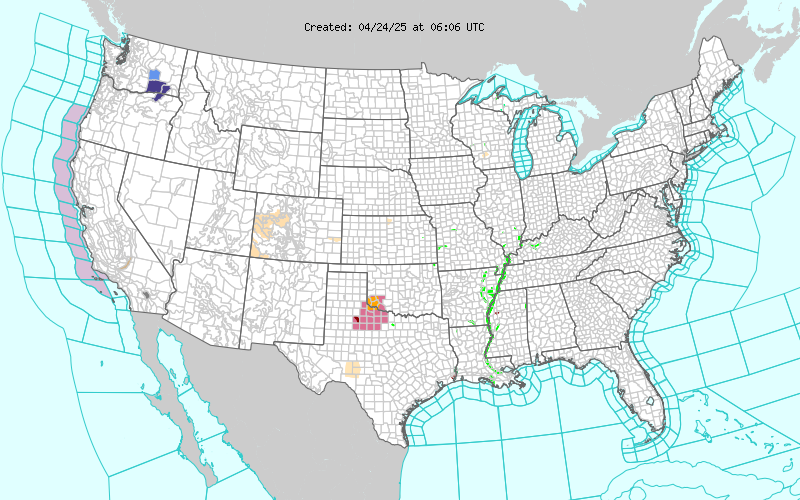
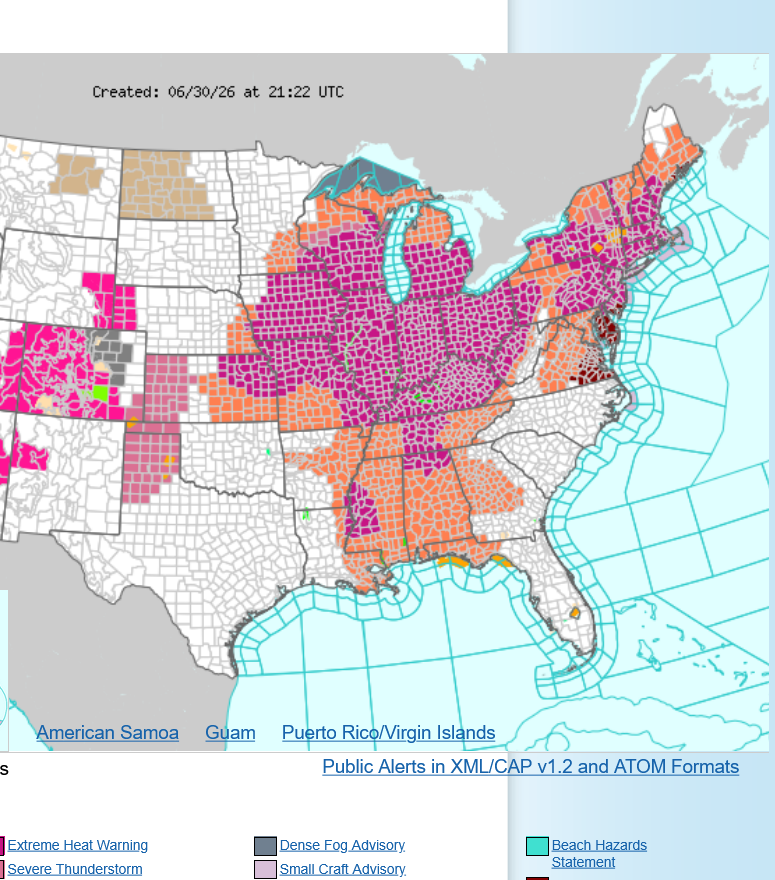
Current Hazards at the link below. Oranges are the counties with a Heat Advisory. Purple's an Extreme Heat Warning.
For your NWS and county, go to the link below.
Then you can hit any spot on the map, including where you live and it will go to that NWS with all the comprehensive local weather information for that/your county.
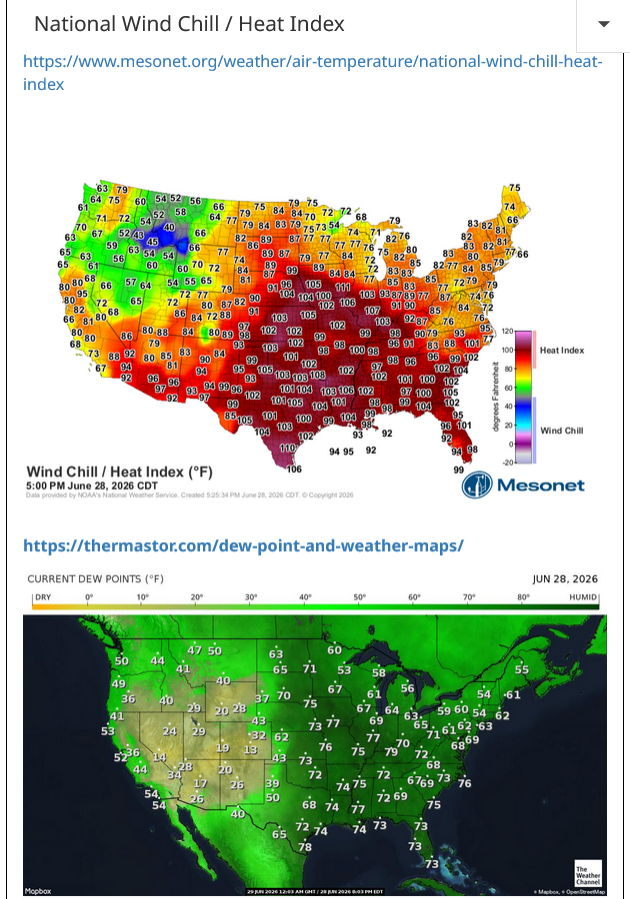
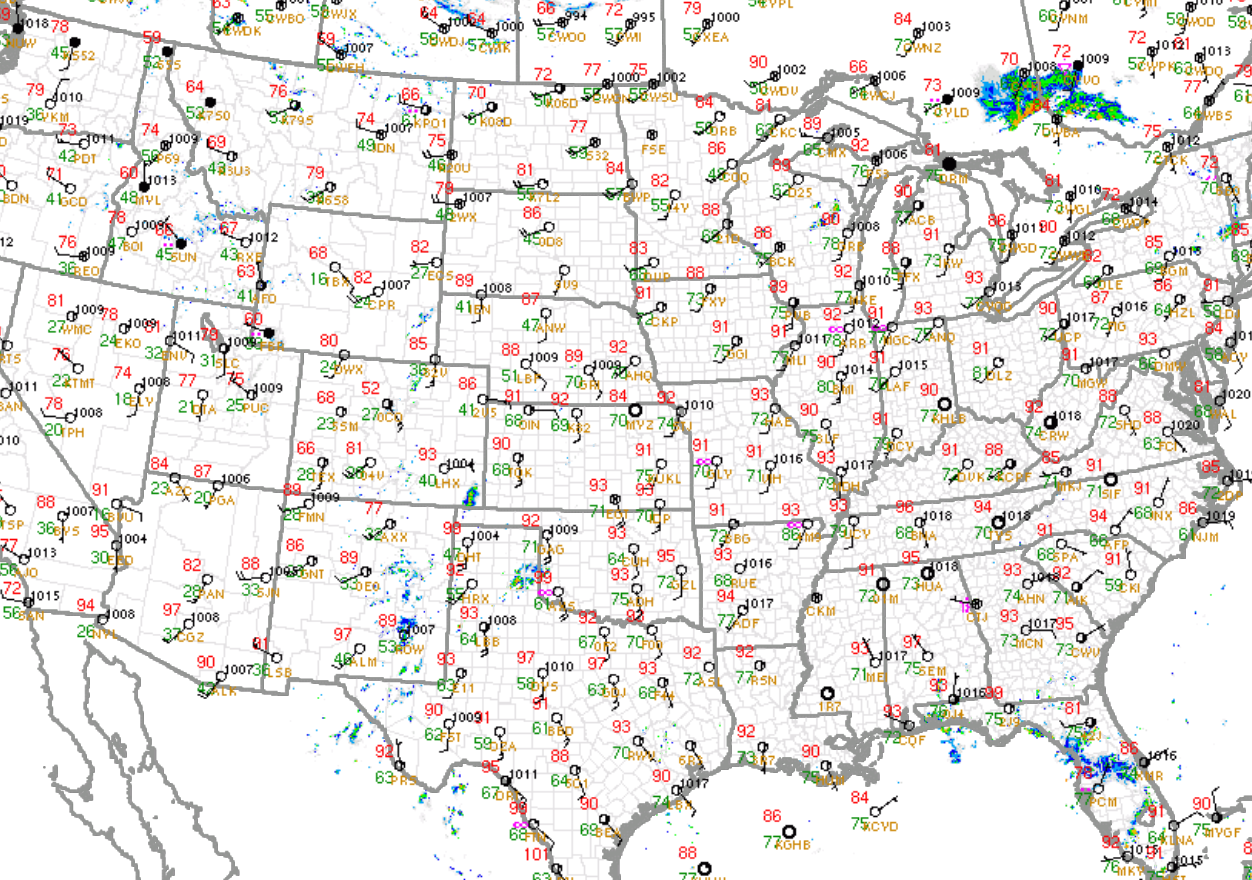
This was 5pm. Look at those dew points! Up close to 80 deg. F in a few spots!! These are not temperatures but the heat index which is what it feels like with the temperature and humidity combined:
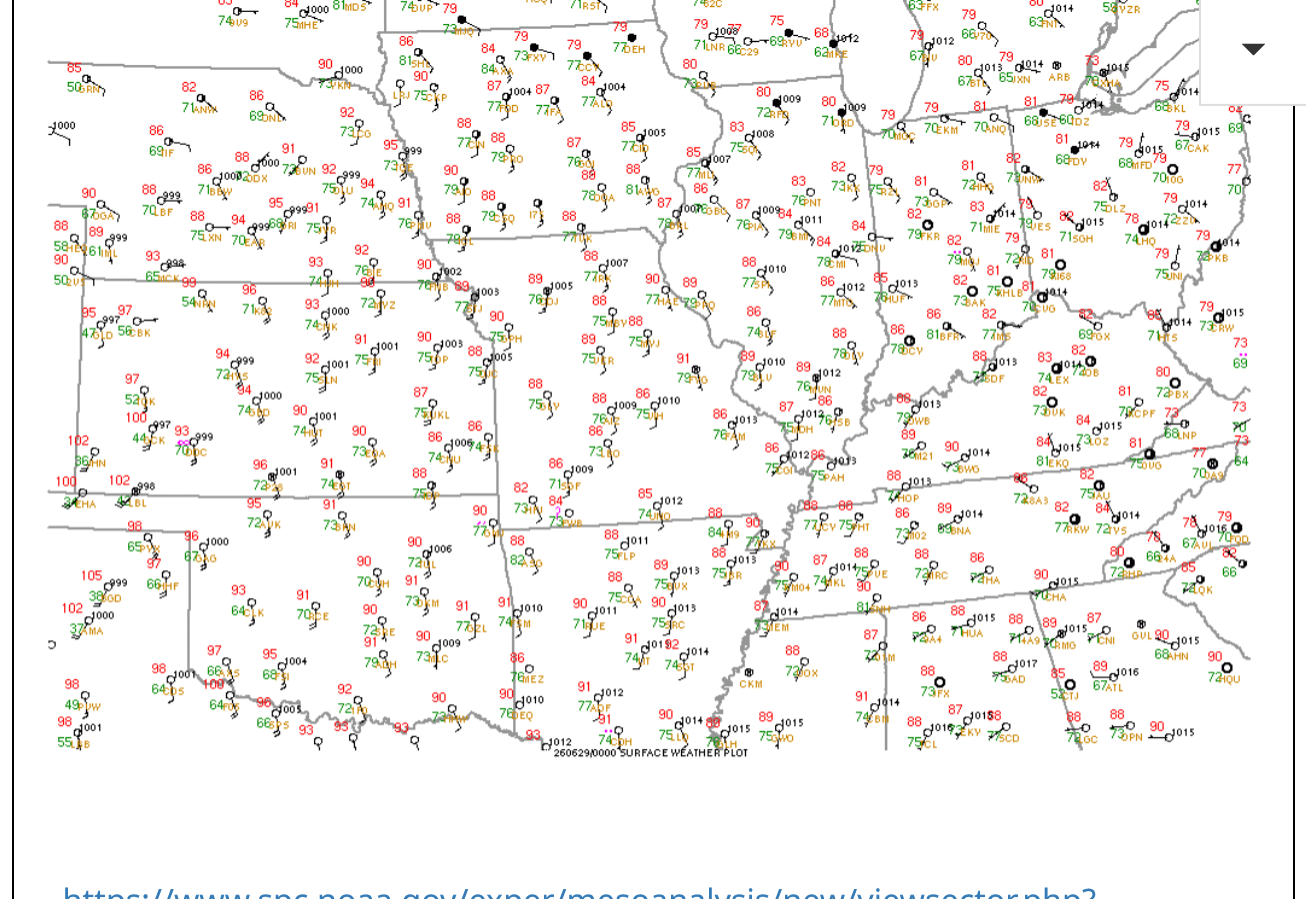
This was the last surface map below with the green numbers being the dew points.
I found 4 places with dew points of 81 deg. F or higher.
1. Southwest IN-81
2. Southcentral KY-81
3. Northwest AR-82
4. Northwest IA-81
In the early 80's when I was analyzing weather maps every day, I can't remember finding many 80+ dew points outside of the Gulf Coast.
Large corn fields with tightly packed rows of corn that are evaportranspiring tons of moisture can add 5+ deg. F to the dew point to that spot.
It especially makes sense close to the Gulf of Mexico!
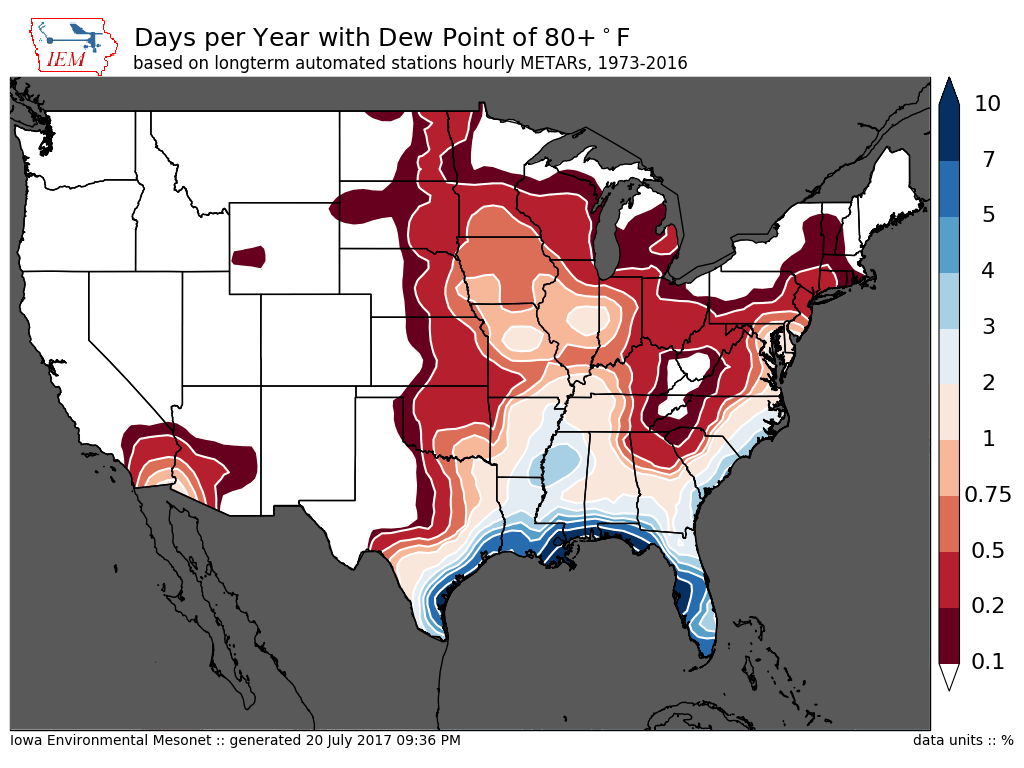
This has created a micro climate for around 4 months of the year in this area.
The same impact is happening in other agricultural areas. Also, most places with natural vegetation that’s been greatly greening up with the greater foliage transpiring more, just not the same magnitude as the Cornbelt.
Summer Climate Change in the Midwest and Great Plains due to Agricultural Development during the Twentieth Century
https://journals.ametsoc.org/view/journals/clim/32/17/jcli-d-19-0096.1.xml
Americans Have Planted So Much Corn That It’s Changing the Weather
https://www.atlasobscura.com/articles/corn-belt-weather
The Corn Belt is making it rain.++++++++++
WEATHER LAB | What is corn sweat?
https://www.weareiowa.com/article/weather/weather-lab/science-of-weather-corn-sweat-evapotranspiration-water-vapor/524-de12a91b-35cd-4b48-9b21-c0ec6e11f794
An acre of corn can add up to 4,000 gallons of water vapor to the atmosphere per day!
‘Corn sweat’ in the Midwest can cause some of the most oppressive humidity in the US
Can you imagine stepping outside to a 90-degree dew point?
https://www.foxweather.com/learn/corn-sweat-midwest-most-oppressive-humidity-united-states
Climate Change Impacts in the Corn Belt
Why is the humidity so high? The answer is pretty corny.
https://addins.wrex.com/blogs/weather/2011/07/why-is-the-humidity-so-high-the-answer-is-pretty-corny
The United States’s Corn Belt is making its own weather Plentiful crops are changing rainfall and temperature trends
https://www.science.org/content/article/america-s-corn-belt-making-its-own-weather
++++++++++
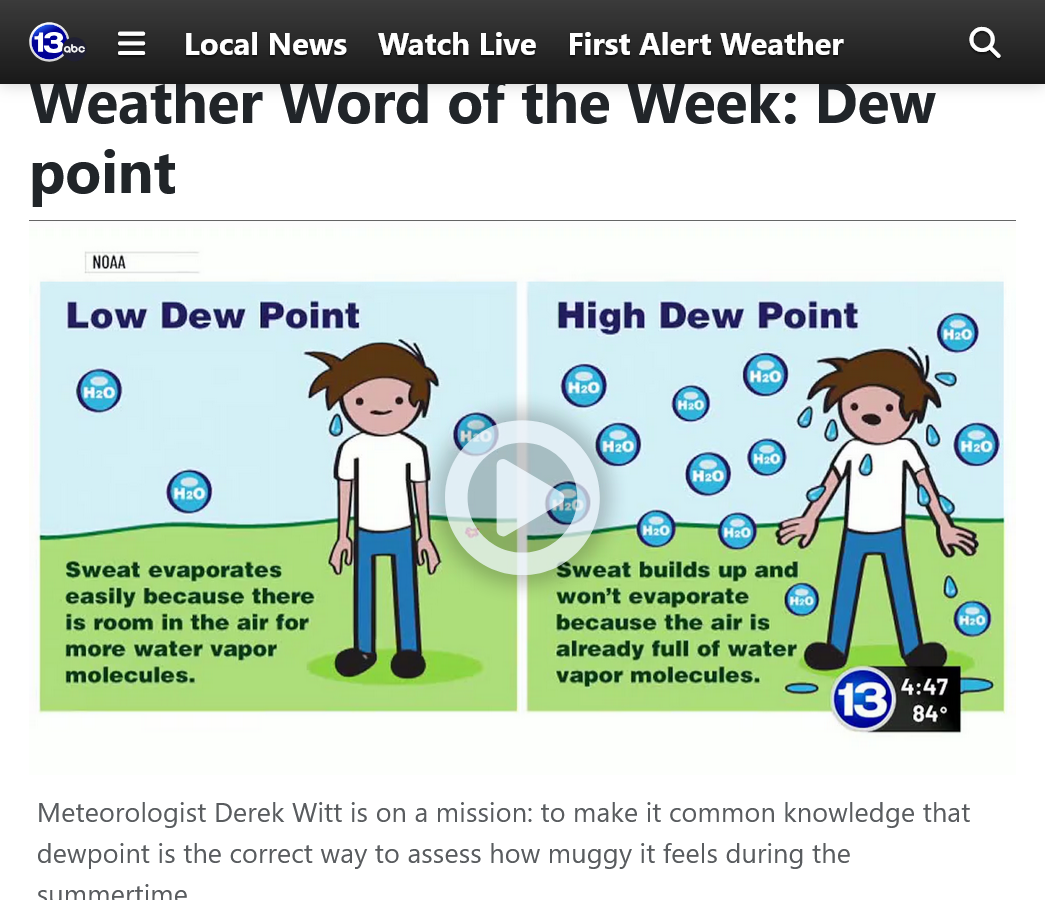
https://www.13abc.com/2025/07/16/weather-word-week-dew-point/
The dew point covered up by the logo on the right/bottom should be 74 Deg. F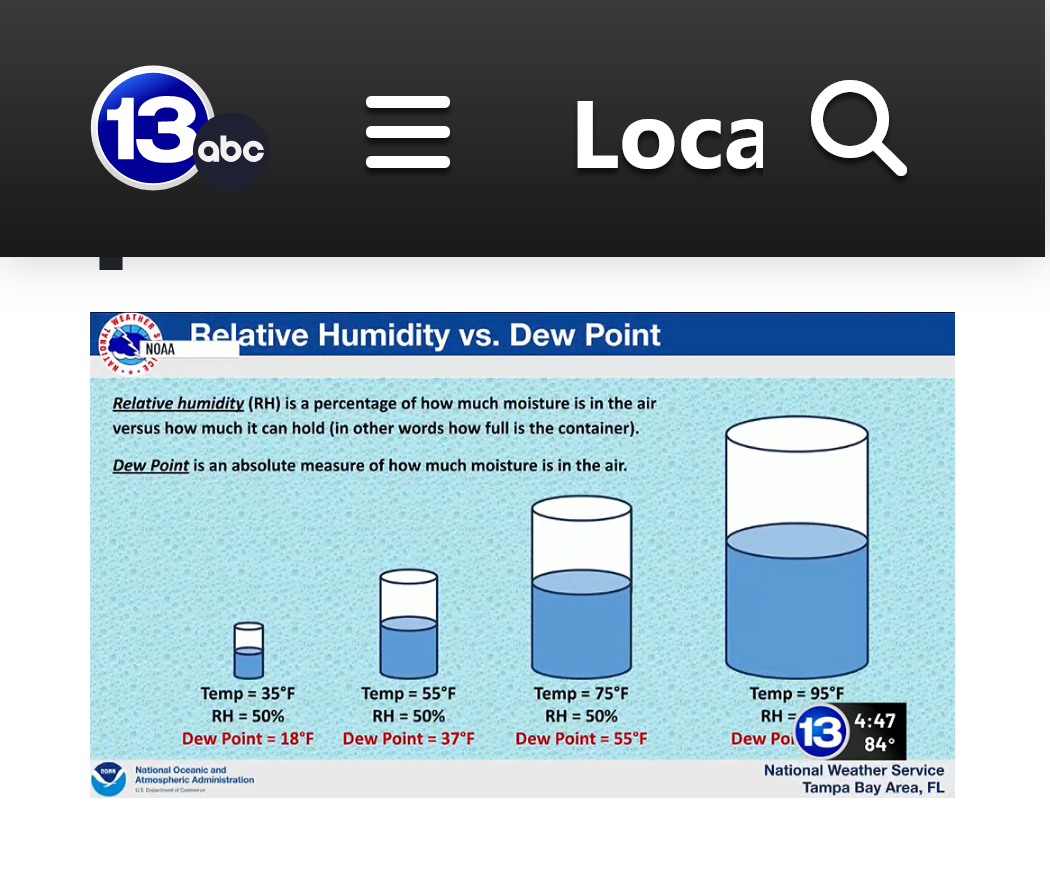
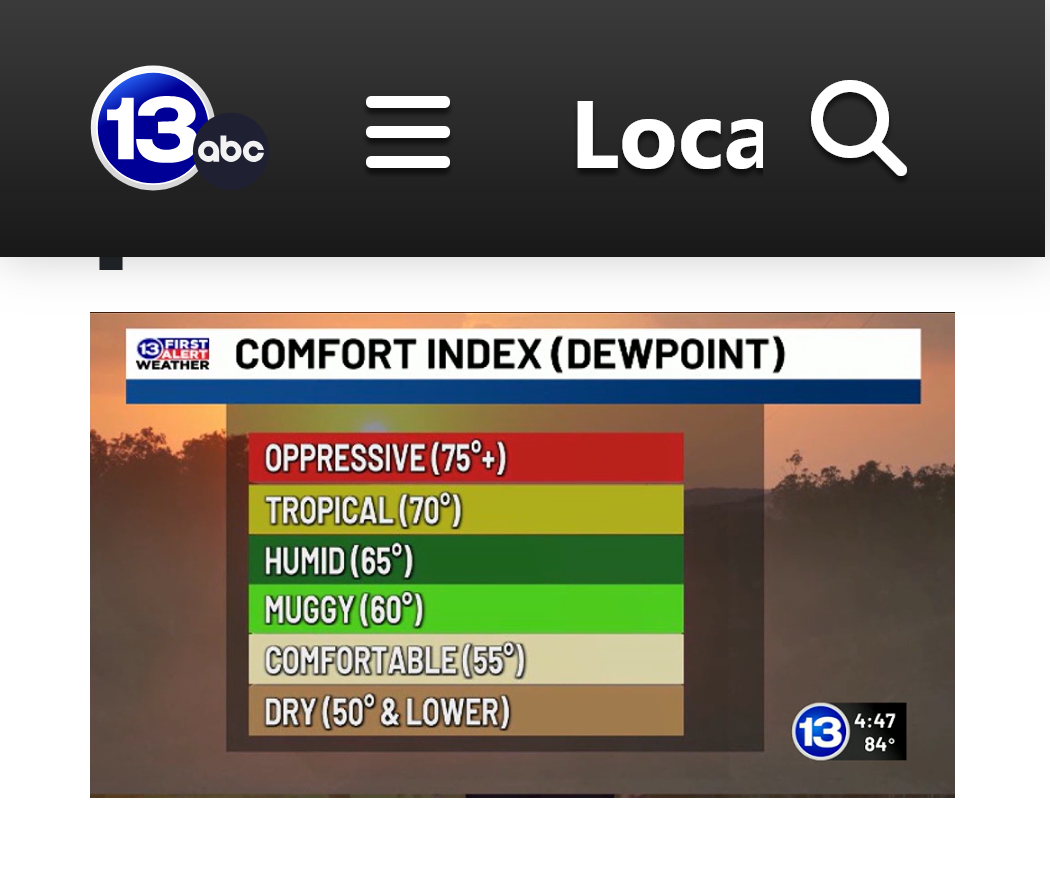
The heat wave(mainly from the high dew points) continues.
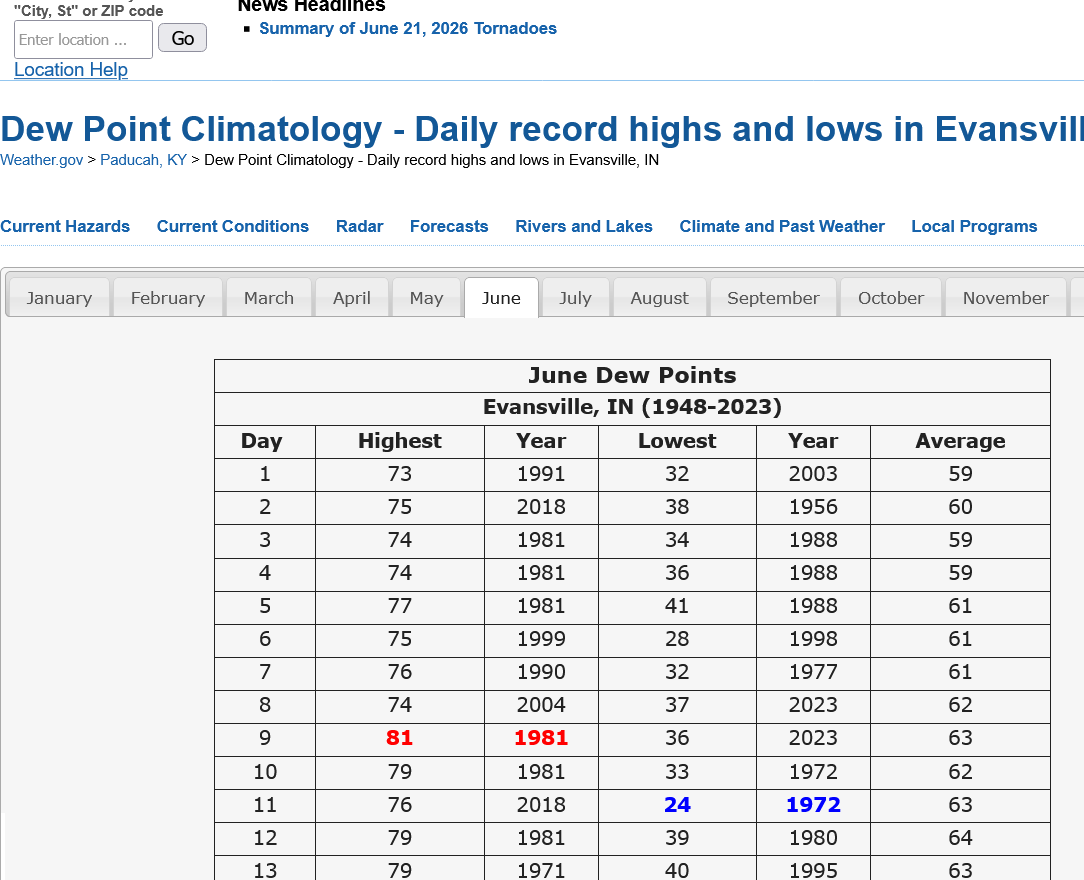
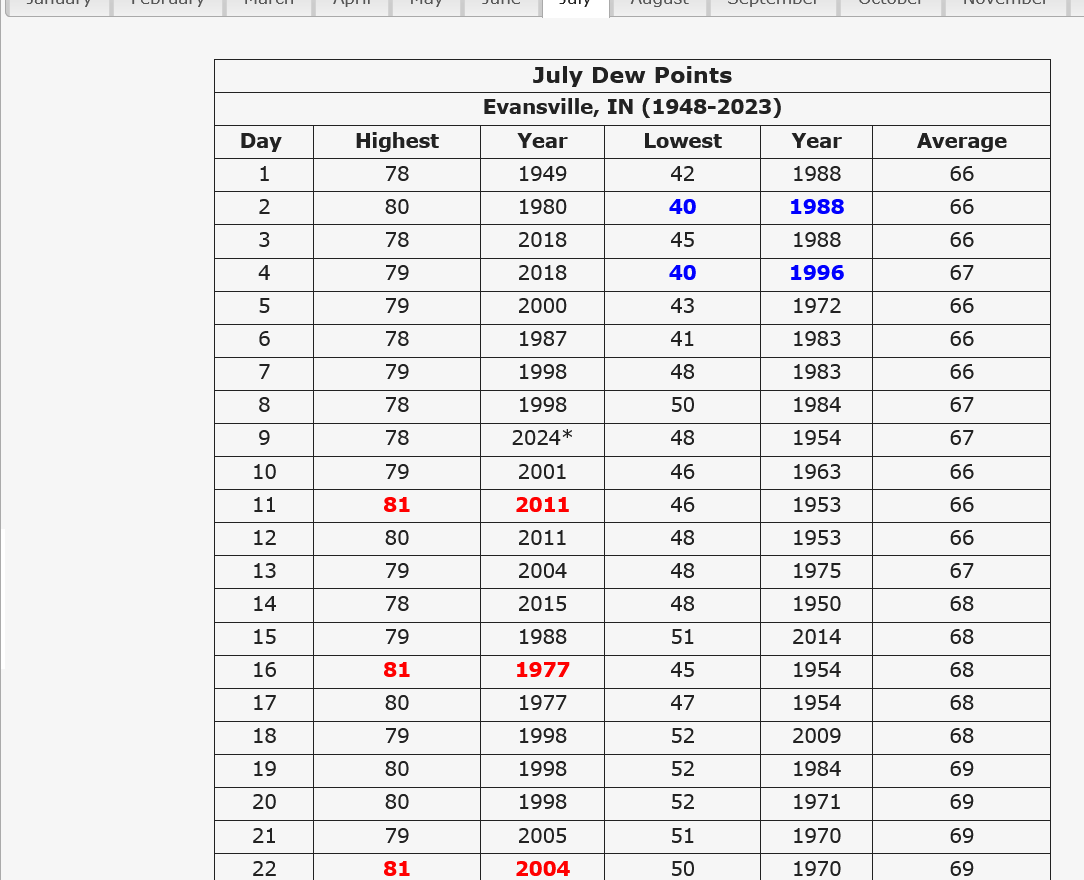
The highest dew point in Evansville, IN history was 81 degrees, hit 4 different times before.
The dew point on Sunday had a high of 77 degrees.
https://www.weather.gov/pah/EvansvilleDewpointRecords
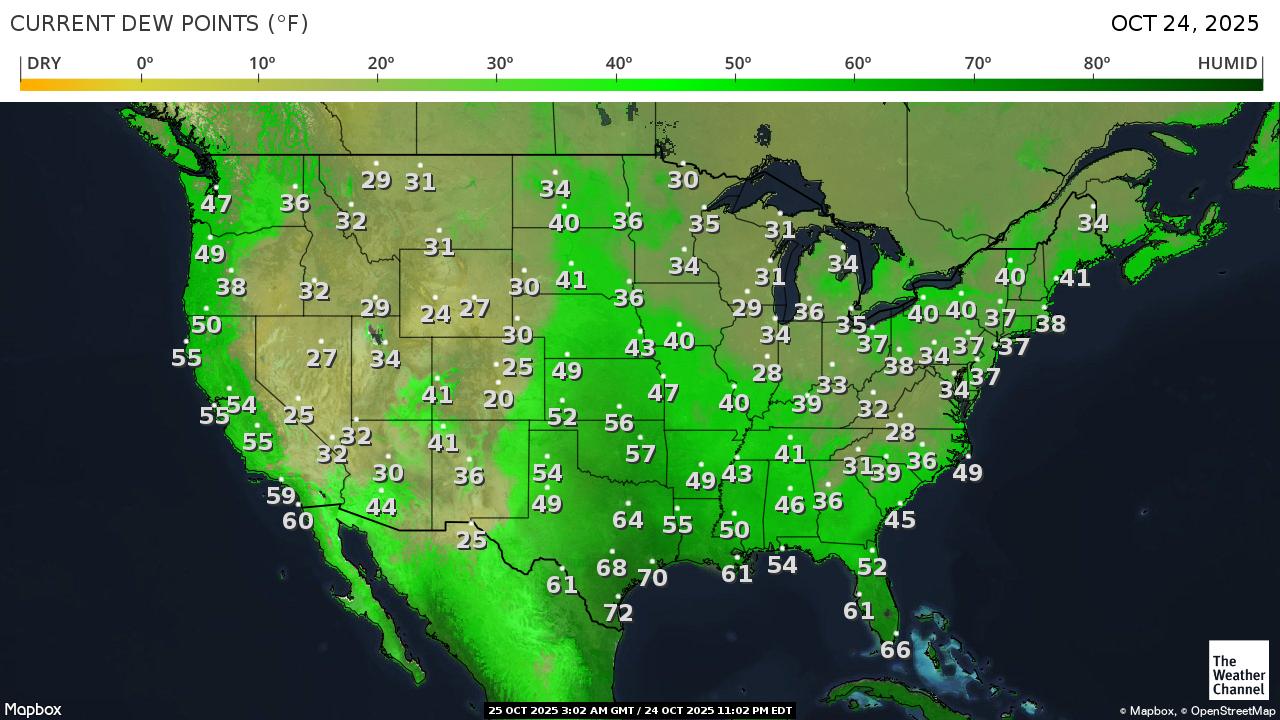
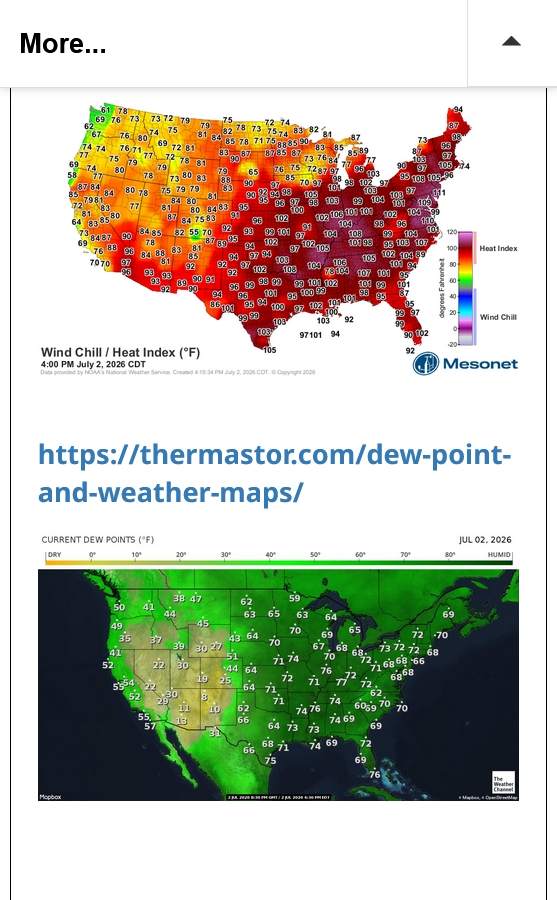
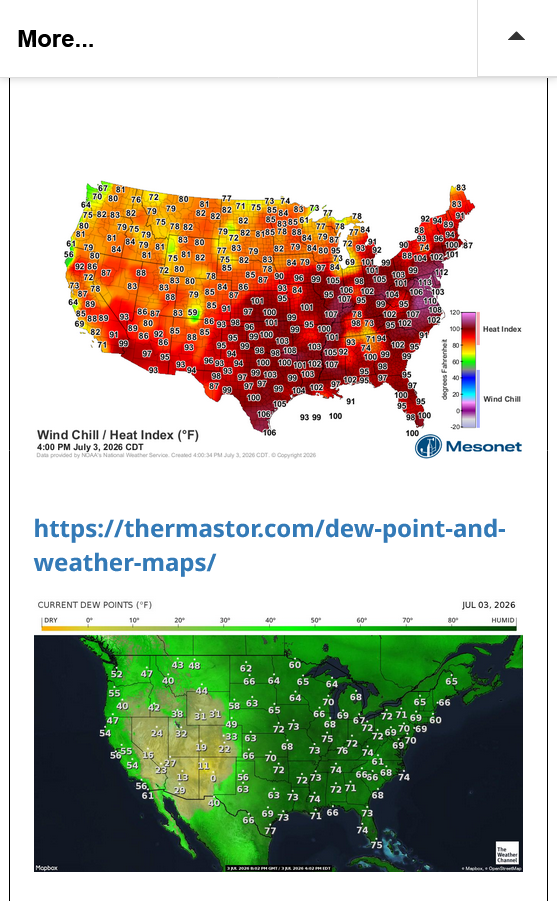
I'll just put the live, constantly updated heat index and dew point maps here, instead of snaps shots:
https://www.mesonet.org/weather/air-temperature/national-wind-chill-heat-index
INCREDIBLY HIGH DEW POINTS!!!
https://thermastor.com/dew-point-and-weather-maps/
Closing the windows & heading out to battle the bittersweet & knotweed before 3 days of inferno.
We love our minisplits.
Thanks, Patrick!
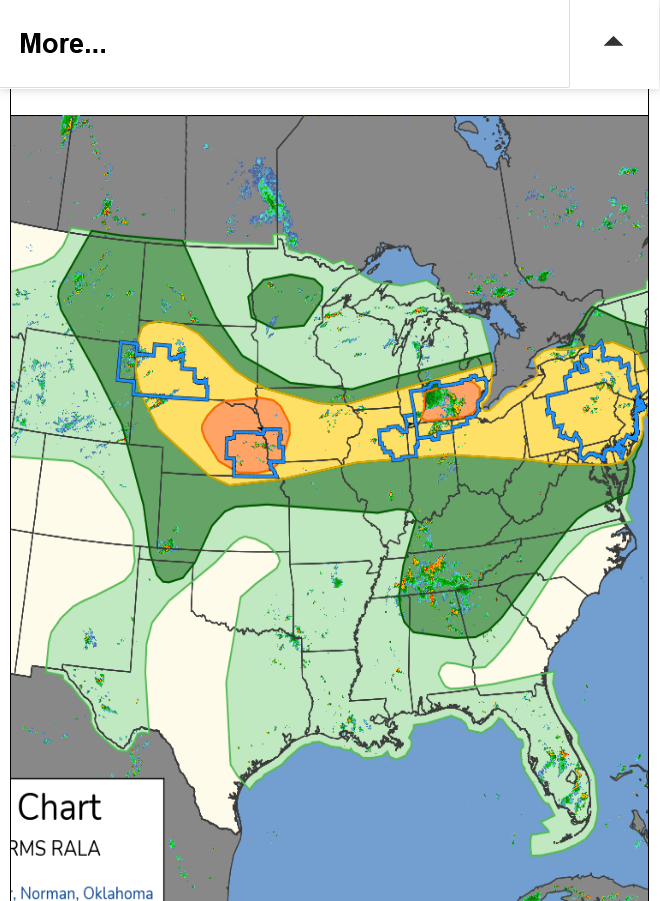
These are the current excessive heat warnings for a heat index of 110+
At the peak today, 4pm below we can see that almost none of those locations have reached a heat index of 110 degrees.
It's hot and especially humid but for the area below, temperatures in the low 90s are typical Summer heat.
INCREDIBLY HIGH DEW POINTS!!!
%20wave%20coming%20next%20week%20-%20MarketForum.png)
The high temperature today in Evansville, IN was 92 degrees. This is 4 degrees above the average of 88 degrees for June 30, 2026. Our highest heat index so far this week has been 107 deg. F.
The RECORD high for today was 106, set in 2012.
https://www.weather.gov/pah/EvansvilleDailyNormalsAndRecords
++++++++++
Clearly, the magnitude of the predicted heat is a BUST in the forecast so far, partly from the wet soils (and lush vegetation/foliage that reduces heat, thanks in part to the 28% additional growth because of the beneficial CO2).
++++++++=
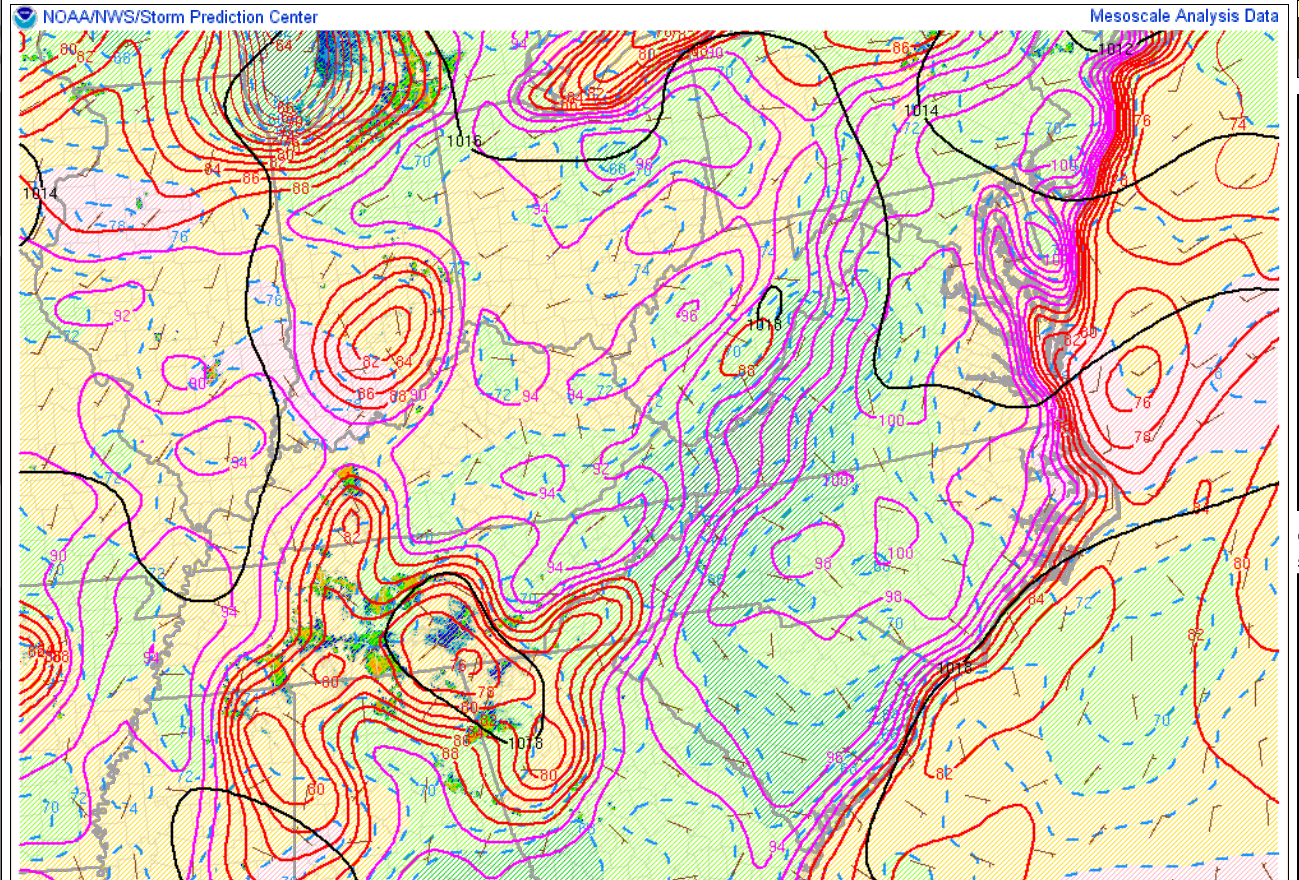
Here's the latest temperature analysis. Other than couple of small pockets in TX and the Southeast, everybody has temperatures LESS THAN 95 degrees right now at peak heat.
https://www.spc.noaa.gov/exper/mesoanalysis/new/viewsector.php?sector=19&parm=pmsl#
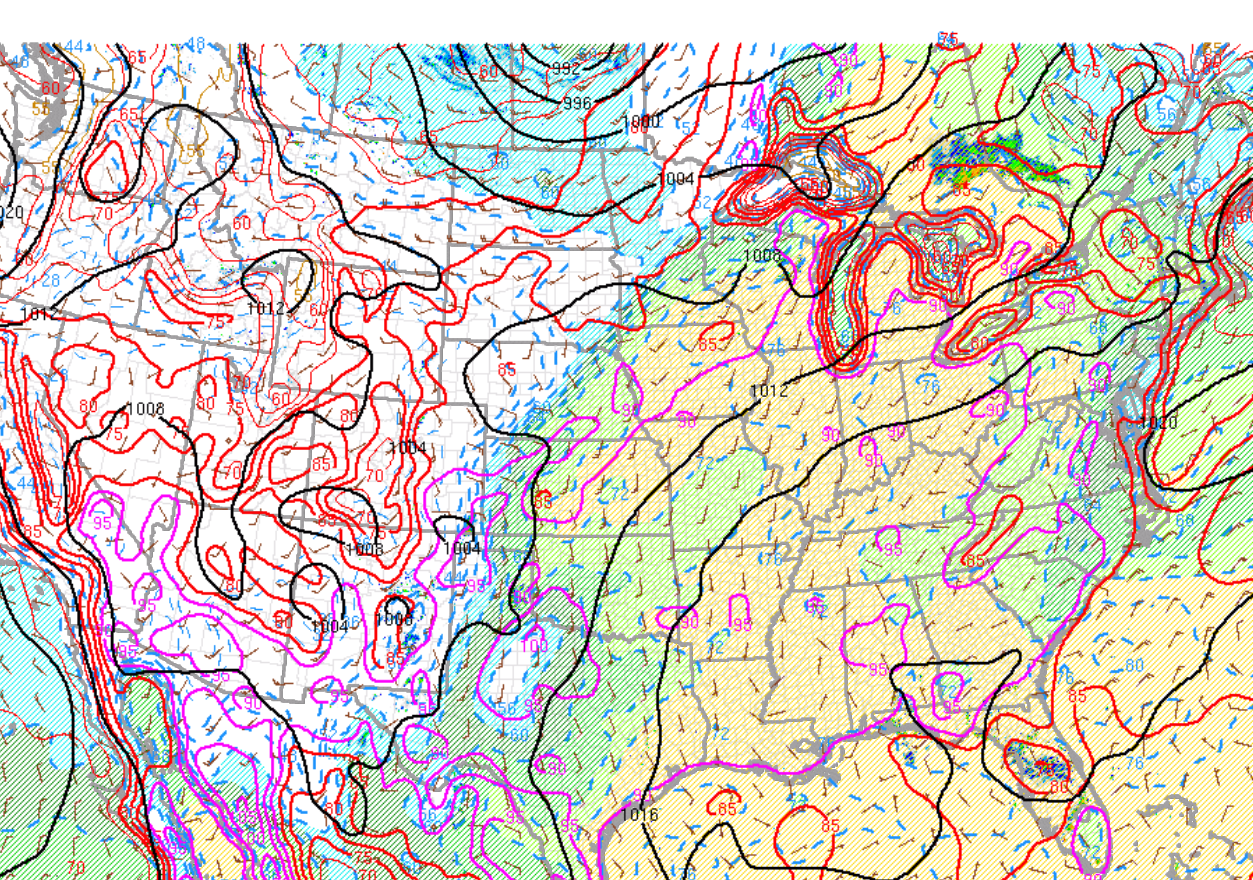
5 days ago, this was the forecast for today. The huge area of 95+ predicted in bright orange was mostly a bust. This is also the reason for the 110+ heat index forecasts to bust from being too high.
Yes, this IS hot and especially humid but the magnitude of the heat was OVER predicted so far. We have temperatures like this almost every Summer.
%20wave%20coming%20next%20week%20-%20MarketForum.png)
++++++++++++++++++++++++++
Previous related post:
Re: Fake beer crisis/Death by Greening!
By metmike - May 11, 2021, 2:43 p.m.
https://earthobservatory.nasa.gov/images/146296/global-green-up-slows-warming
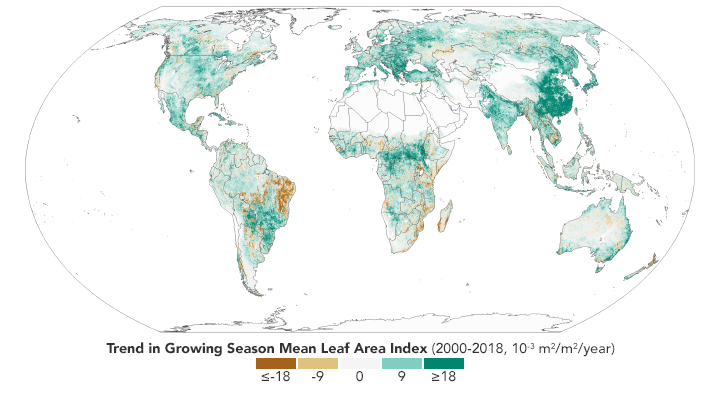
"The paper’s authors reviewed more than 250 published articles that have used satellite data, modeling, and field observations, to understand the causes and consequences of global greening. Among the key results, the authors noted that on a global scale greening can be attributed to the increase of carbon dioxide in the atmosphere. Rising levels of carbon dioxide increase the rate of photosynthesis and growth in plants."
metmike: Why isn't this paper, based on 250........let me repeat that number 250 published articles using the best technology known to science............getting much news coverage?
Because they don't want you to know this.
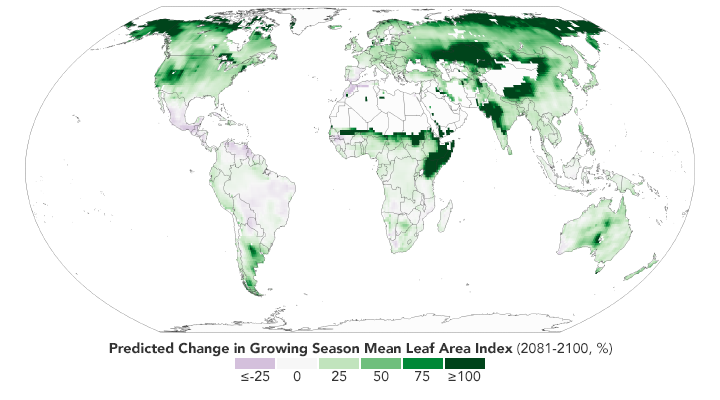
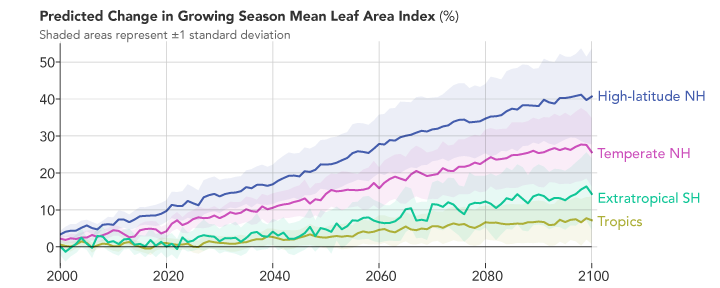
From the projections: According to climate models, the future looks even greener. The second map shows what the green-up might look like in the future based on the Coupled Model Intercomparison Project (CMIP5) climate model, under a scenario in which increases in greenhouse gases lead to almost 5° Celsius (9° Fahrenheit) of warming by the end of the 21st century. Specifically, it shows the predicted change in the growing season’s “leaf area index” from 2081-2100 relative to 1981-2000. The chart below the map shows the predicted changes by latitude. Notice that high latitudes in the Northern Hemisphere are still expected to change the most.
metmike: There is almost no chance we will see that amount of warming.
The discussion on our heat wave had shifted to the other ongoing heat post.
By WxFollower - June 29, 2026, 2:05 p.m.
++++++++++++++
I changed the title of that one to HISTORIC Heat wave in Europe to clarify the huge difference in magnitude between their RECORD SMASHING heat with no air conditioning compared to our MAJOR but more typical Summer heat wave with air conditioning.
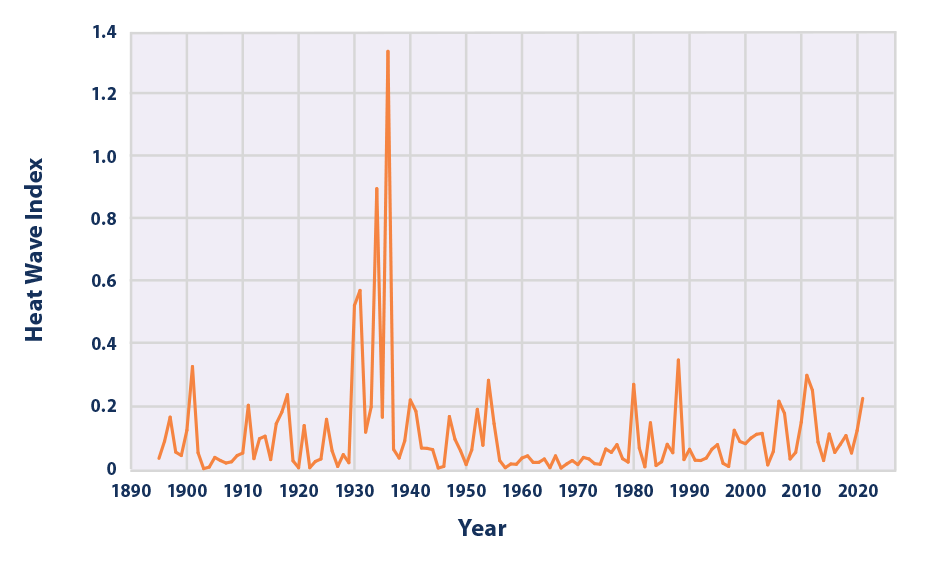
Low temperatures matter too in a heat wave. Look at how lows on Saturday morning do not drop below 80 degrees in some of the big cities along the East Coast. Thank God for air conditioning in 2026. Imagine what it was like in 1936, when much of the entire Summer was like that in the Midwest/Plains and there was no air conditioning! Compared to less than a week of it with this heat wave.
From the EPA
Figure 3. U.S. Annual HeatWaveIndex, 1895–2021
++++++++++++
Related to the brief duration but very intense heat/humidity wave along the East Coast, rather than copy the entire great posts and add to the length of this thread, here are the links.
A key point is that the biggest difference between that 100+ heat in the East and the low/mid 90's to the west is:
1. Dry soils: Significant amounts of solar radiation is used for evaporation in wet soils but goes directly to heating the air in dry soils.
2. Adiabatic/down slope winds on the lee side of the mountain ranges just to their west.
Re: Re: Historic Heat wave in Europe
By metmike - June 30, 2026, 12:55 a.m.
+++++++++++++++++++++
Re: Re: Re: HISTORIC Heat wave in Europe
By metmike - June 30, 2026, 1:17 a.m.
++++++++++++++++++
Re: Re: Re: Re: HISTORIC Heat wave in Europe
By metmike - June 30, 2026, 2 a.m.
++++++++++++++++
Re: Re: Re: Re: Re: HISTORIC Heat wave in Europe
By metmike - June 30, 2026, 8:02 a.m.
+++++++++++++++
Re: Re: Re: Re: Re: Re: HISTORIC Heat wave in Europe
By metmike - June 30, 2026, 8:21 a.m.
+++++++++++++
Re: Re: HISTORIC Heat wave in Europe
By metmike - June 30, 2026, 8:45 a.m.
++++++++++++
By WxFollower - June 30, 2026, 10:50 a.m.
Fork tongue, fake climate crisis advocate Jeff Berardelli MAKING UP how this heat wave in the US is being fueled by the El Nino and climate change.
https://www.facebook.com/reel/1528550338775694
%20Facebook.png)
Easy to bust this guy with authentic facts!
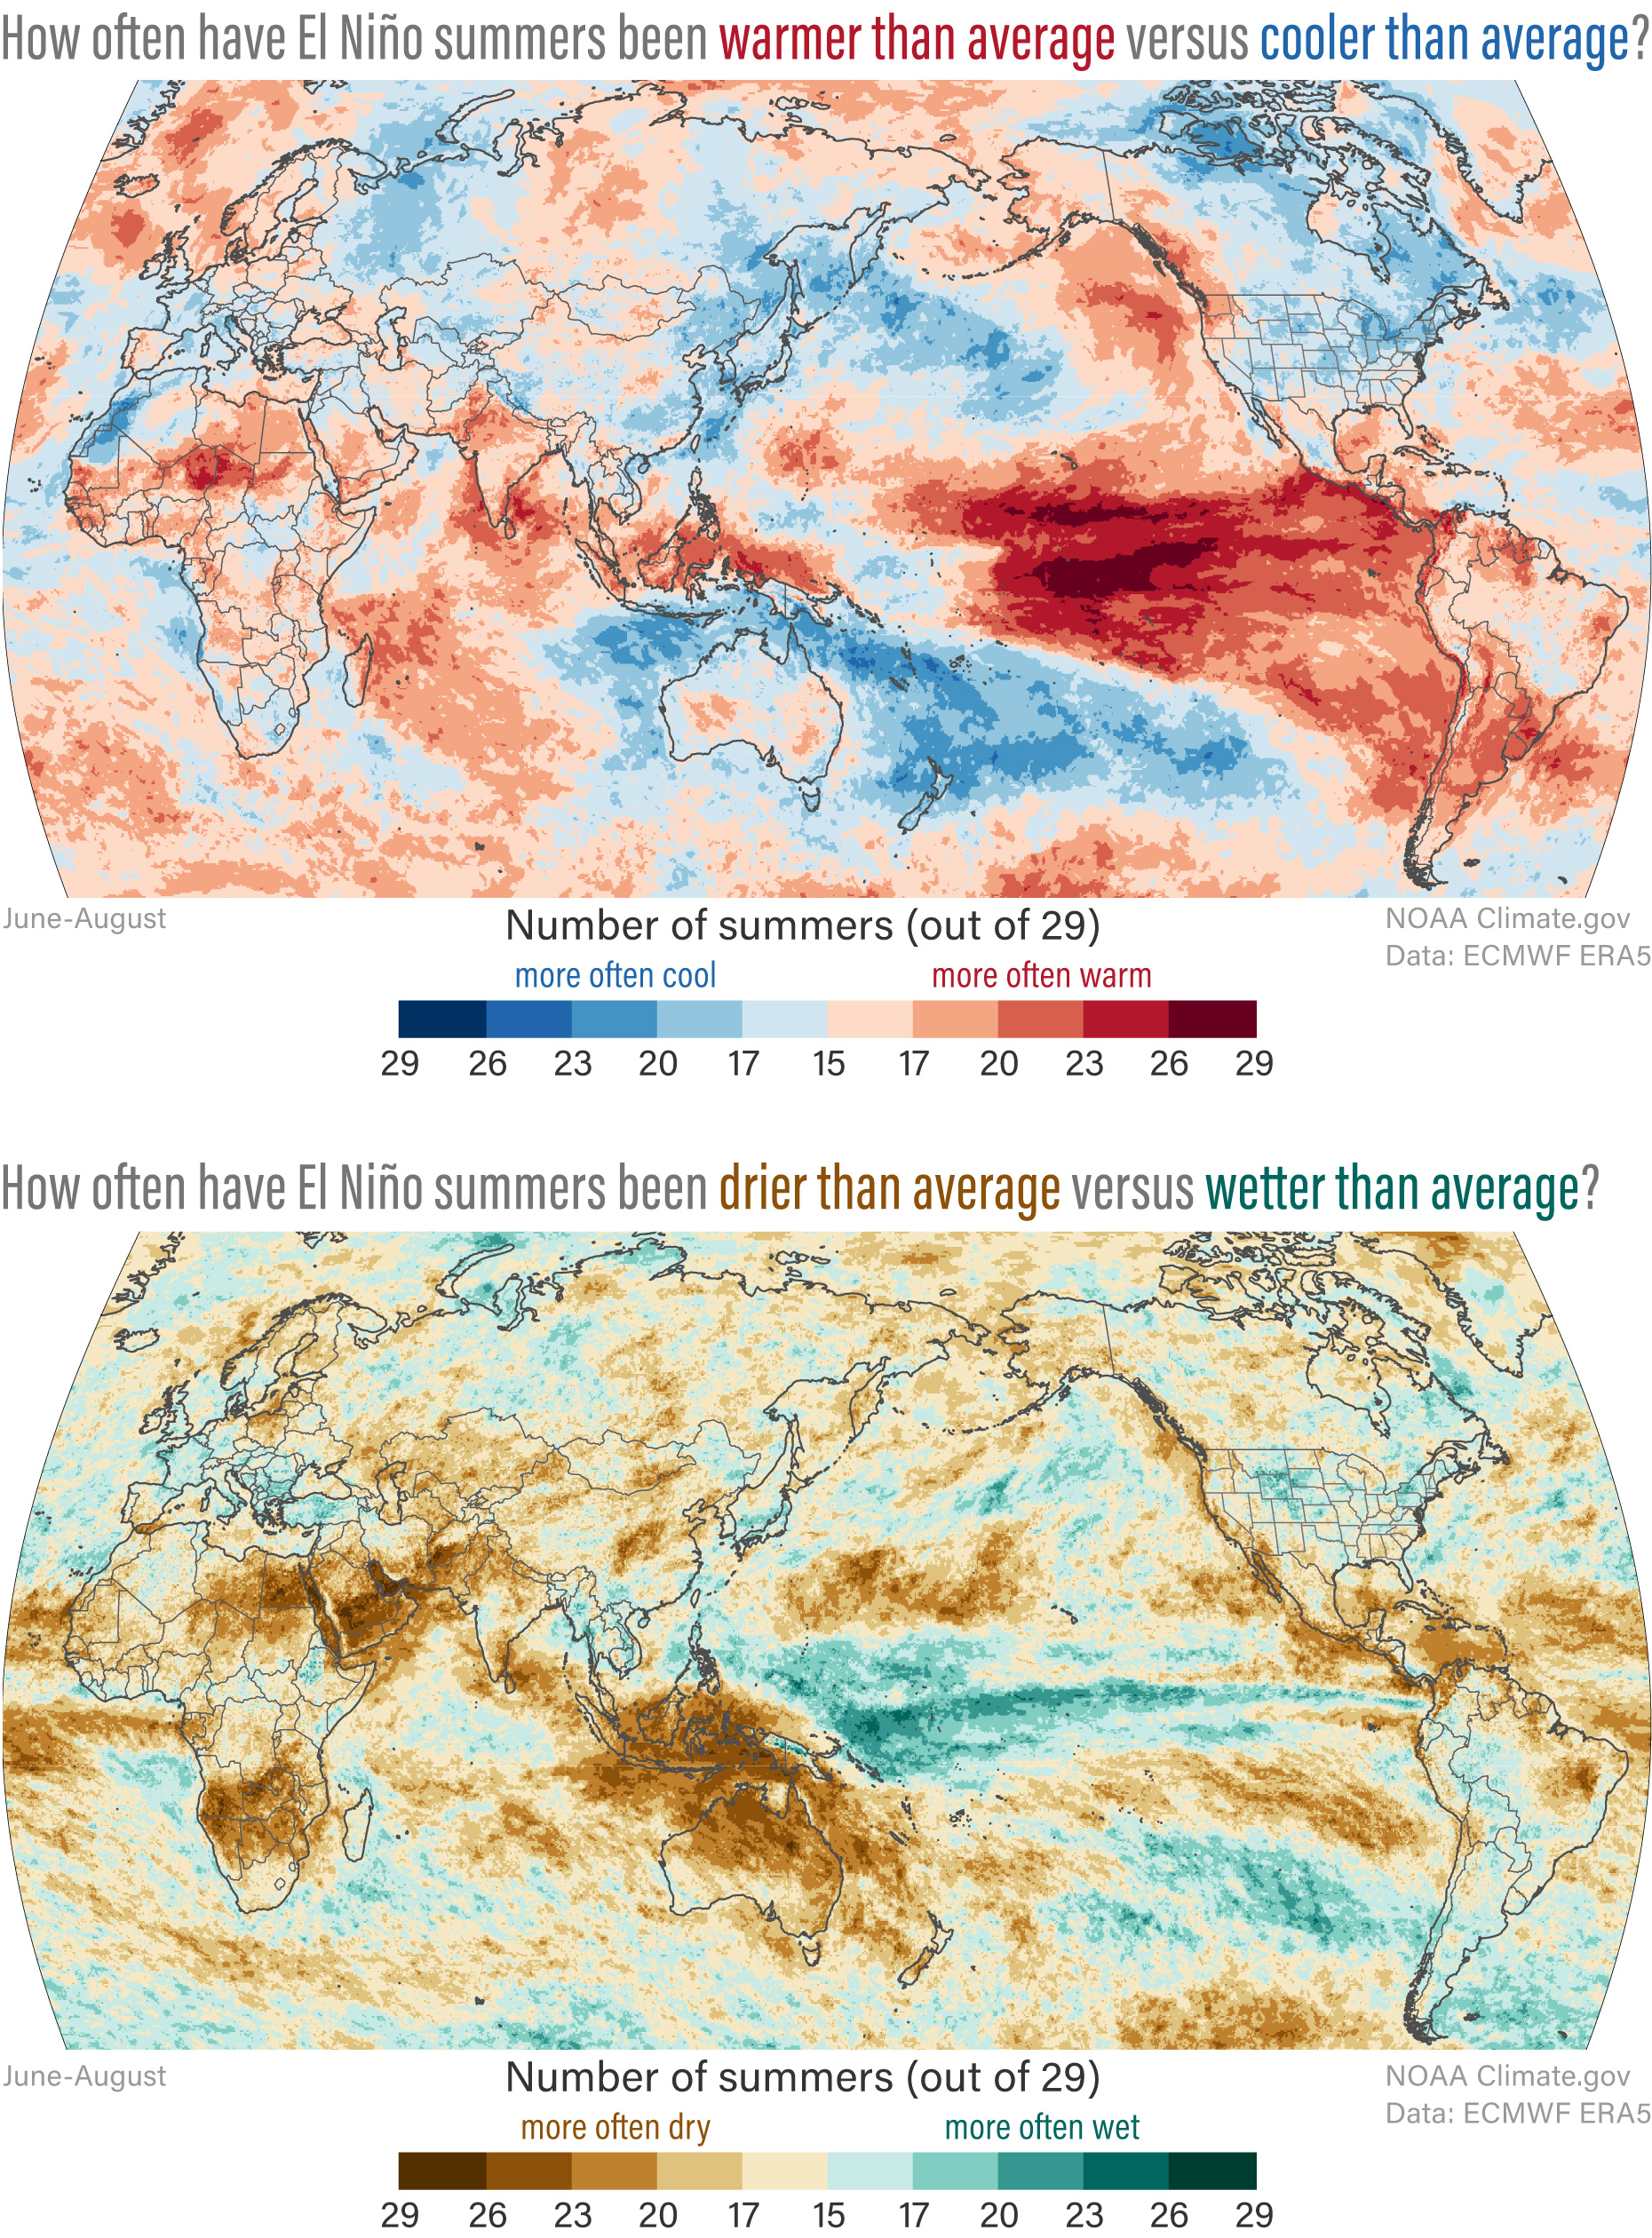
This is the Summer analog for El Nino conditions. Note that the impact of El Nino's in the United States(top right on the analog map below) is COOLER than average temperatures!!!!!
The complete opposite of what he claims. He just makes things up like this all the time to serve his purpose as a fake climate crisis advocate, either without checking the REAL data or intentionally misleading for his agenda.
Published August 24, 2023
The sad thing is that this guy has so many followers that don't know a fraction of what he does about meteorology/climate and...........believe everything he says.
There is no question that this is a MAJOR heat wave, especially because it's hitting some of the highest population centers for several days but exaggerating this and everything related to climate is stealing people's intelligence.
This guy has been doing it for years. It's counter productive to educating people about authentic science/weather/climate.
I'll have to add this again from an objective meteorologist that follows the authentic science:
It really boils down to this, once again(Cliff Mass can be counted on as an elite source for using objective, authentic science)
https://cliffmass.blogspot.com/2016/03/the-golden-rule-of-climate-extremes.html
The GoldenRule
Considering the substantial confusion in the media about this critical issue, let me provide the GOLDENRULE OF CLIMATE EXTREMES. Here it is:
The more extreme a climate or weather record is, the greater the contribution of natural variability.
Or to put it a different way, the larger or more unusual an extreme, the higher proportion of the extreme is due to natural variability.
To see an example of what a real historical (long lasting) heat dome looks like, IN THE OLD CLIMATE, see this illustration of July/August 1983.
Re: Re: Re: Re: Re: Re: Grains/USDA report 6-30-26
By metmike - July 1, 2026, 3:29 p.m.
1936 would put even this very impressive 1983 illustration to shame.
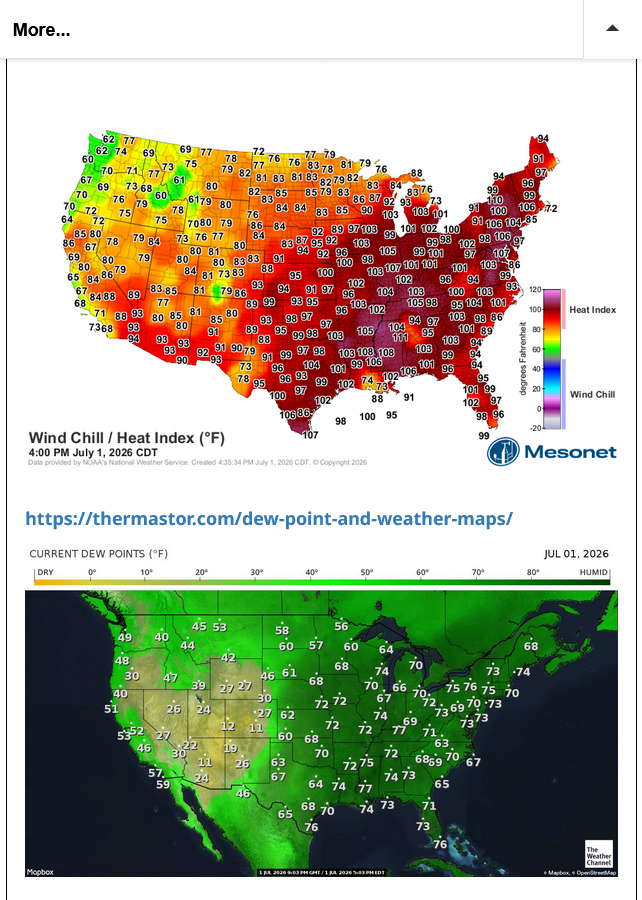
Here at peak heat, 4pm on Wednesday we have another bust on the magnitude of the heat in the forecast.
Outside of a very small spot in the Mid-South the Heat Index everywhere is below the excessive heat threshold. It's NOT because the dew points are low..........although they were a tad lower than yesterday(from the ground drying out and the reason the heat index was also slightly lower today)
It's because the actual temperatures/thermometer did not get as hot as expected.
Dew points are still pretty high!
+++++++++++
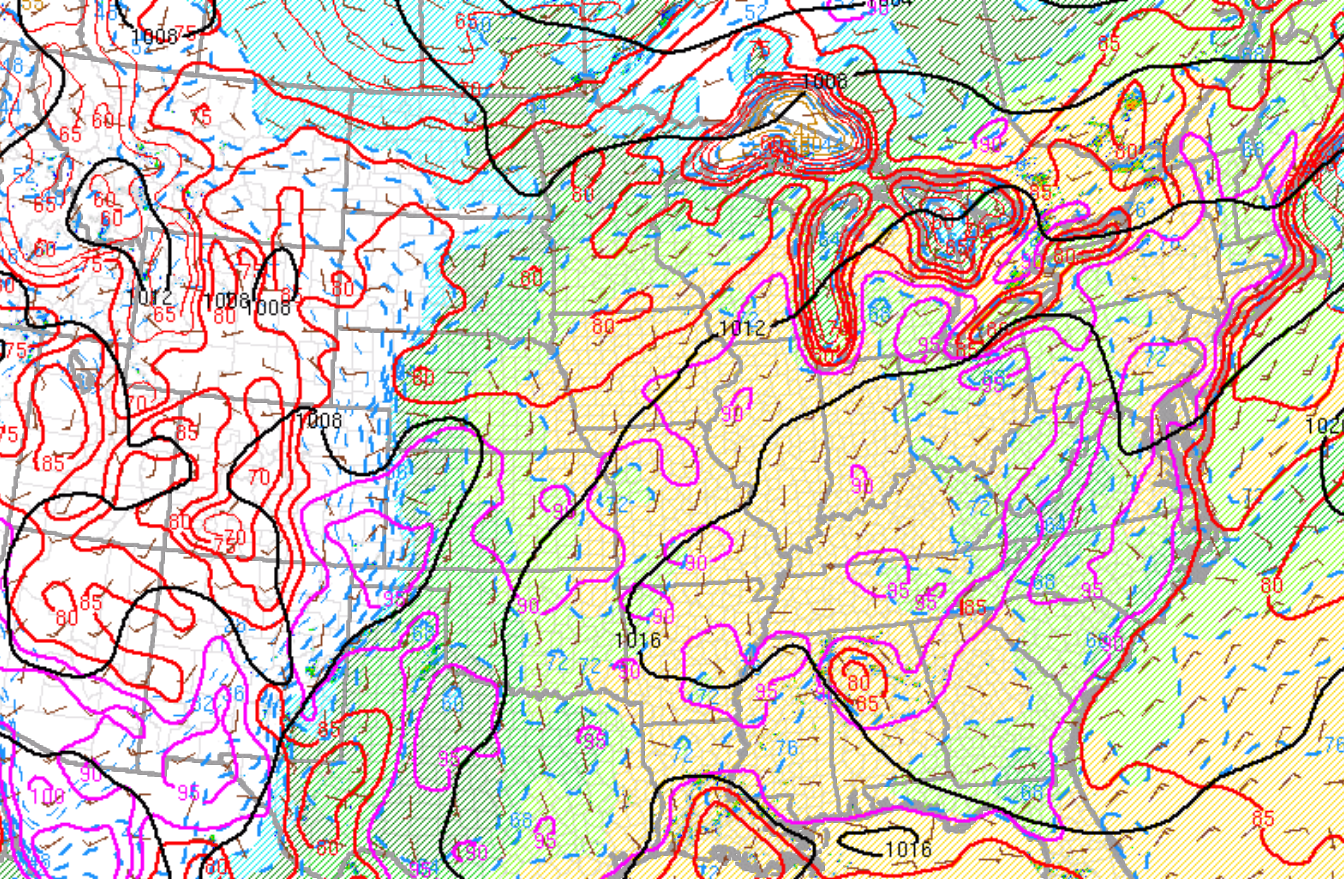
Current temperatures show a few small pockets just above 95 degrees. We can see a band of 95+ on the lee side of the Appalachian mountains where down sloping along with dry soils is adding around 10 degrees to the temperature compared to flat terrain wet soils.
AI Overview
+++++++++++++++++++++++
Our high today in Evansville, IN was 93 degrees which was 5 degrees above the average high of 88. This was 13 degrees from the record high of 106, set in 2012, with bone dry soils and a drought 14 years ago (from the La Nina).
The last 2 days, the high temp forecast was 4 degrees less than the NWS computer foreccast.
The highest our heat index got to today was 103 deg. F.
https://forecast.weather.gov/data/obhistory/KEVV.html
Below is the actual criteria for issuing the current excessive heat warnings across so much of the country. Different regions have different criteria. In the Deep South, it needs too get hotter than in ND.
https://en.wikipedia.org/wiki/Extreme_heat_warning
An extreme heat warning is a notice issued by the National Weather Service of the United States within 12 hours of the heat index reaching one of two criteria levels. In most areas, a warning will be issued if there is a heat index of at least 105 °F (41 °C) for more than three hours per day for two consecutive days, or if the heat index is greater than 115 °F (46 °C) for any period of time
++++++++++
I don't necessarily have a big problem with them issuing the excessive heat warnings for conditions that never meet the actual criteria but have a HUGE problem with the media and some meteorologists and every fake climate crisis source making this out to be an HISTORIC heat wave for so much of the country.
We're in the middle of this thing and our hottest temperature(maybe 96?) will not even be in the top 100 hottest days in Evansville history! Here's the top 10.
https://recordtemps.in/evansville-indiana
07-28-1930: 111°F
07-13-1936: 108°F
07-26-1930: 108°F
06-28-2012: 107°F
06-29-2012: 107°F
07-05-2012: 107°F
07-12-1936: 107°F
07-22-1901: 107°F
07-27-1930: 107°F
06-30-2012: 106°F
+++++++++++=
Every one of those records occurred during extreme droughts with dry soils and low dew points so the heat index was not crazy high.
It's impossible to generate temperatures that high in this part of the world with wet soils and high dew points. It's NEVER happened because of the law of physics/meteorology.
+++++++++
Our highest heat index happened in 1987 when it hit 117.
The records below only go back to 1948 and does not cover the 1897 to 1947 period, including the hottest decade ever(1930s).
However, ever single Summer going back almost 8 decades featured a temperature at least this hot, or in many cases MUCH hotter.
We should be able to get a few degrees hotter the next 2 days but that will only bump us into the lowest range for hottest days each year. Keep in mind that the stats below are for EVERY YEAR, including cool Summers. So hitting 95/96 is nothing special!!!!
We do it EVERY YEAR!
https://www.extremeweatherwatch.com/cities/evansville/highest-temperatures-by-year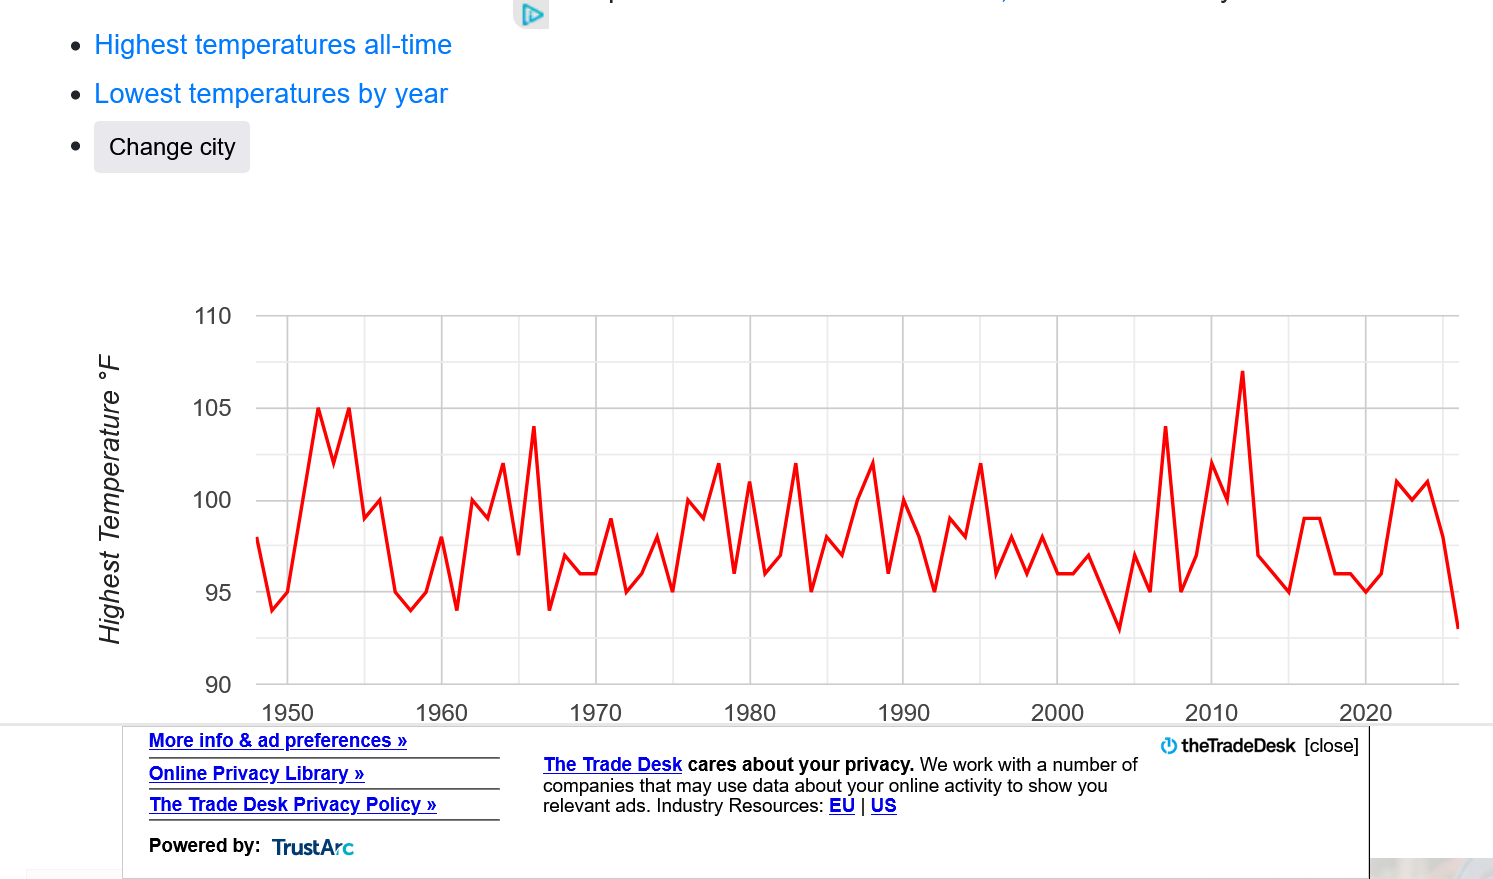
Thanks, Mike,
To reiterate, you and I 100% agree that Jeff’s calling this one of the most expansive US heat wave ever is wrong. Even Don have me a like for my post stating this. Common ground! That was obvious.
I also tend to agree with you about Jeff being off in essentially saying the super El Niño is responsible for this heatwave since if anything, it’s more often than not cooler in the E US in summer during strong El Nino’s. However, I’m in the midst of double-checking this with sources I like to use and will let you know if I find anything surprising.
However, I’ll reiterate that Chris Martz also looked really bad as Don and I agree on, which was Don’s major point. His “it’s called summer” and also not realizing “heat dome” has been used in a widespread manner by pro mets for decades makes him look really stupid and/or ignorant despite being smart.
Much appreciated, Larry!
Here's another reason why most of the temperature forecasts in the humid areas with wet soils are busting from being too high and one of the things that guys like Jeff, apparently don't understand about the physics of the atmosphere in the very humid areas compared to dry areas.
We discussed this at length about why the West and deserts are warming faster than other regions at the same latitude. The highest/coldest/driest areas of the Northern Hemisphere are warming the fastest. H2O swamps CO2 at several radiation absorption bands that they have in common when its warm and humid. Low H2O means that radiation absorption band has room for CO2 to absorb additional heat radiation.
High H2O means LESS room for heat absorption at numerous radiation bands. So very warm, humid air masses WARM THE LEAST from CO2 greenhouse gas warming. Cold/dry the most.
This is why the warming has mostly been in the higher latitudes(and DESERTS).
Not that much heating from CO2 during heat waves that feature extremely high humidity, like this one.
https://commons.wikimedia.org/wiki/File:Longwave_Absorption_Coefficients_of_H2O_and_CO2.svg
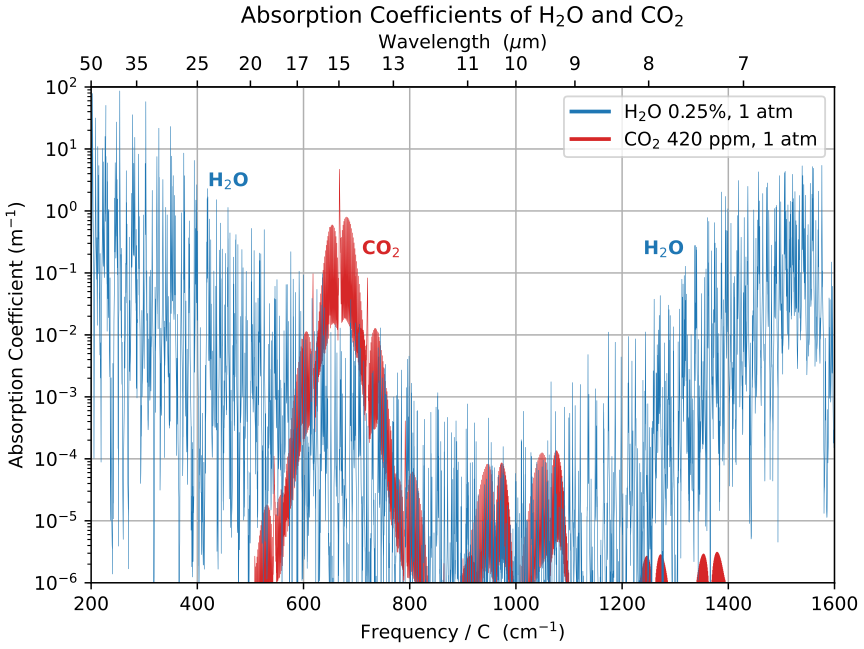
So this current heat wave is almost entirely from natural variation. No contribution from the developing El Nino and very little impact in the humid areas from climate change.
A warmer atmosphere can hold more moisture and that is a positive feedback for additional green house gas warming from the extra H2O.
However, higher moisture also reduces the warming from CO2 at some radiation bands.
it sounds confusing and there’s uncertainty As well as how will imoact global warming.
Thanks, Mike!
As we’ve seen , the forecasted heart of this E US heatwave has always supposed to have been near the E coast from SC to Hartford rather than further west. That’s why I agreed that this isn’t all that expansive. I’d like to see how hot places like DC, Philly, and NYC metros actually get before my assessing how this heatwave holds up vs progs.
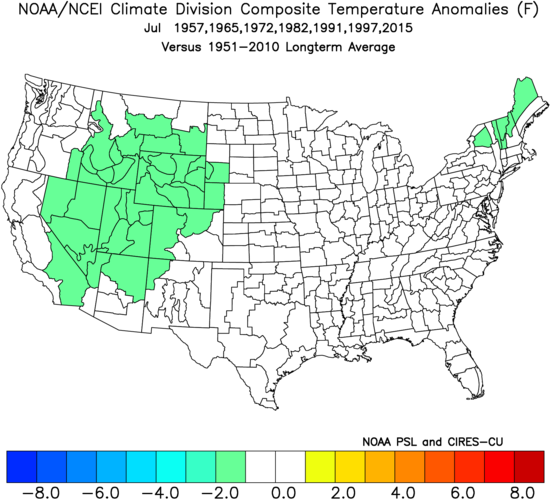
Wxfollower update: upon further review of my main source of info, the mean temp in July and in summer as a whole comes out close to normal in the E US when averaging super strong El Ninos. See attached pics. Hardly any were hot. That’s enough for me to say that, indeed, the upcoming super-El Nino in combo with GW is not the direct cause for the current E US heatwave. GW, by itself, obviously favors hotter heatwaves than when the Earth was cooler. But the super-El Nino piece of this does not compute to me.
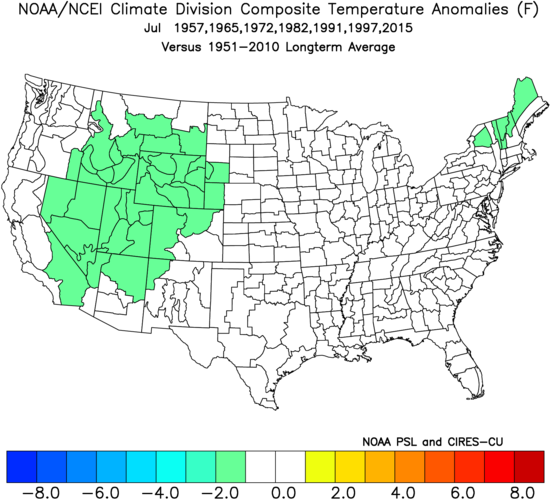
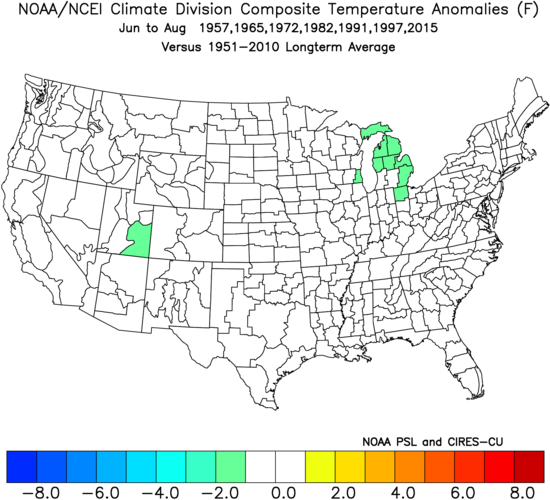
New Wxfollower post to Don:
“I’ll reiterate that I thought Chris Martz looked really bad due to saying ‘it’s called summer’ and for saying ‘heat dome’ wasn’t the correct term. However, I also said Jeff B. was wrong for calling the current/upcoming US heatwave one of the most expansive in history. Here again is Chris’ post responding to Jeff:
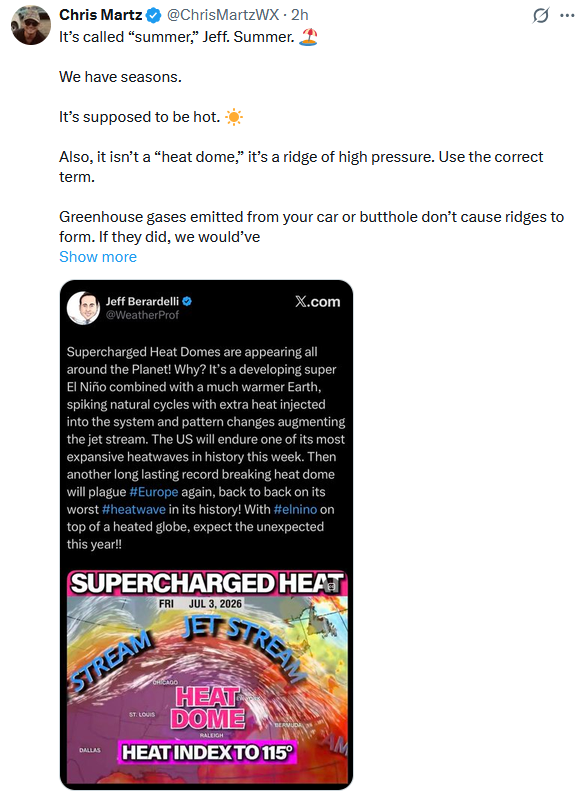
But I forgot to earlier mention this: The mean temp in July (and also in summer as a whole) comes out close to normal rather than hot in the E US when averaging RONI based super strong El Niños. See image below. Hardly any were hot. 1957, 65, 72, and 97 were slightly cool. 1982 and 2015 were NN. Only 1991 was hot. That’s just 1 of the 7! That’s enough for me to say that the upcoming super-El Nino in combo with GW is not the direct cause for the current E US heatwave as Jeff said. GW, by itself, obviously favors hotter heatwaves than when the Earth was cooler. But the supposed super-El Nino piece of this, itself, correlating to E US heat does not compute to me at all. Thus whereas I thought Chris’ post was terrible, I also think Jeff’s was pretty bad, itself:
Great way to communicate honest, objective science, Larry!
The heat wave in Europe is in an historical league of it's own, especially because most of those poor people have no air conditioning.
I'm puzzled why there have not been more deaths.
The 2003 heat wave killed 70,000 people in Europe. Maybe that one lasted longer? I have not studied those conditions at all other than knowing some basics.
Thanks, Mike!
Despite not criticizing Jeff, Don said he agrees with my take on the lack of a connection of super El Niños and hot E US July’s (common ground for us 3 on this is nice to see).
Larry, you're always the best when it comes to weather data and analogs like this.
+++++++++++++
In addition to what we've already discussed on the burgeoning El Nino NOT impacting this PARTICULAR heat wave, the just out June global temperature anomaly indicates that it has not started to warm global temperatures yet.
It WILL do that later this year, however like every natural El Nino does as heat belches out into the atmosphere from this key tropical location in the world's biggest ocean!
Global temperature anomaly for June 2026-UAH
Started by metmike - July 2, 2026, 3:21 p.m.
https://www.marketforum.com/forum/topic/121303/
Current temps.
Intense heat in the East(with dry soils and compression al heating on the lee side of the mountains. A few spots hitting 100+ Deg. F! Lake cooled air over the water in the Great Lakes. Over northern Lake Superior, still in the 40's!!!!
60's in the middle of Lakes Michigan and Huron. 70's over Lakes Erie/Ontario.
Ocean temps in the Southeast are 80+. Mid-Atlantic in the 70's to 80. Cooling to the 60's in the Northeast. 50's in Southeast Canada.
%20wave%20coming%20next%20week%20-%20MarketForum.png)
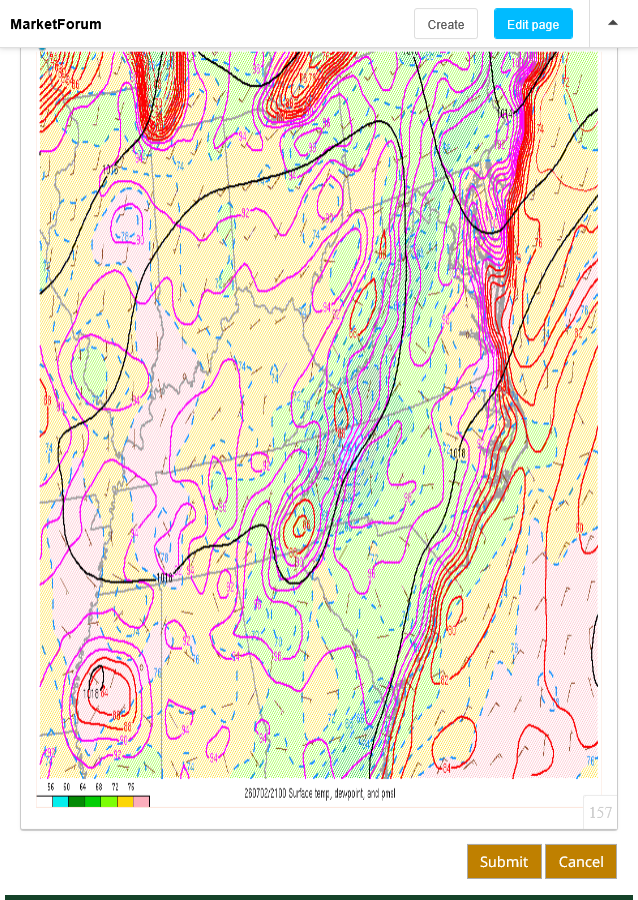
Evansville, IN hit a new high for the week at 95 deg. That was 7 degrees above average. The Heat Index hit 107 and was above 105 for 2 hours today.
The record high for today was 103 set back in 2012.
https://www.weather.gov/pah/EvansvilleDailyNormalsAndRecords
At 4pm, there we a few small spots at 95+ Deg with the exception of the lee of the Mountains in the East. It was 95+ in an extremely lengthy area from the state of NH all the way down to SC/GE! There were several locations just above 100 from NY to VA.
This was from compression-al heating of the air on the lee side of the mountains, combined with dry soils that combined, added 5-10 degrees to the thermometer from the physics of those added elements.
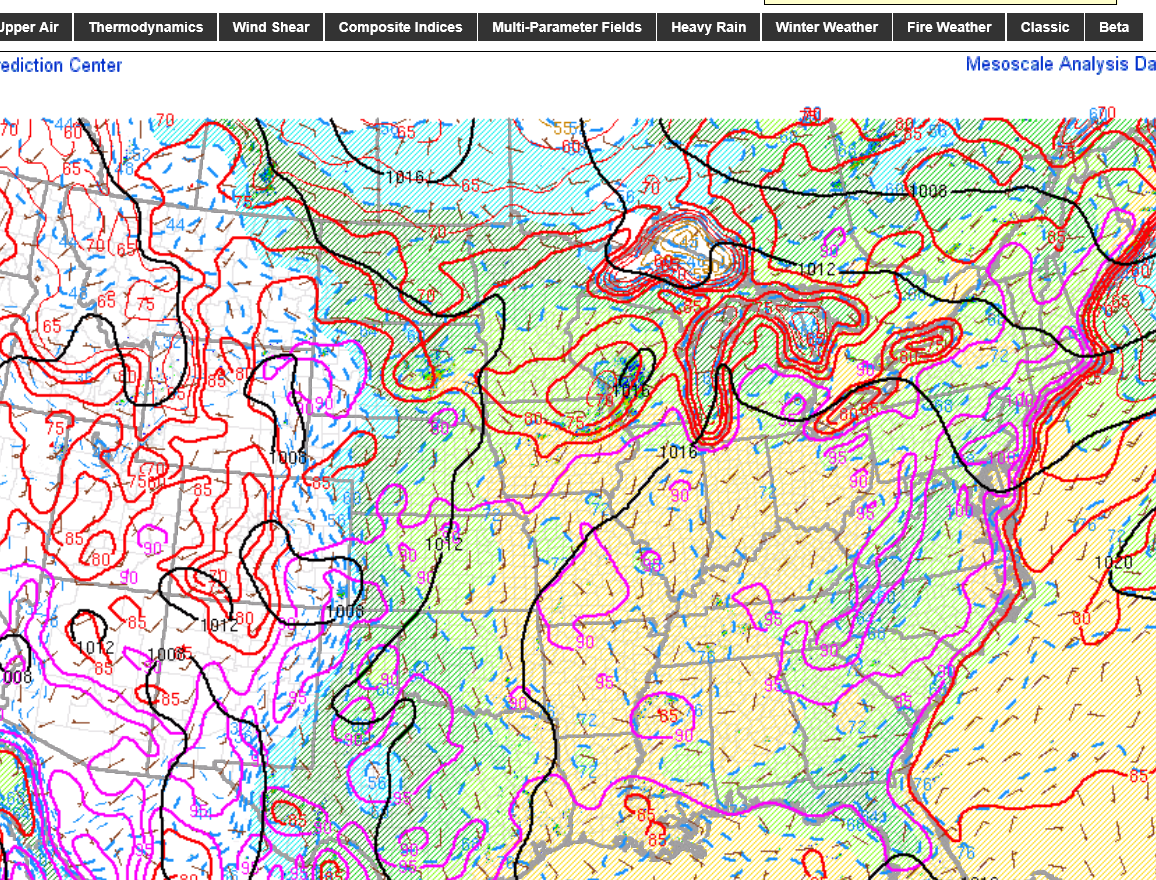
The biggest factor by far defining this heat wave continues to be the humidity, with dew points being the direct measurement of how much moisture is in the air (independent of the temperature).
Dew points have actually dropped slightly from earlier this week as the ground dries out.
The forecast for record breaking intense heat is surely living up to the predictions in parts of the E US, which is where the models have had the hottest:
https://www.cnn.com/2026/07/02/weather/heat-wave-east-coast-july-fourth-climate-hnk
More on this impressive 7/2/26 record heat:
La Guardia 104: only 7/3’s hottest has been hotter!
JFK 102: only July 3rd and July 22nd have had a hotter high!
Newark 105: only July 22nd has had a hotter high
Thanks very much, Larry!
science/weather-explainers
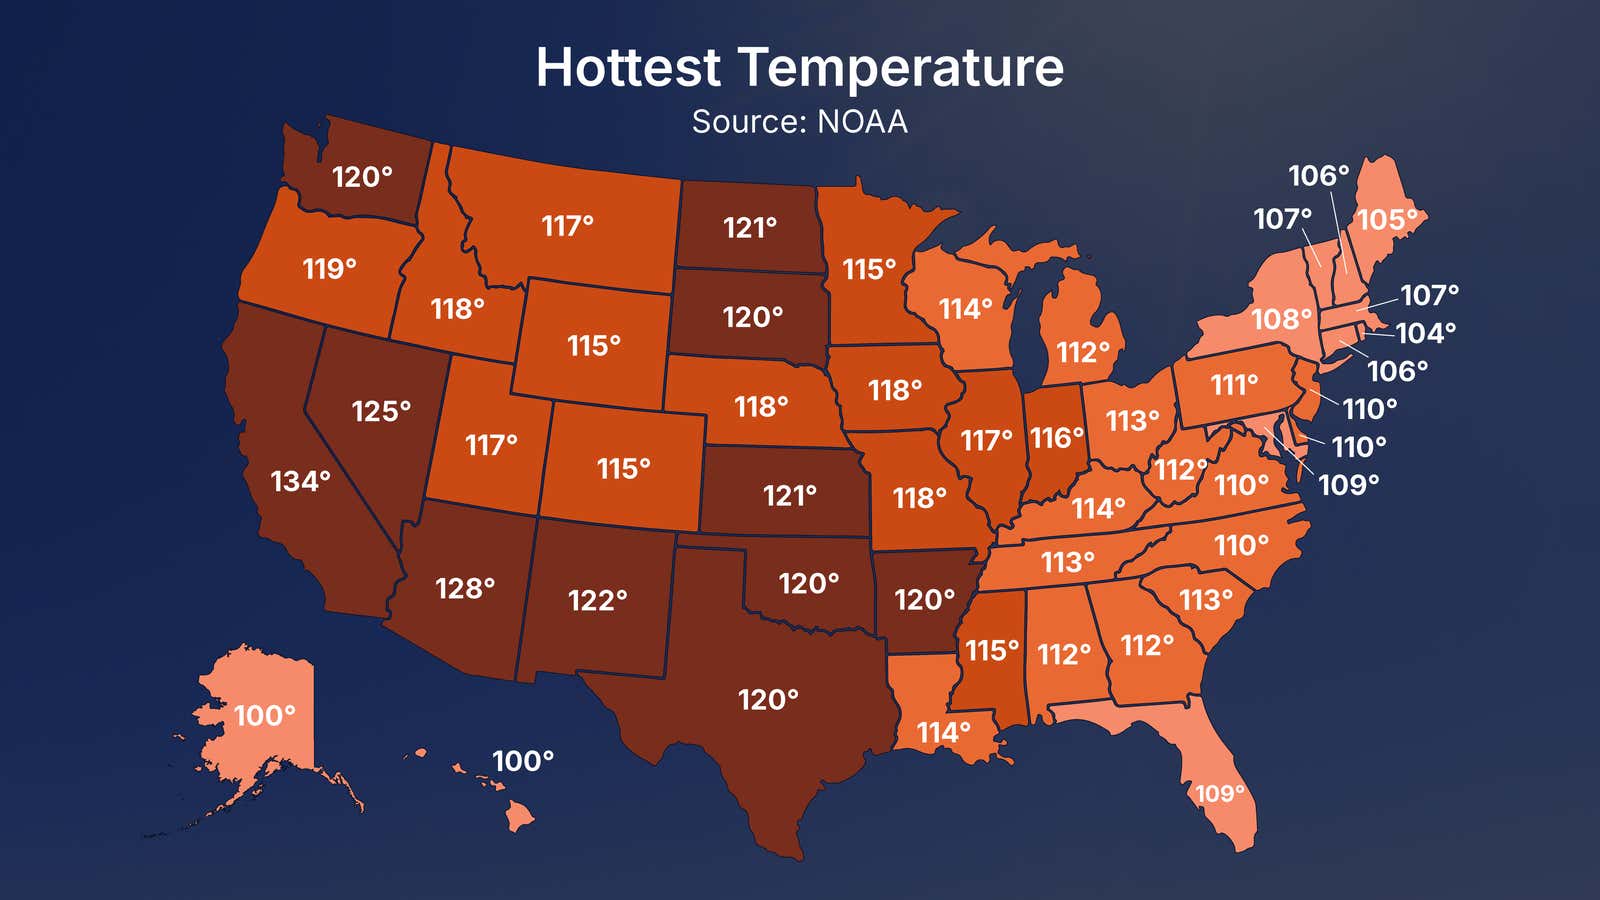
https://www.facebook.com/photo/?fbid=1286600839489433&set=a.232272598255601


https://en.wikipedia.org/wiki/U.S._state_and_territory_temperature_extremes
++++++++++++++
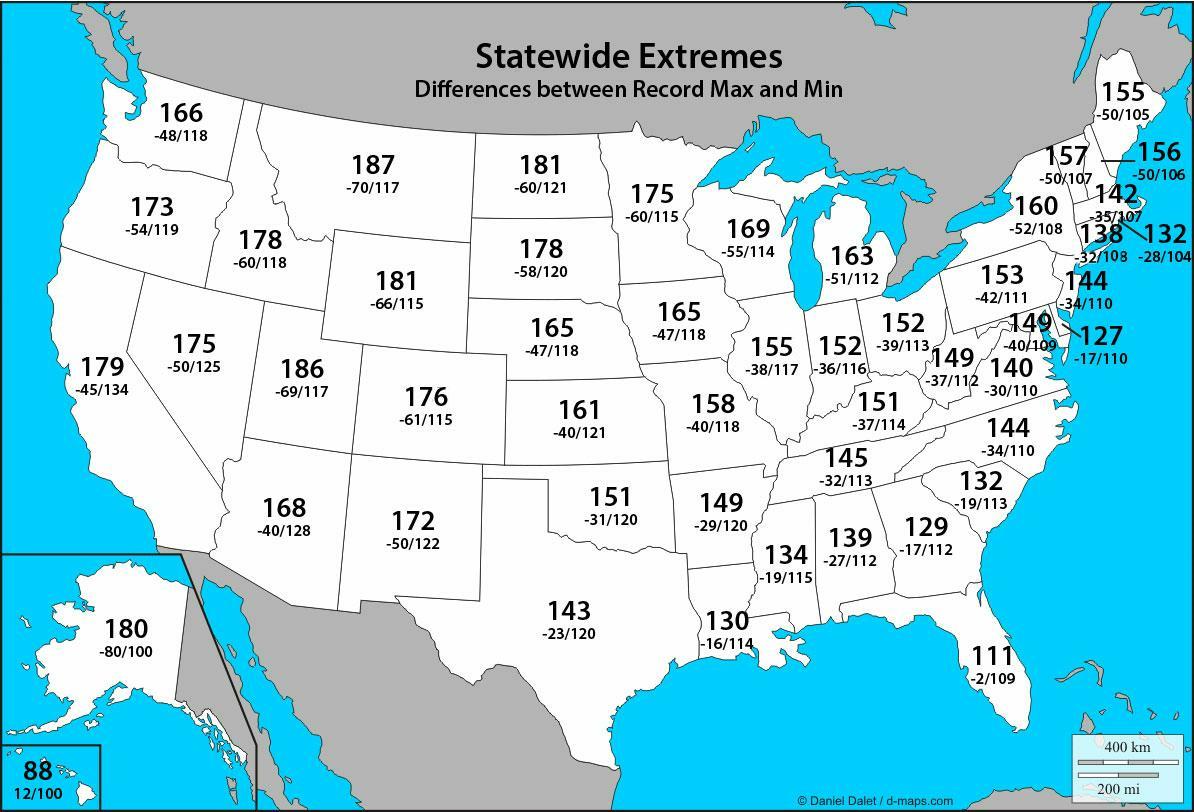
UNITED STATES EXTREME RECORD TEMPERATURES & DIFFERENCES
https://ggweather.com/climate/extremes_us.htm
At Central Park (NYC) the lowest so far today is 84. IF that were to hold up through 11:59PM, it would tie the all time highest low there, which goes way back to 1869!
https://www.weather.gov/wrh/Climate?wfo=okx
*Edited to provide link to source of data
Thanks, Larry!
I've been trying to find a list for all the record warm low temperatures for each state but so far have come up empty.
Here at 4pm, a bit hotter than typical Summer heat. Nowhere close to records, EXCEPT IN THE EAST! The heat index at a couple locations there has been at or approaching 115, where drought and adiabatic warming from down sloping winds east of the Mountains has added up to 10 degrees to the REAL temperature.
https://www.marketforum.com/forum/topic/83844/#83845
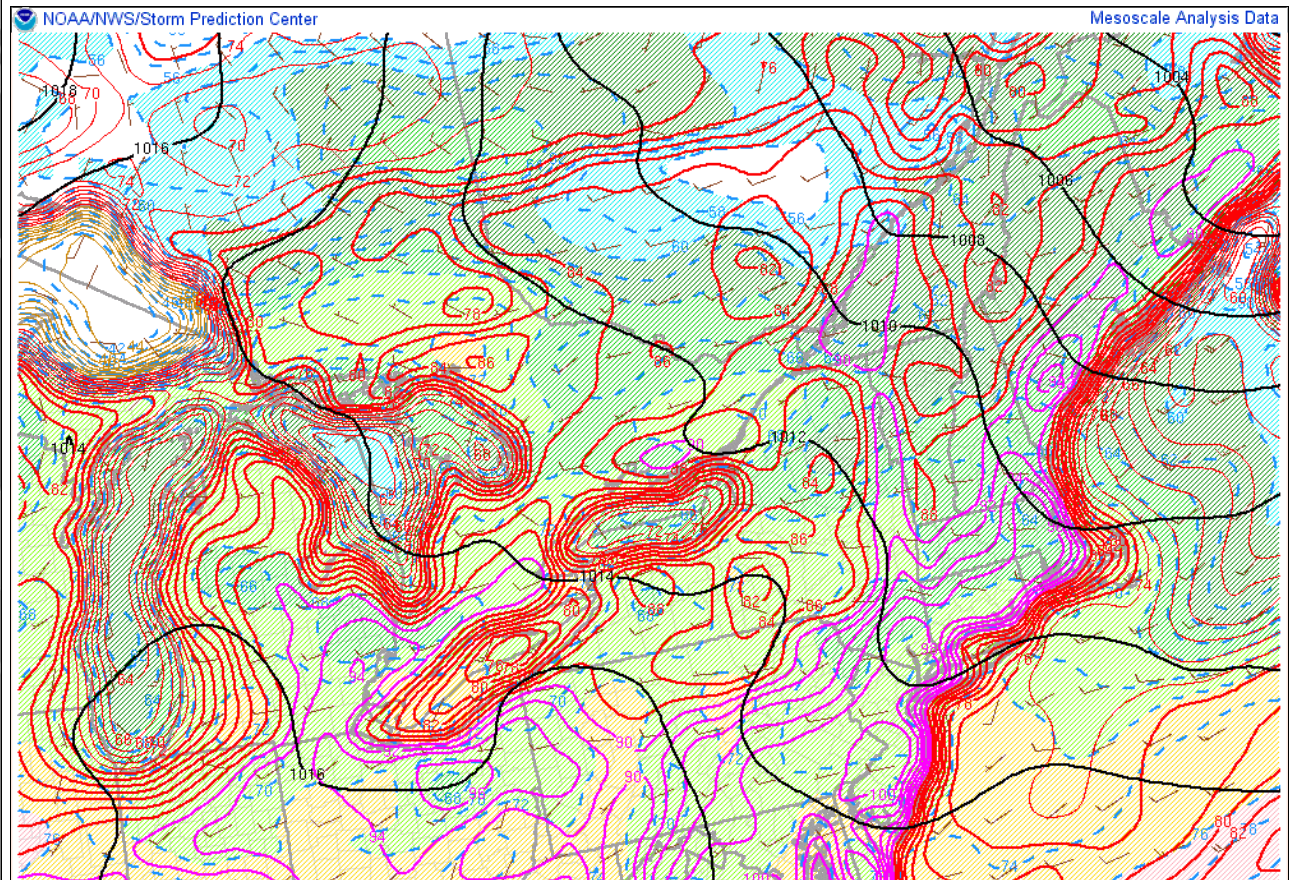
Note the ACTUAL TEMPERATURES BELOW.
Everybody east of the Appalachian's is 96+, except along the coast. Fairly substantial pockets of 100+
Farther north for patrick in Boston:
We hit our hottest for this heat wave today at 96 degrees in Evansville, IN which was 6 degrees from the daily record of 102, set in 2012 and 8 degrees above average. Our heat index also peaked at the highest of the week at 107.
The heat index was just above 105 deg. F for 4 hours this afternoon.
Our July record hottest was set on July 28, 1030 at 111 degrees, F.
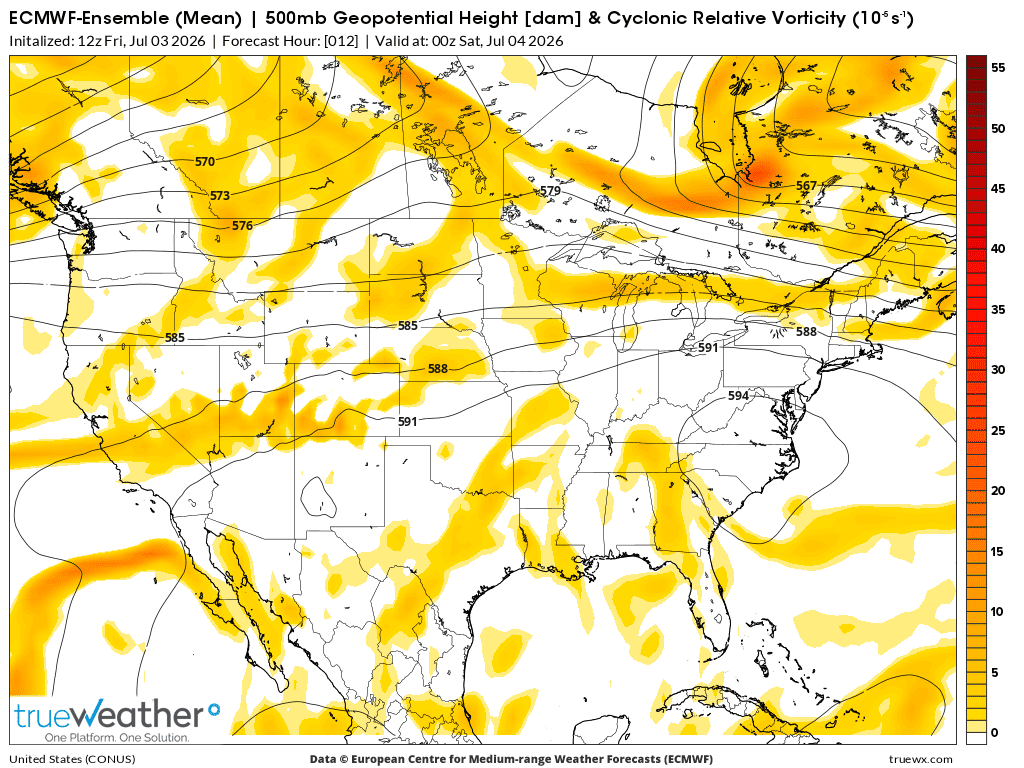
The last of this short lived dome is being squeezed completely out of the picture right now (594 dm heights for 500 mb below) as it reforms/retrogrades to a new position 1,500+ miles farther later this month where it looks to reside for much longer than the brief duration this week.
The jet stream is diving south and pushing with it storms and a cold front right now, easily obliterating this dome. In the hottest Summers, domes bigger than this that lasted many weeks to most of the Summer dominated.
500 mb below on July 3, 2026. Small 594+ dm heights left in the Mid Atlantic.
15 days from now below, July 18th. The intense heat will reside in the Southwest/Rockies to the High Plains with northwest flow into the Midwest. Modest troughing in the East assures a MUCH cooler pattern with good rain chances.
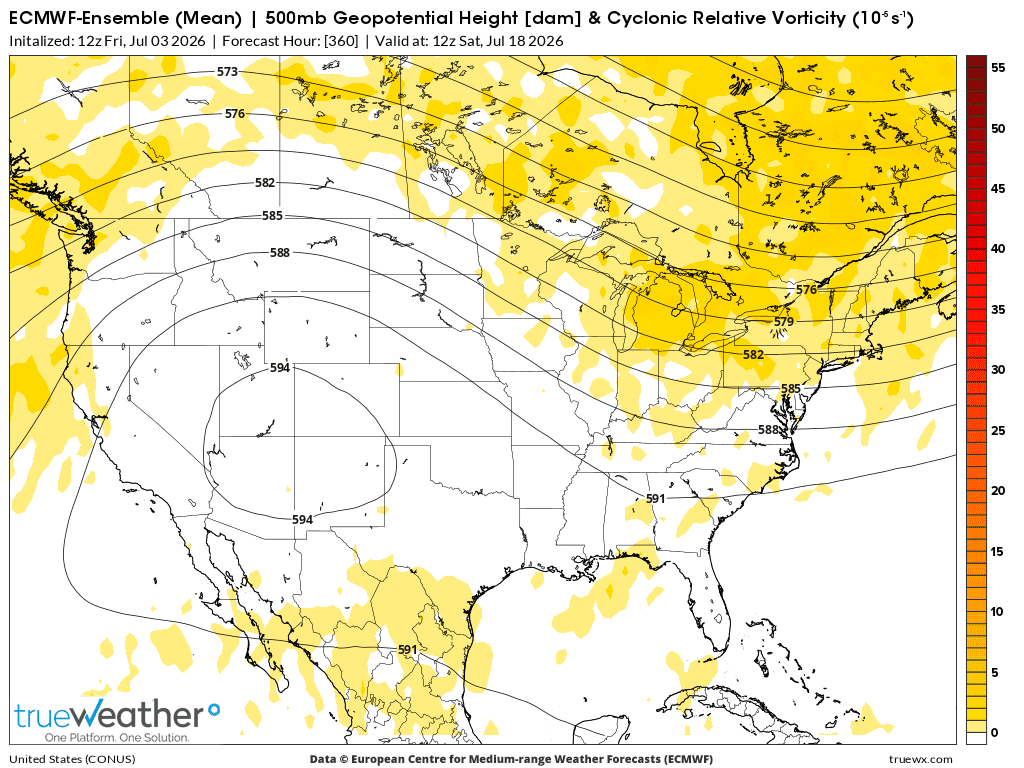
Oh Yeah!
Should be cool enough to grill tomorrow.
Happy grilling, patrick!
Big cool down for the East Coast the next 2 weeks compared to this week!
Will Central Park have their warmest low in history (84 so far)?
https://forecast.weather.gov/data/obhistory/KNYC.html
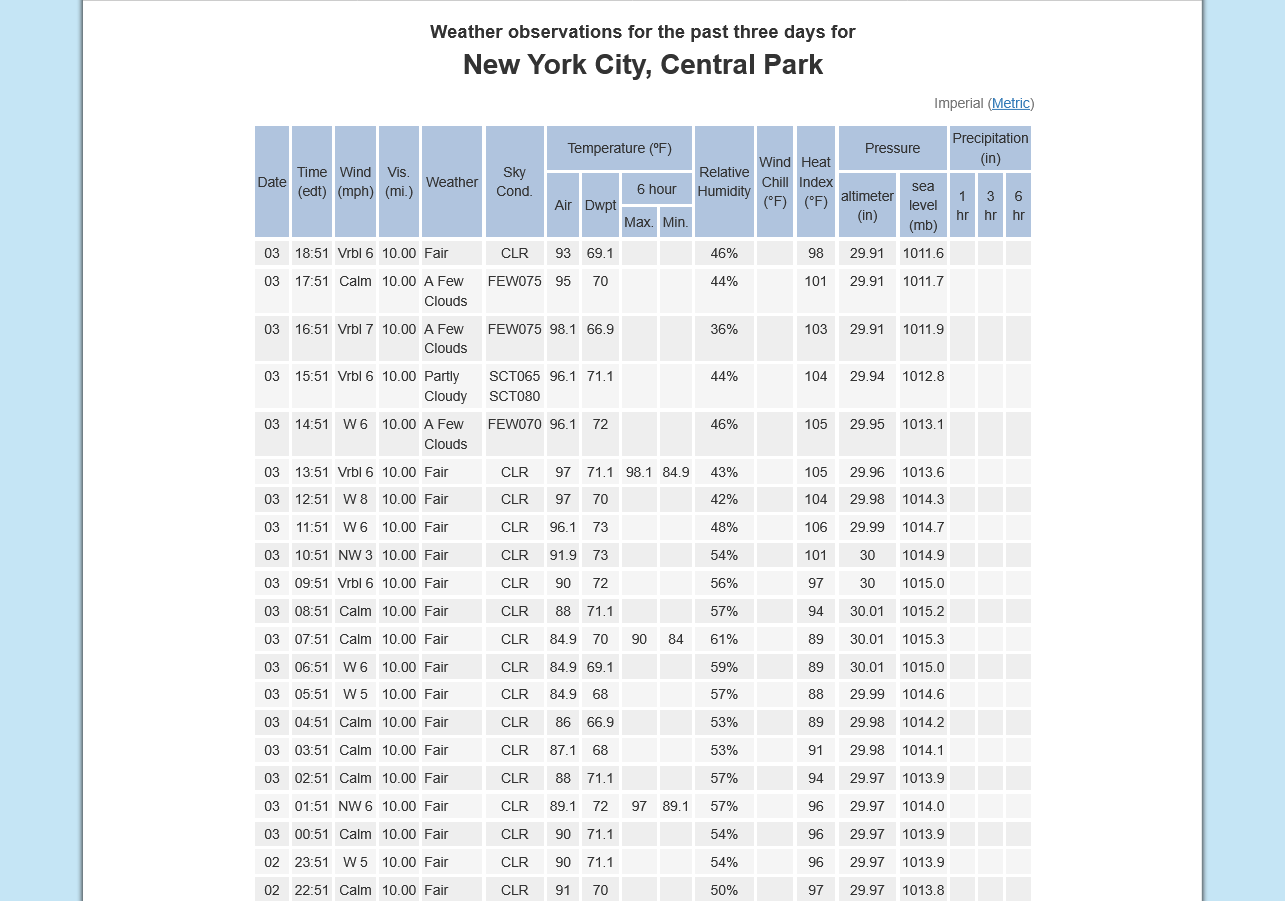
I say it will require missing these rains that will cool temps below 80! So no!
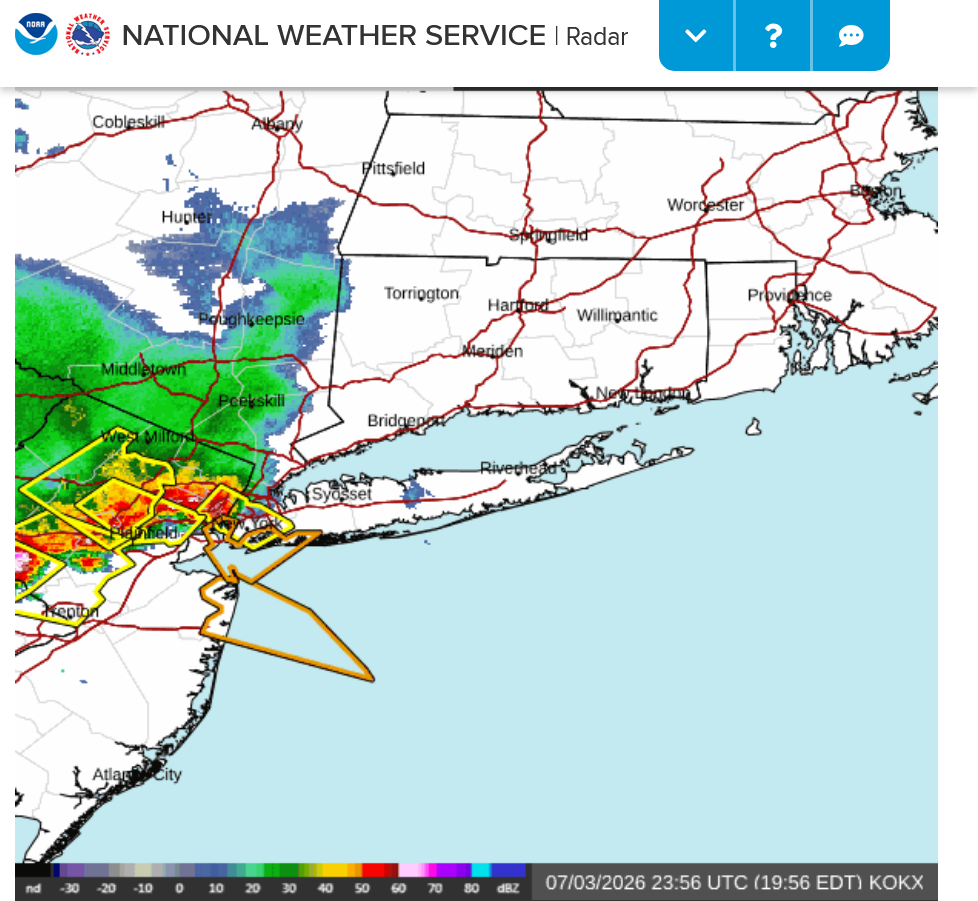
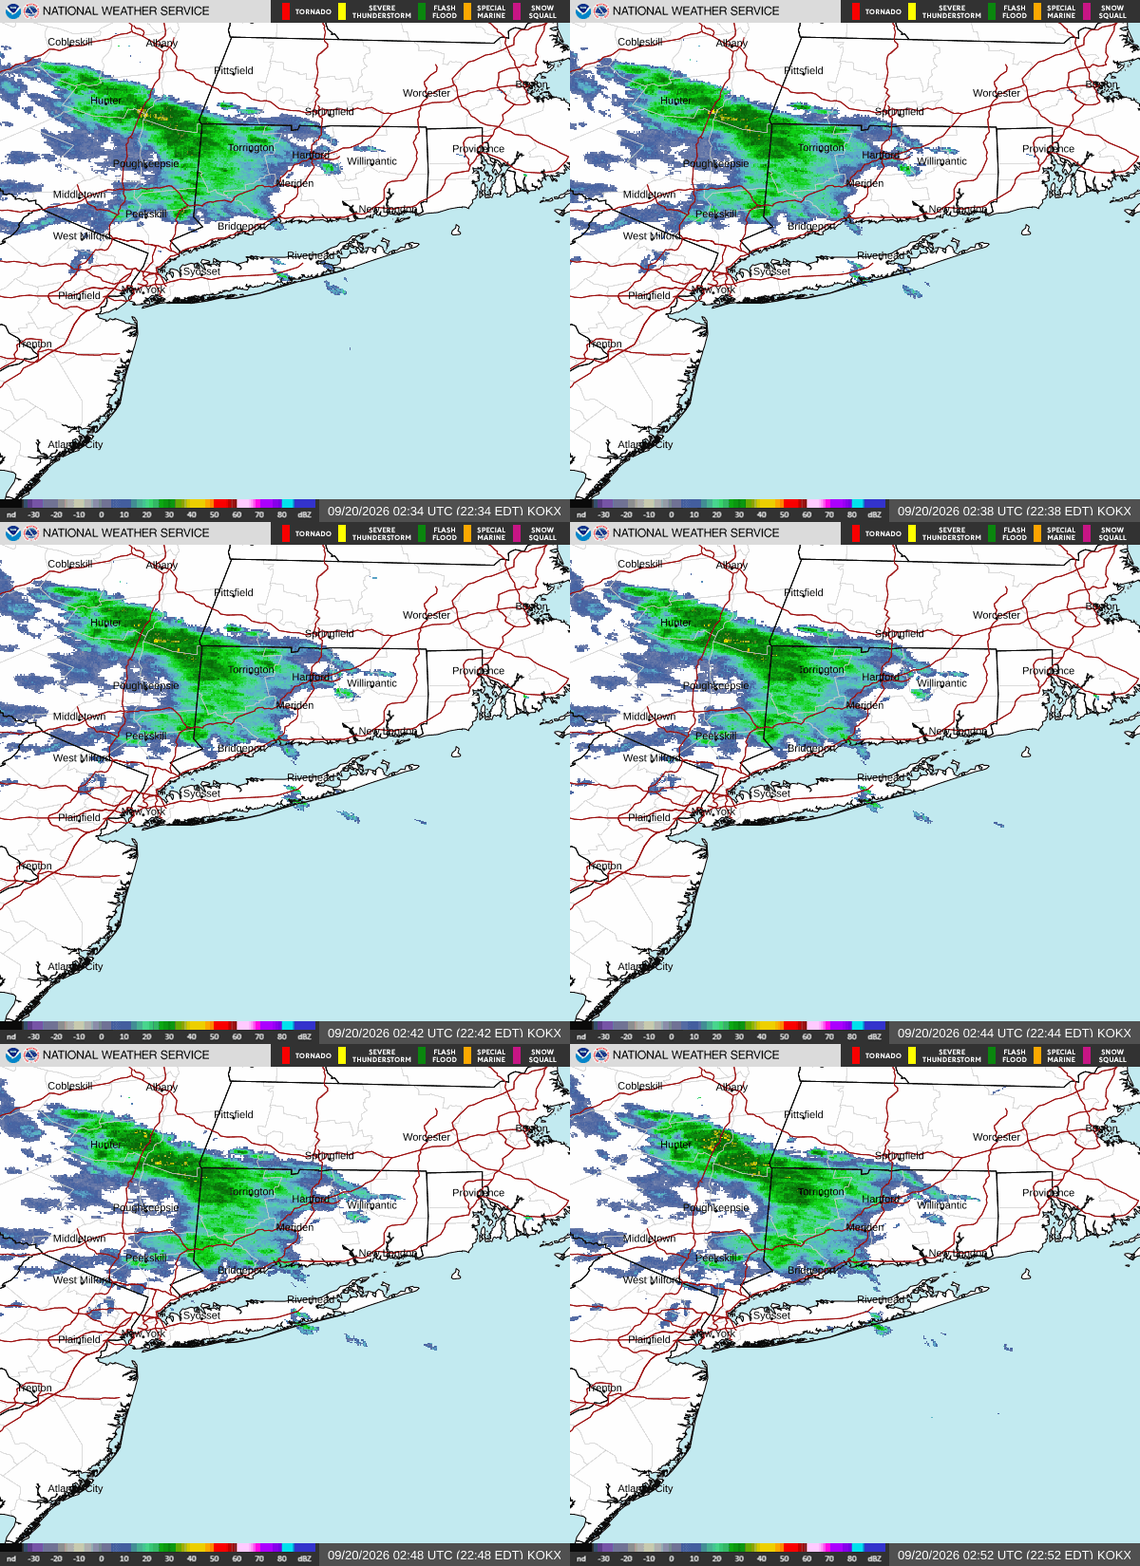
Rain cooled the temperature down to 72 deg. at Central Park.
So the heat wave is ALMOST over there.
Wed-93
Thu-100
Fri-98
SAT-94
+++++++++++=
For those insisting that heat waves like this could not have happened without climate change(Jeff Berardelli).
It's been MUCH worse before! Even in the 1800's when global temperatures had bottomed out after the Little Ice Age.
The 1896 Eastern North America heat wave was a 10-day heat wave across much of Eastern North America including New York City, Boston, Newark and Chicago that killed about 1,500 people in August 1896
https://en.wikipedia.org/wiki/1896_Eastern_North_America_heat_wave
In New York City, August 4 through August 13 saw daily high temperatures of at least 90 °F (32 °C) with high humidity and little breeze.[4] The temperature in the city did not drop below 72 °F (22 °C) at night, with three consecutive nights at 80 °F (27 °C) or above. It killed more than the New York City draft riots and the Great Chicago Fire combined.[2] A majority of the deaths were of working-class men in their twenties who performed manual labor.
+++++++++++++
Natural Disasters & Environment
Railway tracks buckled, people slept in parks and hundreds died as the heat and humidity became unbearable.
https://www.history.com/articles/heat-wave-1911-weather-insane
In July 1911, along the East Coast of the United States, temperatures climbed into the 90s and stayed there for days and days, killing 211 people in New York alone.
Total death tolls are estimated to have topped 2000 in just a few weeks.
+++++++++++++
Thousands died and people slept on roofs to cope with the early heat wave, which was supercharged by agricultural practices.
https://www.nytimes.com/2024/06/18/weather/heat-wave-us-history.html
In New York, a high of 106 degrees was recorded in Central Park.
Temperatures hit 100 degrees for 12 straight days in Springfield, Ill., according to the National Weather Service.
++++++++++++
metmike: In 1936, atmospheric CO2 was only 310 parts per million but today, it's at 430 ppm.
++++++++
https://www.life.com/history/heat-wave-photos-1950s/
The summer of 1953 in New York City was torturous. The temperature was in the 90s (or higher) every day between July 15 and 21, and again between Aug. 24 and Sept. 4 a record-setting 12 days in a row. And that’s not even accounting for other 90-plus days in between.
Keep in mind that air-conditioning was far from widespread. Though the technology has been around since the early 20th century, it was then used primarily in movie theaters and other public spaces.
++++++++++++++++++
https://cliffmass.blogspot.com/2016/03/the-golden-rule-of-climate-extremes.html
The GoldenRule
Considering the substantial confusion in the media about this critical issue, let me provide the GOLDENRULE OF CLIMATE EXTREMES. Here it is:
The more extreme a climate or weather record is, the greater the contribution of natural variability.
Or to put it a different way, the larger or more unusual an extreme, the higher proportion of the extreme is due to natural variability.
++++++++++++++++
3pm: 94 degrees on Saturday makes this a 4 day July 2026 heat wave. We still had the down sloping west winds on the lee side of the mountains and dry soils adding 10 degrees today.
Sunday's air mass will come in with north winds, dragging in a cooler air mass that should be around 10 degrees cooler.
On July 4th, Atlantic City tied its all-time record high for any date of 106F! They also had a 105 the day before and 103 two days earlier!
Thanks, Larry!
Atlantic City was at the epi center of the heat wave for sure!
Atlantic City, New Jersey weather averages and records from 1873–2026 based on data made available by the NOAA.
The highest temperature ever recorded in Atlantic City, New Jersey was 106 °F which occurred on July 4, 2026.
https://www.extremeweatherwatch.com/cities/atlantic-city
Atlantic City also hit 106 deg. F in June of 1969!
Let's look at ALL the hottest temperatures for each year in the record books for Atlantic City which tells us much more ABOUT CLIMATE than an extreme weather driven event, with drought and downslope/adiabatic warming on the lee side of the Appalachian mountains.
The graph is the highest temperature of the year for every year in the records, going back 150 years.
See a pattern in the graph below?
I sure do.
Not so much in the peaks at the top, where there is a slight increase but VERY decidedly with the hottest temperature in Summer at the bottom of the chart no longer being at 90 or less and a clear UPTREND from the lows in 1888!!!
The last time the hottest temperature of the Summer was only 90 Deg. F was in 1958.
I counted 13 times, including 1958 when Atlantic City's hottest temperature of the year was 90 or less(86 deg. in 1888 was the coolest). Since then, there's been 0 times.
As an aside, when I think of 1888, I think of this along the East Coast
https://www.history.com/this-day-in-history/march-11/great-blizzard-of-88-hits-east-coast
+++++++++++++++++++
Back to Summer.
Global warming from CO2 is having the greatest impact on night time temps/more record warm lows and not as many record hot days in humid places. However, it's clearly causing more HOT DAYS in Atlantic City above a certain threshold, let's say 90 degrees from this graph below.
https://www.extremeweatherwatch.com/cities/atlantic-city/highest-temperatures-by-year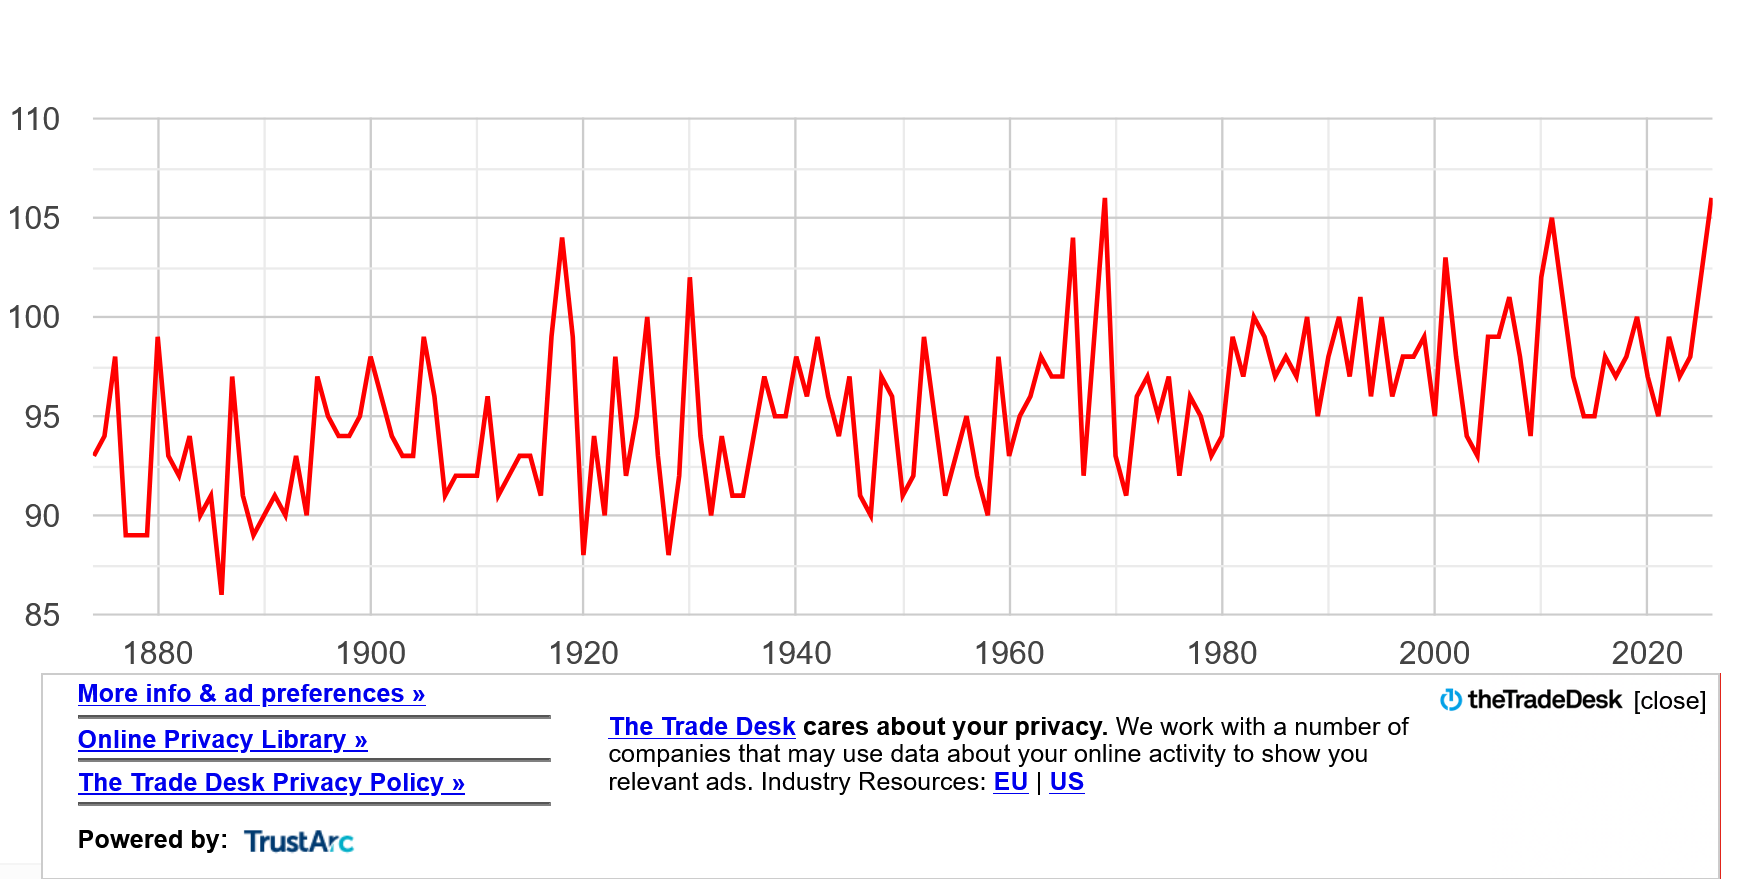
I checked for the Urban Heat Island effect at this location, which is greatly contributing to the heat, especially at night in the urban areas of the United States but Atlantic City appears to be an exception.
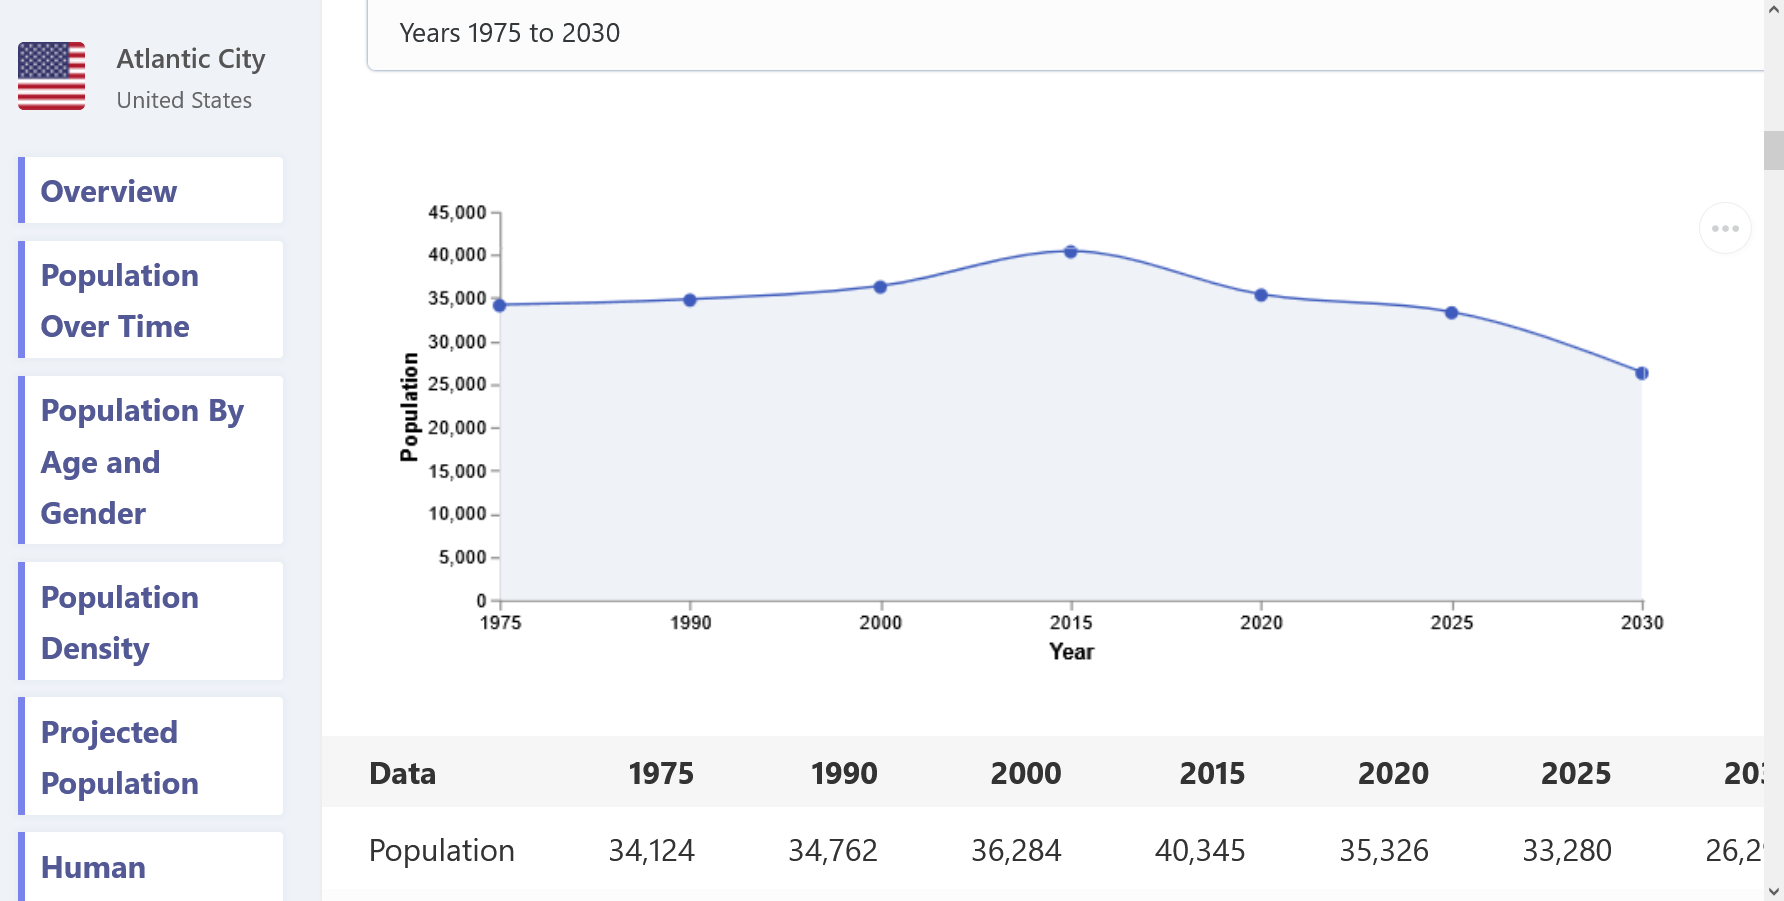
https://www.city-facts.com/atlantic-city/population
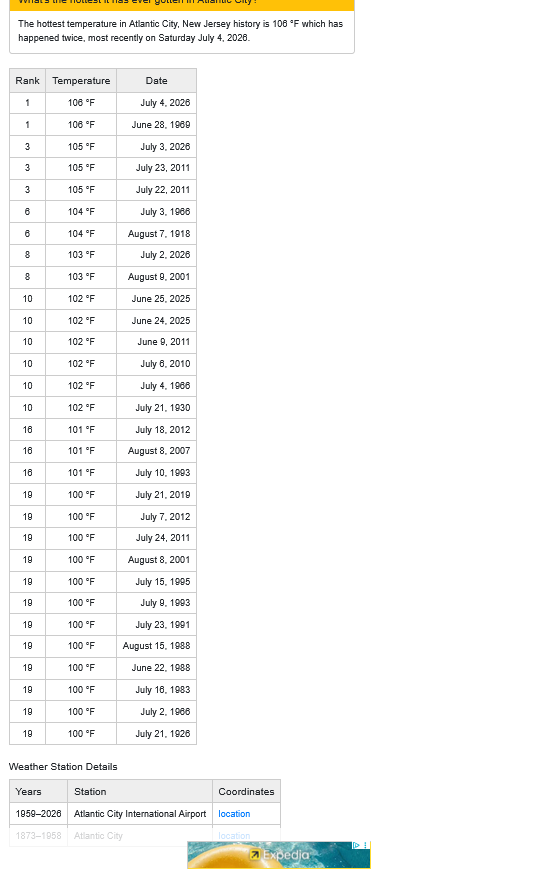
What about the top 20+ hottest daytime highs in Atlantic City? All the times that the temperature has hit 100+. Is there a pattern?
Yes. Recent years have featured more 100+ days which almost never happened before 1960. Interestingly, 1966 featured 3 days at 100+, which ties it with this years 3 days as you mentioned in your last post. Those consecutive days were also July, 2, 3 and 4.
However, 2011 has the most 100+ days. With 2 different heat waves they did it 4 times. The most impressive, 1 day spike above 100 was on June 9, 2011 at 102 Deg F. This was easily the earliest 100+ degree day in history for this location by over 2 weeks!!
Last Summer's late June heat wave did it 2 times.
The last severe widespread droughts in the Summer in the Cornbelt(from La Nina's were 1988 and 2012 and Atlantic City hit 100+ on 2 occasions in both those years.
1993 also hit 100+ on 2 occasions and I actually remember the specific reason for it. That was also the year of the HISTORIC, Great Mississippi River/Midwest flooding. The biggest reason for that was a monster Bermuda High along the East Coast that blocked weather system from moving east. While MO was getting bombarded with record rains, 2 states over, here in Indiana, those rains kept drying up when they hit the wall of rain suppressing, sinking air associated with the Bermuda High!!! No climate change there. Just natural variation in weather patterns that we EXPECT to cause extreme weather.
https://www.extremeweatherwatch.com/cities/atlantic-city/highest-temperatures
For instance, put in this data below:
1993-03
1993-09
https://www.ncei.noaa.gov/access/monitoring/historical-palmers/maps/psi/199303-199310
Monthly maps of drought conditions in the contiguous U.S. as measured by the Palmer Drought Severity Index, Palmer Hydrological Drought Index, Palmer Modified Drought Index, and Palmer Z-Index (Palmer, 1965) are provided for January 1900—May 2026. Animations of any set of monthly maps for any period desired can be viewed by selecting the beginning and ending dates of interest.
red can be viewed by selecting the beginning and ending dates of interest.


Here's a site that goes back to 1948 thru 2011.
Go to this link
https://www.wpc.ncep.noaa.gov/ncepreanal/
For the CURRENT DATE: Put in 1993, 06, 04, 00 To start on Jun 4, 1993 (you can use whatever numbers you want)
For the END DATE: Put in any date later than that so you can advance manually from the current date. Let's say 1993, 12, 31, 00 to go thru the entire year.
This is what you will start with below. Then just hit the + button above the date and move forward thru 1993.
This is June 4, 1993
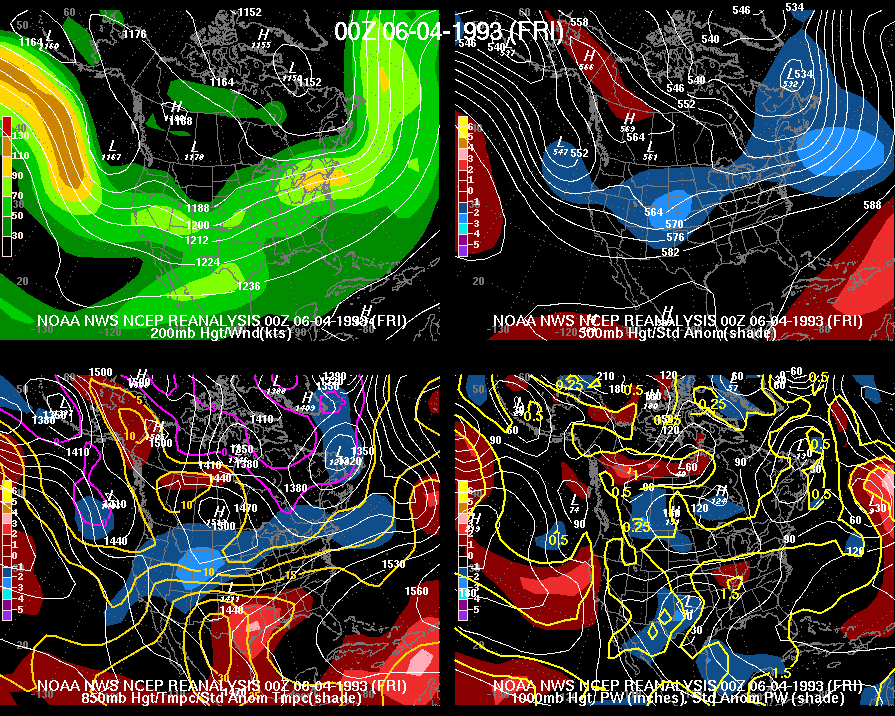
As every farmer remembers, 1993 was the year of the Great Mississippi River/Midwest flooding.
The media has a major problem, using the terms 1 in 100 year flood and absurdly 1 in 1,000 year flood, often for a record smashing LOCAL rain event, the type of which we SEE in XX locations EVERY YEAR but in different locations on the planet. However, the Summer 1993 flooding earned at least the 1 in 500+ year flood characterization.
One problem in making that claim is that our accurate records from instrumentation only go back to the late 1800's. Which is only around 14% of 1,000 years. So we are missing 86% of the data in a 1,000 year period!
++++++++++
This last extreme rain event in Indiana was huge but not really 1 in 1,000 year event!
By metmike - Aug. 16, 2026, 8:34 p.m.
++++++++
Scroll down from this post by cutworm for more details on this extreme, crop damaging rain earlier in August. cutworm lost a ton of his crop from the river overflowing it's banks into the flood plain that he farms on.
By cutworm - Aug. 12, 2026, 6:03 p.m.
++++++++++
Floodplain
https://en.wikipedia.org/wiki/Floodplain
