
Previous thread:
This has been one of our best weather threads with the magnitude of this record warm March exceeding all other months in recent history by a wide margin IN THE UNITED STATES.
Historic SW US March heatwave
48 responses |
Started by WxFollower - March 18, 2026, 12:24 a.m.
https://www.marketforum.com/forum/topic/118783/
++++++++++++++++++++
https://www.aol.com/articles/record-smashing-heat-wave-europe-100107925.html
More than 40 people reportedly have died in Europe as a heat wave triggers sweltering conditions across the region.
"It's not something to be taken lightly, going swimming in unsupervised areas during a heat wave," Sports and Youth Minister Marina Ferrari told French radio.
Very impressive heat wave!
However, I have a huge problem with 40 people dying from drowning all being attributed to the excessive heat. Supposedly, they were only in the water to cool off. So nobody swims in June in Europe anymore unless it's during a severe heat wave????
Granted, a lot of them were trying to cool off from the heat but some of them were not and none of them died from heat stroke or heat exhaustion. THEY DIED FROM DROWNING!!!!
During a heat wave, If I die in a car accident on my way to the store to buy an air conditioner, or on my way to buy extra bottled water is that a heat related death? There's no limit on how we can include heat deaths from indirect causes.
Extreme heat wave deaths should be limited to those people that die from direct exposure to the heat!!!
https://ysph.yale.edu/news-article/warming-us-climate-linked-to-rising-deaths-from-heat/
In a new study, YSPH researchers found that while cold weather continues to be a leading contributor to U.S. deaths annually, deaths linked to heat exposure surged more than 50% over the past two decades. Cold-related deaths rose from about 44,000 between 2000 and 2009 to more than 47,500 between 2010 and 2020, a 7% increase. Meanwhile, deaths associated with high temperatures climbed by 53%, from an annual average of 2,670 between 2000 and 2009 to more than 4,000 between 2010 and 2020.
“These findings underscore that extreme temperatures are significant threats to human health,” said Dr. Kai Chen, PhD, senior author of the study and associate professor of epidemiology (environmental health sciences) at YSPH. “Cold remains a dominant risk, yet heat is becoming increasingly dangerous as extreme heat events grow more frequent and intense.”
+++++++++++
OK, let's introduce authentic science and honest facts to bust some of this.
1. 47,400 died from cold but only 4,000 died from heat. So more than 12 times as many people died from cold!
2. How do cold deaths go UP on a warming planet, that features the Winters warming the most???? It happens when they ADJUST THE CRITERIA. Note on the previous page, almost all the heat deaths in Europe are not from exposure to the heat but because they included people swimming that drowned during the heat wave. Drowning deaths will soar higher because of the heat wave but only 2 children died so far from heat exhaustion and parental neglect.
3. Is this intentional? You bet it is!!!!
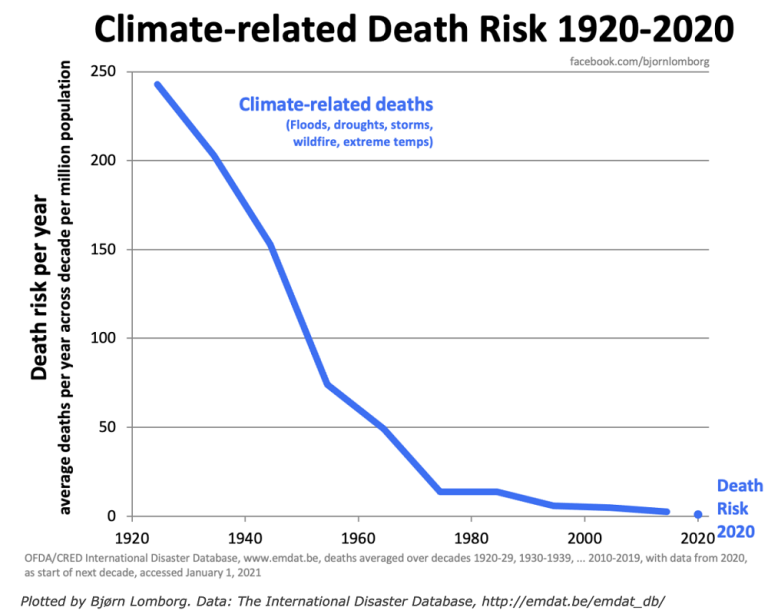
Here's an inconvenient truth:
++++++++++++++++
The Lancet on Climate Change: The need for context
Indur M. Goklany
https://www.thegwpf.org/content/uploads/2020/05/LancetCountdown-1.pdf
metmike: This graph shows us data from this extensive study. Climate related deaths and non climate related deaths from 1990 to 2017. There are 2 main things to note:
1. Climate related deaths are a small fraction of non climate related deaths.
2. Climate related deaths have dropped 50% over the last 3 decades.
If you also dial in the massive increase in food from atmospheric fertilization from beneficial CO2 and the continuation of the slow beneficial warming on this greening planet, you clearly have a climate OPTIMUM not a crisis.
This is the empirical data that defines the authentic science. Anybody that says something different is either ignorant of the authentic science or deceiving ......that includes any brilliant scientists with numerous degrees.
.png)
Let's actually look at this extreme WEATHER ANOMALY in perspective and use meteorologist/science to explain it.
This was the latest map for the Northern Hemisphere from the last 0z GEFS model run.
1. 850 mb temp anomalies.
2. 850 mb temp standard deviation.
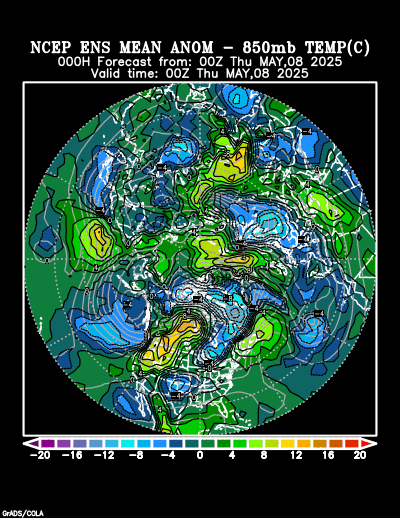
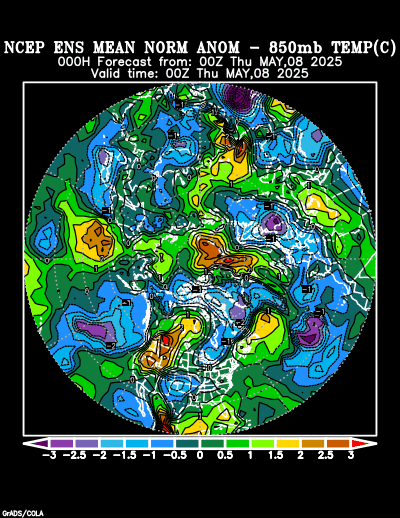
We should note that planet earth is dominated by much larger areas of above average(hot) and below average (cool) than it is average. Just like it is in any one place, the temperature is RARELY AT THE AVERAGE in any place or region.
Most of the time, it's either above or below(sometimes extreme) and when we divide that total by 2, we get an average that does NOT represent the actual weather patterns.
Sometimes that features extremes which are totally expected and have always happened. When extreme cold waves hit in the Winter, they will be brutal. When extreme heat waves hit in the Summer, they will be brutal.
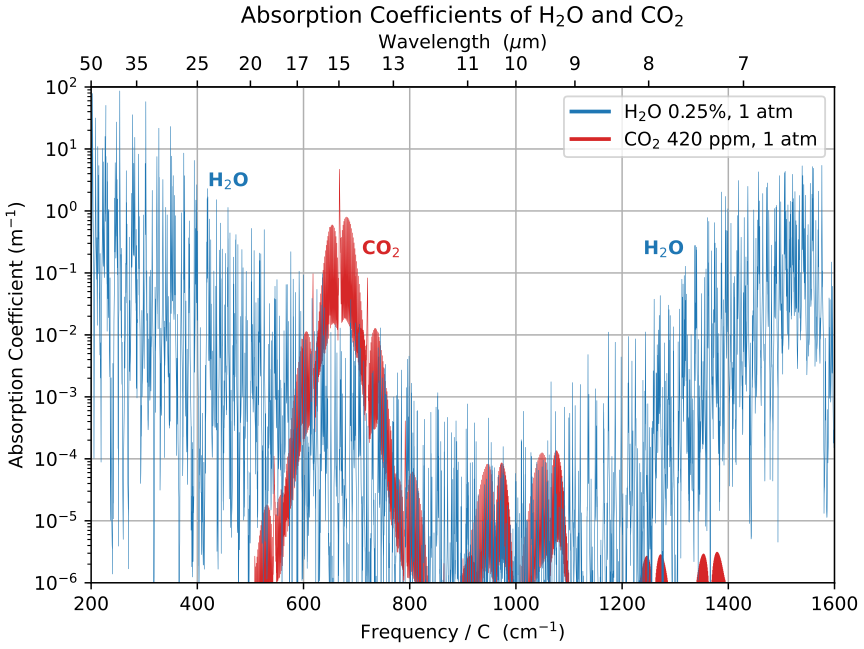
How much hotter are heat waves in the Summer because of global warming? Likely 1 to 2 degrees hotter by more than that in the coldest/driest places because the radiation absorption bands for CO2 overlap with the radiation bands for H2O.
++++++++++++++++++++++++++++
It really boils down to this, once again(Cliff Mass can be counted on as an elite source for using objective, authentic science)
https://cliffmass.blogspot.com/2016/03/the-golden-rule-of-climate-extremes.html
The GoldenRule
Considering the substantial confusion in the media about this critical issue, let me provide the GOLDENRULE OF CLIMATE EXTREMES. Here it is:
The more extreme a climate or weather record is, the greater the contribution of natural variability.
Or to put it a different way, the larger or more unusual an extreme, the higher proportion of the extreme is due to natural variability.
Turns out that warm, humid places, with tons of H2O have caused many of the CO2 radiation bands to be saturated already and adding more CO2 can't warm those places much.
However, the vast, VAST majority of people, including some climate scientists don't COMMUNICATE accurately what is really going on with the actual warming.
The pattern below shows that its the very high latitudes of the Northern Hemisphere that are being warmed the most by a wide margin. (the coldest places in the coldest times of year).
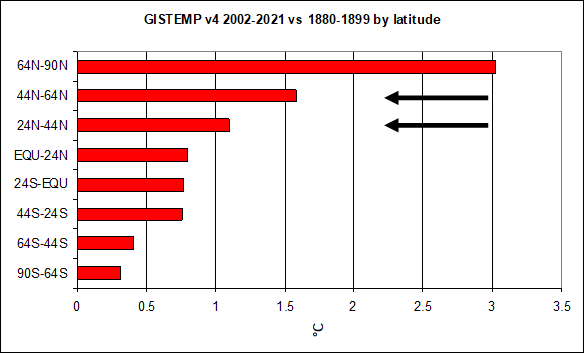
This is what the temperature changes/anomalies look like from global warming the past 140 years. Highest latitudes warming the most because the cold, DRY air doesn't have much H2O to saturate the radiation absorption bands compared to the warm, humid areas, where those absorption bands are nearly saturated from H2O which overlaps with the CO2 absorption bands.
https://www.youtube.com/watch?v=haBG2IIbwbA

A huge part of this is:
1. The Southern Hemisphere is more water/ocean that takes longer to warm than land.
2. There are MANY more high population centers that are causing heat islands that are releasing "waste heat" in the mid latitudes of the Northern Hemisphere.
3. Now the big one. Many of the radiation absorption bands for CO2 OVERLAP with H2O. H2O is 95% of the planet's greenhouse gas effect(we would be a frozen wasteland without the BENEFICIAL greenhouse effect). Turns out that in areas with higher dew points, those overlapping absorption bands ARE ALREADY SATURATED by H2O!! In those cases and in those bands, it doesn't matter how much CO2 that you add. When they are already absorbing 100% of the long wave, heat radiation of what they are capable of because of water vapor/H2O, adding CO2 in those bands will have near 0 impact.
4. Now the kicker. Cold places lack water vapor in the dry air so CO2 will be impacting bands that are NOT saturated from H2O absorbing. We can see that on the graph above. However, DESERTS also lack water vapor, so they too are seeing a greater impact from CO2 than the rest of the planet at the same latitude. Even DESERTS located in already hot places, like Phoenix.
5. Turns out that DESERTS are warming at a similar, elevated rated to the Arctic.
6. The impact of increasing CO2 on temperature is also LOGARITHMIC. The more that you add, the less the impact.
++++++++++++++++++++++++++=
Why the Forcing from Carbon Dioxide Scales as the Logarithm of Its Concentration
https://romps.berkeley.edu/papers/pubdata/2020/logarithmic/20logarithmic.pdf
The radiation absorption bands of CO2 are almost saturated in the warm/humid areas of the planet because they overlap with the H2O absorption bands. This is why the warming has mostly been in the higher latitudes(and DESERTS).
https://commons.wikimedia.org/wiki/File:Longwave_Absorption_Coefficients_of_H2O_and_CO2.svg
This was a post of mine, commenting on the incredible, historical March heat wave in the southwest US:
So we are dealing with the same planet, same atmosphere, same weather systems, same laws of physics but with X amount of warming superimposed on it.
This is what that means.
1. Weather is still dominated by natural variability and this particular extreme would have happened with the old climate 100 years ago.
2. However, the planet IS warmer almost everywhere at variable rates. Some places, like in the US Cornbelt during the growing season the high temperature records have dropped because of the extremely high water vapor added by tightly packed rows of corn. This is an exception but CO2 warming is minimal at those times with really high dew points. Photosynthesis also,converts photons of powerful short wave radiation and kinetic enrgy(heat) into stored, potential chemical energy in the plants, as well as sequestering carbon that it extracts out of the CO2, releasing O2 as a waste product. It’s a miracle of nature and why CO2 is a massive beneficial gas to double the current amount which would be the OPTIMAL level for most life on this rapidly greening planet.
3. Deserts are seeing the complete opposite from having extremely LOW water vapor. Add that to the fact that dry air heats faster than moist air and we may be seeing as much or even more heating in the deserts as we have in the Arctic at certain times.
4. This current extreme weather pattern was NOT caused by climate change/global warming. However climate change with 100% confidence contributed to a good part of the extreme magnitude of the record highs. This is indisputable using the laws of atmospheric physics with the higher CO2 in this very dry location.
ADDED: 5. We can use authentic, empirical data below to estimate with confidence how much hotter it is with this current heat wave in this location(because of the greatly amplified greenhouse gas effect in the bone dry air) by looking at the graph below. THIS AUTHENTIC SCIENCE! Looking at the graph for March and the actual trendline going from ~73 to ~79, I feel confident in stating that we are 6 Deg. F hotter than 100+ years ago at this location. Granted, we were recovering from the natural Little Ice Age and there has been some local heat island effect adding to the greenhouse effect but the VAST, VAST majority is from the increase of CO2 in this very dry air. So attributing 5 deg. F of this heat wave to the added CO2 should be a very liberal assessment to assign ALL the impact from the added CO2.
6. The rest of the planet is heating up at less than half this rate and the majority of the heating is during the cold weather seasons when the AIR IS DRY. Warm, humid times of year are NOT seeing as much heating. Mainstream science, instead of telling us that and explaining the authentic science, uses this heat wave as an example to apply to the entire planet.
7. We know how biased they are in doing this, not just from the lack of explaining the authentic science of very dry(cold) air having greatly amplified heating which could just be ignorance but they intentionally leave out the massive benefits CO2 which is greening up the planet, the complete opposite of killing it with a FAKE climate crisis. This would be like reporting on the use of automobiles since they replaced horses 150 years ago by only telling us about how many people get killed in car accidents every year and leaving out ALL the benefits that automobiles have gifted the human race with the past century+. Automobiles should be banned because they kill 40,000 people every year!!!
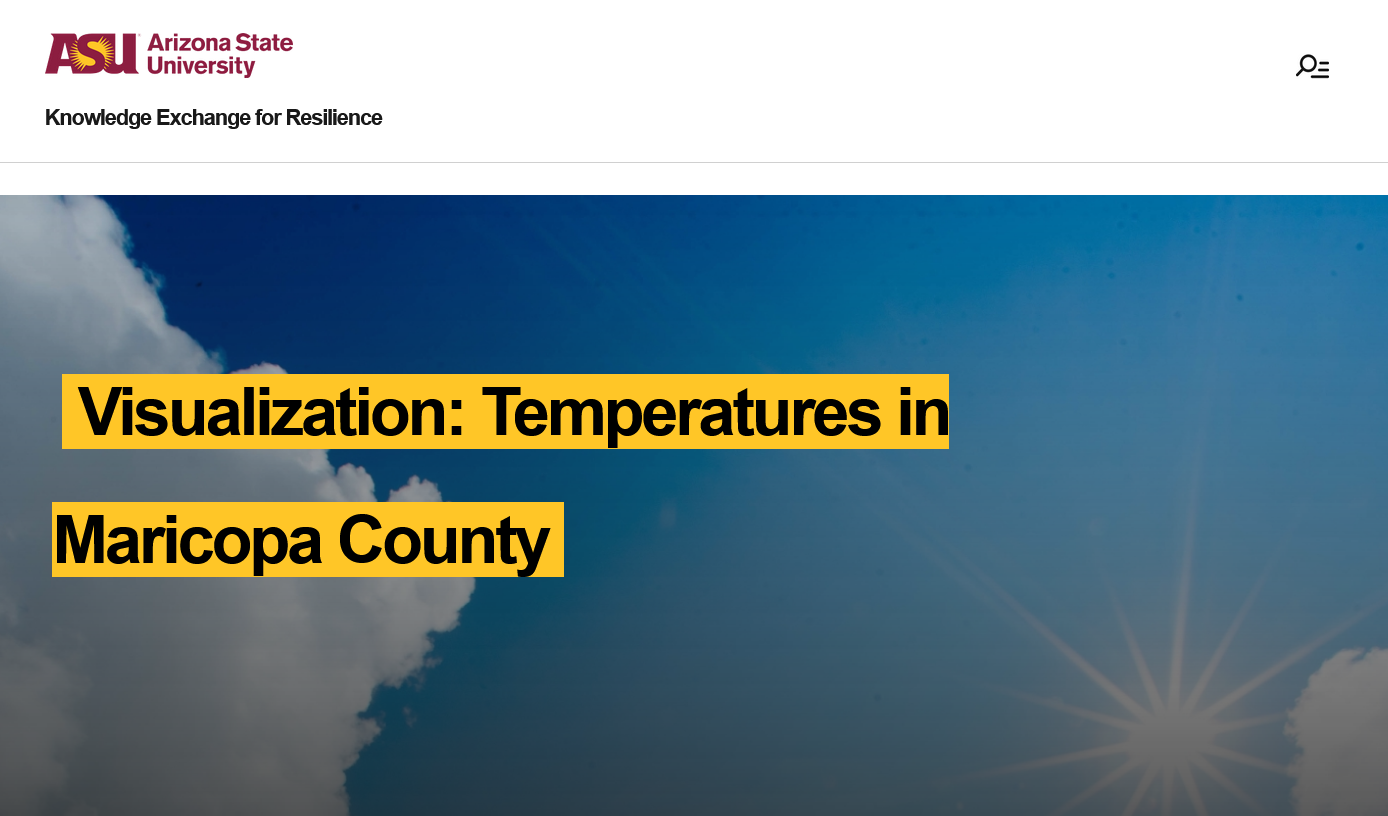
https://resilience.asu.edu/temperature
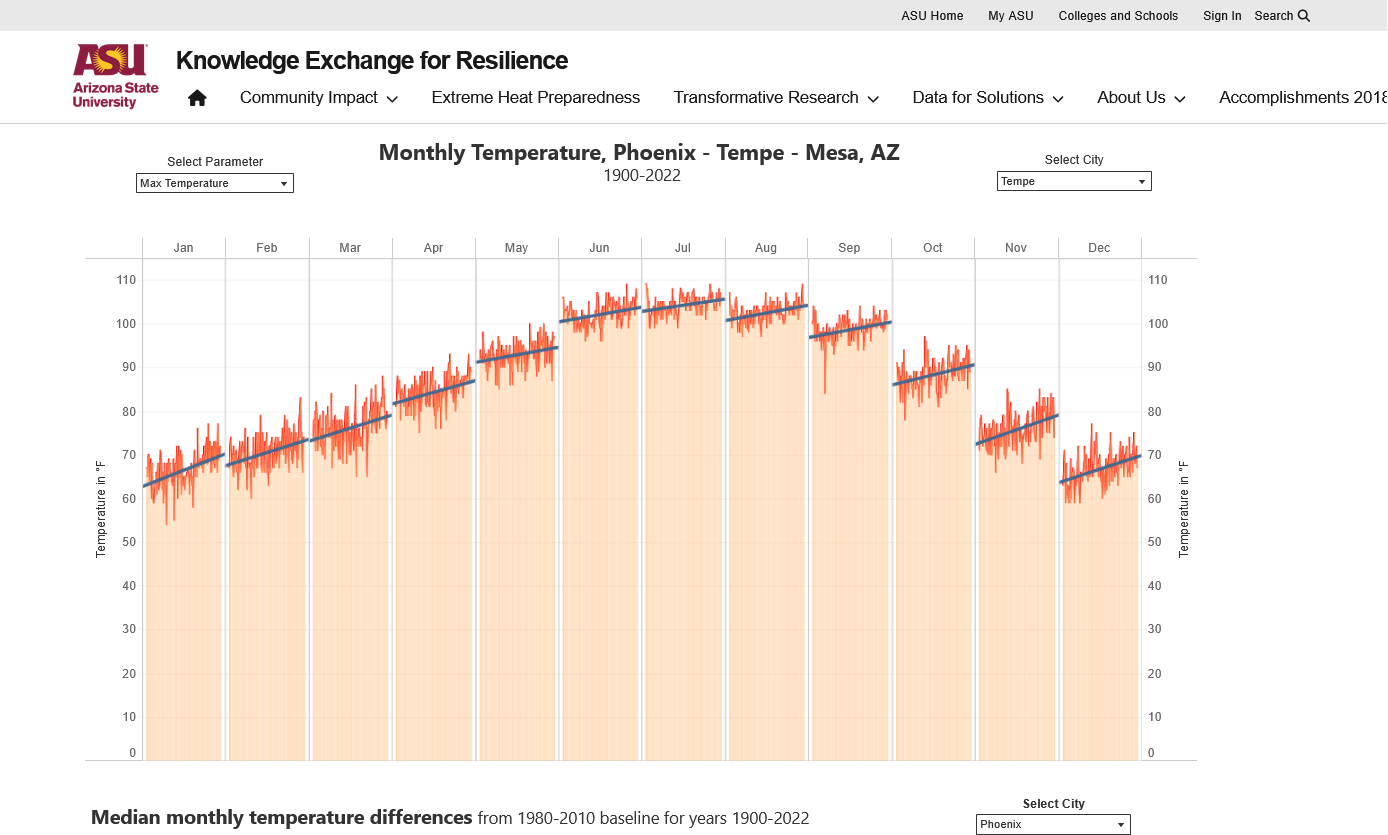
https://en.wikipedia.org/wiki/Carbon_dioxide#See_also
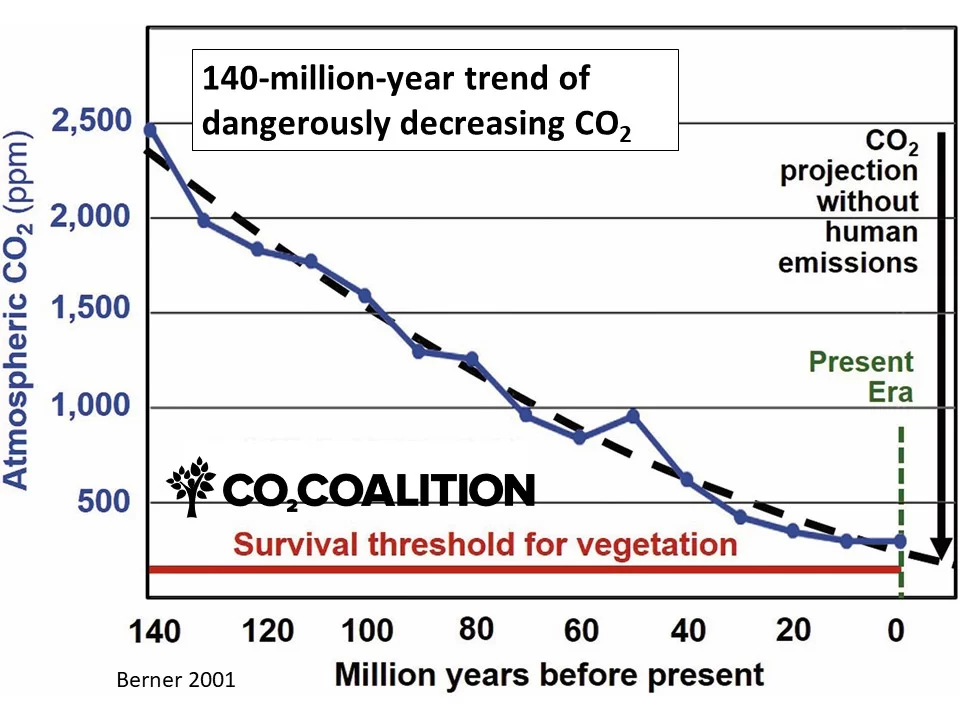
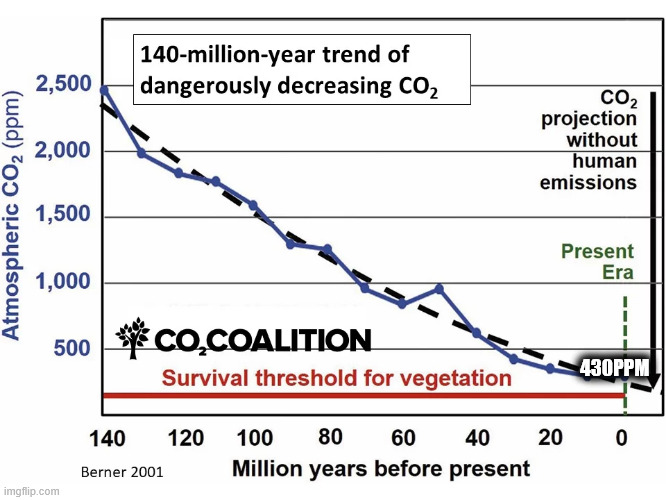
Optimal level for life is 900 parts per million. Current level is 430 parts per million.
+++++++++++
https://en.wikipedia.org/wiki/Water
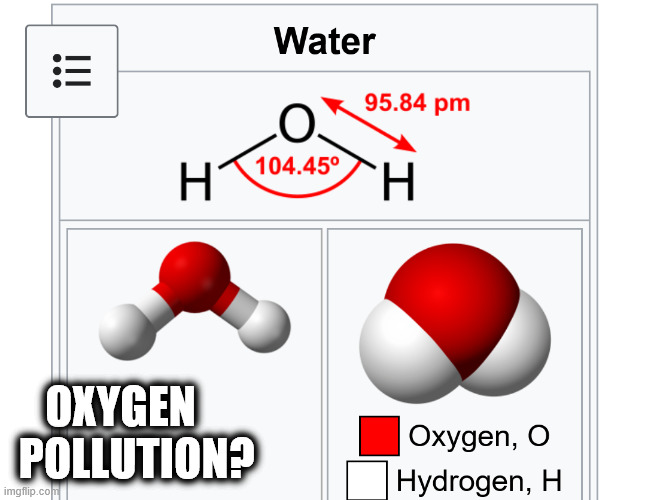
Optimal for life but using the junk science climate crisis, molecular definition means that we should STOP DRINKING WATER???
+++++++++++++++++=
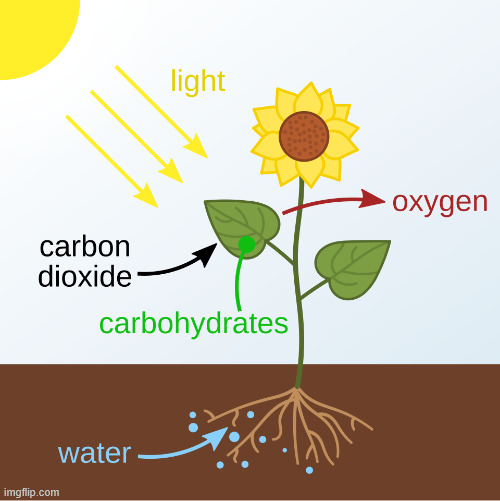
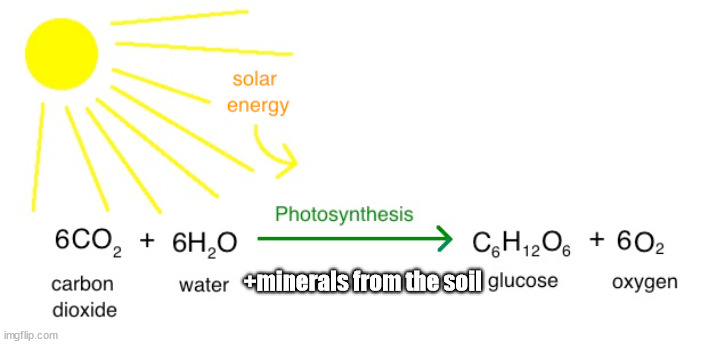
++++++++++++++++++++
https://en.wikipedia.org/wiki/List_of_compounds_with_carbon_number_1
Despite global warming increasing the average temperature of the planet by almost 2 degrees(mostly the higher latitudes of the Northern Hemisphere) the hottest(driest) Summer in the center of the United States, by a very wide margin was 1936. (The West, because there's less H2O in the air has more of a greenhouse gas effect from the increase in CO2).
The length of time, lasting 3+ months and the massive geographical location blows all other heat waves away. Happening during the hottest time of year made it especially devastating.
And worst of all is that this is the most productive agricultural region on the planet. Record heat in a desert, like Arizona where not much grows in March is a bad thing. Record heat and record dry where we grow crops DURING THE ENTIRE GROWING SEASON is a bad thing X 100!
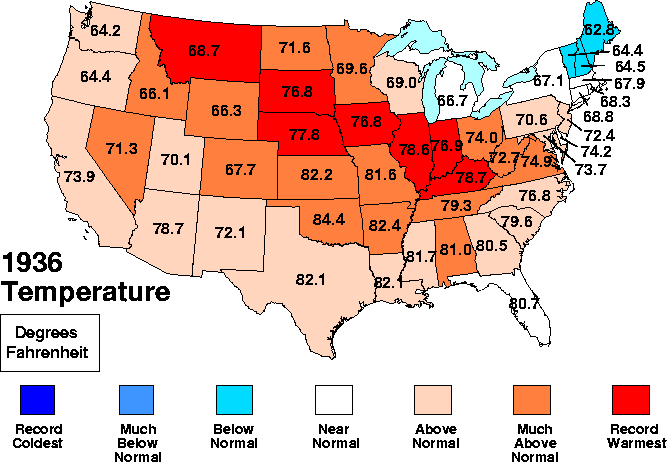
Summer (June–August) 1936 average temperature, in degrees Fahrenheit. Record warmest and coldest is based on a 112-year period of records (1895–2006)
++++++++++++++++

Summer (June–August) 1936 precipitation, in inches. Record wettest and driest is based on a 112-year period of records (from 1895 until 2006).
+++++++++++++++
https://wattsupwiththat.com/2026/04/03/us-heatwaves-much-worse-in-past/


Global warming is adding around 7% more moisture to air masses that are 1 Deg. C(1.8 Deg. F) compared to a century ago.
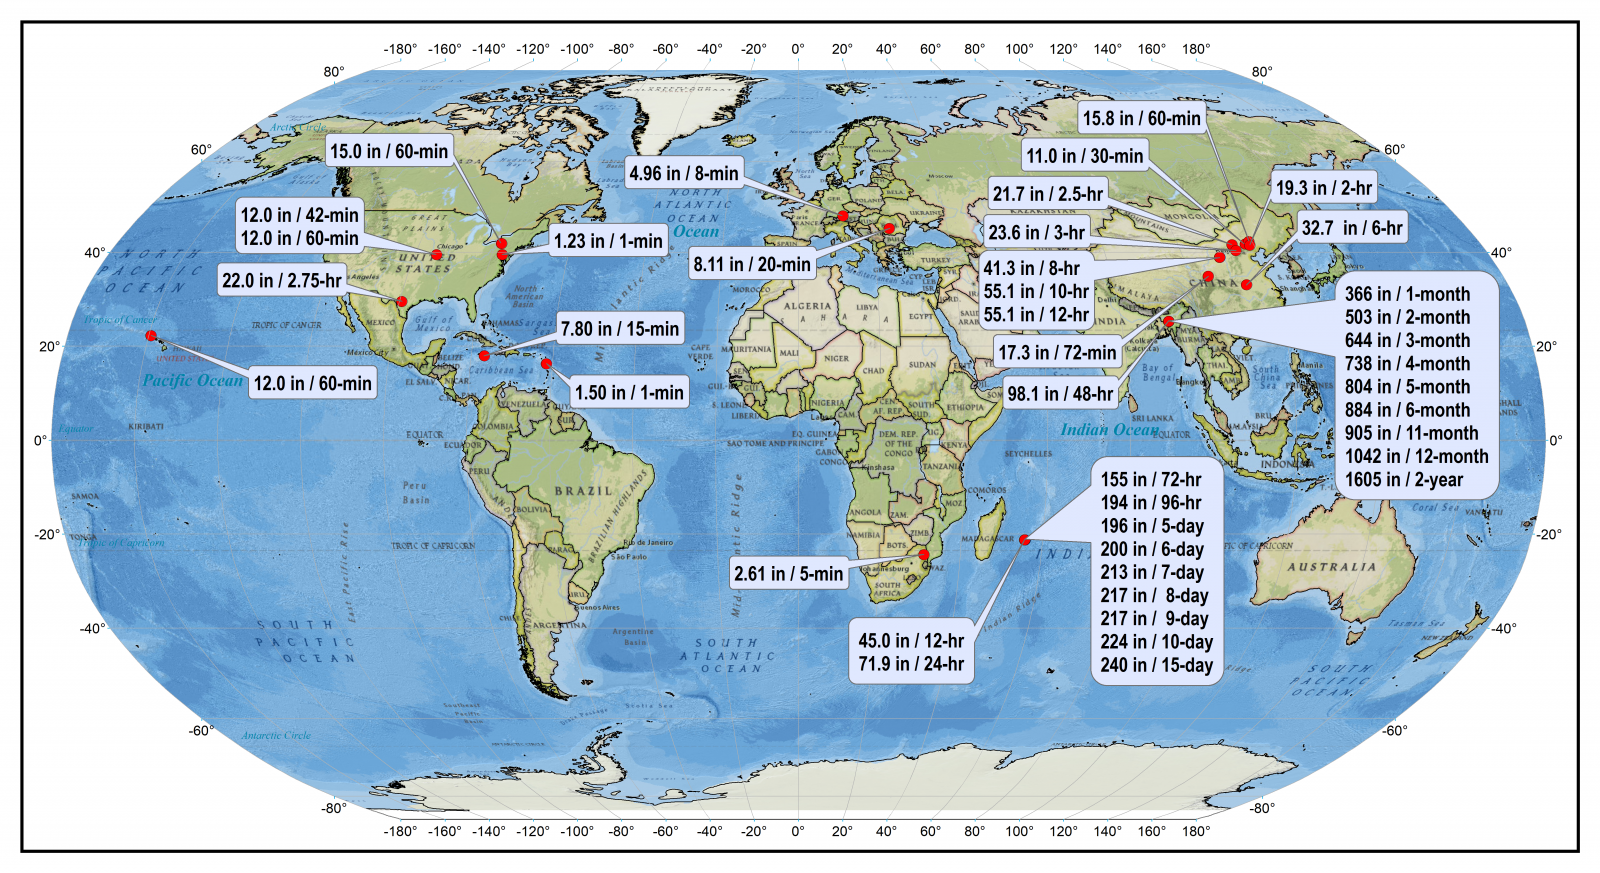
However, note this extensive map of rainfall records and the specific list below it that includes the year of the records.
Almost all the records were set during the OLD climate!!
https://www.weather.gov/owp/hdsc_world_record
The only good thing about heat waves in the West (and enhanced greenhouse gas warming because of the dry air) is this:
What's interesting about the heat index in desert and very dry climates is that the extremely LOW humidity/dew point makes it feel COOLER.(LESS HOT REALLY)!
So the Heat Index/feels like temperature is LOWER.
https://www.noaa.gov/sites/default/files/2022-05/heatindex_chart_dp.pdf
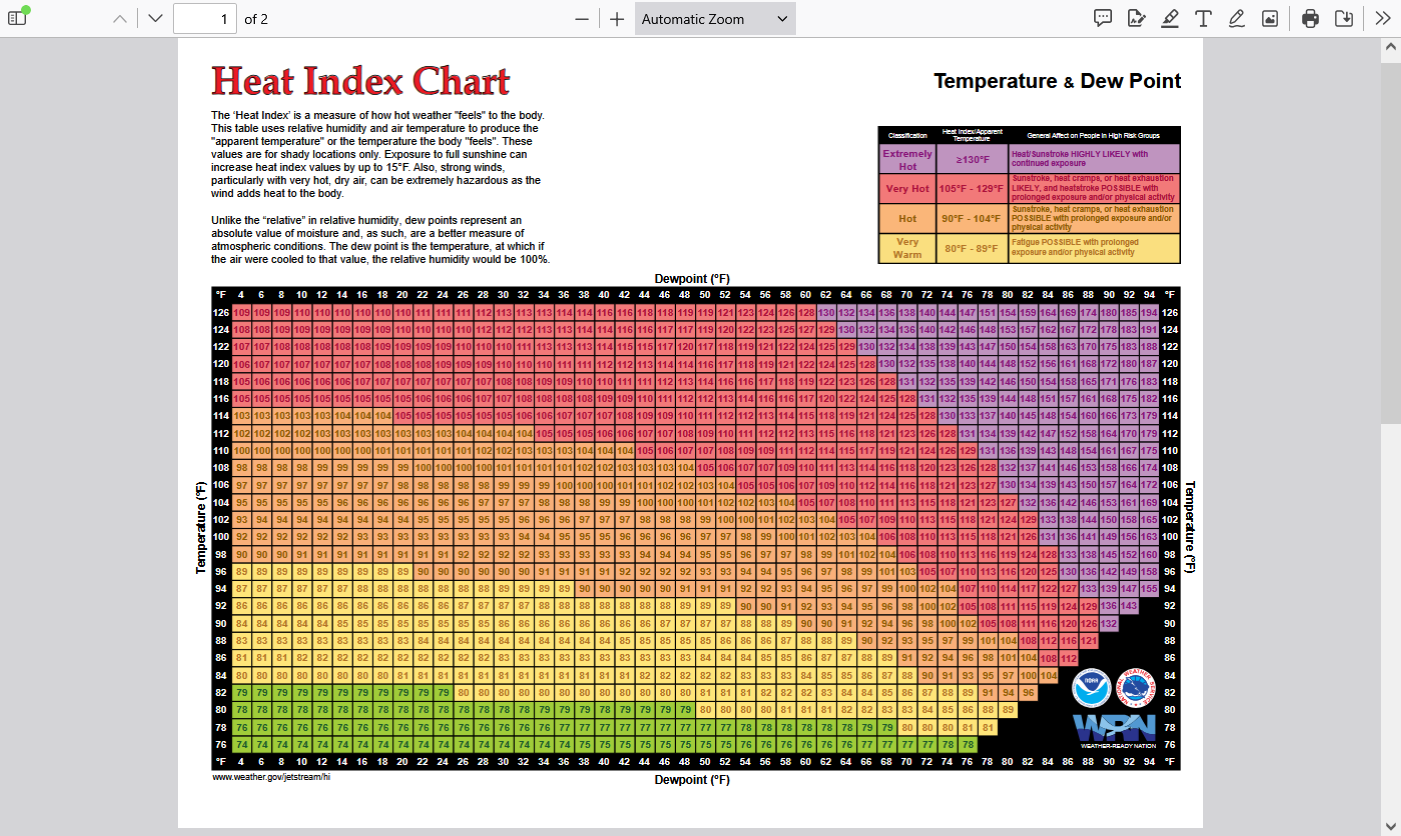
For instance the temperature at this location near Phoenix was an incredible 100 degrees in March with a dew point of 20 degrees in the bone dry air. This resulted in a Heat Index of 94 degrees?
https://forecast.weather.gov/MapClick.php?x=211&y=190&site=psr&zmx=&zmy=&map_x=211&map_y=190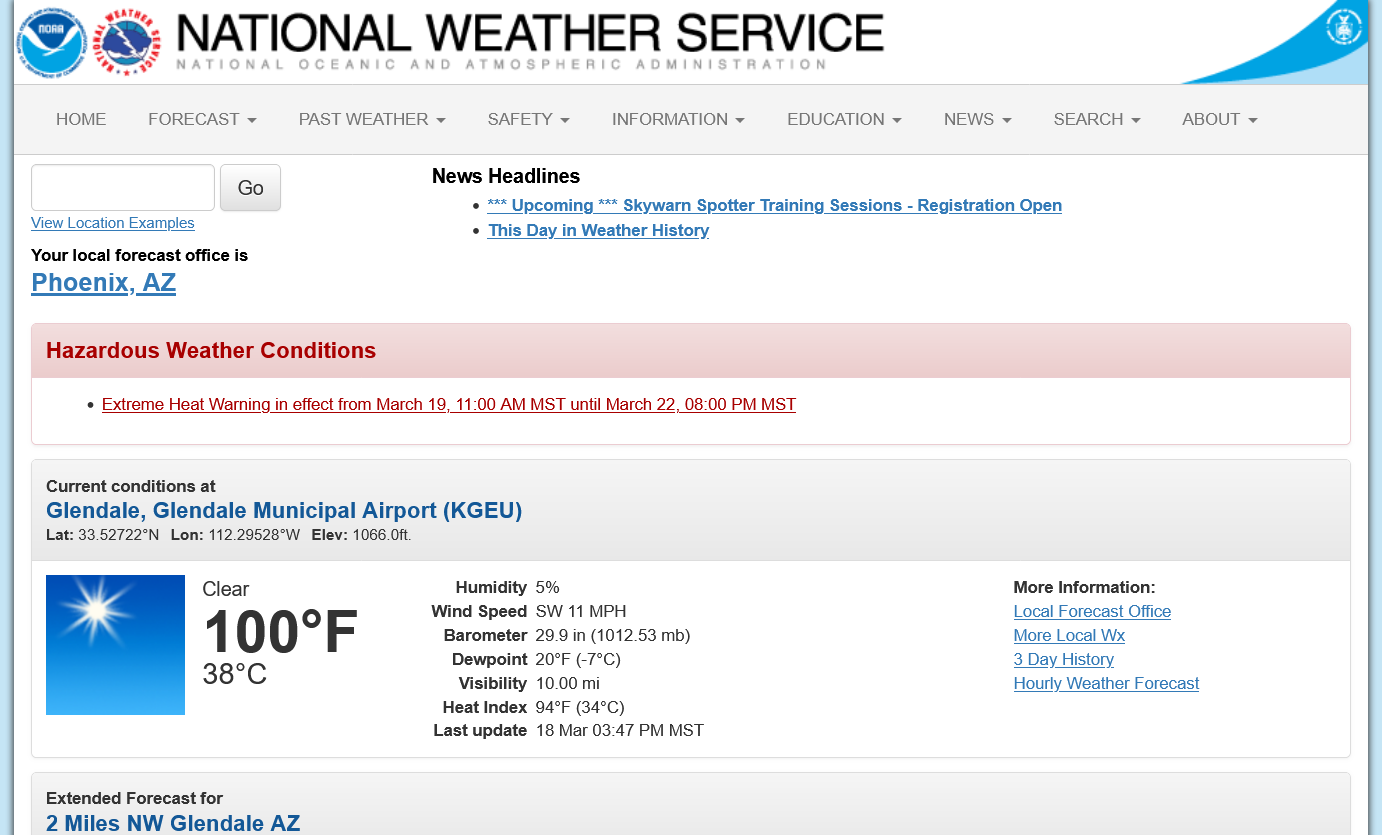
The accelerated evaporation of sweat(a cooling process) in the extremely dry air causes this.
Humid air has much less room for additional water vapor so it results in less evaporation and less cooling.
http://hyperphysics.phy-astr.gsu.edu/hbase/thermo/sweat.html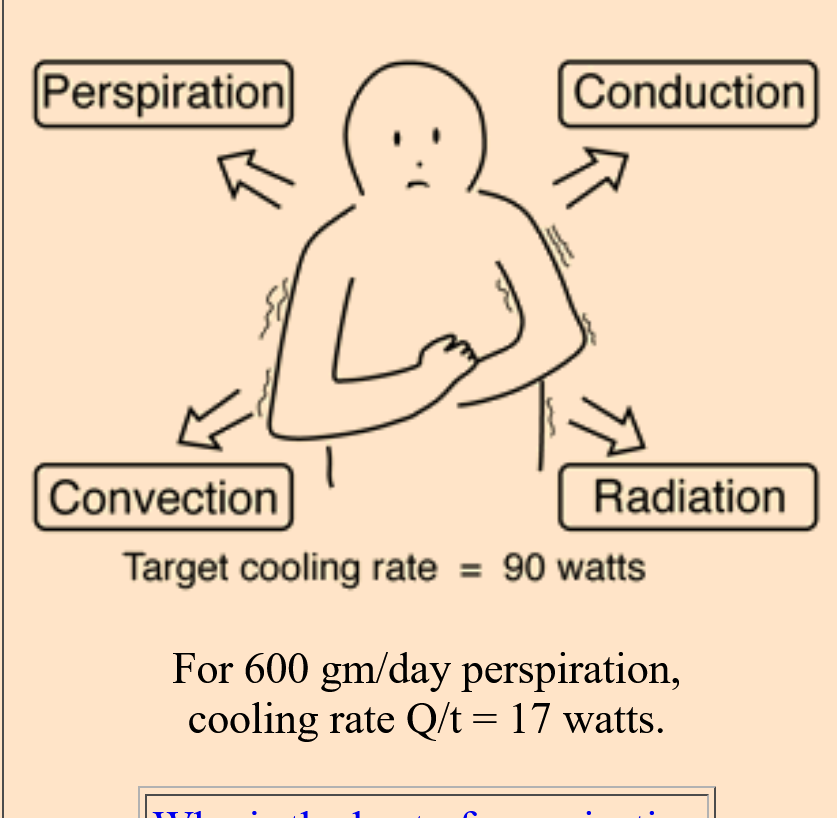
+++++++++++
Of course the HIGHER dew points in the Midwest make it feel hotter than the actual temperature, even though extreme daytime temperatures have dropped because of climate change.
Added: That more humid air as well as the greenhouse effect from increasing CO2 is also a huge factor in the most records of all being record warm nights!
The biggest problem that we have is one side telling us ONLY about the bad things from the increase in beneficial CO2. As if there isn't anything good about a beneficial gas, at only half the optimal level for life going up.
Like.............25% more food thanks to atmospheric fertilization of crops and 25% more greening of the planet which is providing more food for ALL the creatures on this planet isn't worth mentioning.
Instead, LIE about climate change and tell us that models are predicting smaller crop yields from heat and/or droughts. WRONG!
Programming models with bad equations to simulate, impossibly extreme scenarios out to 2100 is NOT authentic science.
Taking observations of empirical data of the REAL world is.
The verdict was in decades ago. The increase in beneficial CO2 has at least an order of magnitude more benefits to life than negatives. When it was bit warmer than this between 9,000 to 6,000 years ago, it was called the Holocene climate OPTIMUM ...........and that was without the massive increase in CO2.
So this current age is a climate OPTIMUM on CO2 steroids for almost all the life on this planet.
Is it slightly worse if you live in a desert? Yes, but what did we expect in a desert???
Is it slightly worse if you live along a coastline? Yes, but what did people that developed along a coast and in hurricane alley expect?
Is it massively better in many places, especially the extra CO2 in the US Cornbelt where we actually grow crops EVERY year and where weather matters the most by a Grand Canyon wide margin?
Yes and that crushes the negative of more heat waves in deserts where people who moved there, did it because they ACCEPTED HEAT and expected it to be a desert not a place to grow crops.
This is 2026 not 1926 with adaptation in the especially hot places. Cold still kills 10 times more humans than heat on this planet every year (used to be 20 times until climate change made it better) and 200 times more life with climate change making that better.
During the Summer, we will be bombarded by stories about how climate change is making heat waves worse(not so in the Midwest) but during the Winter, when the temperature drops to 0, we don't ever read stories about how it would be EVEN COLDER without climate change. That NEVER happens.
In fact, they will often try to convince us that the extreme cold was caused by climate change.
The point is that all the media stories tell us about the bad things only, that includes greatly exaggerating them and using JUNK science to convince people that the current climate OPTIMUM is actually a climate CRISIS.
The main thing that I want is to use empirical data/facts/principles to educate people with authentic science that gives people the objective, comprehensive picture in an honest form.
DeathbyGREENING!
52 responses |
Started bymetmike - May 11, 2021, 2:31 p.m.
https://www.marketforum.com/forum/topic/69258/
++++++++
Here's another recent discussion:
CO2 Finally Exonerated!!
33 responses |
Started by metmike - March 2, 2025, 8:56 p.m.
Indeed, conflating a warning about water safety with statistics on damage from a heat wave is pretty bad reporting.
It will be quite a while before real estimates of the damage to health & property get calculated. The first big heat waves in Europe this century, the ones with over 10,000 deaths, caught countries unprepared. People do tend to adapt, so that even worse heat will probably do less killing.
It will probably be months before things get totted up. And it will be far above 50 deaths, but most likely far less than previous disasters.
One thing that is being reported is construction workers being given frequent breaks and as much cooling as possible. It calls to mind Texas House Bill 217, which forbids local governments from regulating heat exposure.
https://www.smqlaw.com/workers-rights-in-the-texas-heat/
the heat wave and drought in France and Spain had grain prices on the Paris exchange rising.
I follow Spanish weather through the eyes of the olives. Spain produces more olive oil than the rest of Europe combined, and the crop was just recovering from a 2 year drought. This could be horrible!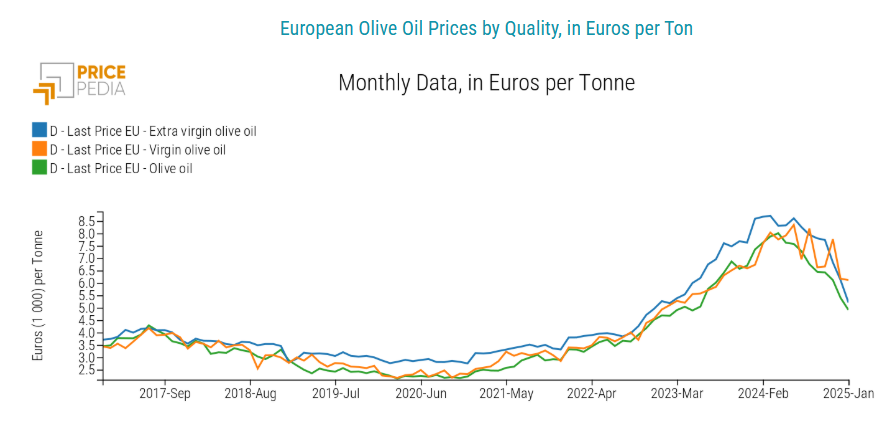
Good posts!
Although US heat related deaths are rising and should continue to rise from GW, it’s true that far more people have died from cold than from heat (>10:1) as Mike said based on the Yale approved study, and thus GW should in theory result in a net of fewer cold/heat related deaths there for a good while into the future. And this isn’t even taking into account any increases in food supply attributed to longer growing seasons and increased CO2 fertilization effect as Mike also noted. So, CC clearly has some benefits regardless of the often emphasized harms that include rising sea levels, increased extreme flooding incidences, and more powerful tropical cyclone peaks/heavier rainfall from warmer temps holding more moisture and slower moving (on avg) TCs.
Does/will CC lead to more benefits than harm like Mike insists? That depends on whom you ask as there are many different perspectives as well as biases. For example, AGW alarmists see only the bad effects and believe the worst case scenarios. OTOH, AGW deniers like Joe Bastardi don’t even acknowledge AGW!
I don’t think it’s black and white. For example, I as a near coastal resident put more emphasis on past and progged sea rises as well as increased TC related rainfall/peak wind potential than many far from the coast since I see the direct effects close-up. The frequency of significant to major coastal flooding events nearby has increased greatly. This is both with tropical cyclones and without them including King tides on sunny days. Charleston, SC, is a great example of this. I see soooo many coastal flood advisories for there nowadays! It wasn’t anything like that in the past. However, I also acknowledge that a portion of this there and at places like Louisiana and even Manhattan is caused by sinking land.
All 3 of these posts are awesome and demonstrate that the impacts of the global warming are tied to the "eyes of the beholder"
patrick recently showed us authentic data from the sea level increase in the Boston area which is exceeding most places and causing SERIOUS PROBLEMS. WxFollower has clearly demonstrated that hurricane threats are higher for coastal cities in hurricane alley(from both flooding and rapid strengthening of hurricanes from warmer water). cutworm pointed out that regional grain prices have spiked higher in June 2026 because of this huge heat wave in Europe.
In this age of technology, where extremes and their impacts are known instantly around the planet and become headline news for X amount of time, regardless of the .0X% of the planet they represent and rarely putting these weather extremes into perspective.
Bad news and disasters sell. Benefits from global warming don't.
We have been brainwashed to think that 150+ years ago, when CO2 levels were 140 parts per million lower(more like ~290 ppm compared to the current ~430 ppm) and the global temperature was 2 degrees cooler, that this defined the PERFECT climate and any deviation warmer than that because of humans burning fossil fuels that emit (beneficial) CO2 that they call "climate pollution" (Al Gore, for instance constantly insists that we are using the atmosphere as a sewer because of the CO2 emissions) is a CLIMATE CRISIS!
1. The optimal level of CO2 for life on this planet is 900 ppm, more than double the current ambient atmospheric level of CO2. If all life forms/creatures on planet earth could vote for the CO2 level for them to thrive, the VAST majority would vote for MUCH MORE.
2. Meet my friend, Mr. Authentic (weather/climate)Data that can take us back to the PREVIOUS CLIMATE. The one that we are supposed to think was the perfect climate before humans messed it up with CO2 emissions from burning fossils fuels. The 1800s!
Re: Re: Re: Re: Re: Death by GREENING!
By metmike - Feb. 2, 2025, 7:54 a.m.
Here in 2026, we are living in a climate optimum with absolute, scientific certainty!!
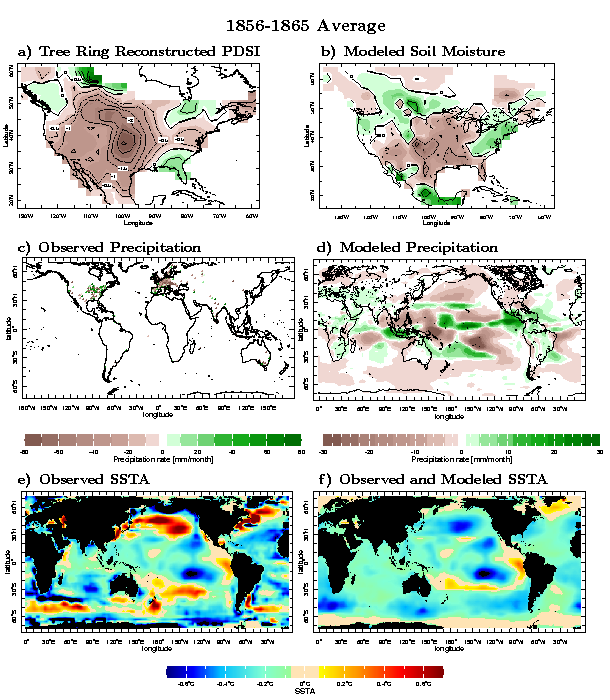
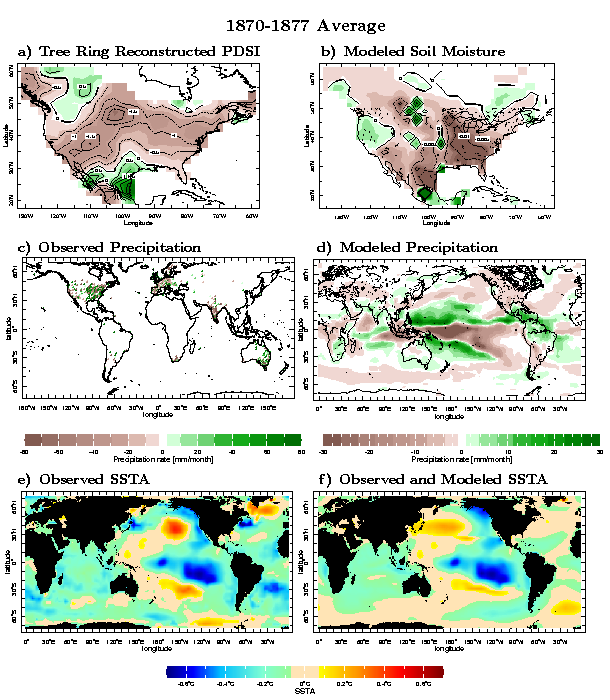
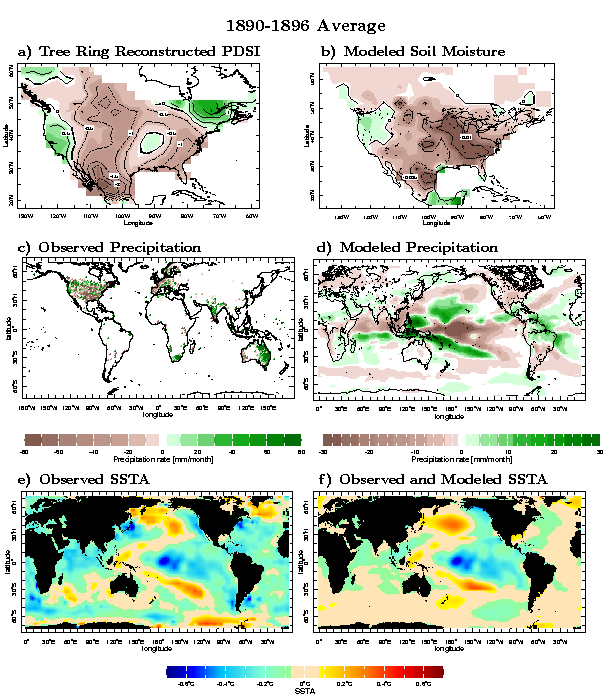
Causes and consequences of nineteenth century droughts in North America
https://ocp.ldeo.columbia.edu/res/div/ocp/drought/nineteenth.shtml
++++++++++++++++++++++++++++++++++++++++++++
You want a REAL climate CRISIS?
This is what it looks like:
Can you imagine if this below happened today? It's less likely because climate change and the current climate OPTIMUM is helping to PROTECT US!
The planet had a REAL climate crisis between 1876 and 1878.
50 million people died. 3% of the global population died from that real climate crisis!
https://news.climate.columbia.edu/2017/12/15/causes-great-famine-drought/

The Great Famine killed an estimated 12 to 29 million people in India. Image
https://ui.adsabs.harvard.edu/abs/2017AGUFMGC51F..04S/abstract
The 1876-1878 Great Famine impacted multiple regions across the globe including parts of Asia, Nordeste Brazil, and northern and southern Africa, with total human fatalities exceeding 50 million people, arguably the worst environmental disaster to befall humanity.
NASA EXPLAINS THE DUST BOWL DROUGHT
https://www.nasa.gov/centers/goddard/news/topstory/2004/0319dustbowl.html
++++++++++++++++++
Climate change in the United States, with 100% certainty is helping to protect us from widespread severe droughts. Tightly packed rows of corn in the Midwest during the growing season has created a beneficial micro climate!!!
Summer Climate Change in the Midwest and Great Plains due to Agricultural Development during the Twentieth Century
https://journals.ametsoc.org/view/journals/clim/32/17/jcli-d-19-0096.1.xml

++++++++++++++++++++++++++++++++++++++++++++++++++++

We are indisputably living in a climate optimum for most life on this planet(that would still prefer a bit more warmth and a lot more CO2) and for growing crops in the United States!
Despite that, there are more intense heat waves in many places(it's global WARMING, for Pete's sake). Definitely more flooding and melting ice is adding to the natural sea level increase.
But ONLY telling us about those bad things and NEVER telling us about the much bigger picture, while calling beneficial CO2 a pollutant and our atmosphere a sewer is worse than junk science. It's a scientific lie that contradicts authentic science, where CO2 serves as the building block FOR ALL LIFE and we are barely at 50% of the optimal level, as the massively greening planet is telling us how much plants really love the additional CO2.
Every animal on the planet eats plants or something that ate plants.
Death by GREENING!
Started by metmike - May 11, 2021, 2:31 p.m.
https://www.cbsnews.com/news/europe-air-conditioning-deadly-heat-waves-more-common/
Air conditioning can cut heat-related deaths by 75%, according to a 2007 study, and research published by The Lancet found that in 2019, 195,000 heat-related deaths among people over the age of 65 were averted thanks to AC being adopted.
But only about 20% of Europeans have it at home, compared to 90% in the U.S.
The extreme heat currently being felt in Europe isn’t the new normal – much worse is to come, and we are doing far too little to adapt, says Michael Le Page
https://www.newscientist.com/article/2531853-if-you-arent-terrified-by-this-heatwave-you-should-be/
+++++++++++++++
Claiming that this climate crisis/emergency is already reducing food production is the diametrically opposed, polar opposite of the truth with increasing CO2 adding 1% for every 5 parts per million increase. So an increase in CO2 of 130 ppm, by itself has added 26% to global food production (on average-each crop is different).
https://www.marketforum.com/forum/topic/69258/#69259
https://www.marketforum.com/forum/topic/69258/#70805
https://www.marketforum.com/forum/topic/69258/#71114
https://www.marketforum.com/forum/topic/69258/#71265
https://www.marketforum.com/forum/topic/69258/#71266
https://www.marketforum.com/forum/topic/69258/#99597
https://www.marketforum.com/forum/topic/69258/#99598
This WILL continue based on authentic science and the law of photosynthesis........until fossil fuels begin to run out in around 30 years. Then it will rapidly go the other way as the greened up planet and huge crops gobble up MORE CO2 than we emit and CO2 levels stop going up.
Then, CO2 will start going down fast during the last few decades of this century and the world will truly understand how beneficial this gas is. You don't appreciate many things until you lose them!
Claiming that this is why the Amazon rain forecast was cut down is a lie. The added food makes the acres we grow food on MORE productive! Ironically, woody stemmed plants, especially trees are growing 50% faster because of the added CO2.
Claiming that in 30 years that people will no longer be able to live in these areas because the rate of warming is accelerating and heat waves will be as much as 5 Deg. C hotter is hogwash. Look at the graph below. The linear warming rate(.18 Deg. F/decade) will likely cause these places to be .54 Deg. C hotter. Not 10 times more than that which is made up.
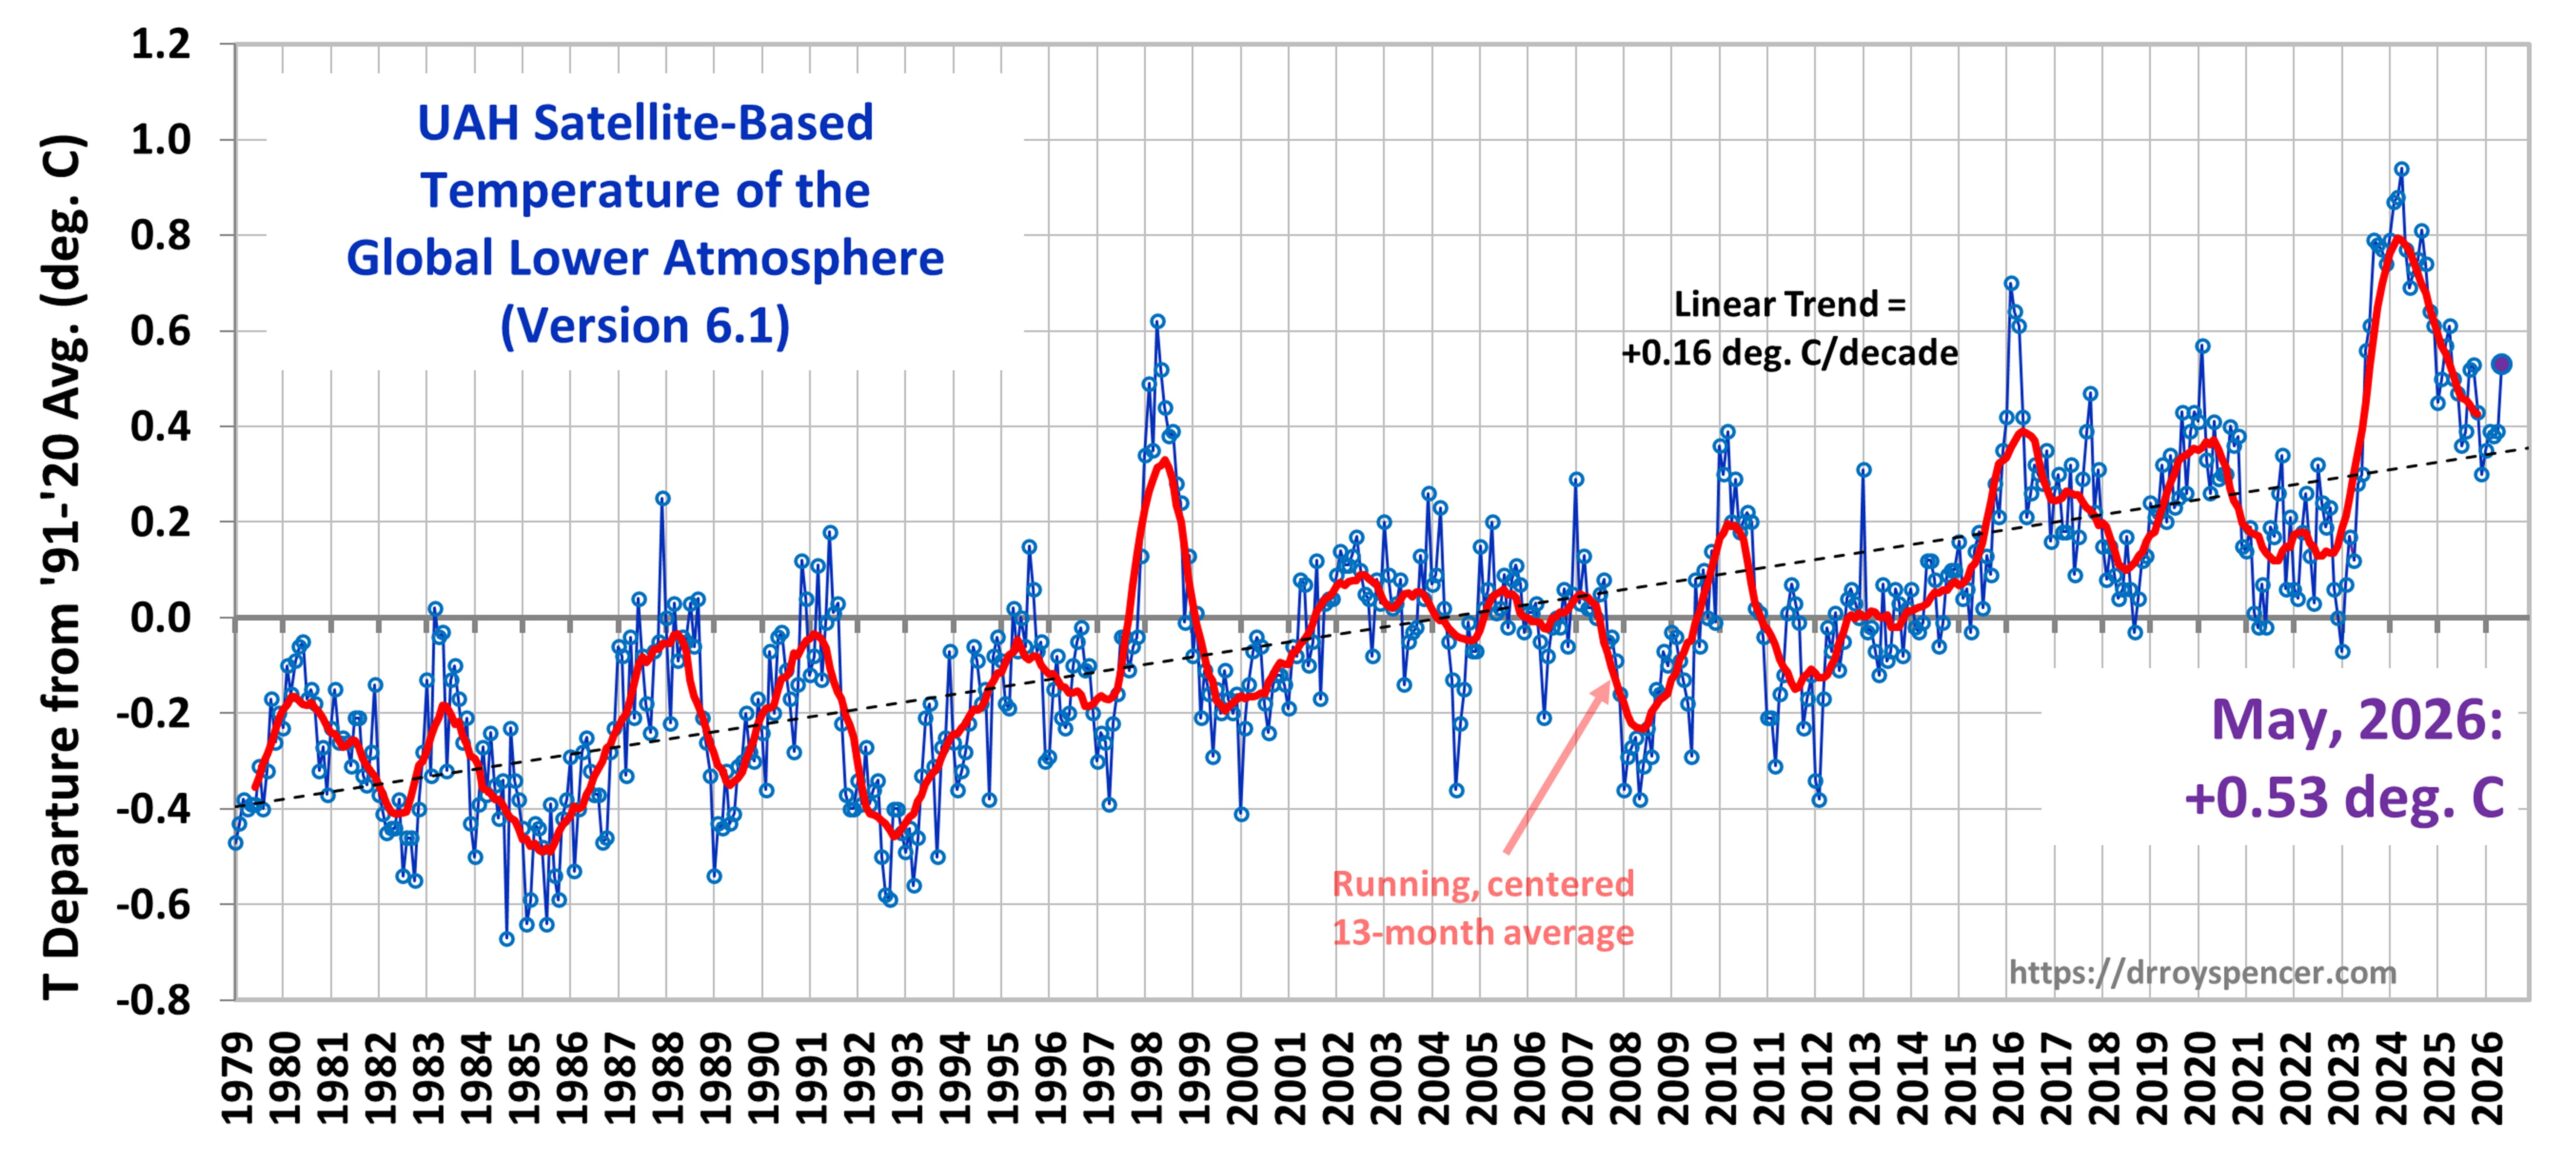
Since 1976 (which was after 3 decades of modest global cooling) with the global temperature up +1 deg. C, there is no physical/scientific justification to claim that this heat wave is 3.5 deg. hotter because of it as the article below claims.
https://www.marketforum.com/forum/topic/120644/
+++++++++++++++++++
https://www.aol.com/articles/scientists-terrified-mind-boggling-temperatures-131200000.html
Global warming has worsened Europe's heatwaves in just a few decades, the WWA analysis found. A similar heatwave in June 1976 would have been around 3.5 degrees Celsius cooler than this one, WWA said.
+++++++++++
metmike: That is false! Global warming is impacting the coldest/driest places of the Northern Hemisphere during the coldest times of year the most NOT the hottest, most humid times of year as explained previously.
The Version 6.1 global area-averaged linear temperature trend (January 1979 through May 2026) remains at +0.16 deg/ C/decade (+0.22 C/decade over land, +0.13 C/decade over oceans).
++++++++++++++
Here's that disaster for human kind they insist we are in right now, as shown by the actual statistics showing the changing rate of climate killing people the last 100 years.
++++++++
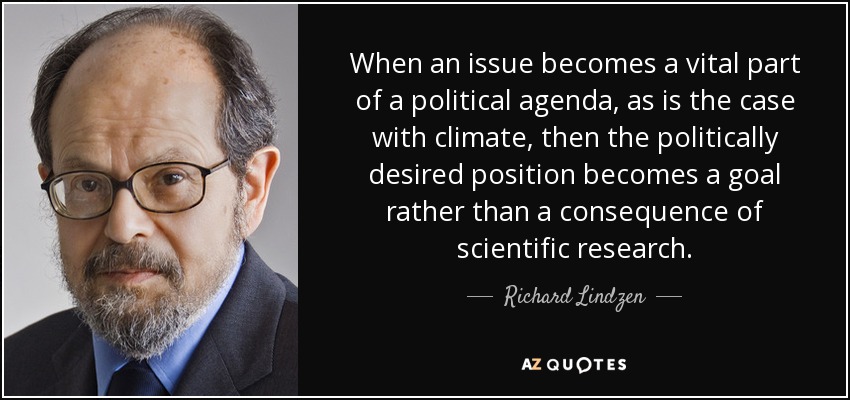
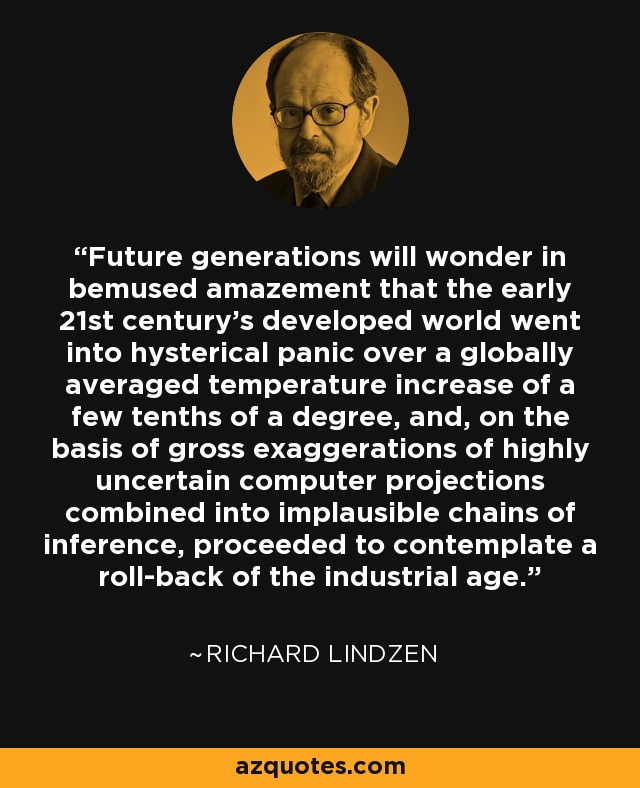
They have hijacked climate science and weaponized it for political agenda and crony capitalism as well as for scientists personal enrichment thru grants/research funding. With a biased personal belief system that sadly, many scientists practice instead of the scientific method.
One only needs to look at the authentic data provided here which contradicts all the scary words describing made up or exaggerated emergencies and a fake climate crisis.

Sadly, Donald Trump has the right position on climate change.
I say "sadly" because the guy who chides people that disagree with him, especially blacks and women as "low IQ people" has no understanding about the science and sounds like a complete moron when he talks about climate change.
With a friend to authentic climate science like this, who needs enemies
+++++++
For me, it’s much more than just fossil fuels which is trumps entire deal.
As a practicing environmentalist, the environment matters.
As an atmospheric scientist and educator of people, teaching people authentic climate science, biology and agronomy/plant science are top priorities.
Stealing peoples intelligence using propaganda about a fake climate crisis is wrong!
It’s an excellent thing to teach about the actual physics of greenhouse gas warming that are impacting the planet because of the increase in CO2 from humans burning fossil fuels.
Just tell the truth. Don't exaggerate. Don’t make things up. Tell all the good things from it as well as the bad. Use science not politics. Use ethical economic principles not crony capitalism.
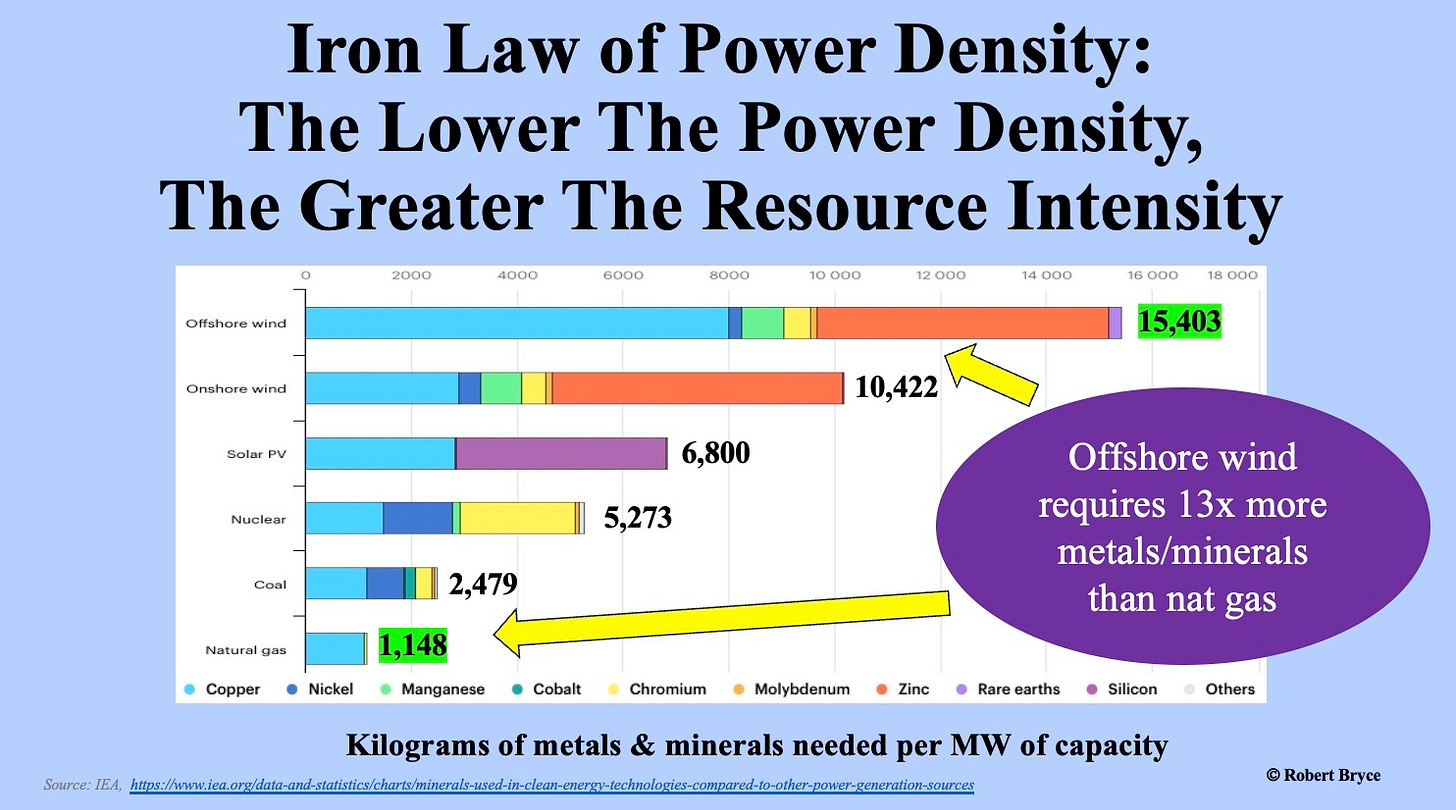
Wind energy is the most anti environmental form of energy by a Grand Canyon wide margin.
Ironically, the TRUE green energy, the one massively greening up the planet with beneficial CO2 emissions is being called pollution, supposedly killing the planet.
The optimal level of CO2 for life on planet earth is 900 ppm. It’s authentic science. The current ambient level in the atmosphere is only 430 ppm.
it got down to 280 ppm before we helped rescue the planet from those dangerously low levels of CO2.
That only sounds nuts because we’ve been taught such big lies about CO2 and its key role as the building block for all of life!
Death by GREENING!
Started by metmike - May 11, 2021, 2:31 p.m.
More memes:

The Unfolding Disaster of Wind Energy
+++++++++++++++++++++++++

+++++++++++
AI Overview
https://robertbryce.substack.com/p/the-iron-law-of-power-density-revisited
https://robertbryce.substack.com/p/the-power-of-power-density
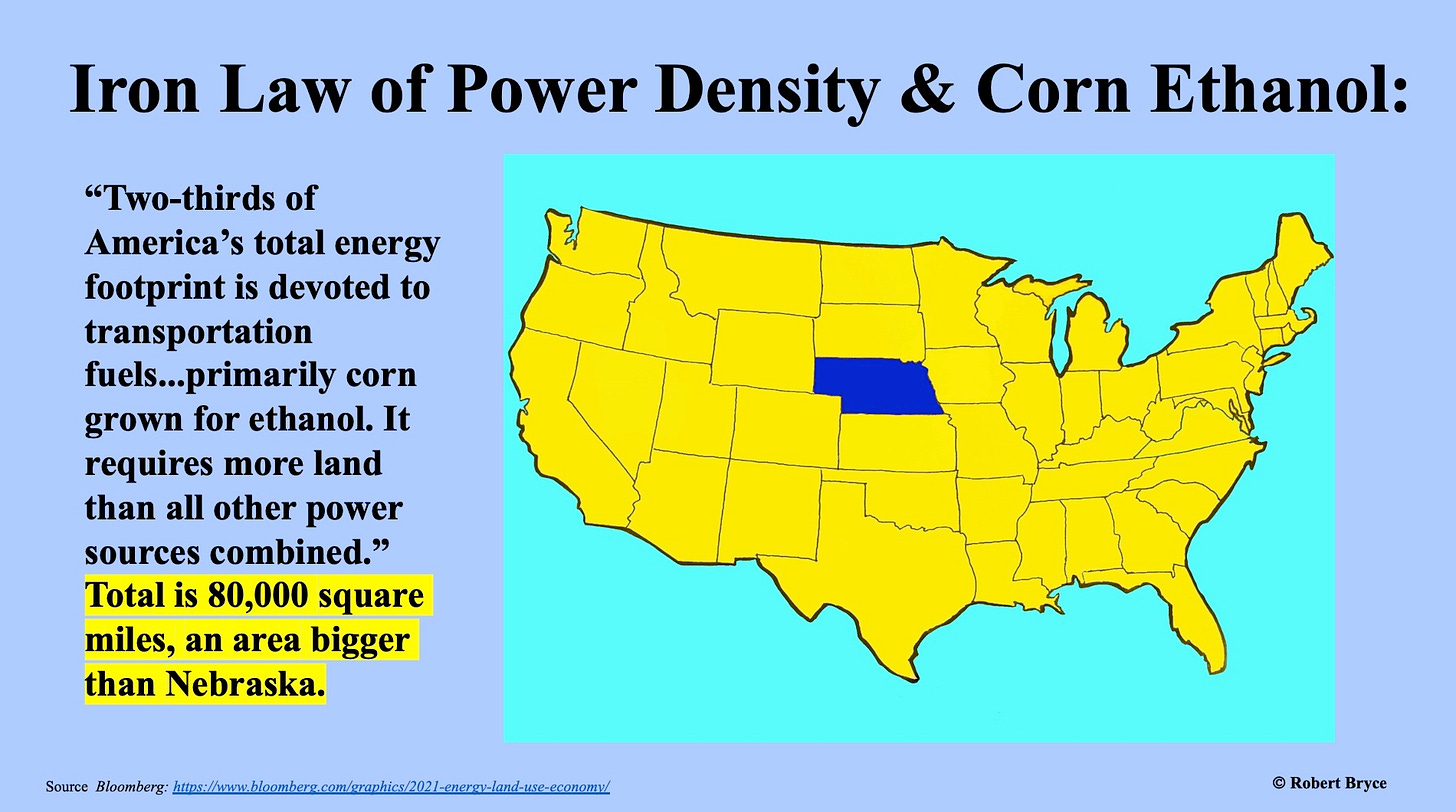
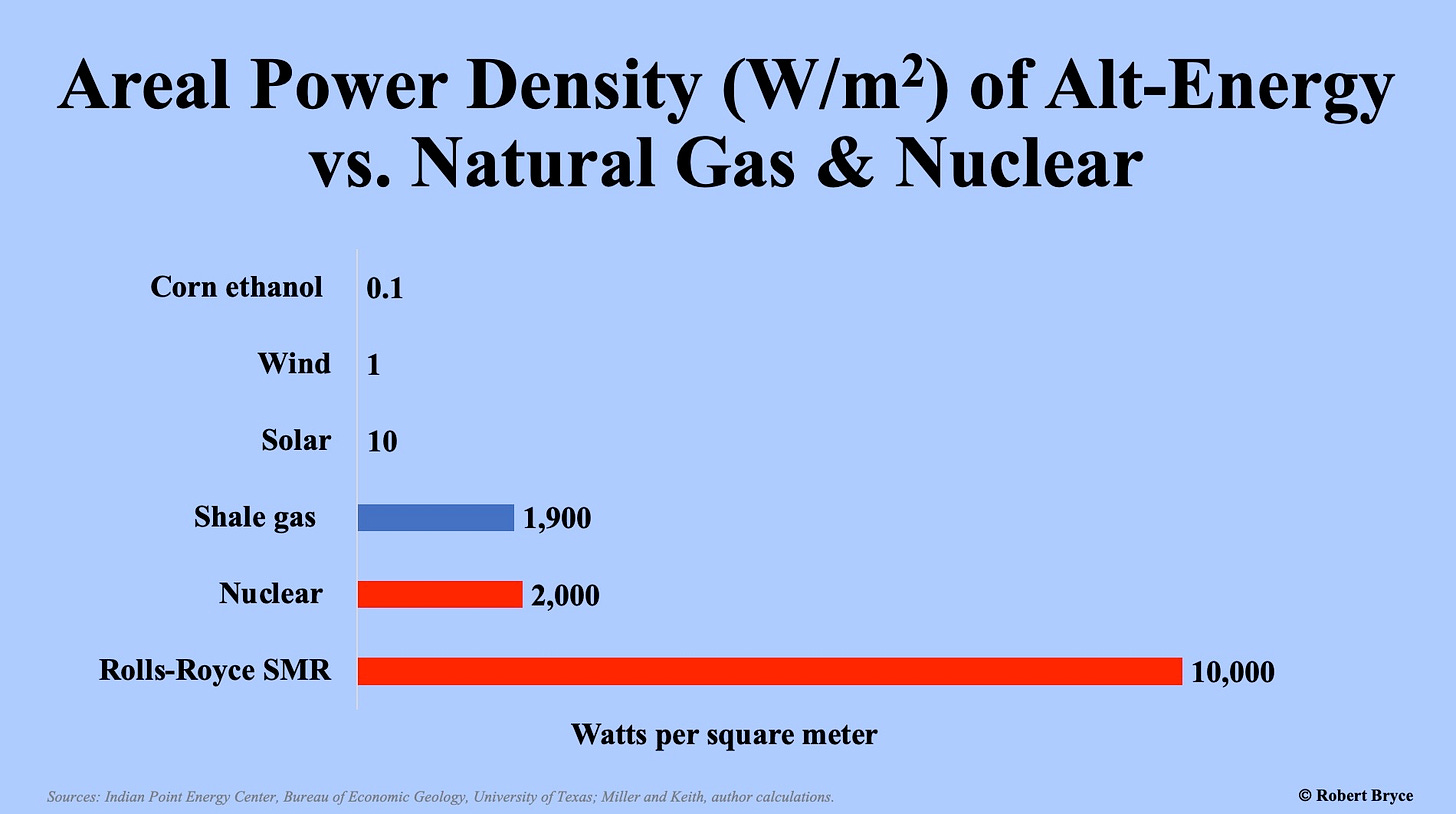
Sorry farmers but corn ethanol is the most polluting, resource squandering and energy dumb source in human history. All about politics and the power of the corn lobby.
The excellent (imho) poster, Don Sutherland, posted this quote this morning regarding this historic heatwave:
“Key contextual point from World Weather Attribution:
This June 2026 heatwave occurred under a circulation pattern broadly similar to historical analogues – Southerly Flow. However, a similar circulation pattern now produces significantly hotter temperatures than it did in the mid-20th century because the climate baseline has warmed...”
—————————
Then I replied to Don with this:
Absolutely, Don. It still would have been another historic heatwave even without AGW but not near as historic as it got due to the added effects from AGW. A larger portion of this extreme heat was very likely due to the pattern, itself, as opposed to AGW, itself. But AGW means a higher baseline as your quote said.
The global baseline average has warmed ~2.5F since the late 1800s and not far from that even since just the mid-20th century if I’m not mistaken with the Arctic significantly higher and the tropics lower. How much do you figure the W Europe climate baseline has warmed?
——————
Don liked my post indicating agreement. Then he responded:
“The latest estimates I have seen is 2.19C-2.26C (3.9F-4.1F):
European land temperatures have increased even faster over the same period by 2.19 to 2.26°C, depending on the dataset used.
https://www.eea.europa.eu/en/analysis/indicators/global-and-european-temperatures”
————————
Mike, based on the above, I’d say Don, Cliff Mass, you, and me have pretty good common ground on this heatwave assuming this is how Cliff would think about it. Do you agree?
Thanks, Larry!
I agree with most of that. For sure with you being on top of this as a very informed and objective source!
I not only respect your opinions tremendously but have learned a ton of things from your posts.
I learn new things from other posters here too!
I will challenge this stat , however as being used to superimpose on this particular heat wave. This is sort of a scientific nit pick that shouldn't interfere with the overall agreement we all have on this topic.
“The latest estimates I have seen is 2.19C-2.26C (3.9F-4.1F):
++++++++++++++
Much of this warming is in the HIGHEST latitudes that are warming the most during the coldest times of year(Winters) because cold air is dry and the lower H2O levels that dominate the green house gas radiation absorption bands, that overlap with CO2 is much less which allows the CO2 to do more warming IN THE WINTERS,
Europe is pretty far north, with parts of it above the Arctic Circle,
https://www.burningcompass.com/on-world-map/europe-on-world-map.html
https://beyondpenguins.ehe.osu.edu/where-does-the-arctic-begin-end
+++++++++++++++
+++++++++++
https://commons.wikimedia.org/wiki/File:Longwave_Absorption_Coefficients_of_H2O_and_CO2.svg
+++++++++++++++
The air mass for this heat wave came from the Sahara Desert. I've mentioned previously that because deserts are also dry, they too see the radiation absorption bands from H2O as less saturated.........so CO2 can warm more.
That still means that the source region for this air mass was for sure HOTTER because of the added CO2 but we can't use an AVERAGE yearly warming stat which is mostly the result of Winter warming in the higher latitudes of North America to ascertain the magnitude of a June heatwave from an air mass that was generated to the southwest(lower latitude-Sahara Desert).
We had a good discussion on this back in March when the the Southwestern US was having a mind boggling heat wave.
The impact of the extra warming in the Sahara Desert is still pronounced but let's understand the reason why and its impact on this exact heat wave and not use a stat which is based on something else.
You might find this interesting:
https://www.sciencedaily.com/releases/2025/11/251102205025.htm
++++++++++
BTW, your link doesn't work.
Sorry, Mike, for my link not working. Here’s the corrected link:
https://www.eea.europa.eu/en/analysis/indicators/global-and-european-temperatures
Don made another post about this as well as the upcoming E US heatwave, which I agree with:
“In the wake of Europe's record-setting June heatwave and the guidance suggesting that parts of the U.S. Mid-Atlantic and southern New England regions could challenge July monthly and even all-time heat records, the climate change denial movement is desperately trying to frame the heat as ordinary summer heat. One example from a fossil fuel advocacy group's policy analyst in attacking a meteorologically sound post:

In the past week, Belarus, Czechia, Denmark, Germany, Poland, and Slovakia set all-time national heat records. Austria, France (with 292 cities setting all-time records), Switzerland, and the United Kingdom set June monthly records.
But to the ignorant, that's just ‘summer.’
The latest guidance suggests that the July 1-4 period could see locations in the Mid-Atlantic and southern New England regions challenge July monthly and even all-time records.
But again to the ignorant, that's just ‘summer.’
And finally the ignorant policy analyst's claim that nationally-recognized meteorologist Jeff Berardelli should use the ‘correct terminology’ instead of ‘heat dome,’ proves incorrect. It's the policy analyst who has no clue.”
————————
Wxfollower says: Chris Martz is a smart pro-met, but regardless he clearly looks really bad here to not even acknowledge AGW’s contribution to these heatwaves and also to not realize that pro mets often call very strong summer upper ridges heat domes, which I’ve heard since 1998, the year that I started my subscription to Freese-Noris and started reading Charlie Notis use that term.
Thanks very much, Larry!
Yeah, I could spend 24 hours a day when we have extreme weather events, finding comments from both sides that intentionally spin it with exaggeration or downplaying.
Berardelli for instance:
"Super charged heat domes are appearing all over the planet"
"The US will endure one of its most expansive heat waves in history.
It's an impressive heat wave but NOT historic.
His drawing of the jet stream is way exaggerated with the dome(using the term dome is appropriate). This is the 500 mb for Friday from the last 18z GFS(same time frame that he used). I would definitely call the 594 contour in the Mid Atlantic and areas surrounding it being under a dome.
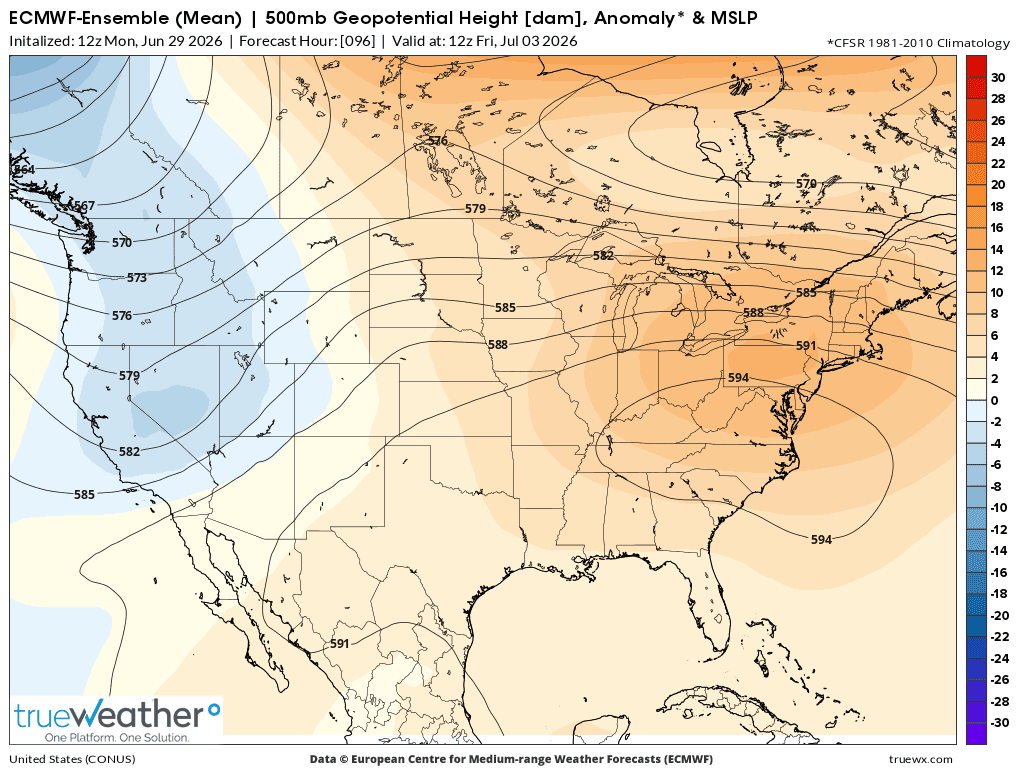
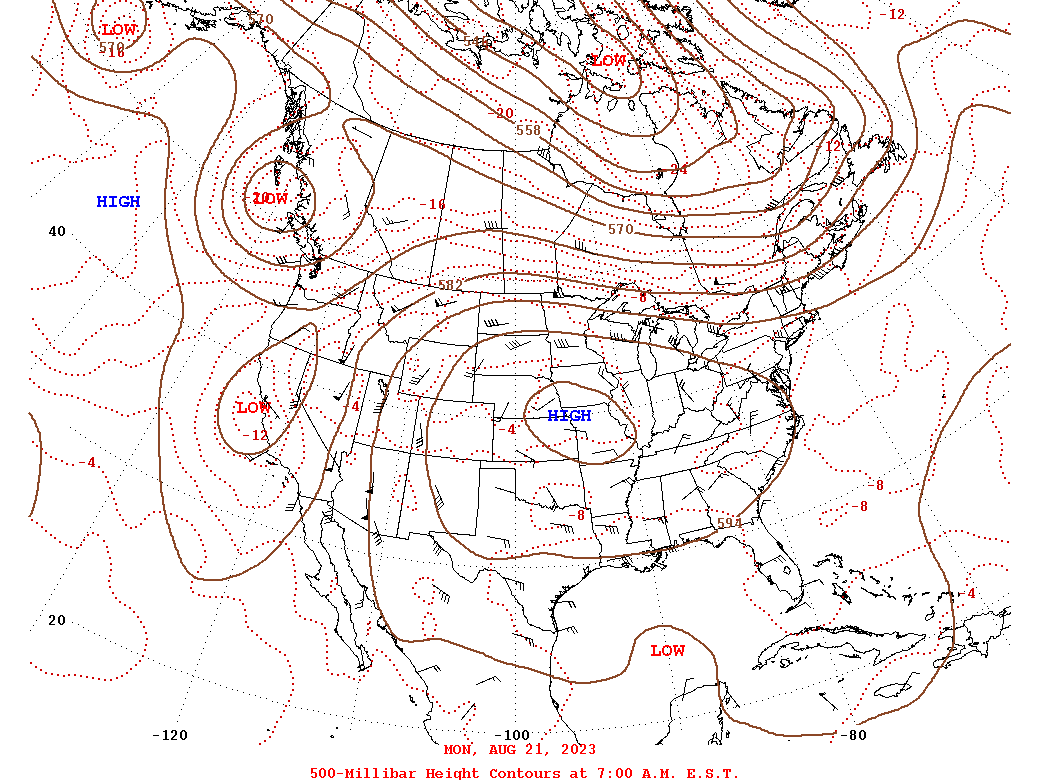
Compare that to this impressive DOME in August 2023(3 years ago).
That's a 600 dm contour in the center, surrounded by 597 dm, then surrounded by a HUGE area of 594 dm or more, making the one above look puny in comparison.
600 dm-500 mb heights 8-23-23-Wow!
https://www.marketforum.com/forum/topic/98499/
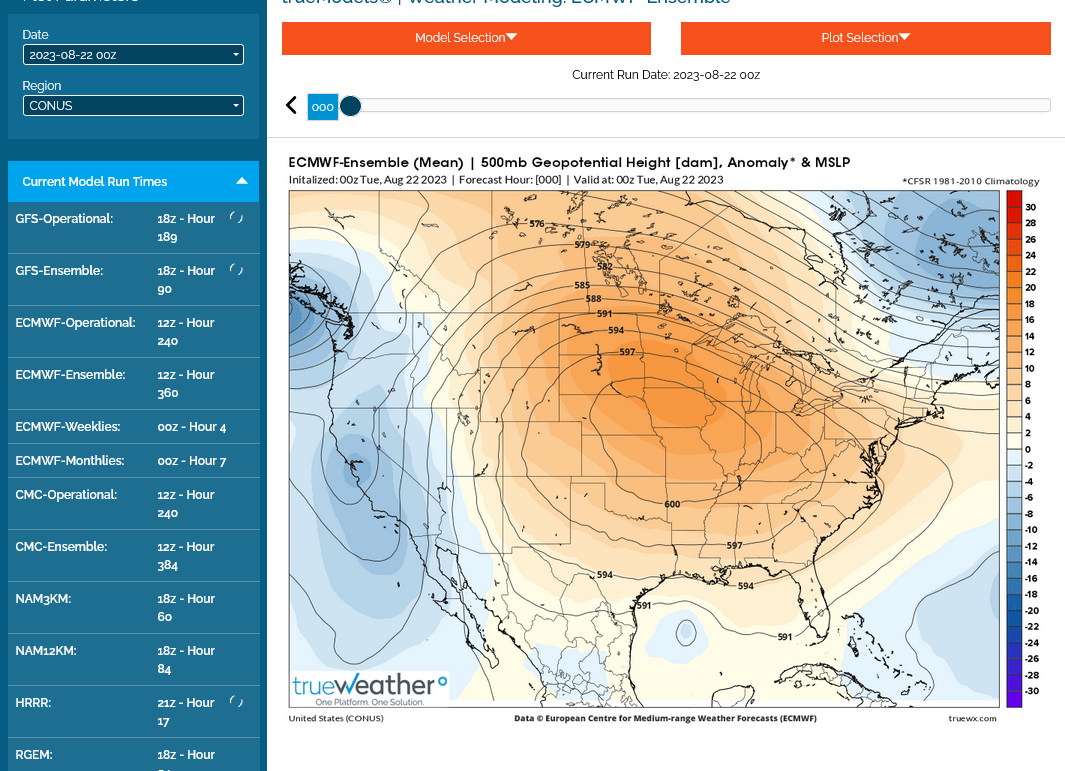
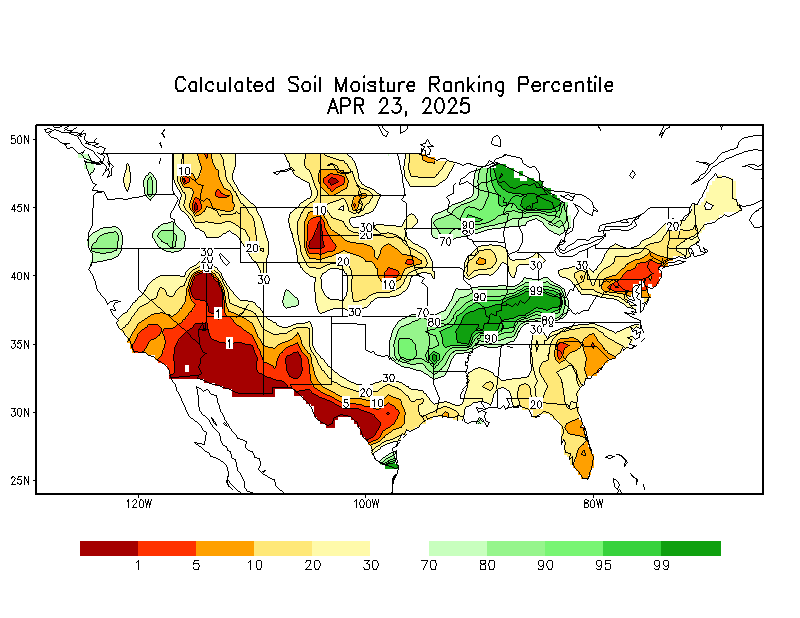
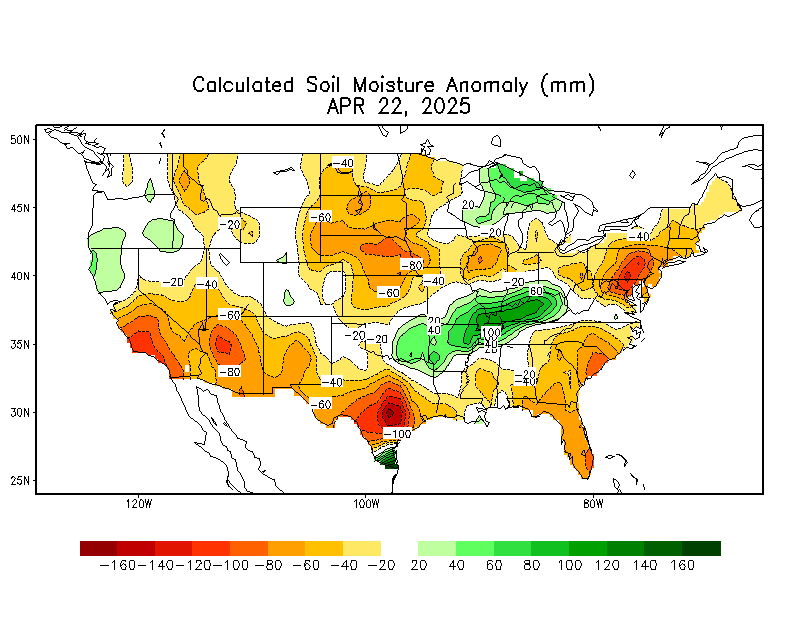
And the BIGGEST reason for those temperatures getting above 100 in the Mid Atlantic is this: DRY SOILS!!!! (and adiabatic warming on the lee side of the mountains to their west) NOT a super charged heat dome from climate change!!! But let me guess, it was climate change that caused the dry soils and not the previous natural La Nina pattern because we never had droughts before the climate crisis!
With moist soils, a lot of the heat goes towards evaporation. Dry soils and most of the UV radiation heats the air. With moist soils, like we have in much of the Midwest(which will NOT have 100 degree heat), it's doubtful any of those places would get to 100.
+++++++++
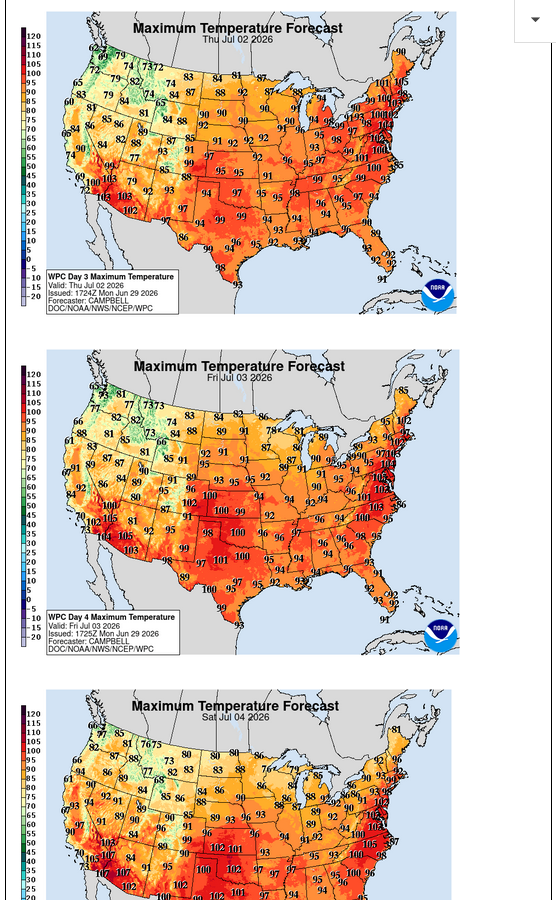
Here are the high temps for July 2-4.
We never get above 96 with our wet soils, while temps in the Mid-Atlantic could soar as hot as 104!
++++++
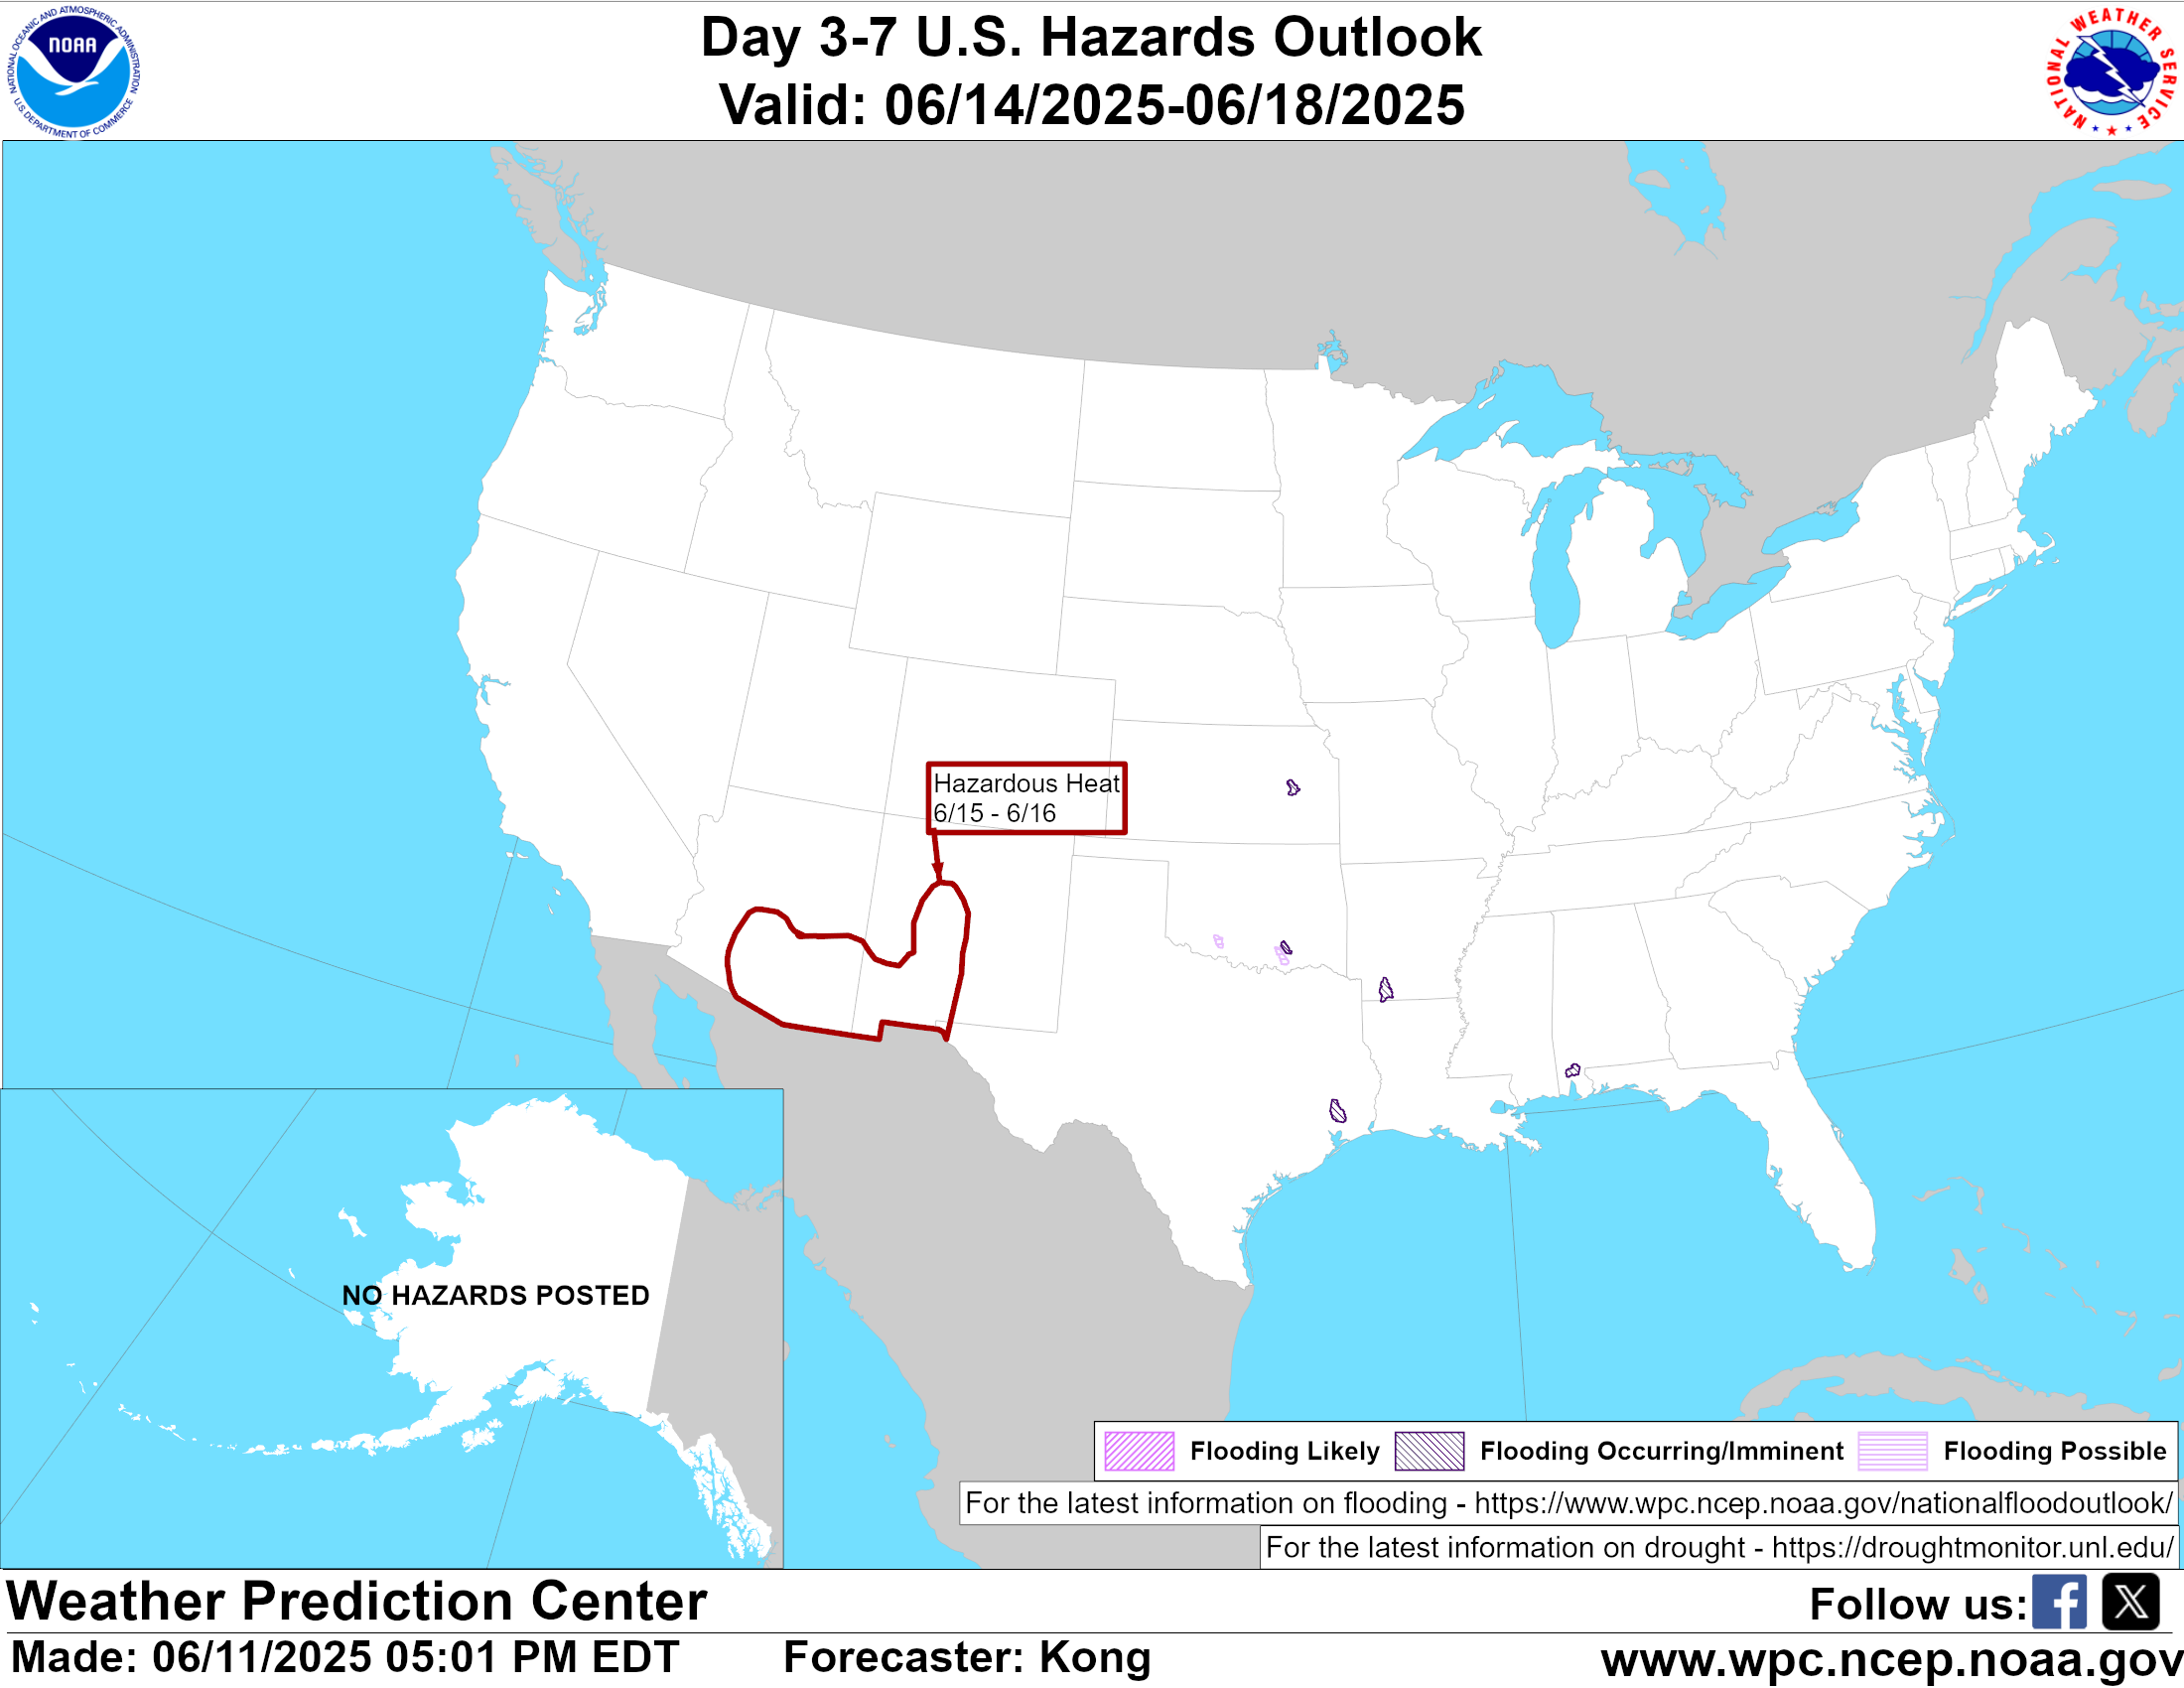
This is the NWS depiction below.
https://www.wpc.ncep.noaa.gov/threats/final/hazards_d3_7_contours.png
+++++++++++++
These are the record state highs. Along the East Coast, they are easier to break but we need 105+ to do that. Local records are easier to break and it wouldn't surprise me to see some local spots close to their all time high.
https://wonderingmaps.com/us-hottest-days/
Note that half the state high temp records were in the 1930's!
And that only a few states have set their all time highs since 2000.

Here in Evansville, IN with our wet soils, we won't even get within 5 degrees of any daily highs. We'll be 15 degrees away from our all time high............even though we are under the heat Dome.
https://www.weather.gov/pah/EvansvilleDailyNormalsAndRecords
This is definitely an impressive DOME but not even in the top 10 in the last 100 years!
The record hot Summer of 1936, instead of a heat wave that lasts for a week...........lasted thru most of June, July and August.
And look at how expansive it was:

Of course that correlated with the dry soils.

++++++++++++
https://www.wunderground.com/cat6/North-Americas-Most-Intense-Heat-Wave-July-and-August-1936

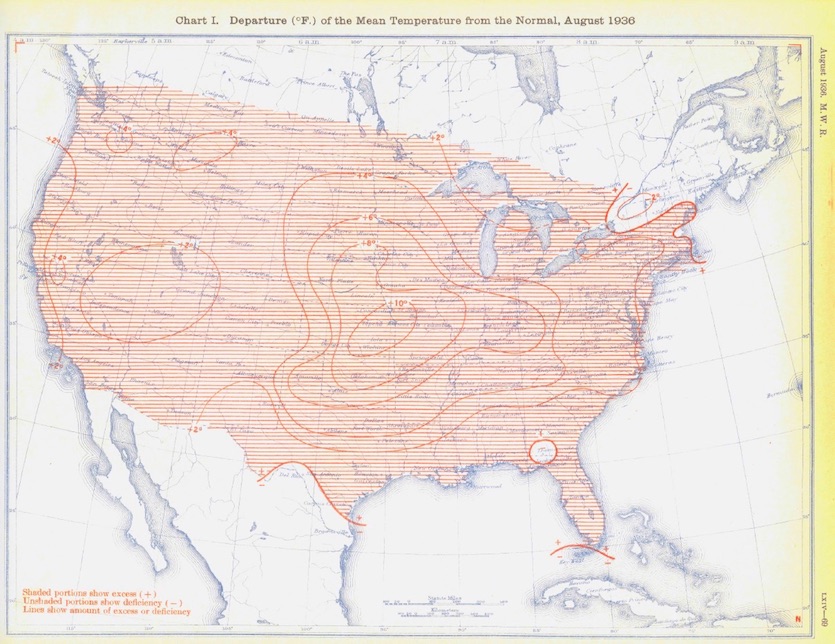
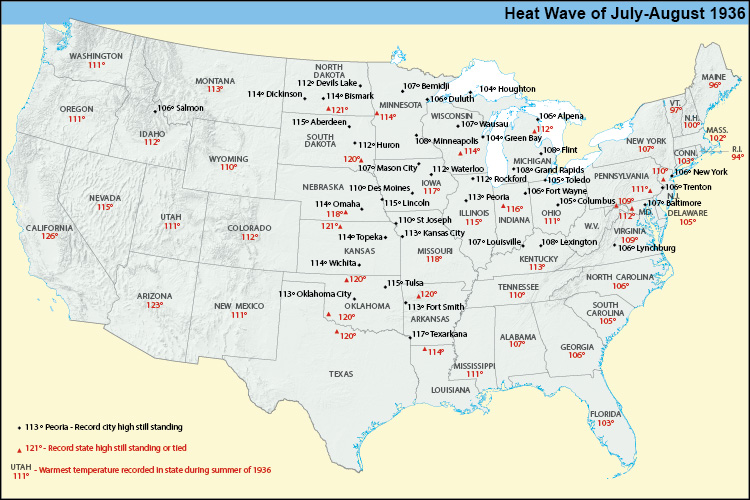
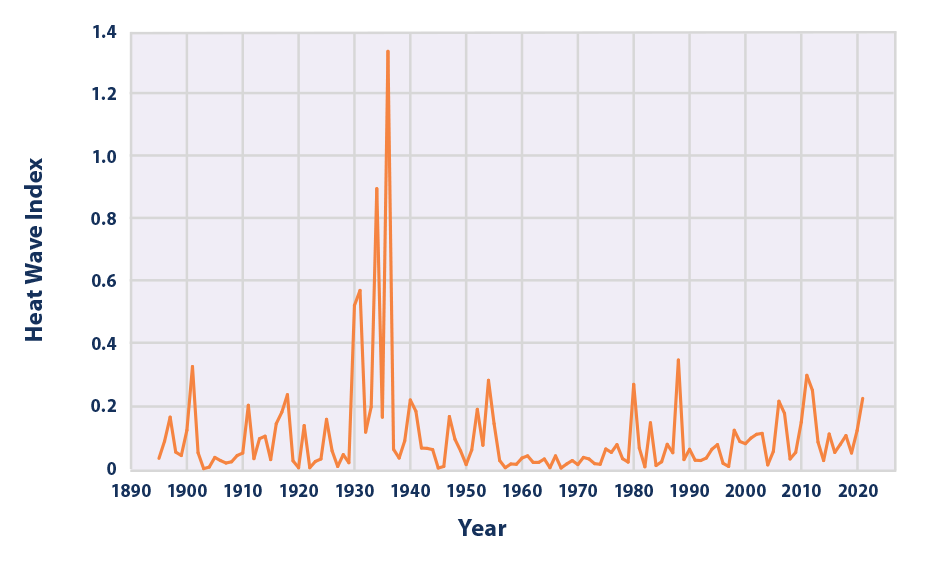
From the EPA
Figure 3. U.S. Annual Heat Wave Index, 1895–2021
Can you imagine if we had these things happen today?
On the other hand calling this typical Summer weather is stretching it a bit in the hottest places.
In Evansville, it's not that far away though. We have to remember that the "average" temperature happens less often than below and above temperatures. When you add up the hotter and cooler days and divide by the total number, you get an average that rarely happens.
Sometimes temperatures are MUCH above and sometimes they are MUCH below average. That actually, really is expected weather. some of the time.
Here is Evansville, with us under the dome this week(with wet soils), we've been HOTTER than the hottest upcoming day coming up over 100 times in history. So actually, I would call this just typical extreme Summer heat/humidity. The hottest temperature coming up is probably going to be around 97 degrees.
AI Overview
++++++++++++++=
My first Summer as chief meteorologist at WEHT, Evansville was 1983, so I remember it vividly. AI is sometimes really bad at getting weather records and statistics correct.
On the list below, there were just the 14 days that got above the hottest upcoming day for us in that 1 Summer. Would I call the upcoming 4 days with our highs in the mid-90's "just Summer"????
Certainly I would before calling it "historic heat" or record breaking heat".
1983, below was historic heat. So was 2012. So was 1988. So were several hot spells in the 1950's and most of the Summer of 1936 and other Summer's in the 1930's.
2026? Not even close in the Midwest or most places.
In the Mid-Atlantic, they will be hotter than that for several days. But the magnitude of heat that great(100+) is REGIONAL not as Jeff describes it:
"Super charged heat domes all over the planet" and not "The US will endure one of its most expansive heat waves in history"
Jeff is using junk science verbiage that is not accurately describing the authentic weather patterns. He is advocating to his readers for a climate crisis instead of reporting objective, accurate weather.
https://www.extremeweatherwatch.com/cities/evansville/year-1983
| Rank | Temperature | Date |
|---|---|---|
| 1 | 102 °F | Aug 20 |
| 1 | 102 °F | Jul 23 |
| 1 | 102 °F | Jul 22 |
| 1 | 102 °F | Jul 21 |
| 5 | 101 °F | Aug 22 |
| 5 | 101 °F | Aug 21 |
| 5 | 101 °F | Jul 20 |
| 8 | 100 °F | Aug 19 |
| 9 | 99 °F | Aug 27 |
| 9 | 99 °F | Aug 26 |
| 9 | 99 °F | Aug 9 |
| 9 | 99 °F | Aug 5 |
| 9 | 99 °F | Aug 4 |
| 9 | 99 °F | Jul 19 |
I'll have to add this again:
It really boils down to this, once again(Cliff Mass can be counted on as an elite source for using objective, authentic science)
https://cliffmass.blogspot.com/2016/03/the-golden-rule-of-climate-extremes.html
The GoldenRule
Considering the substantial confusion in the media about this critical issue, let me provide the GOLDENRULE OF CLIMATE EXTREMES. Here it is:
The more extreme a climate or weather record is, the greater the contribution of natural variability.
Or to put it a different way, the larger or more unusual an extreme, the higher proportion of the extreme is due to natural variability.
++++++++++++++++++
While the heat in Europe is clearly NOT just Summer the heat in most of the United States, actually is not outside of an expected extreme heat wave. The Mid-Atlantic and surrounding REGION is having this heat wave amplified by their lingering REGIONAL NATURAL DROUGHT. This is what always happens with every heat wave since humans have existed. When the soils are dry, the UV radiation goes into heating the air and not evaporating soil moisture.
The extreme is NOT because of one of the most expansive heat waves in history in the United States or a super charged heat dome from the climate crisis as Berardelli states.
If he was really about science, meteorology, climate and the physics heating the atmosphere, then he would have just explained the impact from the drought as being a huge reason for the Mid-Atlantic will be 10 degrees HOTTER than it would be if soils were moist and compared to other areas with the heat dome.
Berardelli is just a climate crisis advocate. He doesn't discern between extreme heat in the Mid-Atlantic from the natural drought and the less extreme temps elsewhere in the United States with the "super charged heat dome". Or compared to the heat in Europe which is caused from an air mass coming from the Sahara Desert. It's all the same thing for him.............caused by the climate crisis.
An objective meteorologist explains it like this:
Re: : 6-25-26 MAJOR heat wave coming next week
By metmike - June 27, 2026, 9:58 a.m.
More on busting Berardelli on his way over the top description in the United States for a 594 dm dome at 500mb along the East Coast.
AI Overview
++++++++++++++
Here's a discussion on 11 heat waves in the Carolina's that lasted FOR WEEKS, not just days like this one with temperatures similar to this one, just since 1952.
https://www.weather.gov/ilm/heatwaves
Thanks, Mike!
My point was agreeing with Don about Chris Martz. As I said, Chris is both openly dismissing the contribution of AGW in these cases and is also dead wrong about the use of the term “heat dome”. But I agree with you that Jeff B. is wrong in calling this US heatwave one of the most “expansive”. It is quite intense with record highs likely for a couple of days, but certainly not in a large portion of the country. I might post about it not being one of the most expansive.
In terms of how historic, the European heatwaves are much more historic than the E U.S. heatwave. The U.S. heatwave will break some records but I don’t think to nearly to the extent/intensity of the European heat. And yes, drought in the E US is contributing although I don’t take away from the intensity of the heat just because of drought contributing. It still will be very intense heat in places like DC and surrounding states regardless of being made worse by dry soil.
Thanks very much, Larry.
Agreed on the magnitude difference in the United States compared to Europe.
Another factor along the East coast that is amplifying the intensity of this heat compared to the rest of the United States is the terrain, as shown below.
AI Overview
+++++++++++++++++
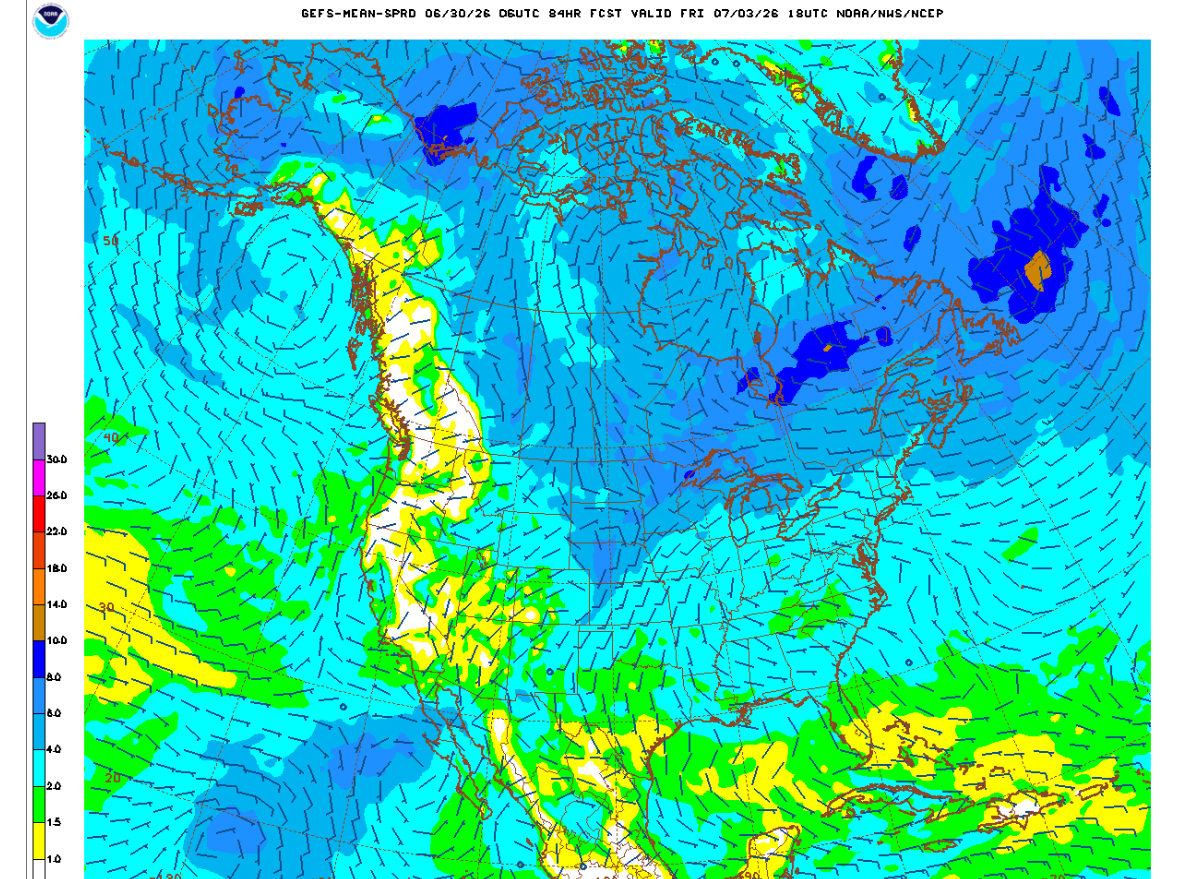
Below is the map for 850 mb winds on Friday afternoon. Note the strong westerly, DOWNSLOPING winds in much of this area predicted to have the 100+ temperatures.
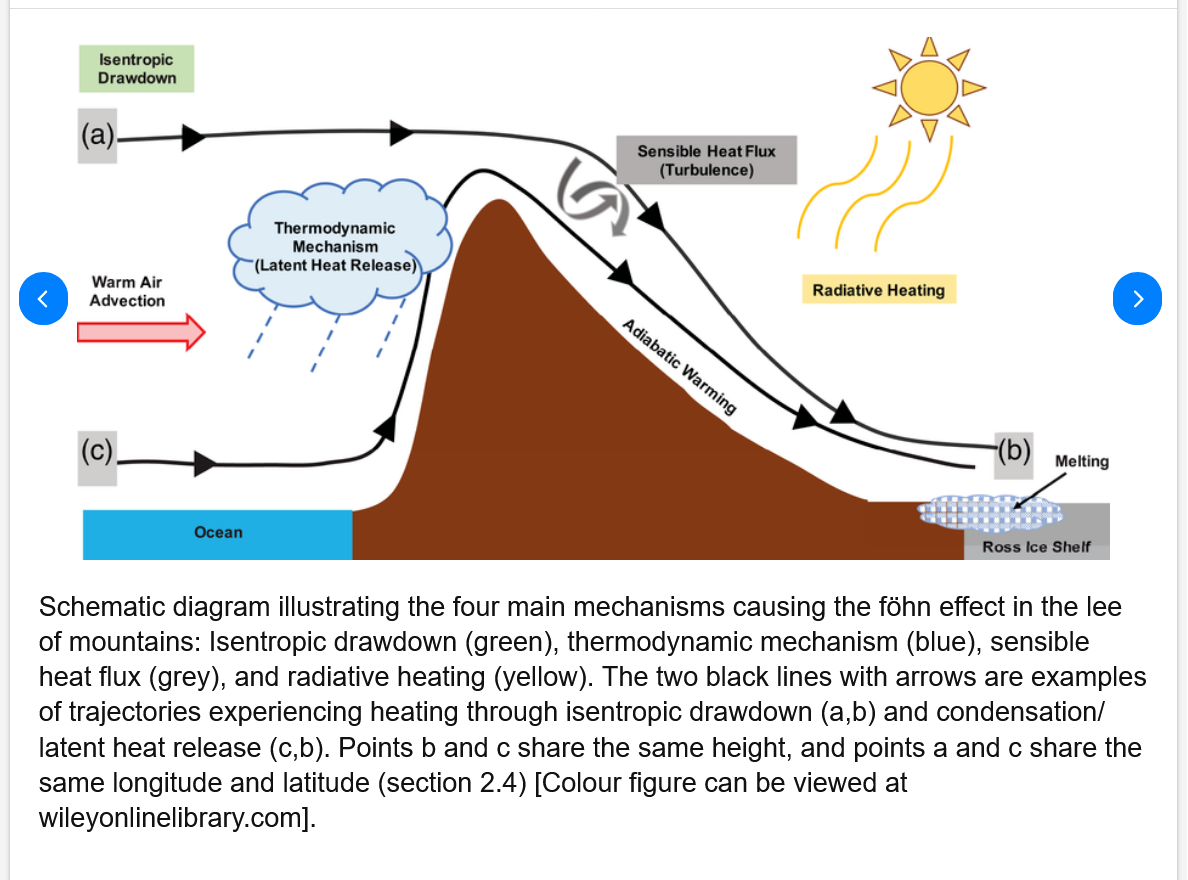
The mountains and adiabatic heating from down sloping winds have been happening since our planet had an atmosphere!

Quarterly Journal of the Royal Meteorological Society
These are the high temps on Thursday, Friday. and Saturday. Note the PEAK 100+ heat from adiabatic heating and dry soils along the East Coast compared to areas to the west with mid/upper 90's.

Please note too:
I didn't call Berardelli "ignorant" for his over the top verbiage to describe the heat wave in the United States and his climate change advocacy at the expense of authentic meteorology.
I let the authentic science/meteorology/physics do the talking!
"Nationally recognized" meteorologist Jeff Berardelli may get extra points because of his massive following but he's not doing so well at educating that massive following with OBJECTIVE authentic meteorology.
Hey Mike,
I just posted this to Don, for which he gave me a “like” reaction (common ground):
Hey Don,
“My point in thanking you for your post was agreeing with you about Chris Martz. Chris is both openly dismissing the contribution of AGW in these cases and is also dead wrong about the use of the term “heat dome”.
But at the same time, I disagree with Jeff B. in calling this US heatwave one of the most ‘expansive’. It’s quite intense with record highs likely for a couple of days, but certainly not in a large portion of the country:
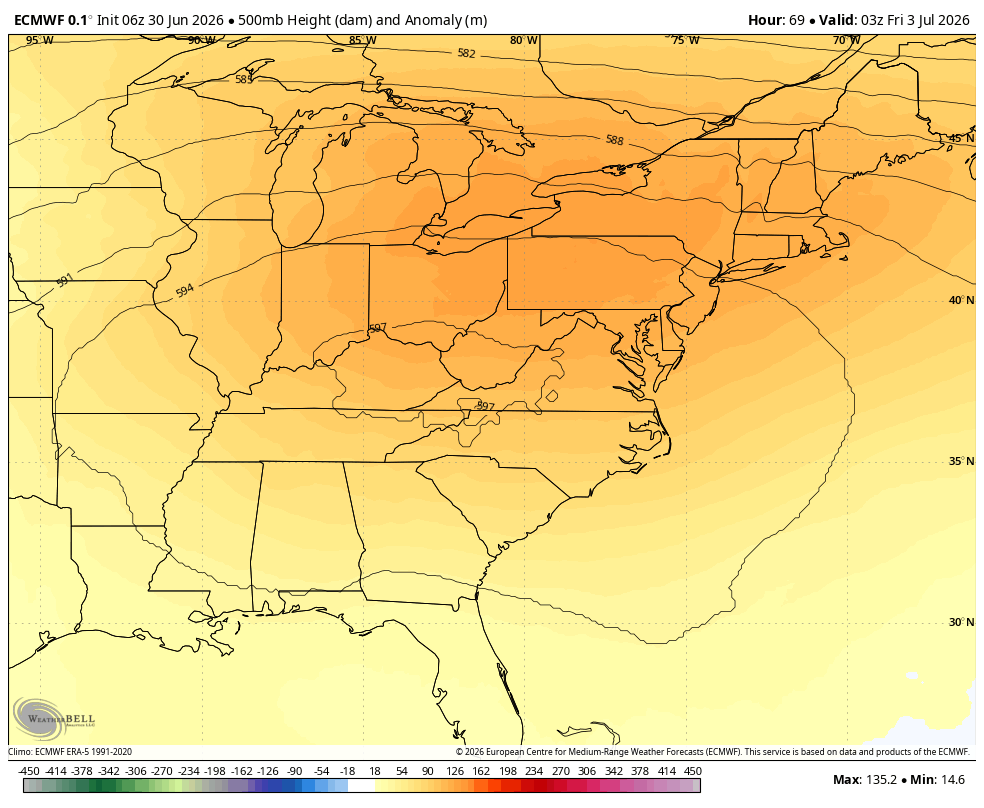
This is the largest extent of the heat dome at H5 expected to produce record heat in and near the Mid-Atlantic states:
Compare that to this significantly more expansive heatwave over the U.S.: 594 dm from E coast to Rockies and also N to MSP in addition to it peaking at ~600 vs the current one peaking at ~597:
There are others, including the Dust Bowl years, especially July of 1936, that had some days of 100++ over a much larger portion of the U.S. In contrast, the current one is forecasted at its peak extent to have 100+ only mainly from E GA to the NYC/Hartford areas, which is not one of the most extensive in US history:”
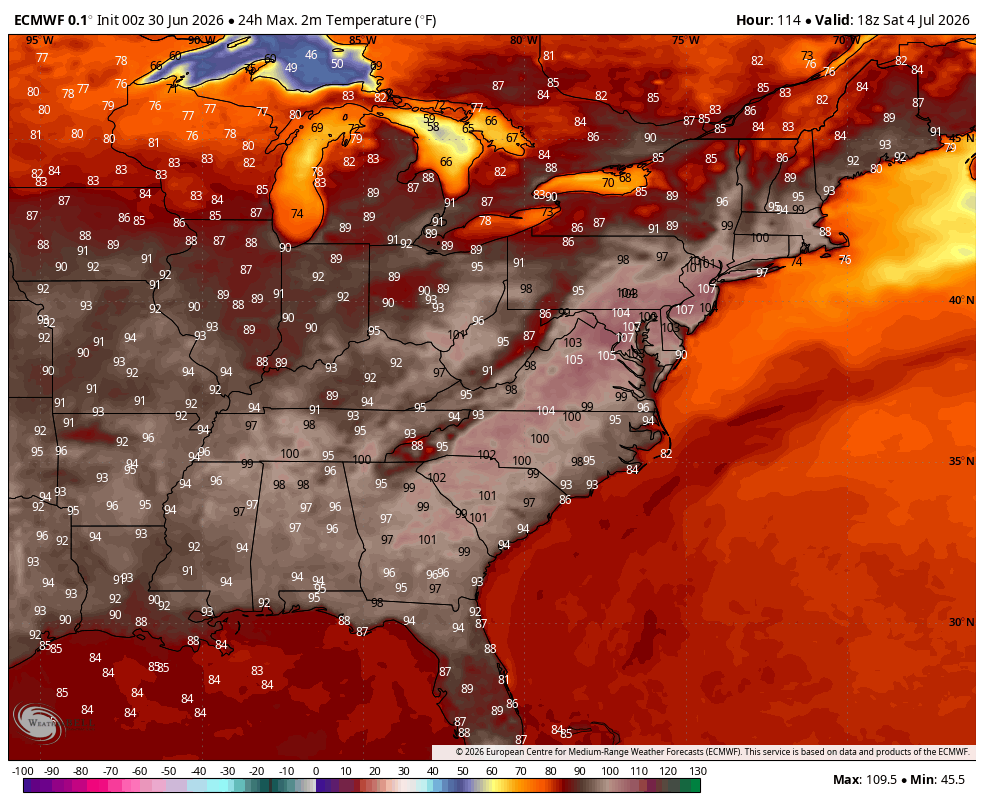
Great stuff, Larry.
Please note/don‘t forget that dry soils and adiabatic heating are adding up to 10 degrees to the maximum temperatures in those hottest spots in the East, INDEPENDENT of the heat DOME.
Thanks Mike,
I realize the contribution of dry soils and downsloping to the heat. Excellent points! Nevertheless, it’s still going to be very and dangerously hot! And although not one of the most extensive in U.S. history, it’s still going to cover a pretty large portion of the E US. Also, the 594-597 dm 500 mb dome is still going to be quite large: from OK/AR/MO point all the way to NYC as well as to S GA isn’t anything to sneeze about by any means!
For sure, Larry!
That's exactly why I started a special weather thread last week, dedicated to covering the significance of it and giving people a heads up! I emailed that link to my 1,000 local followers from 5 schools as well as posted it on Facebook and Twitter 2 different times.
6-25-26 MAJOR heat(humidity) wave coming next week
Started by metmike - June 25, 2026, 3:49 p.m.
https://www.marketforum.com/forum/topic/121123/
Also, I changed the title of this thread from Big Heat wave in Europe to Historic Heat wave in Europe to emphasize the difference in magnitude between that heat wave and the one in the United States.
The fact that most people in Europe do NOT have air conditioning makes it profoundly more impactful! Just try to imagine that!
In a field that's been hijacked by biased gate keepers, as a meteorologist, my entire objective is to enlighten people with authentic facts and perspective by teaching them, while warning them about real threats.
Threats from Winter weather. Severe weather. Extreme heat and humidity.
And the best part is having the time of my life discussing my favorite topic, doing my favorite thing, analyzing stuff, especially weather and sharing it in non confrontational manner with a great guy like you(or others).
While learning a ton of things from the analysis and discussion with others who contribute stuff I didn't know(you in this case).
Readers may wonder why I spend hours a day here posting this stuff obsessively for free.
Everybody has different activities that they consider fun for them. Doing that is like hitting a home run in baseball.
Sometimes they can be fun AND challenging at the same time. Sometimes they can be fun, challenging AND help to educate people. In this case, I consider it fun, challenging, helping to educate people(including me) AND helping to make the world a better SMARTER place.
It's a grand slam when that happens and I consider these 2 threads on heat and the one you started on the historic March heat wave in the Southwest to be Hall of Fame grand slam threads!
You will note that they serve as foundations to build on in future threads with a similar topic. What was learned here, can be applied again and again and again.
This is why I will frequently copy information from a previous post from years ago when it becomes relevant again. This is why I will often copy the link to every thread on the same topic ( for example, your March heat thread and our discussion) going back years. I don't expect people to reread every thread or every post but it's generously sharing background information for those that come here to get smarter based on AUTHENTIC, indisputable facts and truths, especially in science.
You will also note the absence of you know who in threads like this which helps to maximize the scientific appeal and minimize the politics that wreck some discussions for half the readers.
The magnitude of the heat in the United States so far has BUSTED!
Re: Re: 6-25-26 MAJOR heat(humidity) wave coming next week
By metmike - June 30, 2026, 5:28 p.m.
Since many of the posts the last day were related to what Jeff Beradelli posted/tweeted earlier this week, I wanted to address this even more specifically because of the importance.
https://grabien.com/profile?id=94903
Berardelli has been obsessed with the weather all the way since the age of 3. He earned his bachelor’s degree in Atmospheric Sciences from Cornell University in the 1990s. Recently, after witnessing the recent spike in extreme weather, he went back to school to study Climate, earning a master’s degree in Climate and Society from Columbia University. He feels, as the climate continues to change, understanding and communicating the impact on extreme weather and society is an integral part of being a TV meteorologist today.
++++++++
Berardelli is and example of a really smart guy with elite communication skills(he exploits with his position in the tv broadcasting field-which I did for 11 years at WEHT in Evansville as chief meteorologist).
However, I don't care if he has 10 degrees and has an IQ of 300. I've followed him long enough to know that he doesn't understand climate/weather/biology in many realms or is letting his tunnel vision bias and objective as an advocate for a climate crisis that he has convinced himself of, or he is intentionally deceiving/making things up.
I've busted him numerous times before here but on the post/tweet THIS week, let's do that again with a MT. Everest sized blunder.
Re: Re: Re: Re: Re: 6-25-26 MAJOR heat(humidity) wave coming next week
By metmike - July 1, 2026, 12:49 p.m.
Fork tongue, fake climate crisis advocate Jeff Berardelli MAKING UP how this heat wave in the US is being fueled by the El Nino and climate change.
https://www.facebook.com/reel/1528550338775694
%20Facebook.png)
Easy to bust this guy with authentic facts!
This is the Summer analog for El Nino conditions. Note that the impact of El Nino's in the United States(top right on the analog map below) is COOLER than average temperatures!!!!!
The complete opposite of what he claims. He just makes things up like this all the time to serve his purpose as a fake climate crisis advocate, either without checking the REAL data or intentionally misleading for his agenda.
Published August 24, 2023
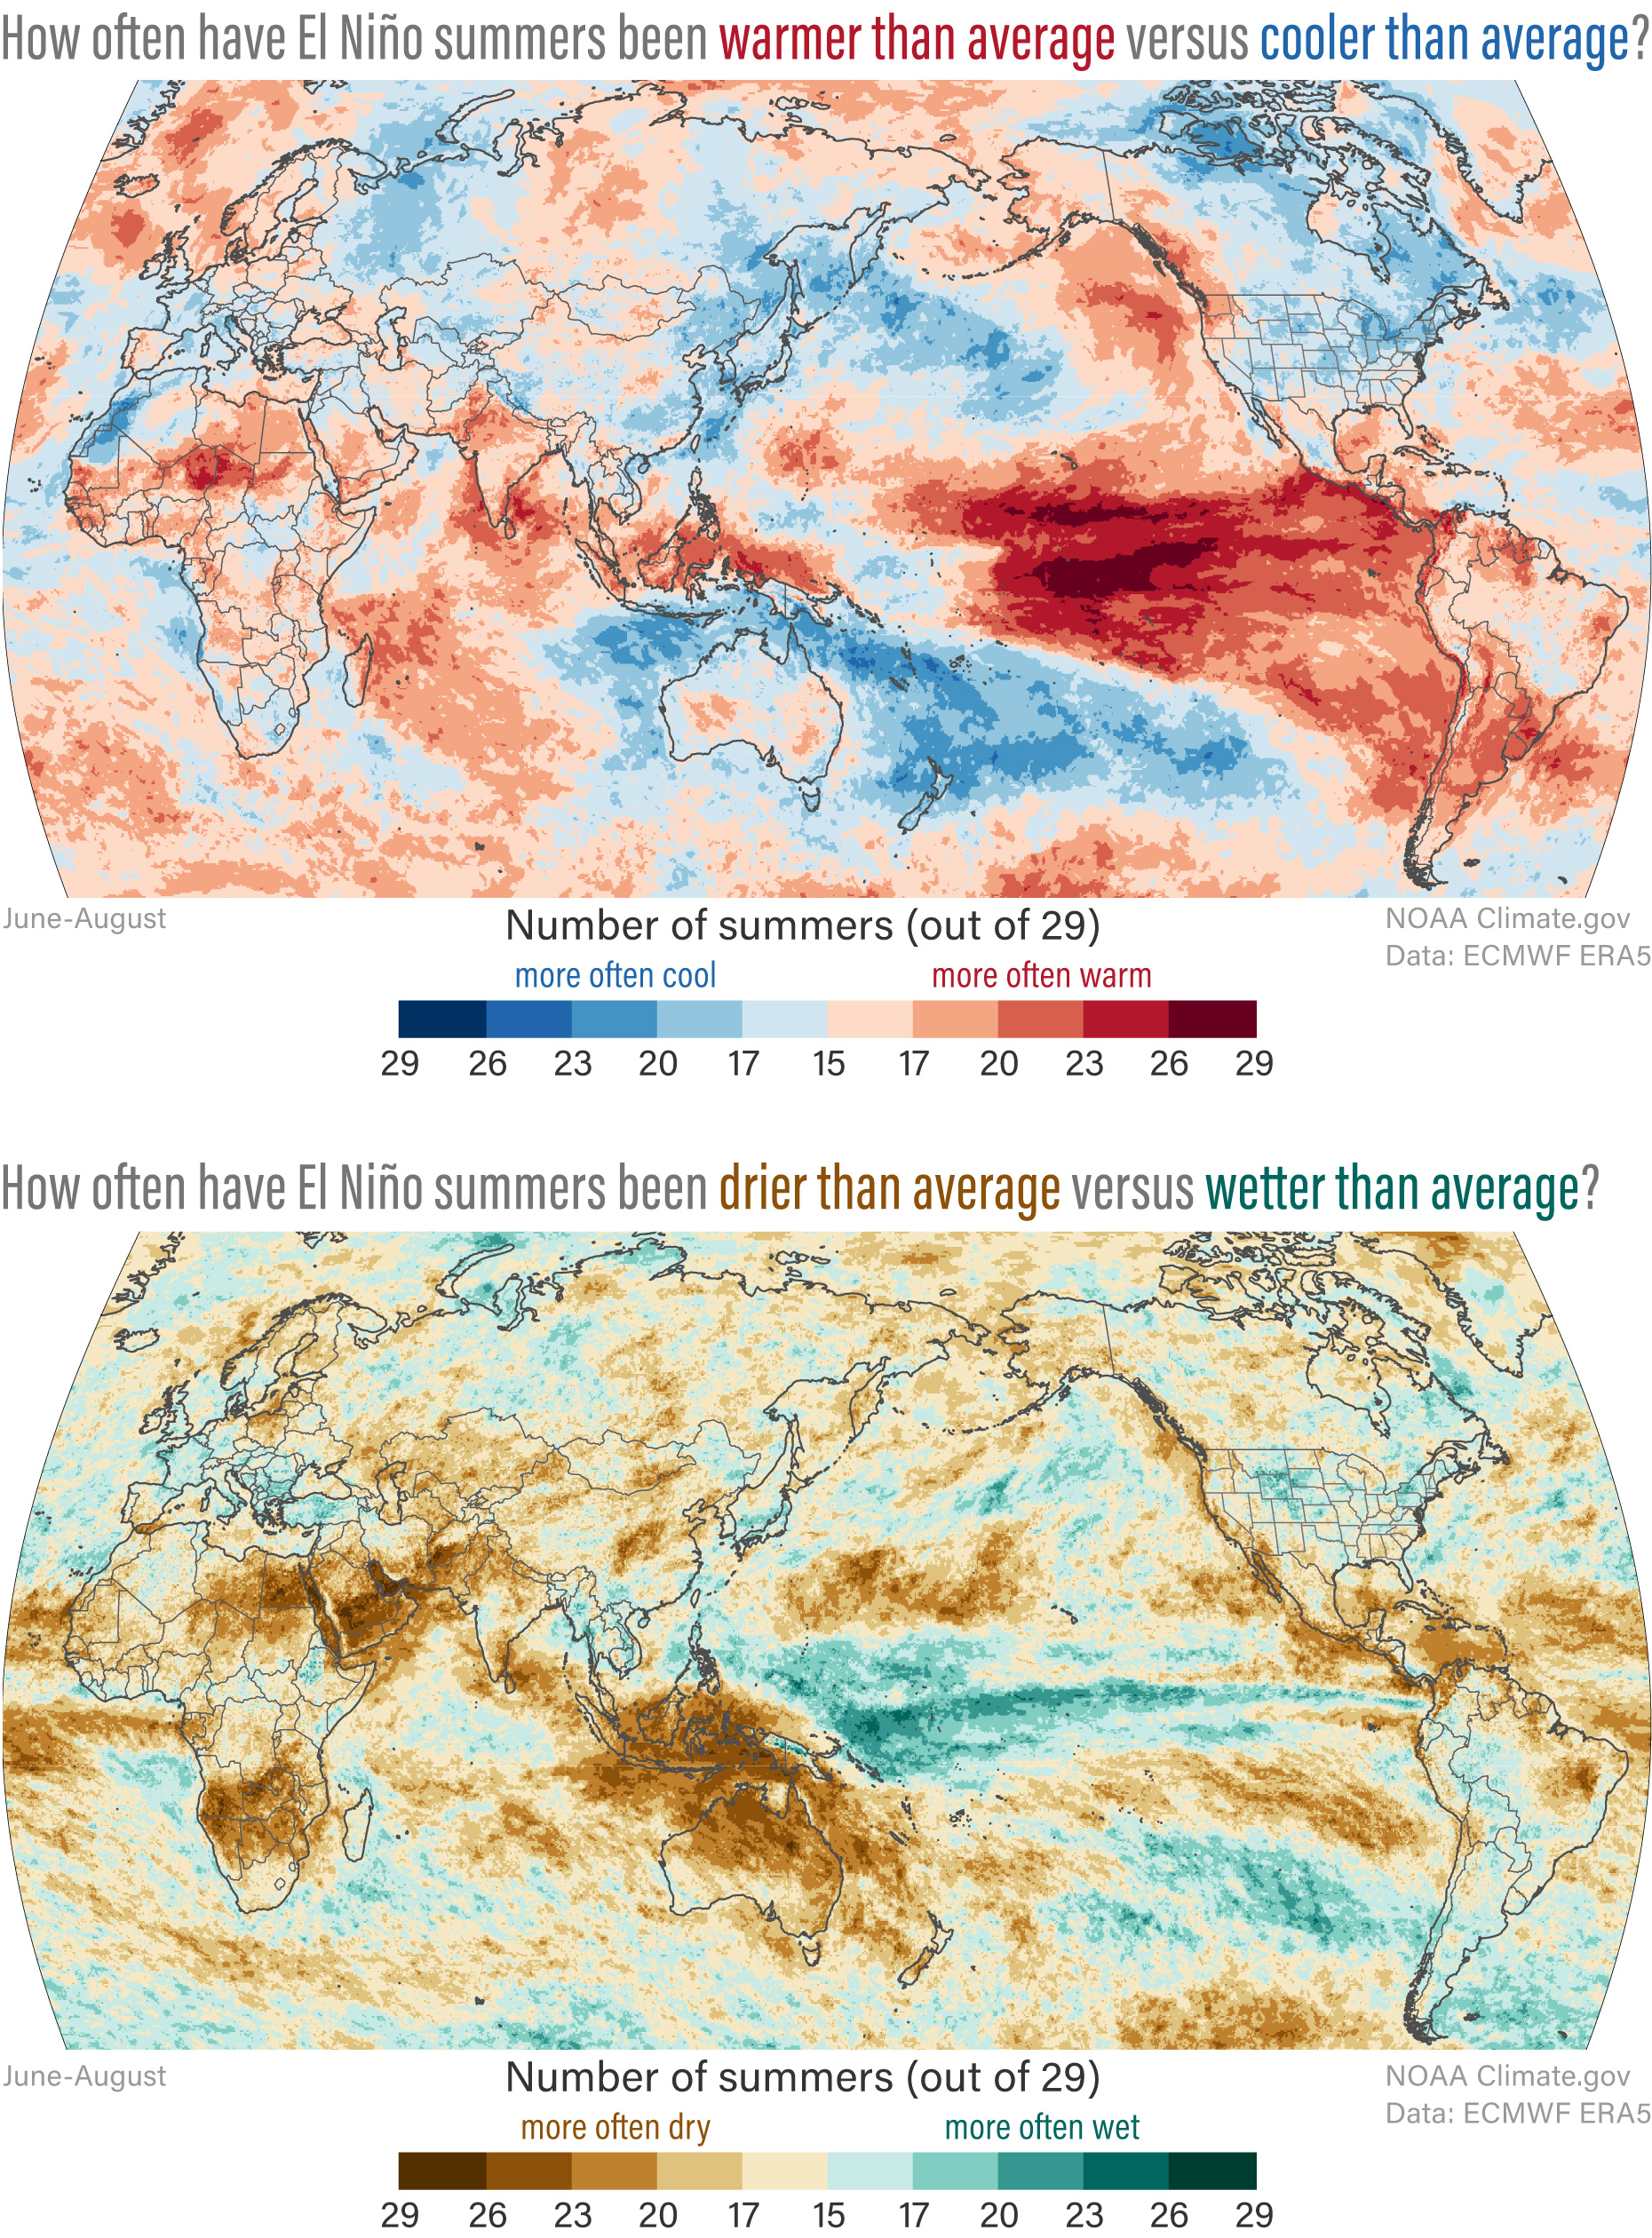
The sad thing is that this guy has so many followers that don't know a fraction of what he does about meteorology/climate and...........believe everything he says.
There is no question that this is a MAJOR heat wave, especially because it's hitting some of the highest population centers for several days but exaggerating this and everything related to climate is stealing people's intelligence.
This guy has been doing it for years. It's counter productive to educating people about authentic science/weather/climate.
I'll have to add this again from an objective meteorologist that follows the authentic science:
It really boils down to this, once again(Cliff Mass can be counted on as an elite source for using objective, authentic science)
https://cliffmass.blogspot.com/2016/03/the-golden-rule-of-climate-extremes.html
The GoldenRule
Considering the substantial confusion in the media about this critical issue, let me provide the GOLDENRULE OF CLIMATE EXTREMES. Here it is:
The more extreme a climate or weather record is, the greater the contribution of natural variability.
Or to put it a different way, the larger or more unusual an extreme, the higher proportion of the extreme is due to natural variability.
++++++++++++++
I've been forecasting Summer weather for 4.5 decades and can tell you, just from memory that most of our heat domes came during La Nina Summers.
This wasn't just a gaffe or slip of the tongue. He created a specific graphic to use with intentionally chosen words to teach people who follow him that this El Nino was part of the reason for the current heat dome in the United States.
There is no current teleconnection between the early stages of this El Nino and the current, very short lived Heat Dome in the United States.
But Jeff knows more than 99.9% of the people that listen to him. He can get away with saying anything he wants with impunity. Because he knows that, for YEARS now he's not been held accountable for his blatant exaggerations of a climate crisis that sometimes, violates principle of the atmosphere and biosphere..........when he's serving as a climate crisis advocate.
At least people reading this will know!
Unlike the United States, where I follow our weather all day long, every day and have records going back over 100 years, I don't have the same statistical grasp on the weather/climate in Europe, even though the same physical/meteorological principles apply.
This is a great article for THE authority on weather in Europe.
Author: Met Office
Our locker room back in those days had salt pill distributors. During football practice outside, when temperatures were in the 90's we would lose several pounds from sweat.
Today, they might cancel practice in a heat wave and make it a top priority to keep athletes hydrated by drinking tons of water. Back then, I remember the football coaches would not let us drink water thru most of the practice because they thought it made us tougher and absurdly, if they thought we were not giving 100%, they would actually not let us have any water. Seriously!
This is 2026, thank goodness!
This is the United States, thank goodness!
All-time heat records have returned to France! From the well respected with regard to accuracy Don Sutherland:
“All-time record heat returned to France today. The temperature reached as high as 109.4F (43.0C) today.”
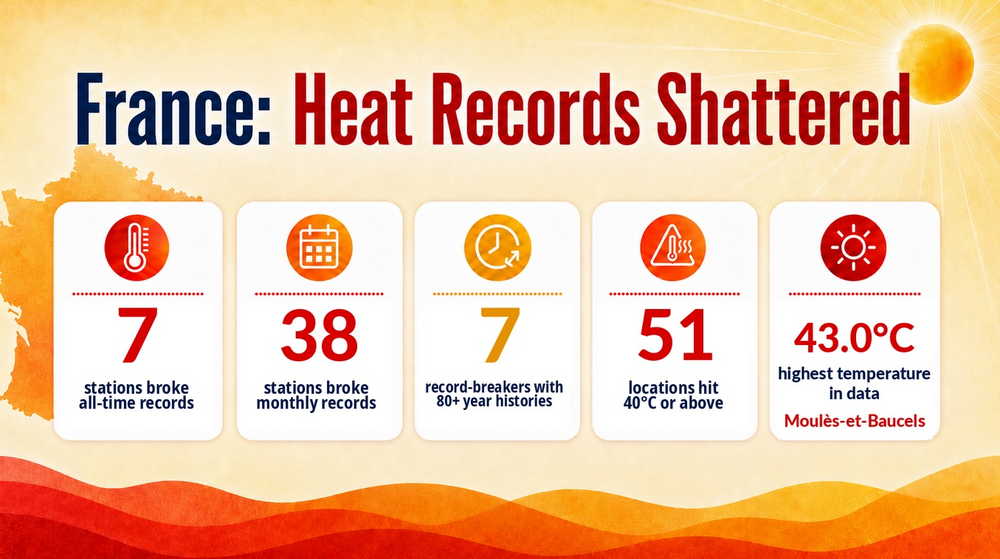
It would likely still be hot there without GW, but several degrees cooler. There’s nothing good about this extreme heat and it’s expected to continue at least into the weekend!
Thanks very much, Larry!
I agree with that. Historic, unprecedented heat that is so much worse because of the lack of air conditioning in most buildings!
It's almost impossible to imagine the Summer of 1936, here in the central United States when most days featured intense heat like this and NOBODY had air conditioning!!
Not to downplay this record OBLITERATING heat in Europe but instead, to be grateful for the blessings we have in the United States from adaptation!
Here's a link with weather from/for Europe:
