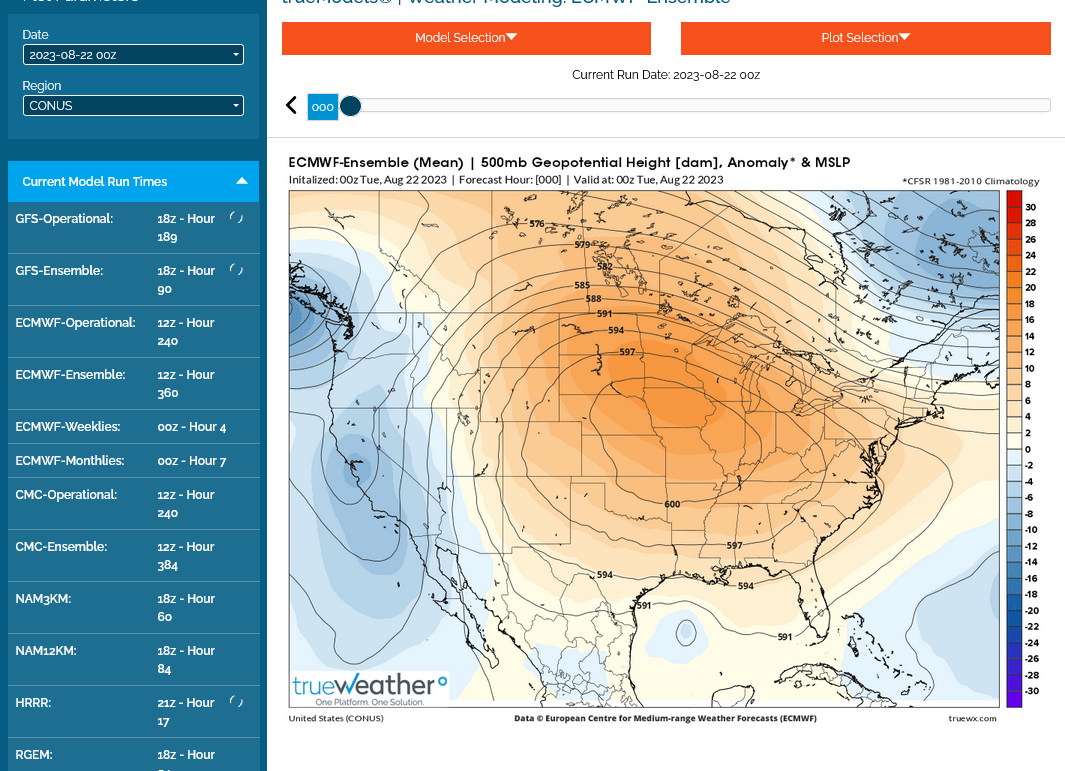
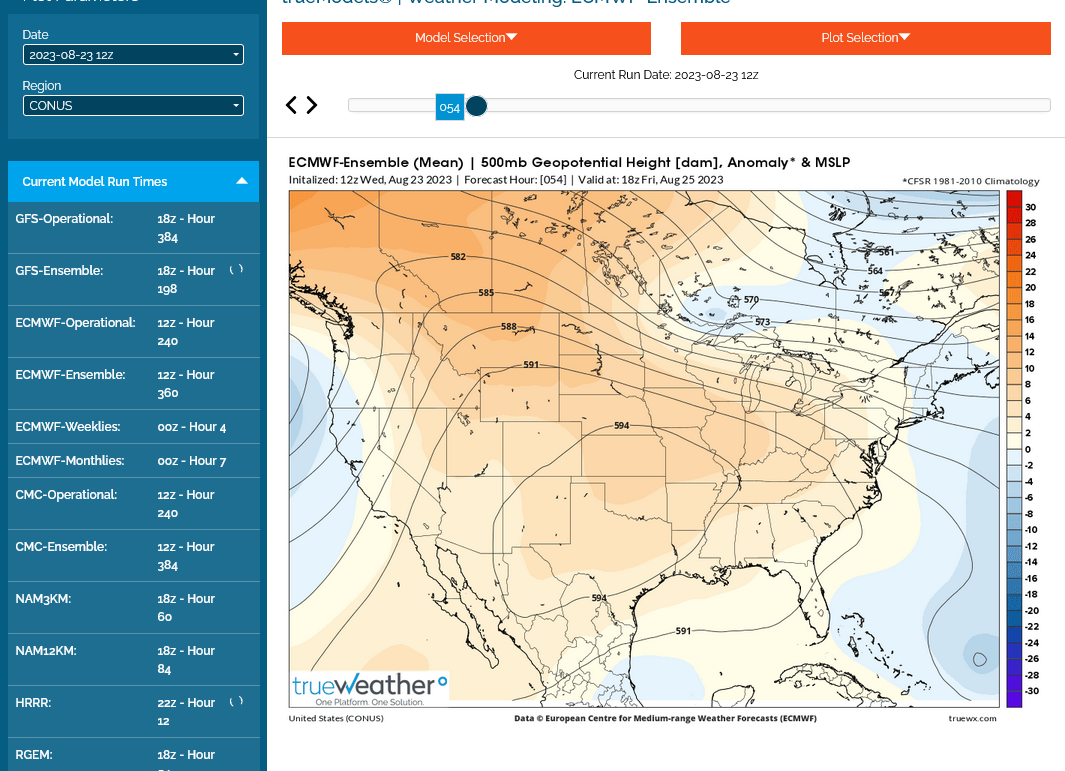
When meteorologists look at heat domes, we usually look at the 500 mb level. More explanation for that on the following pages.
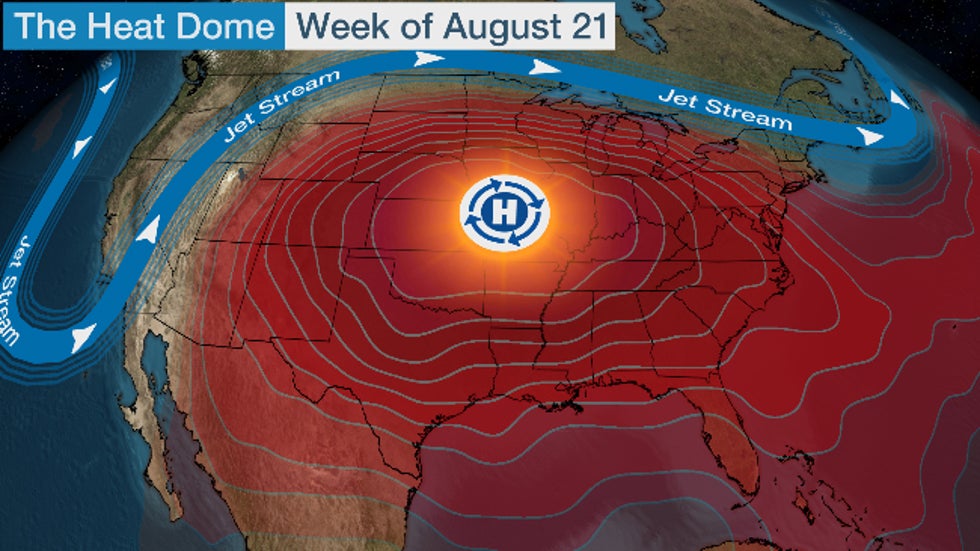
Earlier this week, the upper levels of the atmosphere were at some extremely lofty levels associated with this heat dome. A large 600 dm closed contour as shown below.
It looks to me like they peaked Monday evening, which is when I copied this map from the European ensemble. There are several factors that go into what causes record heat and just because you have a record 500 mb height level which is a measurement several miles above the ground, that doesn't always equate exactly to the hottest temperature at the surface (the amount of moisture at the surface and in the soil, the terrain and elevation play a role that can contribute 15+ degrees for instance. However, generally speaking, the greater the 500 mb heights are, the hotter the temperatures will be at the surface, all other things being equal.
Looking at the extremely impressive, huge 600 dm contour below, every meteorologist thinks "near record or record heat, 0% chance of rain anywhere close to it.
Here in Evansville, IN, we were inside the 600 dm contour on Monday with a high of "only" 92 degrees, which was not close to the record.
A big reason for that was because our dewpoint was extremely high too, at 77 deg. It's much harder to heat humid air than dry air. Had the dewpoint been 65 or less, we would have likely been able to hit 100 with this same heat dome!
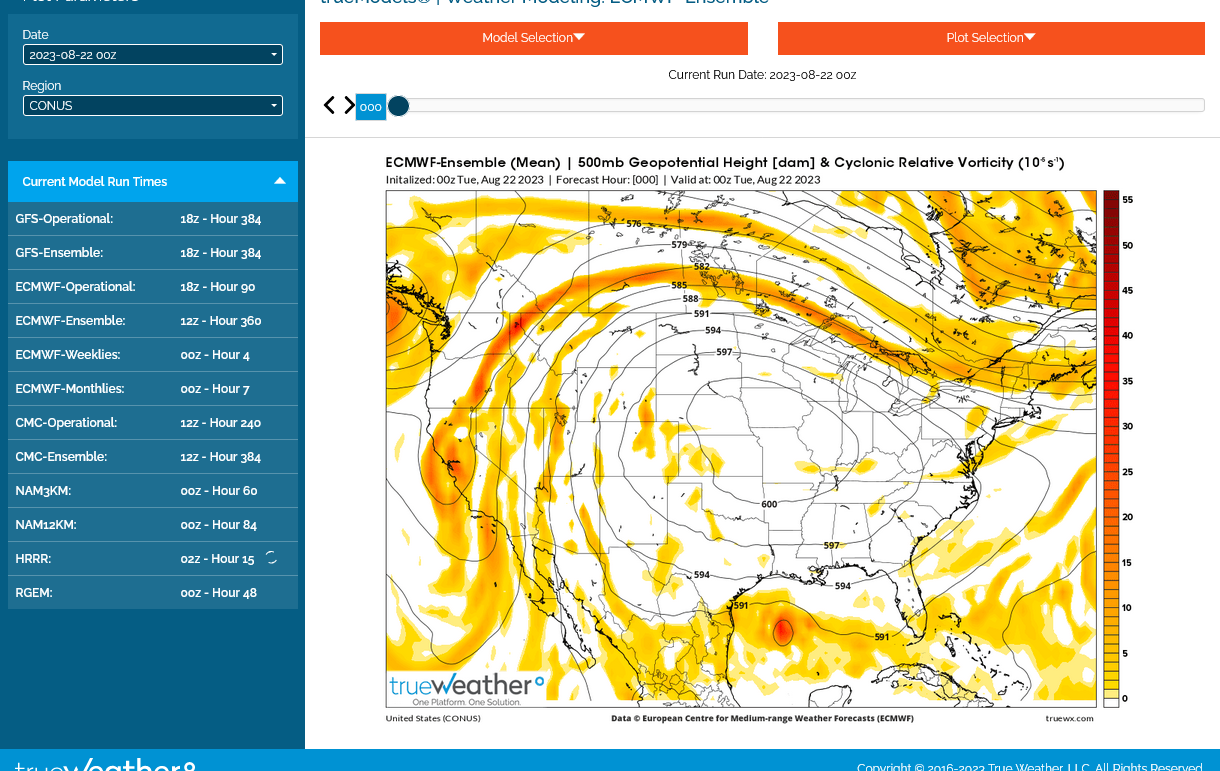
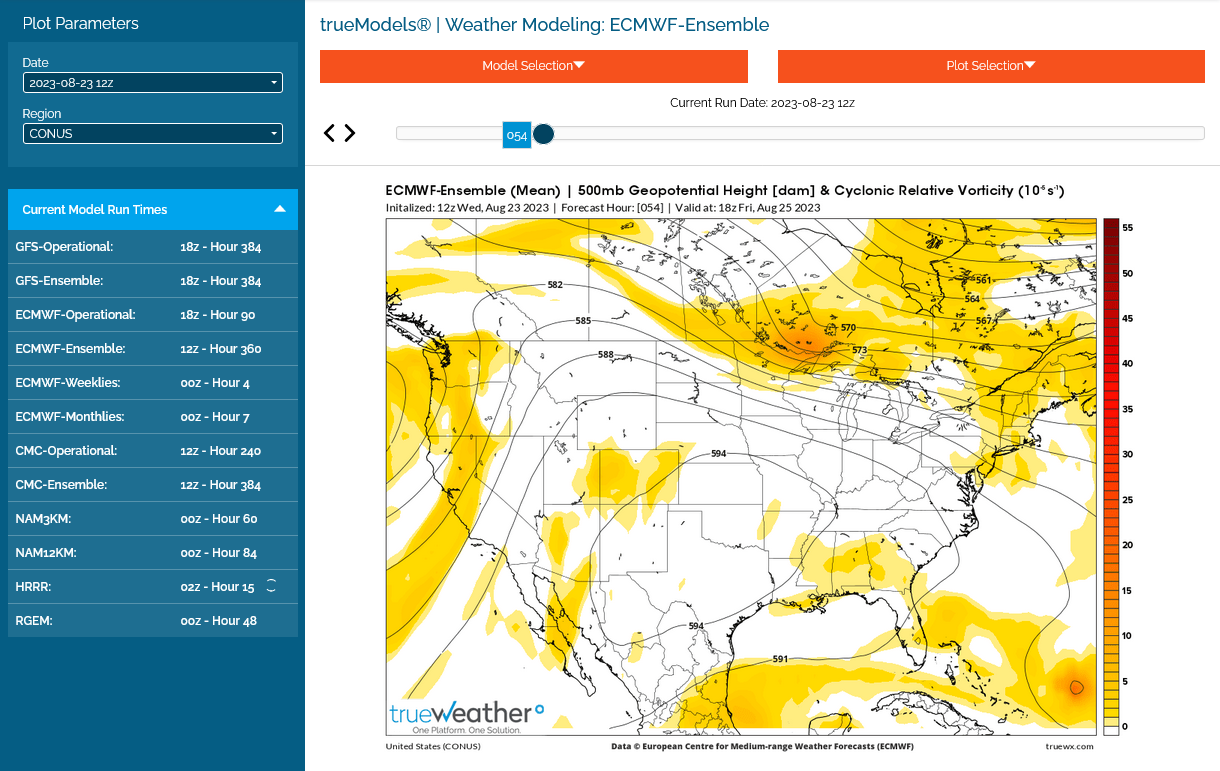
500 mb with vorticity below
++++++++++++++
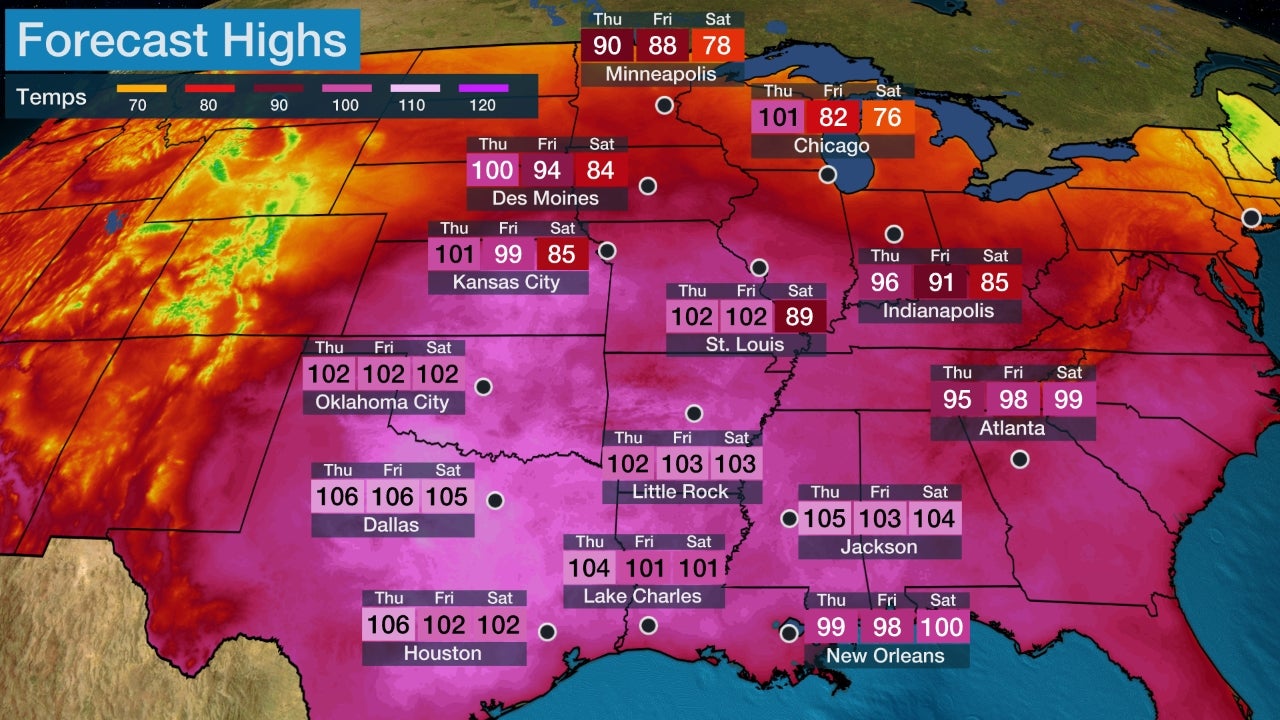
The 500 mb heights are falling here now. Below is what they will look like on Friday, when we are just outside the 594 dm contour. That's still VERY impressive. However, the ground is drying out and dewpoints will be a bit lower and the core of the hottest air at the surface will be blown in from the southwest, so we have a shot at 100 on Friday.
You can see the big kink in the height contours in the Upper Great Lakes then. That's the 500 mb, upper level part of the perturbation which is sending a pretty decent surface cold front down from Canada that will cool the temperature down 15+ degrees next week!
The 2nd map shows vorticity, which is a measure of spin.
The value of vorticity is not as important as is the rate of change by which vorticity increases or decreases.
Downstream from (ahead of) areas of maximum vorticity are the locations of the greatest rate of increase in vorticity. This implies an area where air converges at the low levels and, therefore, rises into the atmosphere, possibly leading to precipitation. We call those areas PVA or positive vorticity advection.
You'll note on the map above with the vorticity and the one below, that inside the strongest part of the dome, there is no vorticity or spin. With very warm air aloft associated with heat domes, it "caps" the heat below from being able to continue to rise with enough gusto to cool and condense moisture into clouds.
This capping of the atmosphere from extremely warm air aloft, effectively defeats the rain making process inside the dome and anywhere close by with the very warm air aloft.
So here's the deal with this cold front that cools us off at the surface this weekend:
There will be enough lingering very warm air aloft from the dome, when the cold front undercuts it at the surface so that the normally strong lift from the cold front will be suppressed. We need cooler upper levels (lower 500 mb heights) to help the air at the surface to be more buoyant/rise with enough gusto and cool to condense out moisture for clouds/rain making.
The higher the 500 mb value, the more stable the air because of warmth aloft.
The lower the 500 mb levels, the more unstable the air.
Bottom line is 500 mb levels will still be high and unfavorable for much rain in Indiana with this cold front.
500 mb with vorticity below
https://www.noaa.gov/jetstream/upper-air-charts/constant-pressure-charts-500-mb
+++++++++++++
With HT @GregCarbin re: TOP, I've found four locations that set new 500mb height (#heatdome) records in this heat wave: North Platte, NE; Omaha, NE; Topeka, KS; Springfield, MO
++++++++++++++
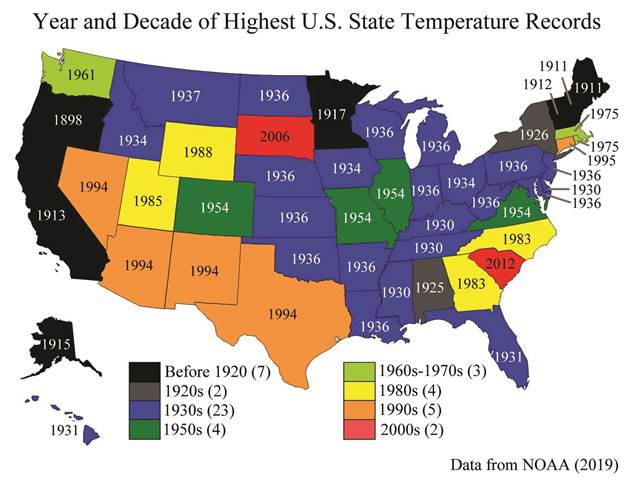
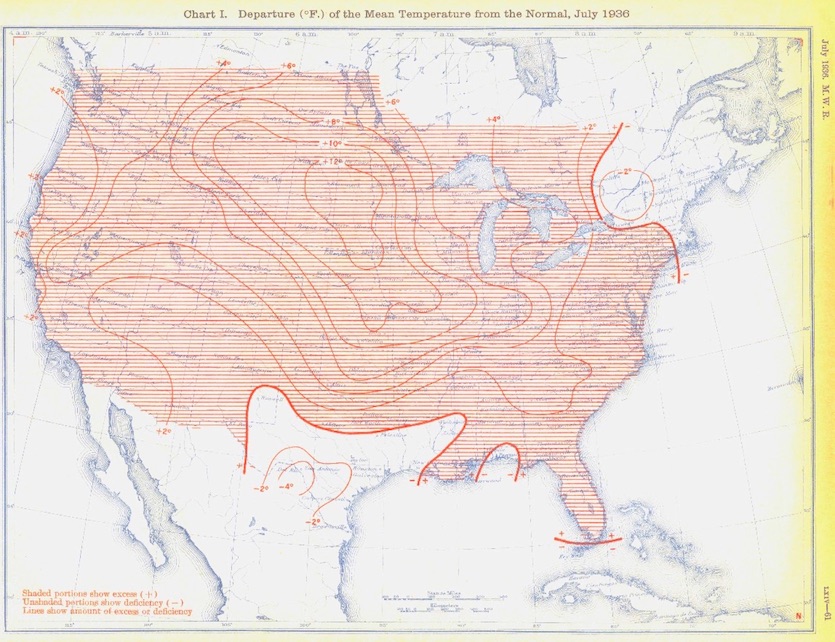
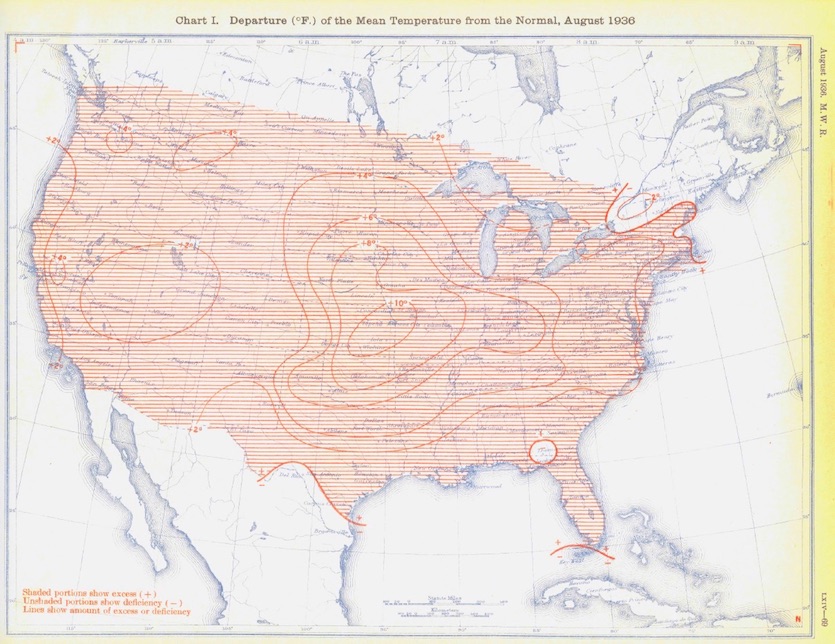
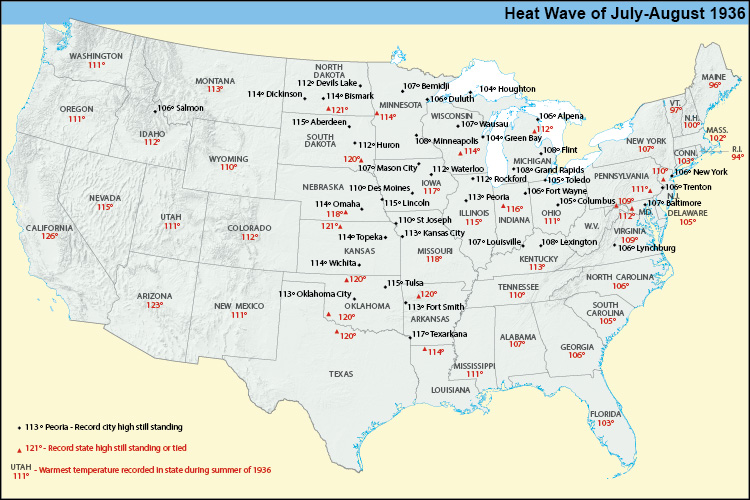
This is pretty hot but it's not close to the hottest, which was July/August 1936!
Long time producers in the Midwest and Plains with generations in farming surely had parents/grand parents with stories about the REAL climate crisis in our growing region.........the 1930's Dust Bowl.
July/August of 1936 were especially hot!
https://www.wunderground.com/cat6/North-Americas-Most-Intense-Heat-Wave-July-and-August-1936
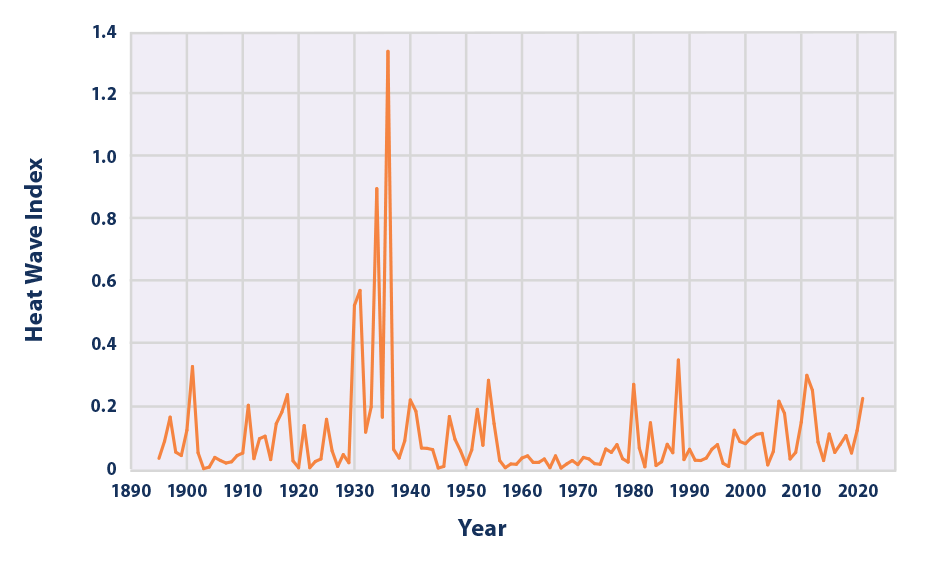
From the EPA, which they hide on a back page, while showcasing graphs that start in 1960 on their opening page, using blatantly dishonest science.
https://www.epa.gov/climate-indicators/climate-change-indicators-heat-waves
Figure 3. U.S. Annual Heat Wave Index, 1895–2021
Can you imagine if we had these things happen today?
One reason that we don't is the climate change IS PROTECTING US!!!!
https://www.marketforum.com/forum/topic/97710/#97769
The Dust Bowl for almost an entire decade of the 1930's was the worse climate disaster in U.S. history BEFORE climate change. The current climate OPTIMUM is actually helping to protect us from another Dust Bowl.

++++++++++++++
Another thing for the world to be grateful for with global warming and the extra CO2. It makes this below MUCH LESS likely:
Greatest climate crisis in history 1876-1878. 50 million died, 3% of the global population. Climate and the Global Famine of 1876–78 https://journals.ametsoc.org/view/journals/clim/31/23/jcli-d-18-0159.1.xml During the late nineteenth century, a series of famines affected vast parts of Asia, causing mortality on a scale that would be unthinkable today (Davis 2001). Of these, the so-called Global Famine lasting from 1876 to 1878 was the most severe and widespread in at least the past 150 years (Hasell and Roser 2018; Gráda 2009; Davis 2001). The Global Famine inflicted acute distress upon populations in diverse parts of South and East Asia, Brazil, and Africa, with total human fatalities likely exceeding 50 million. These famines were associated with prolonged droughts ... |
This isn't from the planet "being on fire" because of a climate crisis.
Probably 2 deg. F of the heat can be blamed on climate change. The rest is from natural variation. Since it's occurring over the huge cornfields of the Midwest, the impact from an increase in CO2 is being muted from evapotranspiration and the massive, 26% increase in vegetation BECAUSE OF the climate optimum!
The map below shows 850 mb temperatures for the entire northern hemisphere.
There is nothing extremely unusual with numerous hot spots and numerous cool spots as we ALWAYS see around the planet.
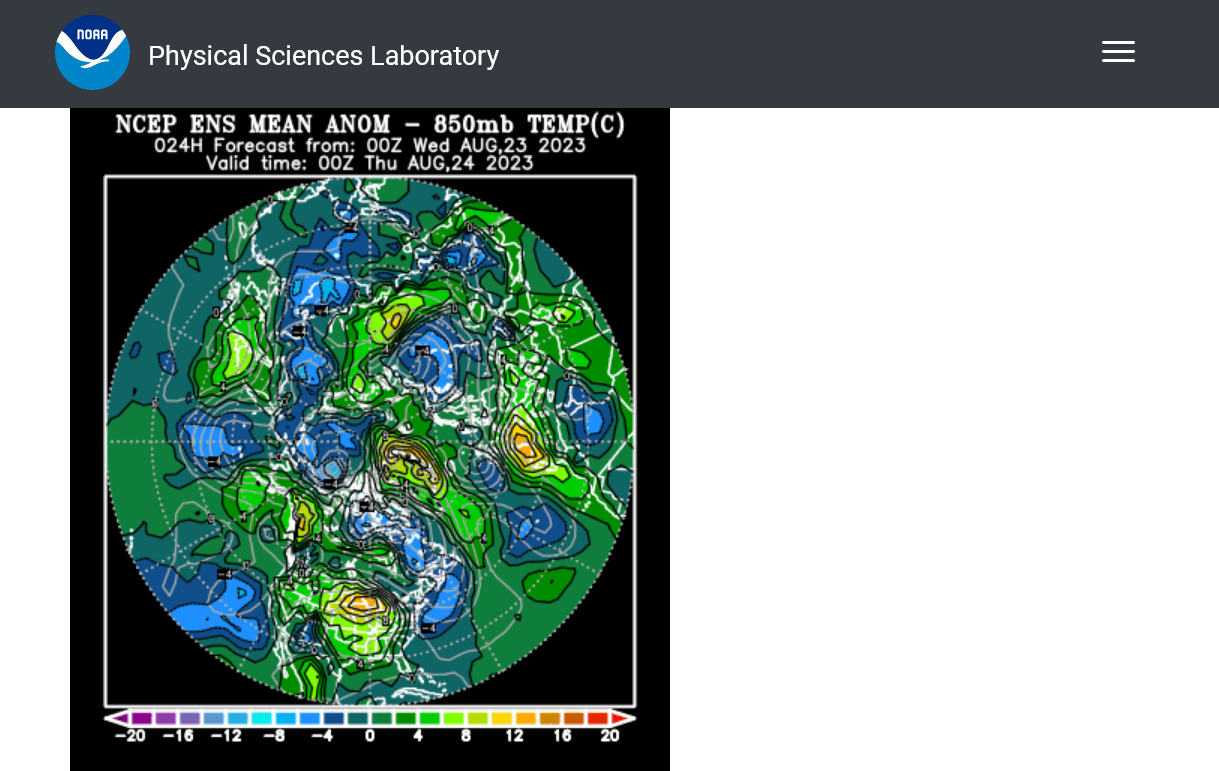
In the Summer ALL the reporters go to the hot spots to report the weather. Right now, the biggest one is on top the entire Midwest. This is is only our 2nd heat wave of the entire Summer, here in Indiana has had below normal temperatures overall, until the last few days which will last thru this week.
Added: You remember when all the reporters went to Phoenix in July to report on their record heat from natural variation?
Outside of that heat wave, the Summer in Phoenix has been COOLER THAN AVERAGE!
All I know is that I have been seeing hot and dry in the NWS 6-10 day forecast for at least 2-3 weeks and all we have been getting here in NE Ohio is rain. My grass is a vibrant green. My neighbor has a pond in his front yard.
Thanks, Jim!
Ohio has been the garden spot for this Summer's weather!
Corn is 74% G/E(only 4% P/VP) PA is an incredible 86% G/E. Mike the Plumber must be seeing green everywhere he looks!
Ohio ...........: 1 3 22 63 11
Beans 72% G/E. Record crop coming for The Buckeye State in 2023 for both crops! PA doesn't grow much beans.
Ohio ...........: 1 3 24 61 11