
Get all the comprehensive weather here:
https://www.marketforum.com/forum/topic/83844/
++++++++++++++
6-25-26 MAJOR heat(humidity) wave coming next week
Started by metmike - June 25, 2026, 3:49 p.m.
https://www.marketforum.com/forum/topic/121123/
+++++++++++++++++++++++++++
Previous threads:
GRAINS June 14,
56 responses |
Started by tjc - June 14, 2026, 11:38 a.m.
https://www.marketforum.com/forum/topic/120817/
++++++++++++
Grains 5-19-26
45 responses |
Started by metmike - May 19, 2026, 10:49 p.m.
https://www.marketforum.com/forum/topic/120325/
++++++
During the growing season, threads on this topic fill up extremely fast!
Regardless of how bullish (or not) the USDA numbers look at face value, the markets told us much more by their immediate reaction after the release.
Corn shot up 10c, wheat +15c and beans +20c.
This was also my last post at the previous thread which "might' have something to do with that and our ability to hold much of those gains(the weather changes)
By metmike - June 30, 2026, 10:43 a.m.
Overnight, the week 2 AND July forecast from the European Ensemble model was even a bit more bullish.
That was not the case for all the other models although the GEFS July forecast is a bit hotter/drier in the WCB.
The USDA will determine prices for the rest of this session in just over an hour.
I will keep open the possibility that the EE, although an outlier that's getting low weighting.........could be right.
+++++++++++
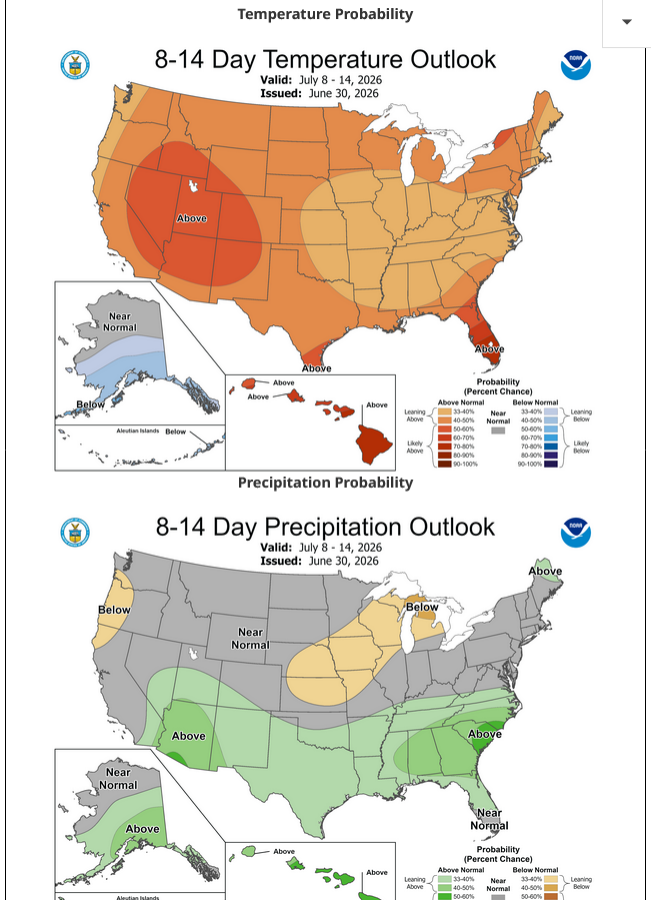
The just updated NWS week 2 forecast shows the potential bullishness. Though we have northwest flow, it's still very warm and potentially on the dry side.
Certainly enough to make sellers cautious, when a small shift in the location of the dome can slip the July forecast to HOT and DRY for the WCB overnight.
https://www.marketforum.com/forum/topic/83844/#83852
++++++++++
I need to go get my 3 year old grandson, Cyrus from day care and will add much more later.
Only a mediocre baseball hitter can make more money than weather forecasters. Wrong/right every four hours. Pathetic.
Thanks, tjc!
Glad you think so well of the field of meteorology
I wouldn't have opened my first account with $2k at IRA Epstein (because all he other firms required $5k and all I had was $2k)) in 1992 if not for this impact on the markets from the weather.
The price of corn, beans and natural gas actually change even more than the weather which is what makes trading them so challenging and profitable.
Incredibly, the skill at forecasting weather has greatly improved during the 45 years while I've been a meteorologist.
In the 1980's, the extended forecast was the 3 to 5 day outlooks. Then in the 1990's the 6 to 10 day. Shortly after that the 8-14 day outlook which is often the most important time frame for traders because it has the most changes.
Change = profits if you're positioned for it before the market dials it in.
Being a meteorologist is the most fun and challenging profession imaginable and only because the weather models/patterns and forecasts are always changing.
The main objective every day isn't to look for reasons why yesterday's forecast is still right.
Just the opposite. It's to look for reasons why yesterday's forecast might be wrong in order to CHANGE IT so it's even better than yesterday's forecast and hope that tomorrow, maybe you can make it better again.
My first few months at WEHT in Evansville, IN, back when we didn't even try to forecast beyond 5 days I told 10's of thousands of viewers what the weather was going to be like for the next 5 days, including at 10 pm.
That's the last thing those people would remember and some of them might not be watching the next day if I updated the forecast. So I was immersed in a biased mindset that cared too much about yesterday's forecast being right.
Just like with a trader in a losing position cutting their losses, same thing with weather forecasting. What a trader did LAST just like what the meteorologist predicted LAST is what counts the most, like most actions in life.
Also holding oneself accountable for busted forecast and changes, while using solid reasoning in the updated forecast philosophy.
U.S. corn acres land above expectations and nearly equal with the March figure. Soybean plantings rise as expected from March, but wheat acres fall well below expectations.
June 1 U.S. corn stocks land below all trade estimates. Soybean stocks come in above the average estimate while wheat stocks are a bit lighter than expected.
2026 U.S. wheat plantings land below all trade estimates, maintaining its title as the smallest wheat area since records began in 1919. Spring wheat plantings will be the smallest in 56 years. Winter wheat acres come in below all estimates at a six-year low.
++++++++++++++
U.S. cotton plantings land near the top of trade expectations, up 6% from last year. Rice acres come in below all analyst estimates, down 28% from last year.
+++++++++++
USDA's June survey reveals U.S. corn area nearly identical to the March survey. Plantings rose in Illinois, Nebraska, North Dakota and the Delta, while Iowa was among the states trimming acres from March. Dryness also cut 150k acres in Texas.
++++++++++
USDA's June survey found 2026 U.S. soybean acres up 0.8% from its March survey, the largest increase for this report in 10 years. The trend among top-producing states was mixed, though stronger plantings in Kansas and Ohio helped boost overall area.
++++++++++
metmike: MIND BOGGLING!!! The last time this amount of wheat was harvested was less than 20 years after the Civil War!!!
USDA projects U.S. farmers will harvest just 32.1 million acres of wheat in 2026. That would be a 149-year low, the smallest harvested area since 1877.
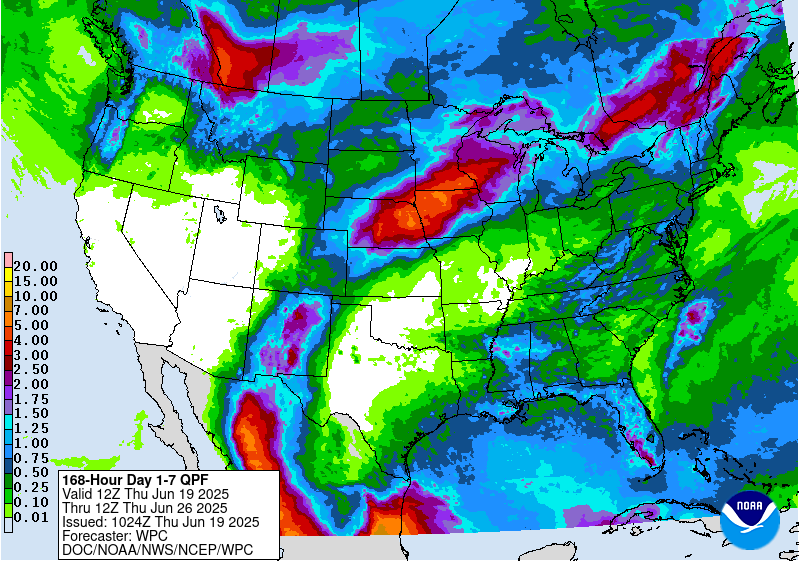
We've been adding rains to week 1 in the Upper Midwest. Many areas of the Central/Eastern Cornbelt will benefit from this week after dry weather. No this much heat and the humidity is too high (warm/muggy nights) which could contribute to disease pressure in the waterlogged areas.
7 Day Total precipitation below:
http://www.wpc.ncep.noaa.govcdx /qpf/p168i.gif?1530796126
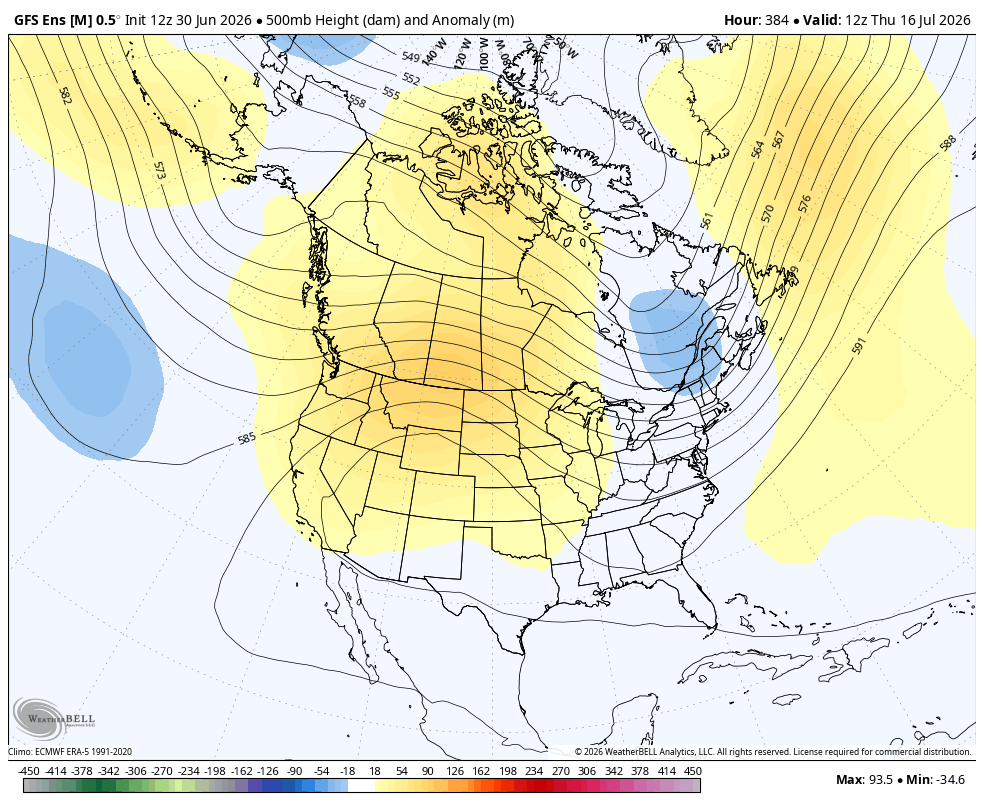
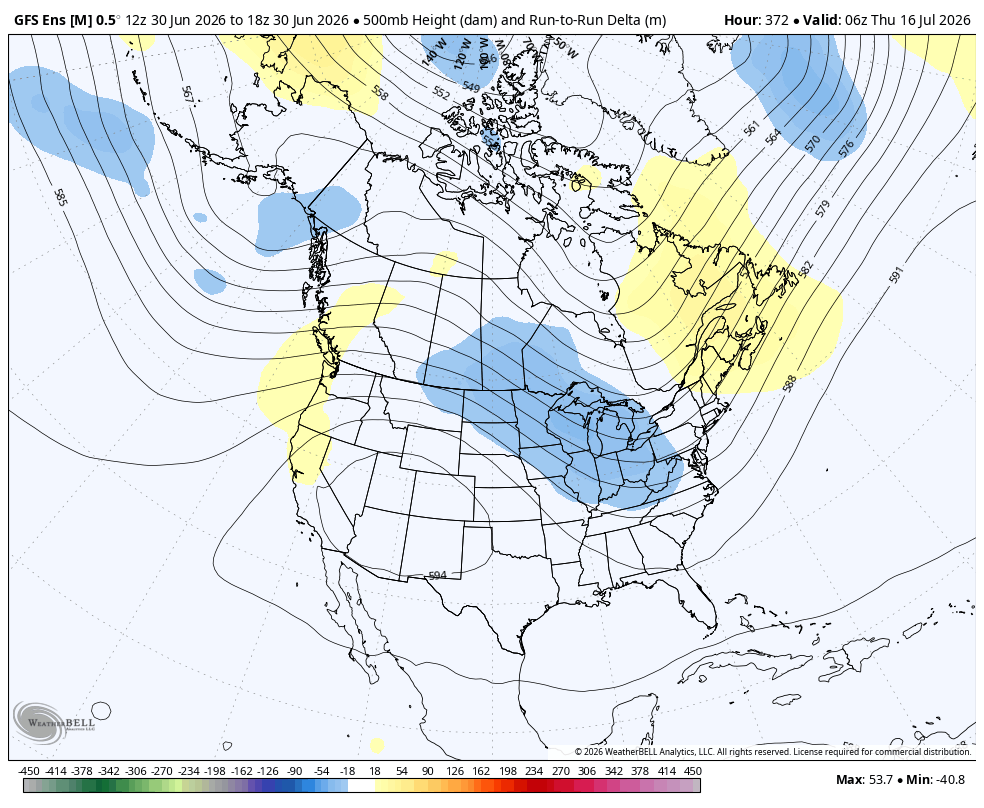
1. This was the last 500 mb map of this last 18z GEFS run on July 16th.
2. This was just the change from the previous 12z run. Bearish! Lower 500 mb heights (in blue) across the entire Cornbelt. Strengthening northwest flow. Cooler temps.
1. This last map on day 16 of the last 0z Canadian model builds the 594 dm heat dome farther north.
2. Previous 0z run from 24 hours ago.
https://weather.gc.ca/ensemble/charts_e.html?Hour=384&Day=0&RunTime=00&Type=gz
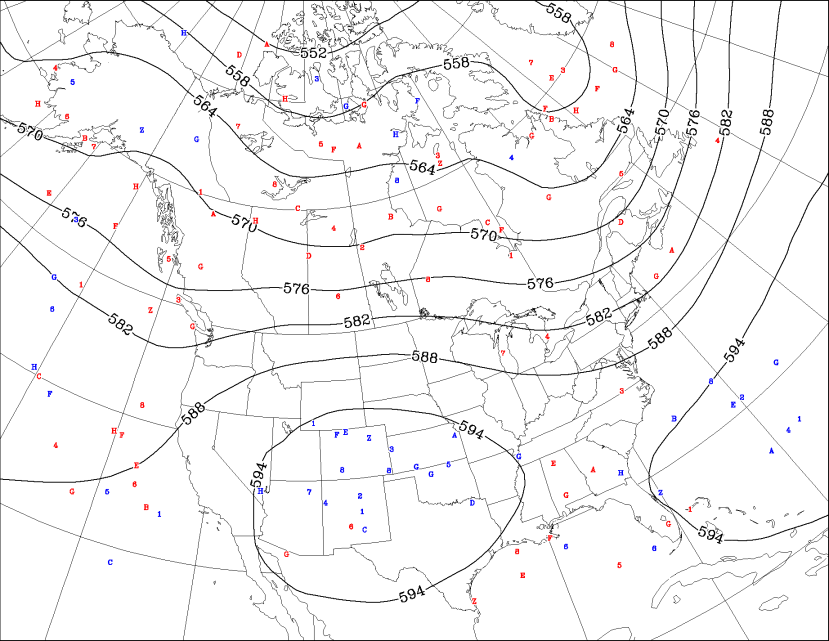
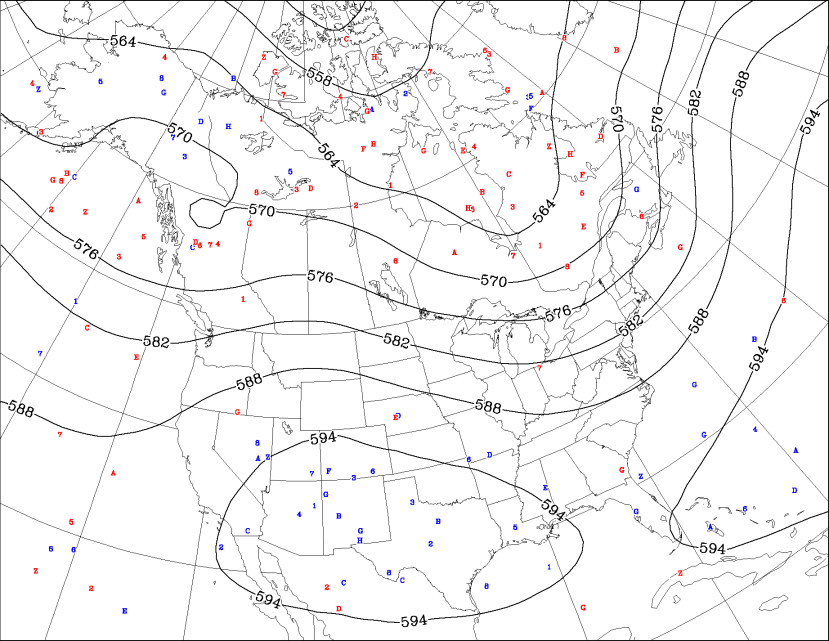
this,latest 0z GEFS on the other hand is coming,out cooler than previous runs.
Good morning
Trust everyone "noticed" my frustration at the ever changing weather forecasts. It 'hurts' to be right (long), set reasonable stop, then get hit, only for a turnaround to prove you were correct. Happens frequently, but exasperating.
MetMike handled my frustration with a VERY well written reply. I just hope HE recognized a frustrated trader venting!
I believe Mike would agree---better to be stopped than to allow a huge loss.
Thanks, tjc!
I totally get it and try to avoid a mindset that takes things personal but instead, try to understand the mindset of the other person.
Below is the story of the Summer that I had your frustrated mindset during all of July(after the 4th) for the rest of the growing season and it paralyzed my ability to trade because of being devastated by a loss of 60% of the account, having sell stops hit on the lows for Summer.
Compare that to other example when I lost almost 50% of the account(with market orders to get out of longs on the open Monday morning that was the smartest trading decision of my life because staying in for 10 more minutes(which is what every broker advised me to do) would have lost MORE THAN was in the account with a lock limit move.
Re: Re: Re: Re: Re: Re: GRAINS June 14,
By metmike - June 26, 2026, 7:19 p.m.
I have the luxury and advantage of knowing what the weather models show right when they come out. You have to wait X amount of time to find out. Even if I'm posting the change here in somewhat timely fashion, it's often while showing how the market ALREADY reacted. You have to have protective stops in.
What you may be overlooking when you get stopped out is that thinking you were right in the beginning and just early in a weather market. That's what actually happened to me with my biggest loss but over leveraged. I was right FOR THE RIGHT REASONS, my weather analysis in a market trading exclusively on weather which, in the end will TRUMP everything else.
In this case, you were trading your technical, timing, cycle formations and other stuff while using weather too. Those all move AFTER the weather changes in the mind of the market (Composite Man).
You are following what the market thinks AFTER the earliest and biggest weather traders know the latest forecasts. I am trying to beat them by putting on the position BEFORE they start loading up and before the technical indicators others use send out buy or sell signals.
You are successful at what you do, I'm just saying that the only reason I ever got into the trading business is having a huge edge over everybody else using the weather.
In the 1990's, I had a satellite dish on my roof getting weather information an hour before the market and I turned 2k into 500k in 7 years. I made $579,000 581,868 in 1999, which was my best year ever! I just checked and corrected that income from trading number. Those were the (trading) days my friend.
https://www.youtube.com/watch?v=JnxTT7XXMPA
I can't do that anymore. Every body else has the same weather service that I do and on the internet. A few of them use in house models for just the US that get the data FASTER than me. I can still make money, especially when the weather forecast is changing the most which is often when your positions are most at risk.
I will never feel bad that I can no longer take candy from the market babies like in the 1990's. It was great while it lasted and I worry more about my health now and staying up all night to babysit a weather trade kicks my butt the next day so I try to minimize that as much as possible.
Also, I had my 6 figure account taken on October 31., 2011 by Jon Corzine, raiding all the segregated accounts to make a margin call on his huge $2 billion European bond position.
Then, I borrowed all the money I could to open a new account at PFG Best(and put the money that came back from MGF in there. They bankrupted in July 2012.
And this isn't the 1990's anymore. I can't make all that back. At least I was able to claim the losses on my tax returns and didn't have to pay any Federal taxes for a long time.
cutworm,
I didn't forget our discussion last week about the weather in 1983 which changed from a wet and cool Spring to suddenly one of our hottest/driest Summers in history.
Here's a site that goes back to 1948 thru 2011.
Go to this link
https://www.wpc.ncep.noaa.gov/ncepreanal/
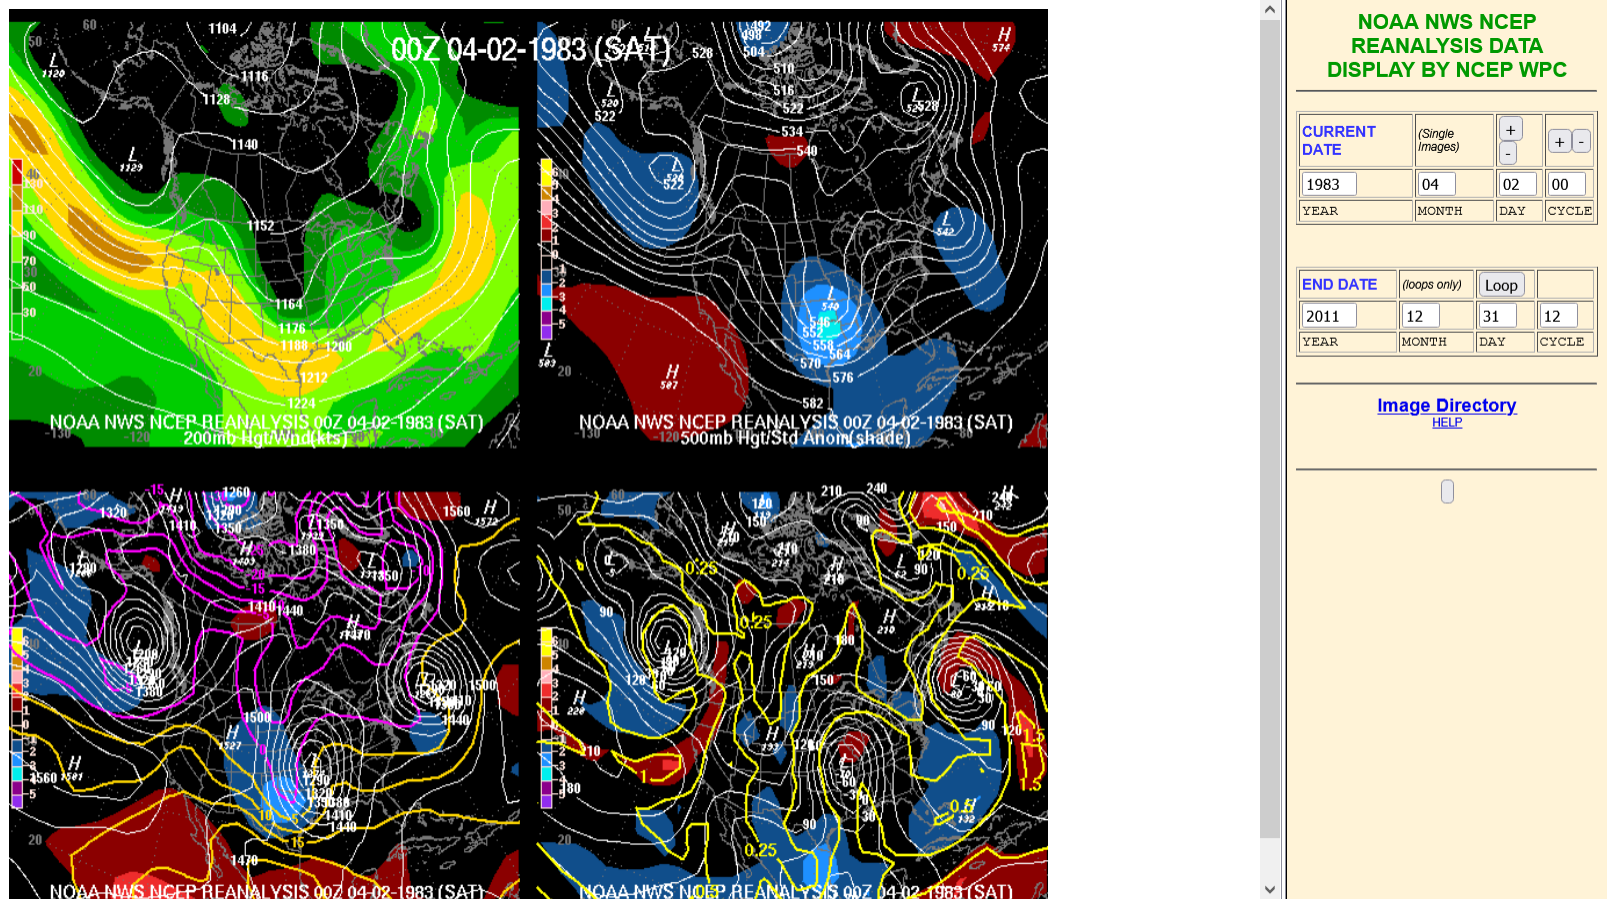
For the CURRENT DATE: Put in 1983, 04, 02, 00 To start on April 2, 1983. (you can use whatever numbers you want)
For the END DATE: Put in any date later than that so you can advance manually from the current date.
This is what you will start with below. Then just hit the + button above the date and move forward thru 1983.
This is April 2, 1983
This is July 4, 1983...........the very end of that wet/cool regime that had lasted for the previous 3 months.
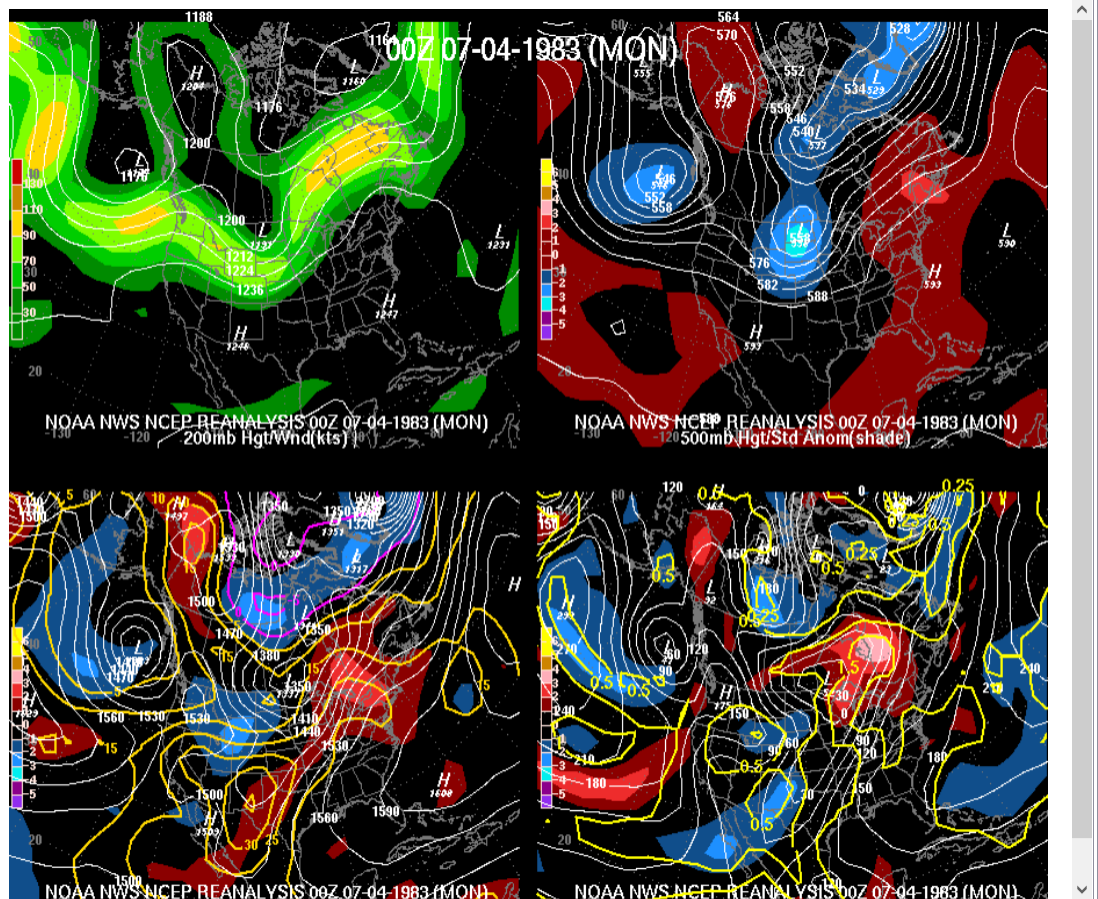
BOOM!
Who flipped the atmospheric switch???
This was July 8, 1983 and the new pattern with a huge 500 mb dome that lasted for most of the rest of that Summer!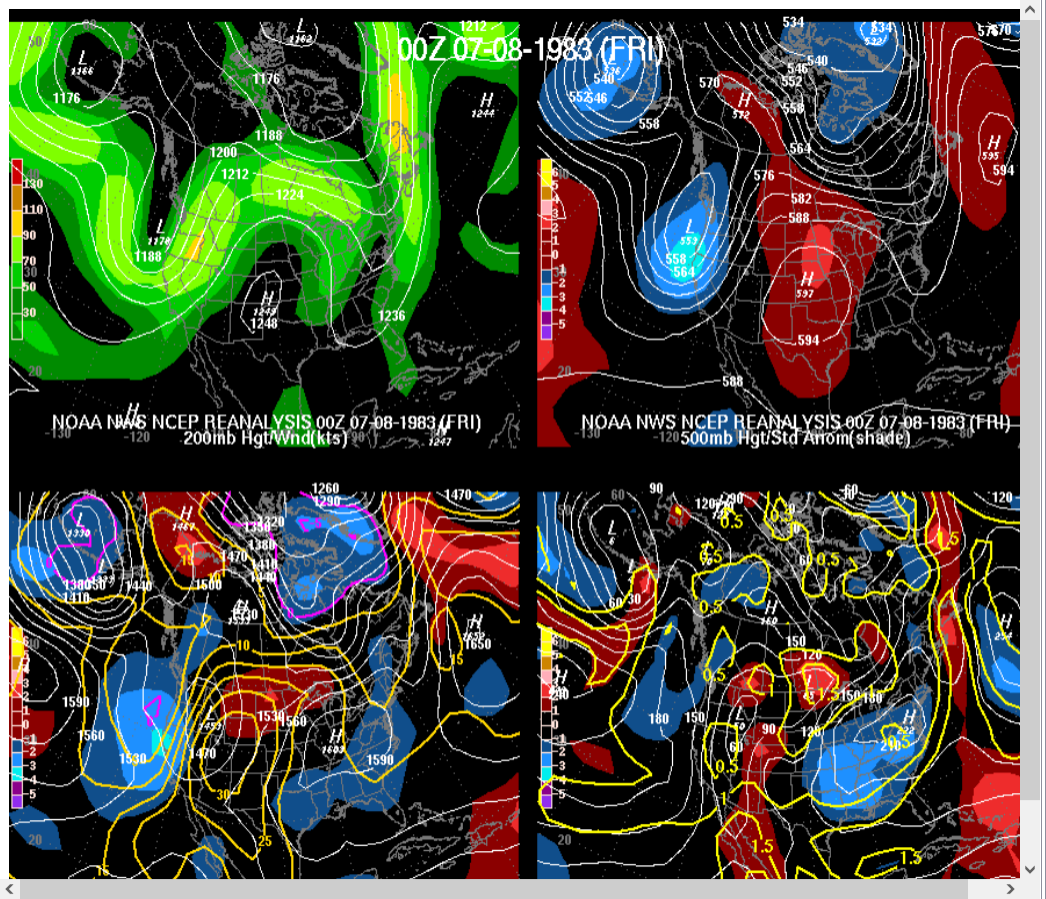
+++++++++++++++++
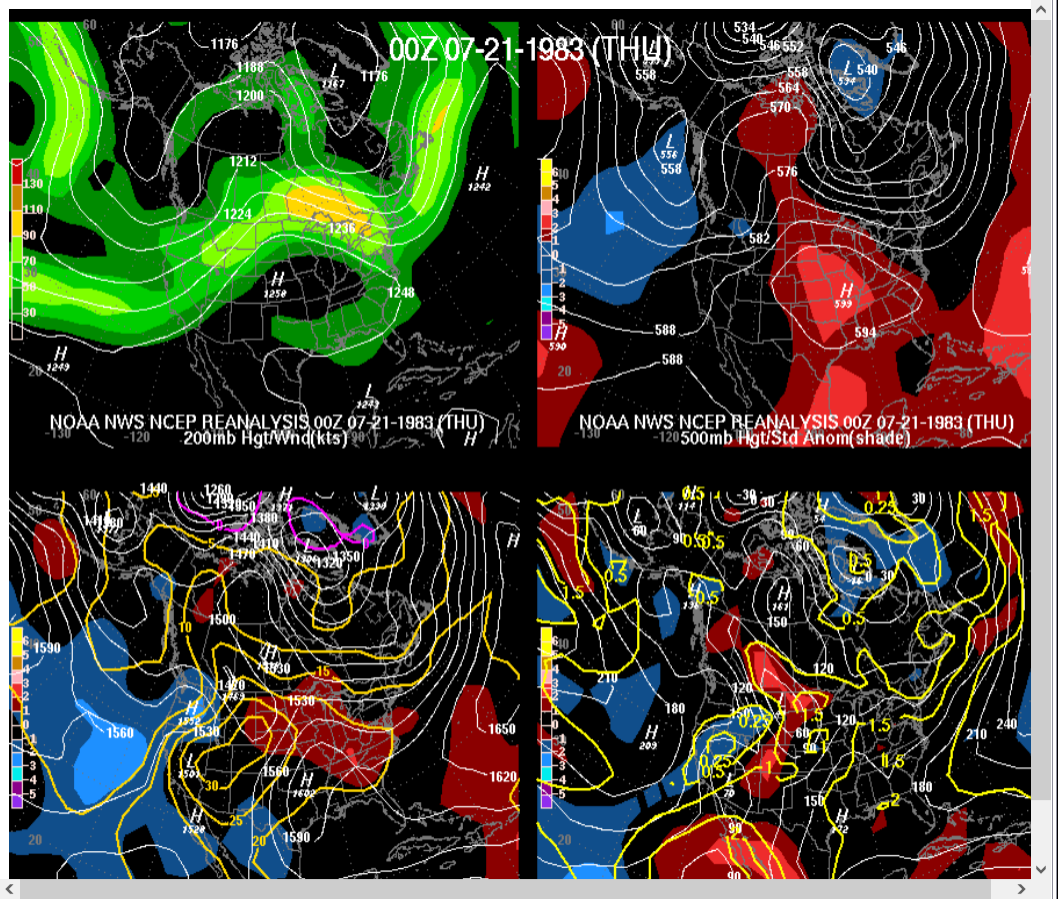
This was July 21, 1983 for instance. That's a 599 dm high centered over the state of MO!
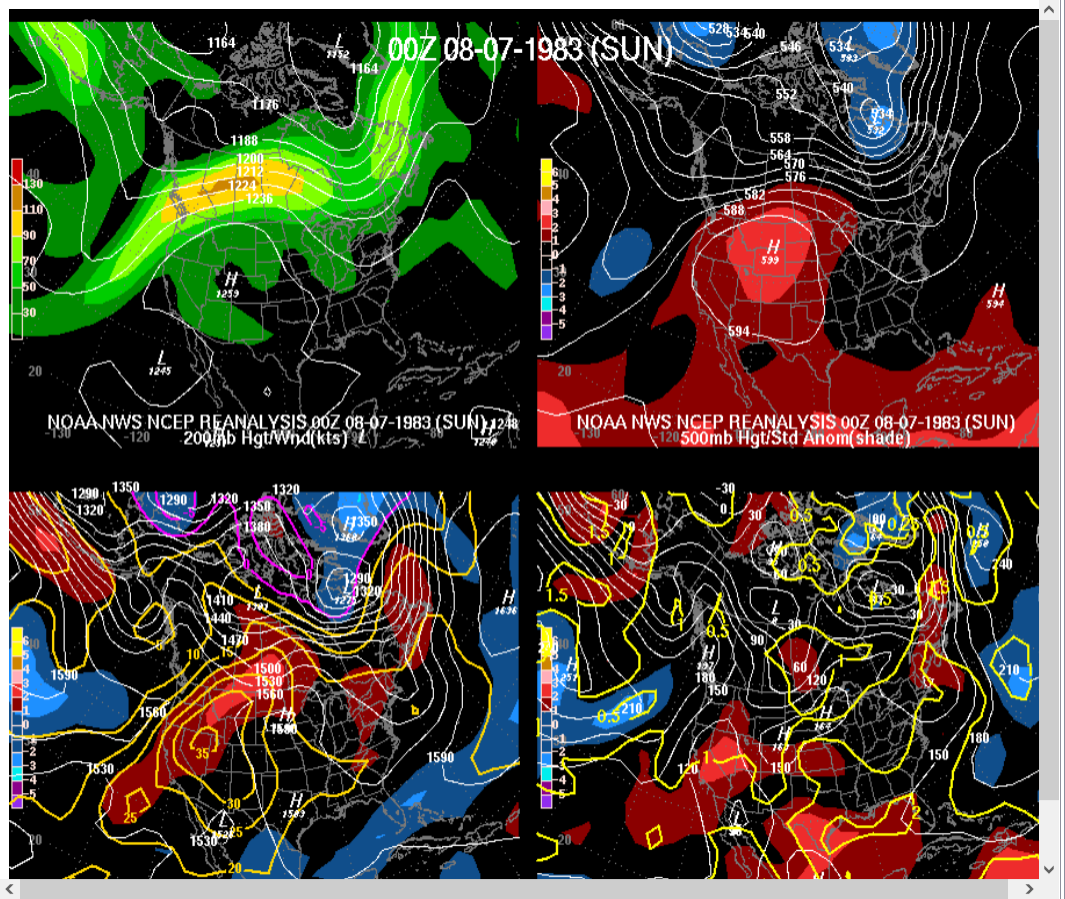
This was August 7, 1983. 599 dm high at 500 mb.
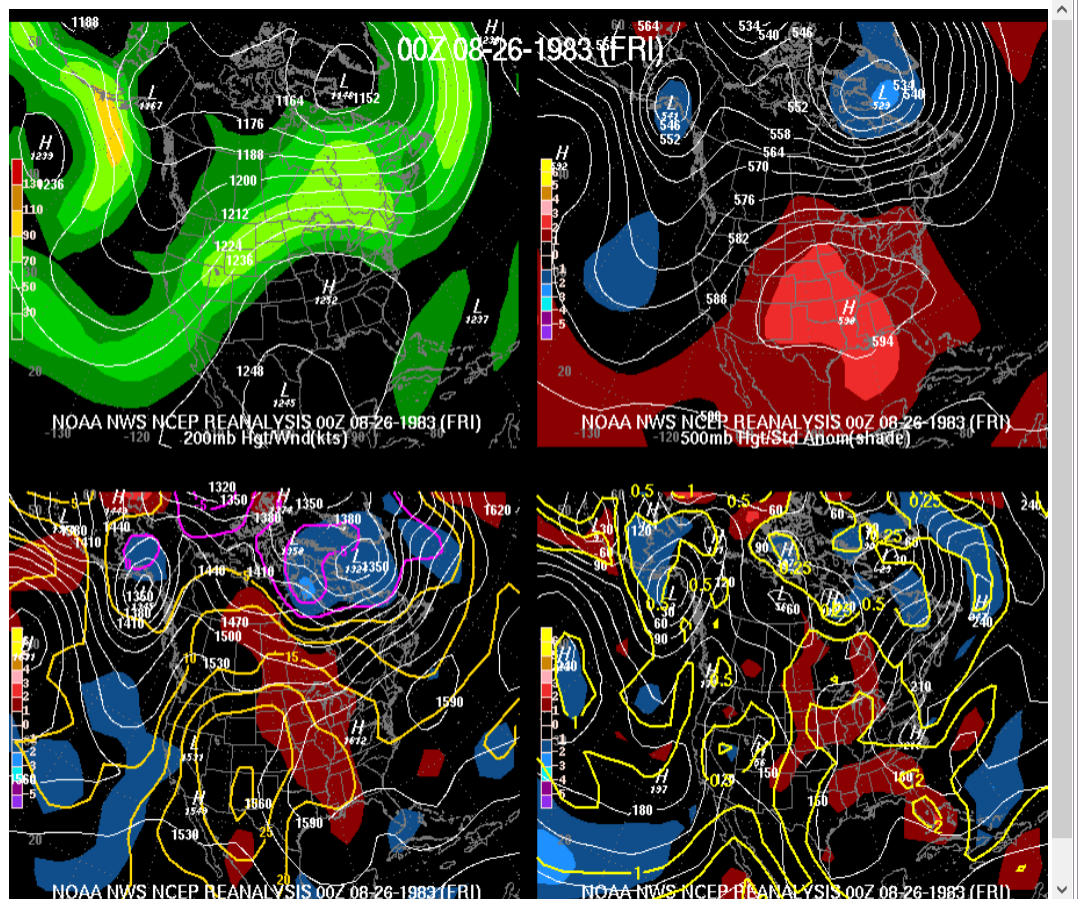
August 26, 1983. 598 dm high.
Just a reminder that in 1983, we had just ENDED a strong El Nino the previous Winter, the complete opposite ENSO condition of right now which is the START of a new El Nino.
1983 was also just after the 1970's coming Ice Age scare(because of real pollution that was blocking solar radiation, causing modest global cooling from the 1940s into the mid 1970s). Solar dimming!
The Clean Air and Water acts profoundly cleaned our world and increased the amount of solar radiation again(that helped crop yields) that added to the already increasing greenhouse gas warming from mostly beneficial CO2 (that has increased crop yields by 28% via photosynthesis) which is MOSTLY responsible for today's warmer planet vs 100+ years ago.
+++++++++++++++++++++
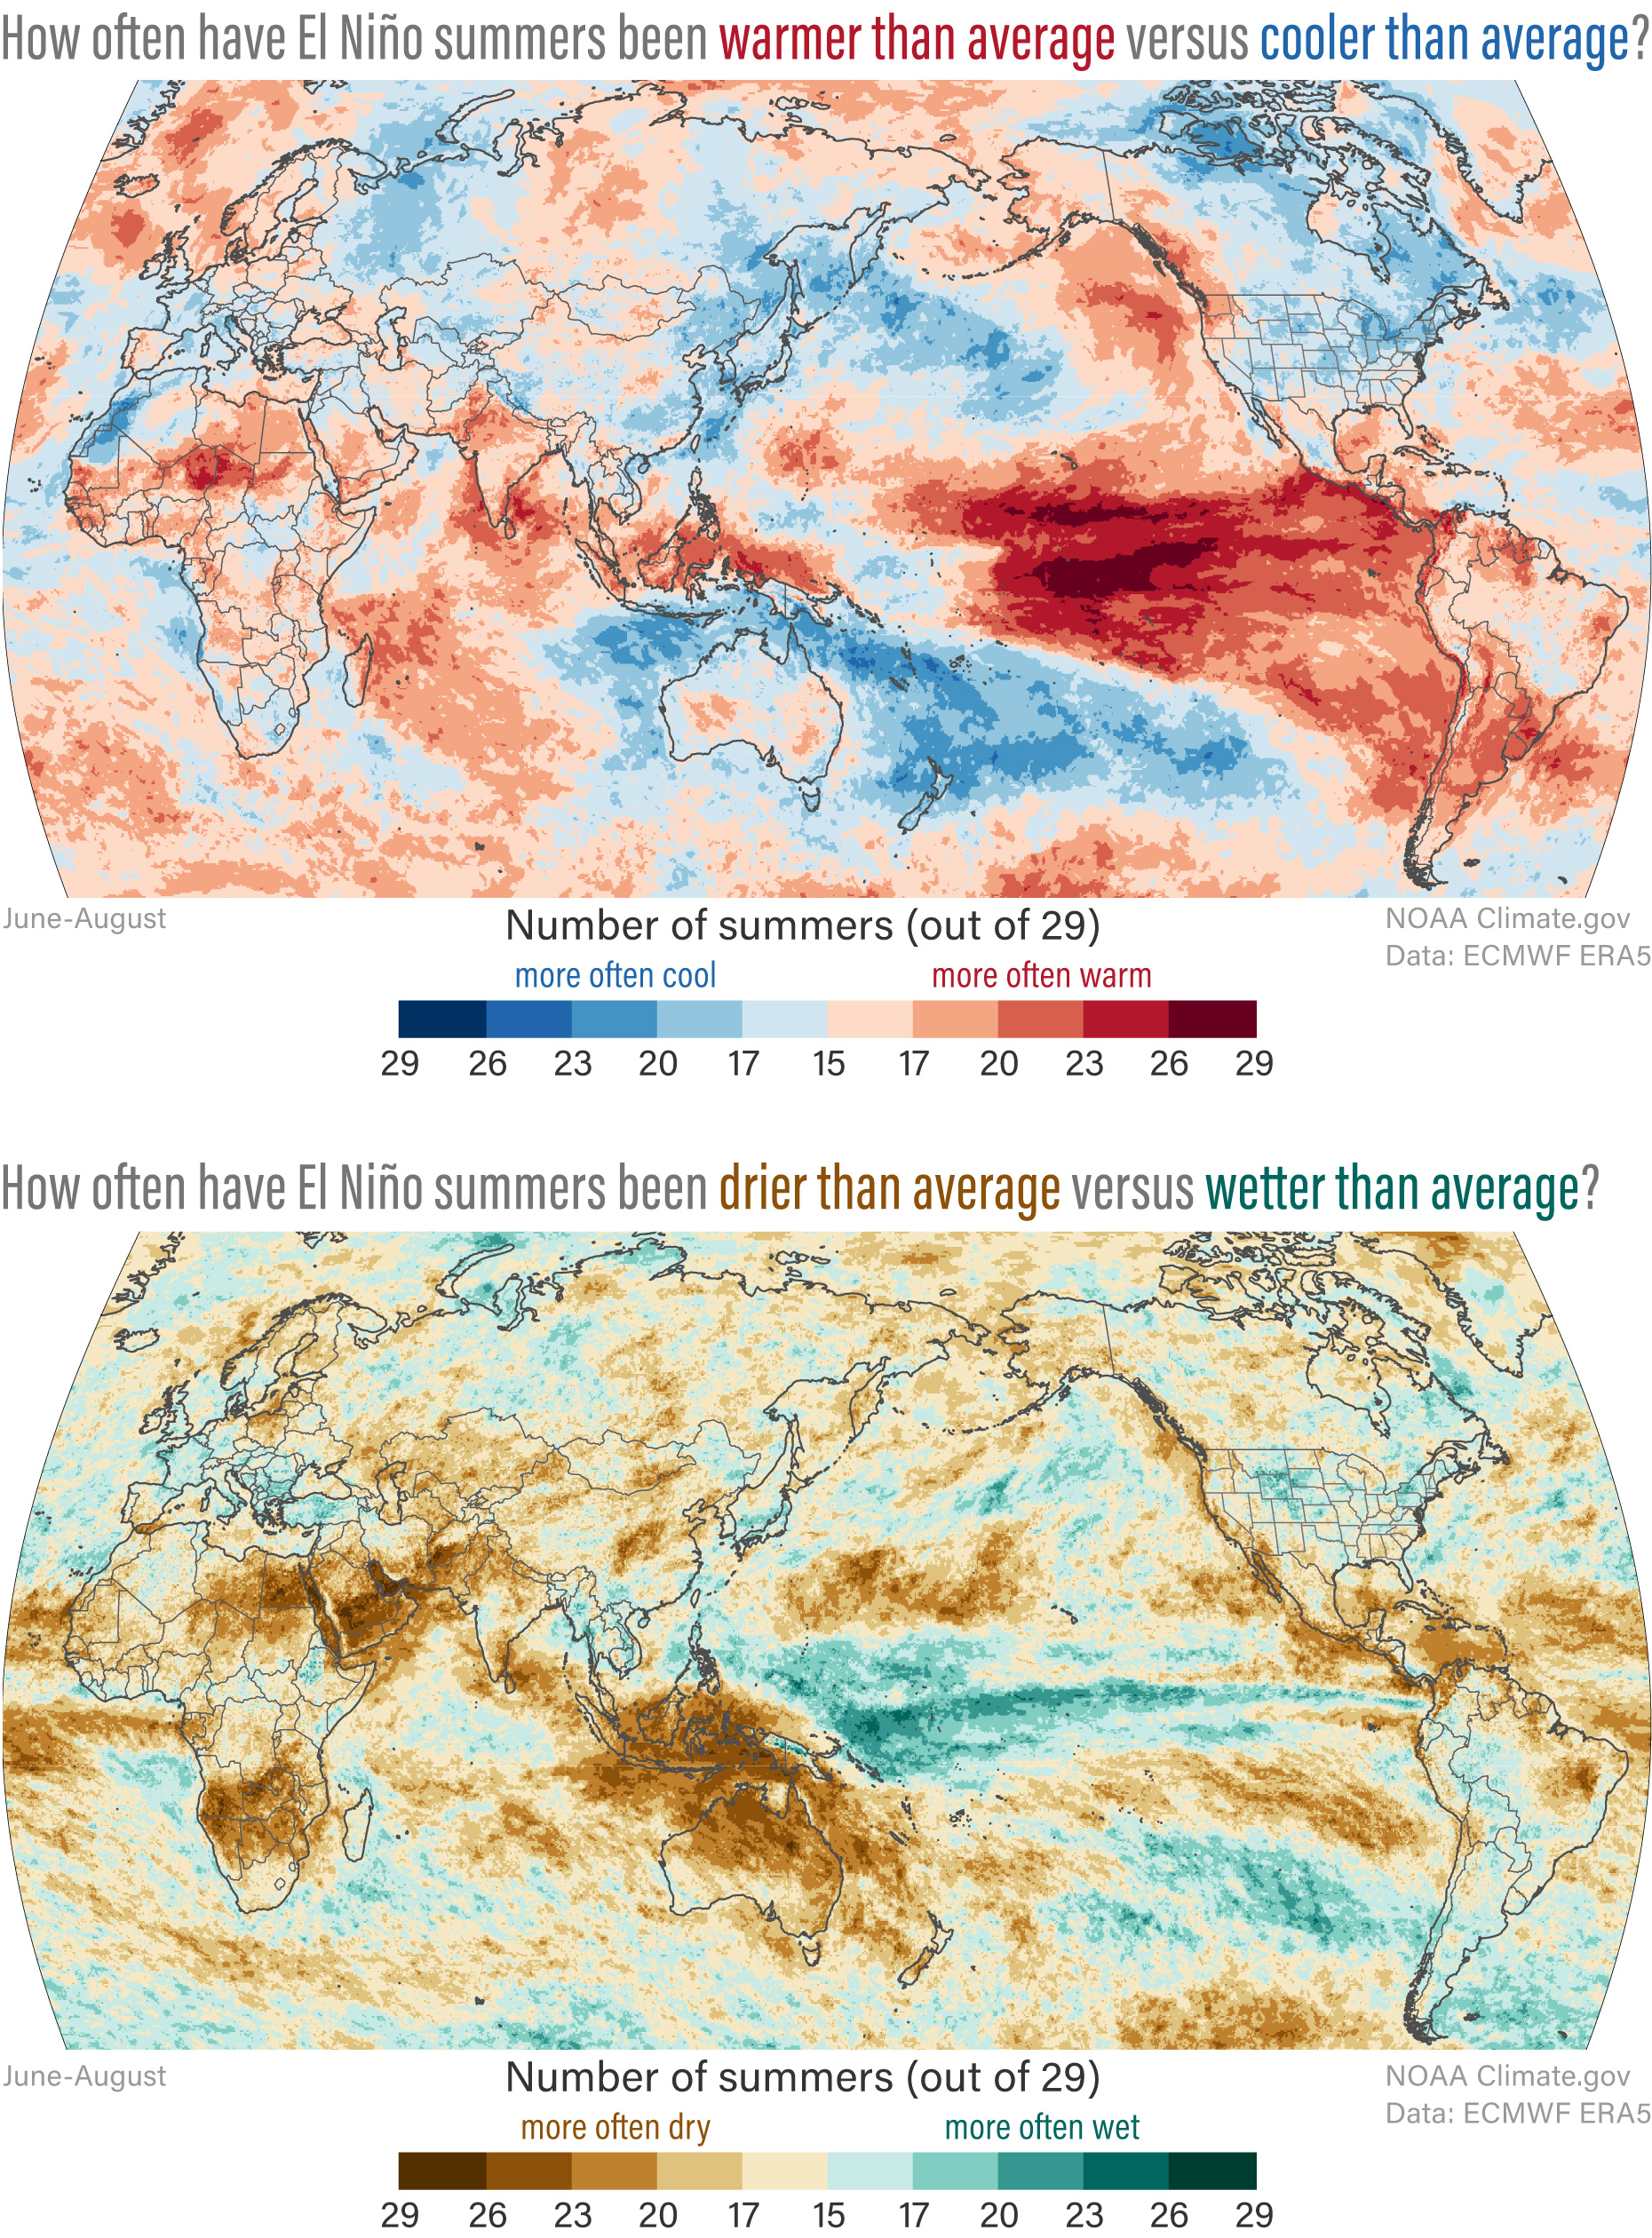
This is the Summer analog for El Nino conditions. Note that the impact of El Nino's in the United States(top right on the analog map below) is COOLER than average temperatures and wetter than average! However, each year is different.
Published August 24, 2023
The 12z model runs were bearish for grains and natural gas.
I agree with this outlook.
https://www.marketforum.com/forum/topic/83844/#83852
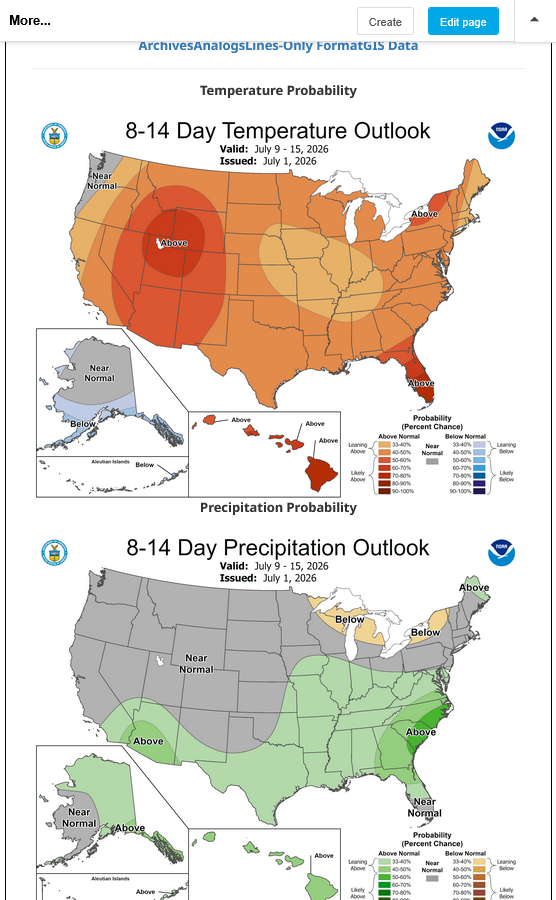
July 17th forecast from the last 12z GEFS model for 500 mb heights below. Dome in the Rockies, northwest flow into the Midwest, developing trough in the Eastern Cornbelt to the East Coast.
There's really not been much change the past day.
Most of the guidance is BEARISH.......except the European model extended forecast continues to be EXTREMELY BULLISH for the WCB, even more so in August now.
But the EE model has been showing this for a month now. If the market really believed it, we would have been sharply higher today.
Instead, closing on the lows just now tells us what the market thinks the forecast will be when we open up next week.
Odds are high for a downside gap on the open and this will just be a bear flag based entirely on the chart formation and close today.
But this means ZERO in 3 days. Whatever the weather maps show on Sunday will count.
It's possible, if the EE extended model, that has persisted to be an outlier for a long time will end up being correct and all the other models will shift much more bullish.
Personally, that's what I would love to see as a trader, having a bias here to prefer being long because of the set up. However, July is not a month to be long in the absence of MAJOR adversity in the weather forecasts. Not just 1 model. On the CONSENSUS of models!
The lack of consensus and uncertainty is what makes this so challenging AND FUN to analyze all day long, every day and share that here with like minded readers/poster that care about the weather and markets.
Long double digit contracts of CZ and SX from market orders on the open.
https://www.marketforum.com/forum/topic/83844/#83852
"Why" the 'sudden' upsurge?
Did market "finally" figure out "TOO WET"?
hot dry forecast
I would suggest low percent R and RSI daily and weekly!
Technicals trump fundys
Dec corn high so far at 4.50 resistance 9:25pm
Did market "finally" figure out "TOO WET"?
++++++++++
The diametrically opposed polar opposite of that, tjc!!!
Technicals trump fundys
++++++++++++
Thanks, tjc. You keep insisting that trade after trade and year after year, no matter how many times I demonstrate that's NOT true with weather markets.
The weather is a fundamental. This is a weather market and the forecast took a huge shift to hot/dry over the long weekend, similar to how the European Ensemble model has been forecasting hot/dry for weeks.
As long as the week 2 and beyond forecast stays hot/dry(and week 1 doesn't suddenly add a ton more rain) the technicals won't matter. We will keep going higher.
My position has almost doubled the money in the account and I messed up! I had planned to max out on margin but got tied up with a personal matter and barely got the bean order in with 30 seconds to go and only margined out 75%.
+++++++++
Like cutworm mentioned, 450 is the high for CZ. Over 1,100 offered at that price right now. 29,000 contracts traded so far in less than 3 hours. Very active!
1172 in beans has the biggest offers, but can blow thru that. 24,000 contracts traded so far.
OK, this is changing alot. Corn offers much less at 450 but looks like they dropped those orders to 449.75 and 449.50.
So corn appears to have more sellers here.
++++++++++
9:45 pm I covered the CZ at 449 for +4.5c and SX at 1170 for +17c.
Not quite doubling the account size, mainly because I messed up with the order size not maxed out on the open using day trading margins.
Funny thing is that I almost had enough equity to hold the entire position on day close Monday based on the account doubling.
My other option would have been to put in a stop and risk a chunk of the profits. Very often, with volatile trading like this it results in the stop getting hit and the market reversing back up. Regardless, we got the initial, extreme knee jerk reaction up from the change in the weather to hot/dry since last week's close and everybody (except tjc) knows why.
The forecast could turn a bit wetter in week 1 overnight and I don't want to be long in July without MAJOR adversity that is INCREASING. To be honest, I'm getting to be an old man too and don't feel like staying up most of the night monitoring every weather model to babysit this weather trade.
It seems clear that the Summer lows are in for C and S.
Corn finally popped above 450 after being stuck with that as resistance for a few hours.
This last 0z GEFS was a bit cooler than the previous runs in the Midwest during week 2 and keeps the dome WEST of the Cornbelt in week 2.
I would have coverages on this if still long.
still pretty dry in the WCB!
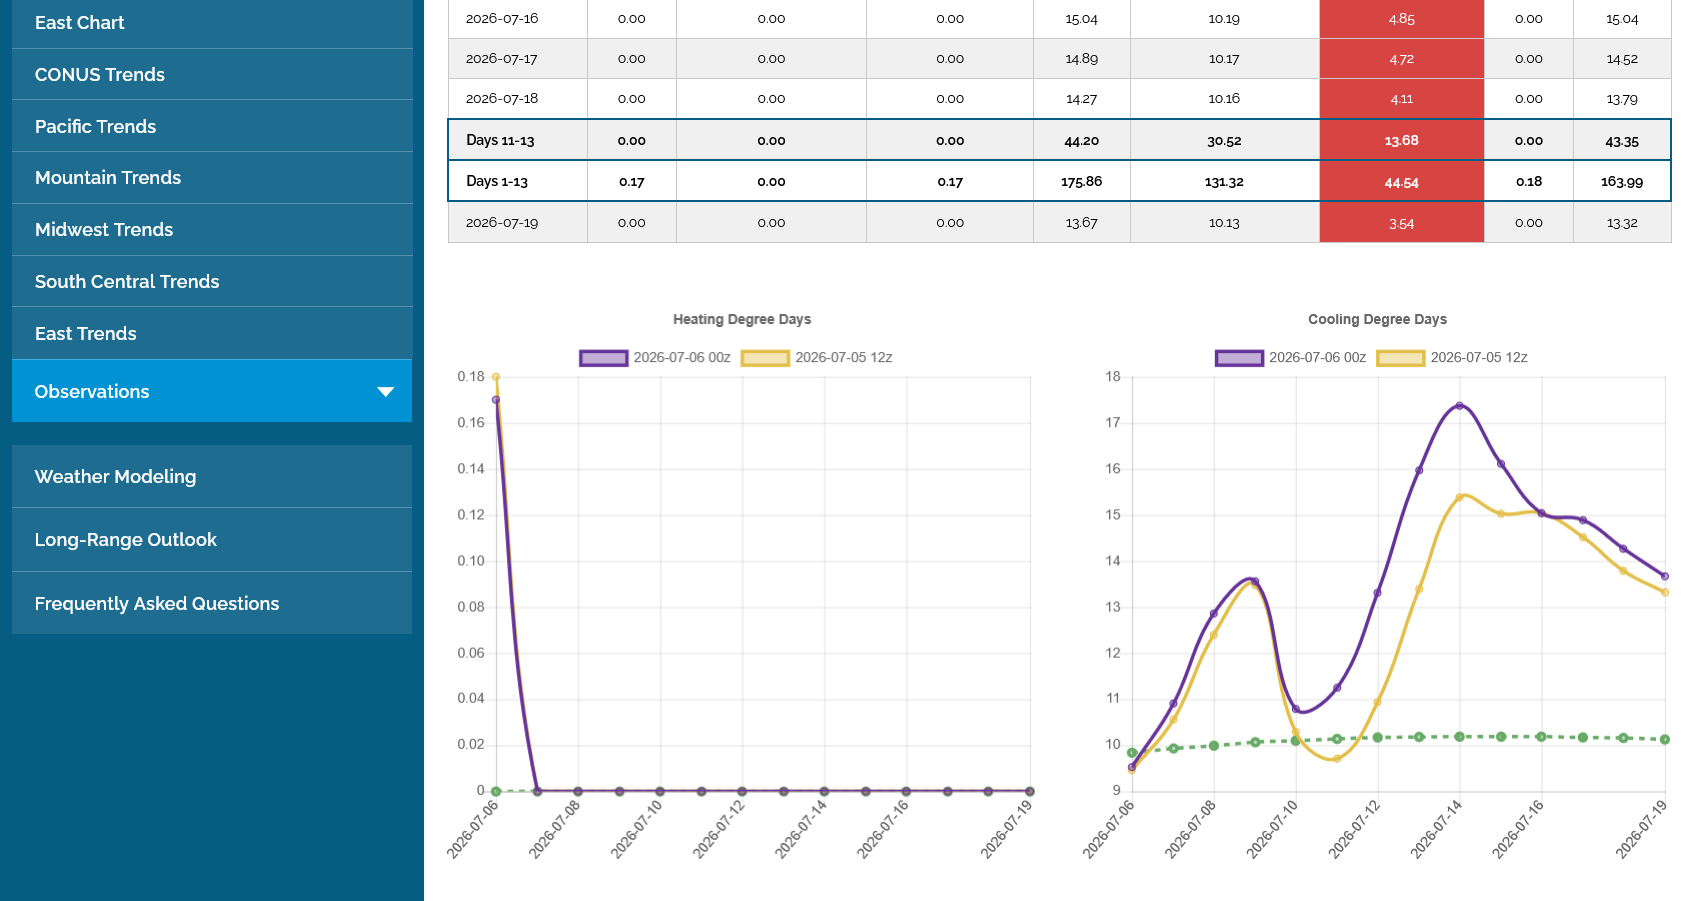
The European Ensemble was a whopping +12 CDDs hotter for just the Midwest!
I should have stayed long!
Things would really need to change for the market to get back to the lows, so there’s little doubt the lows are in now.
8am: The 8:30 am open should be crazy. Funds just covered all their corn and were starting to get short. They covered a big chunk of their soybean longs. Historically, they don't put that position on again but every case is different.
This last 6z GEFS reversed the bearish changes from 6 hours ago. The EE model that came out in between was BULLISH with much more heat.
These were the CDDs for just the Midwest from that last 0z run on the right. Purple was the last run.
The question really is what happens LATE in the period after the heat spikes early in week 2?
This is NOT a dome of death on top the Cornbelt.
The dome will find a new home in the Rockies to Plains and for a time, push into the WCB at the end of week 1 into early week 2 before returning west.
8:40 am: Funds came in selling to test some overnight support that held and we're making new highs. Beans continue to be the strongest.
8:48: Unable to follow thru initially with more gains at the highs so 2 sided trading after MASSIVE gains overnight which suggests the market has dialed in MUCH of the bullish news.........for the moment.
The easiest weather trade money was made from the open last night. We can still go MUCH higher if the WEATHER forecast for the rest of July continue hot/dry and northwest flow doesn't mess that up.
This is a WEATHER market, not a technical market.
Volume for the day session so far does not seem especially huge so I think this is partly from sellers NOT wanting to put on new positions here so buyers need to bid prices higher to get filled. 1 bearish weather model and it could head back down..........but each model that stays bullish will help to add more gains.
This was the last 30 day forecast from the BULLISH European model, updated earlier this morning. These are rain anomalies.
This model has been insisting on this particular solution for over a month now and it looks to be nailing the forecast.

This was the most bullish 500 map to start week 2.
2nd map is the 500 mb pattern at the end of the month


These are the next 30 day temp anomalies.

Last month's record heat/weather with Saharan desert air masses aimed at Europe did huge damage to the corn crop.
·
Hot and dry weather has slashed corn conditions in France. Last week's good-to-excellent rating fell to 58%, down a whopping 26 percentage points in just two weeks. For comparison, the sharpest two-week decline in U.S. corn conditions during the 2012 drought was 17 points.
IF, IF this is to be a weather market, based upon prior trading patters, would you agree a TRADER gets one more chance considerably below today's breakout? Perhaps "just" above the Sunday night gap?
Thanks for the question, tjc.
Nope. That's not how it works in a weather market.
The only way we get back down there is if the weather pattern change causing this incredible 1 day spike up goes away and turns bearish, in which case a weather trader would have wanted to short up here.
Then, the weather forecast has to turn bullish again to buy down where you want to buy.
The market will only retest those levels IF the WEATHER CHANGES FIRST TO MORE BEARISH then CHANGES BACK TO BULLISH.
If that change back to bearish does not go back to bullish, then we will go below those levels. However, with the current pattern, that seems unlikely. We might go to less bullish and retrace some of this move but to go all the way back down will likely require enough bearish weather so that it makes no sense to be long in a weather market when the weather has turned bearish.
tjc,
I realize this is frustrating for you but that's just how it is with weather markets.
The volume today is actually HIGHER for soybeans than corn!!! They are leading the charge higher. Beans can be hurt more if this hot/dry lasts into August, the key developmental month for soybeans.
+++++++++++++++++
I should have stayed long/held my position much longer but that's my boo boo. The entry on the open last night was so perfect/optimal that it was still an outstanding profit.............and now it's time to focus on whats coming up, not what just happened.
+++++++++++++++++++
Eric's awesome weather:
https://www.youtube.com/watch?v=Yo2dBqrs9BQ
+++++++++++=
Last week's U.S. corn export inspections topped all analyst estimates, while soybeans landed near the high end of the range. About half of the week's bean cargoes were destined for China. Meanwhile, wheat posted one of the smallest weekly volumes in 40+ years of records.
Thinking more about it.
There is actually 1 scenario that could cause a brief correction of something like 50%…..random number.
If we had a huge, widespread rain event this week that exceeded expectations and fell in the WCB.
Then we resumed with the hot/dry weather pattern for the rest of the month.
Nothing burger for crop ratings.
Remember, unchanged ratings are actually a bit bearish as the seasonal crop condition tends to decline slightly with typical heat and soil moisture deficits, while the crop gets 1 week closer to being made/harvest on each updated report.
However, this report is almost meaningless in a weather market. We are trading the forecast in a FUTURES market.
We are trading the value and price of DECEMBER corn and NOVEMBER soybeans. The new crop that's growing in the ground right now. The biggest factor that determines yields/supply come harvest is weather in July/August by a wide margin. The market is focused on that right now with a huge pattern change to much drier, with bouts of heat.
https://esmis.nal.usda.gov/sites/default/release-files/795970/prog2726.pdf
Corn stayed the same in all categories.
Beans lost 2% in the good category with 1% going to fair but an increase of 1% in excellent to offset that.
+++++++++++=
Before getting too bulled up, we should take note that current conditions are ABOVE the 5 year average and current soil moisture is also ABOVE the average at this time year, with most drought in the Midwest wiped out.
So the intense heat and dry weather coming up will need to last for awhile to really start hurting the crop. Some areas, actually will benefit from a week of dry weather.
U.S. corn conditions are steady on the week but notably lower than a year ago. Soybean ratings drop 1 pt and spring wheat falls 2 pts. The earliest corn/bean fields have reached pollination and pod set. On average, 50% of corn reaches pollination by July 18.
++++++++++++++++
https://www.marketforum.com/forum/topic/83844/#83853
https://www.drought.gov/current-conditions
Thru June 30, 2026
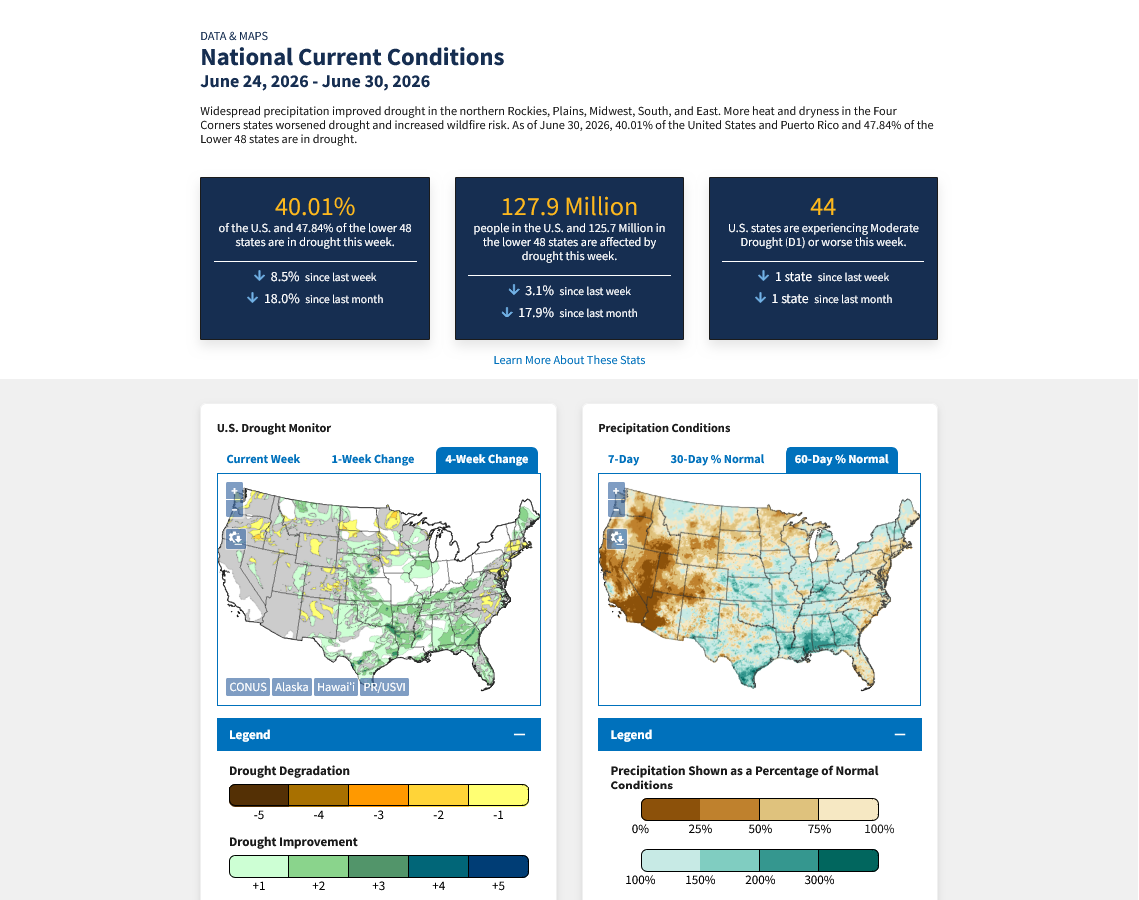
DROUGHT MONITOR
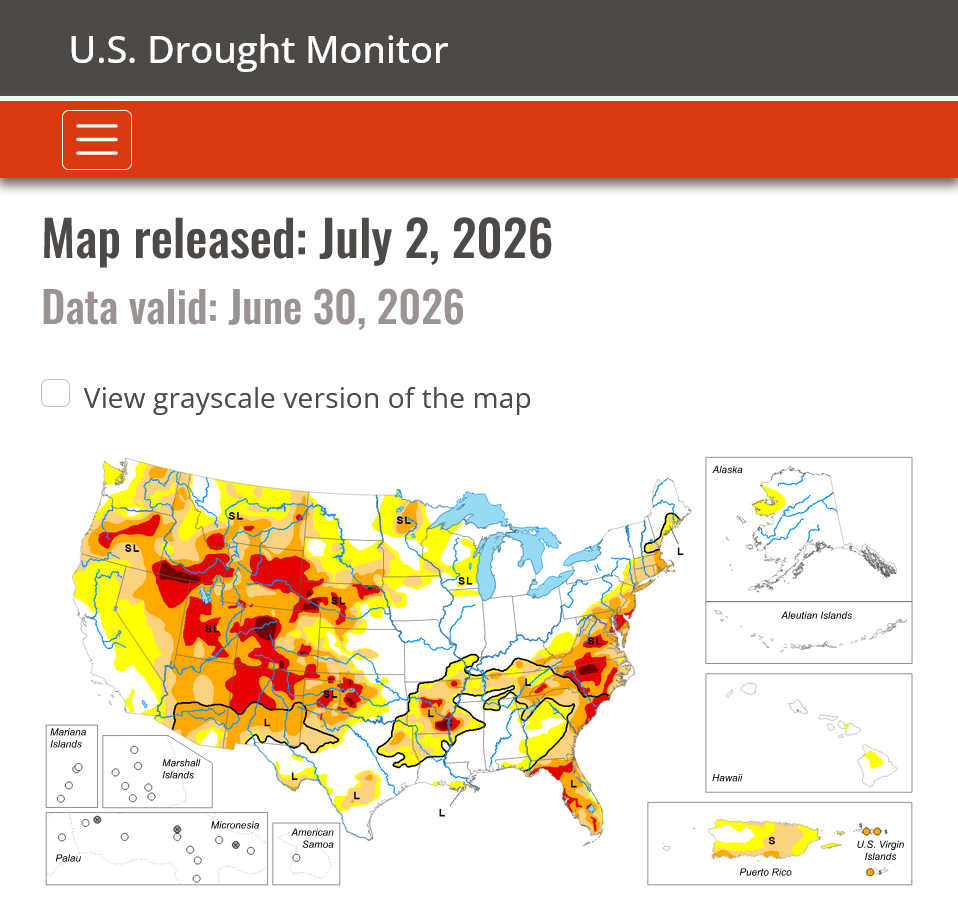
https://droughtmonitor.unl.edu/
Drought improved a great deal in the south the past 2+ months!
https://droughtmonitor.unl.edu/Maps/ChangeMaps.aspx

++++++++++++
https://www.marketforum.com/forum/topic/83844/#83852
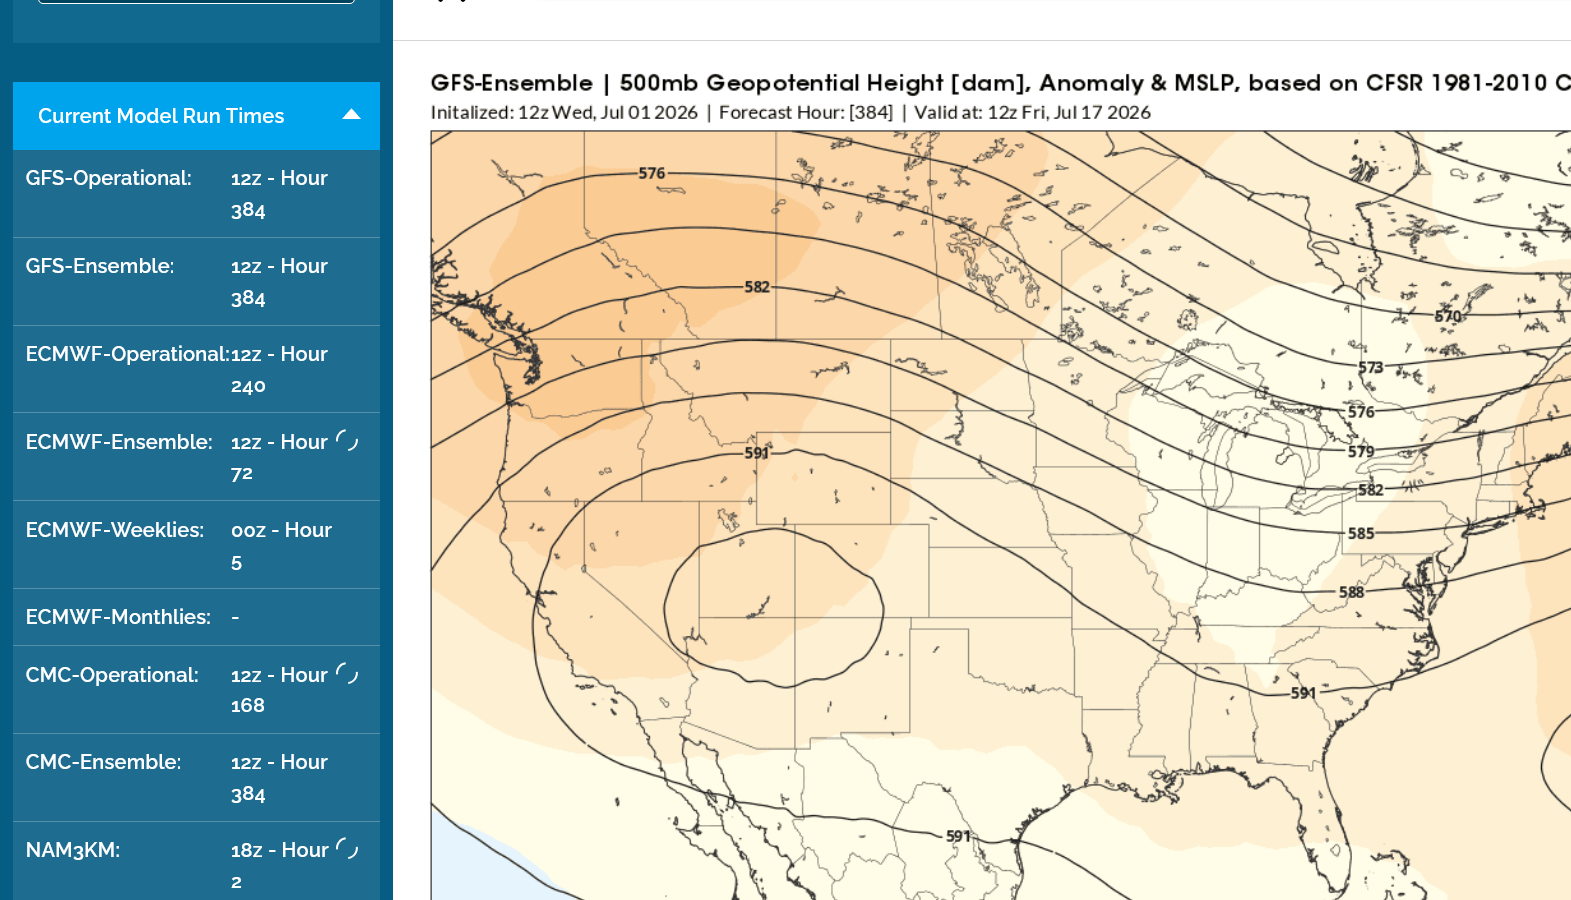
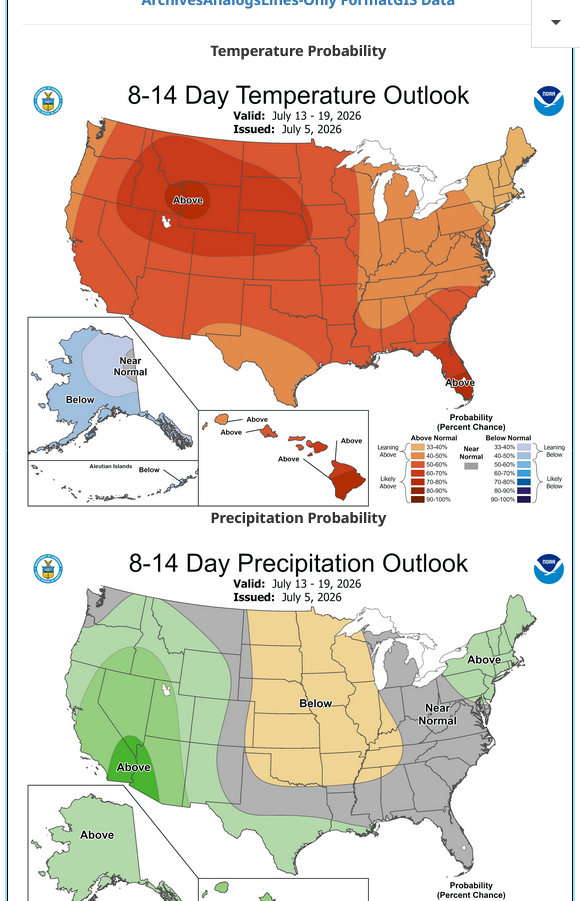
Temperature Probability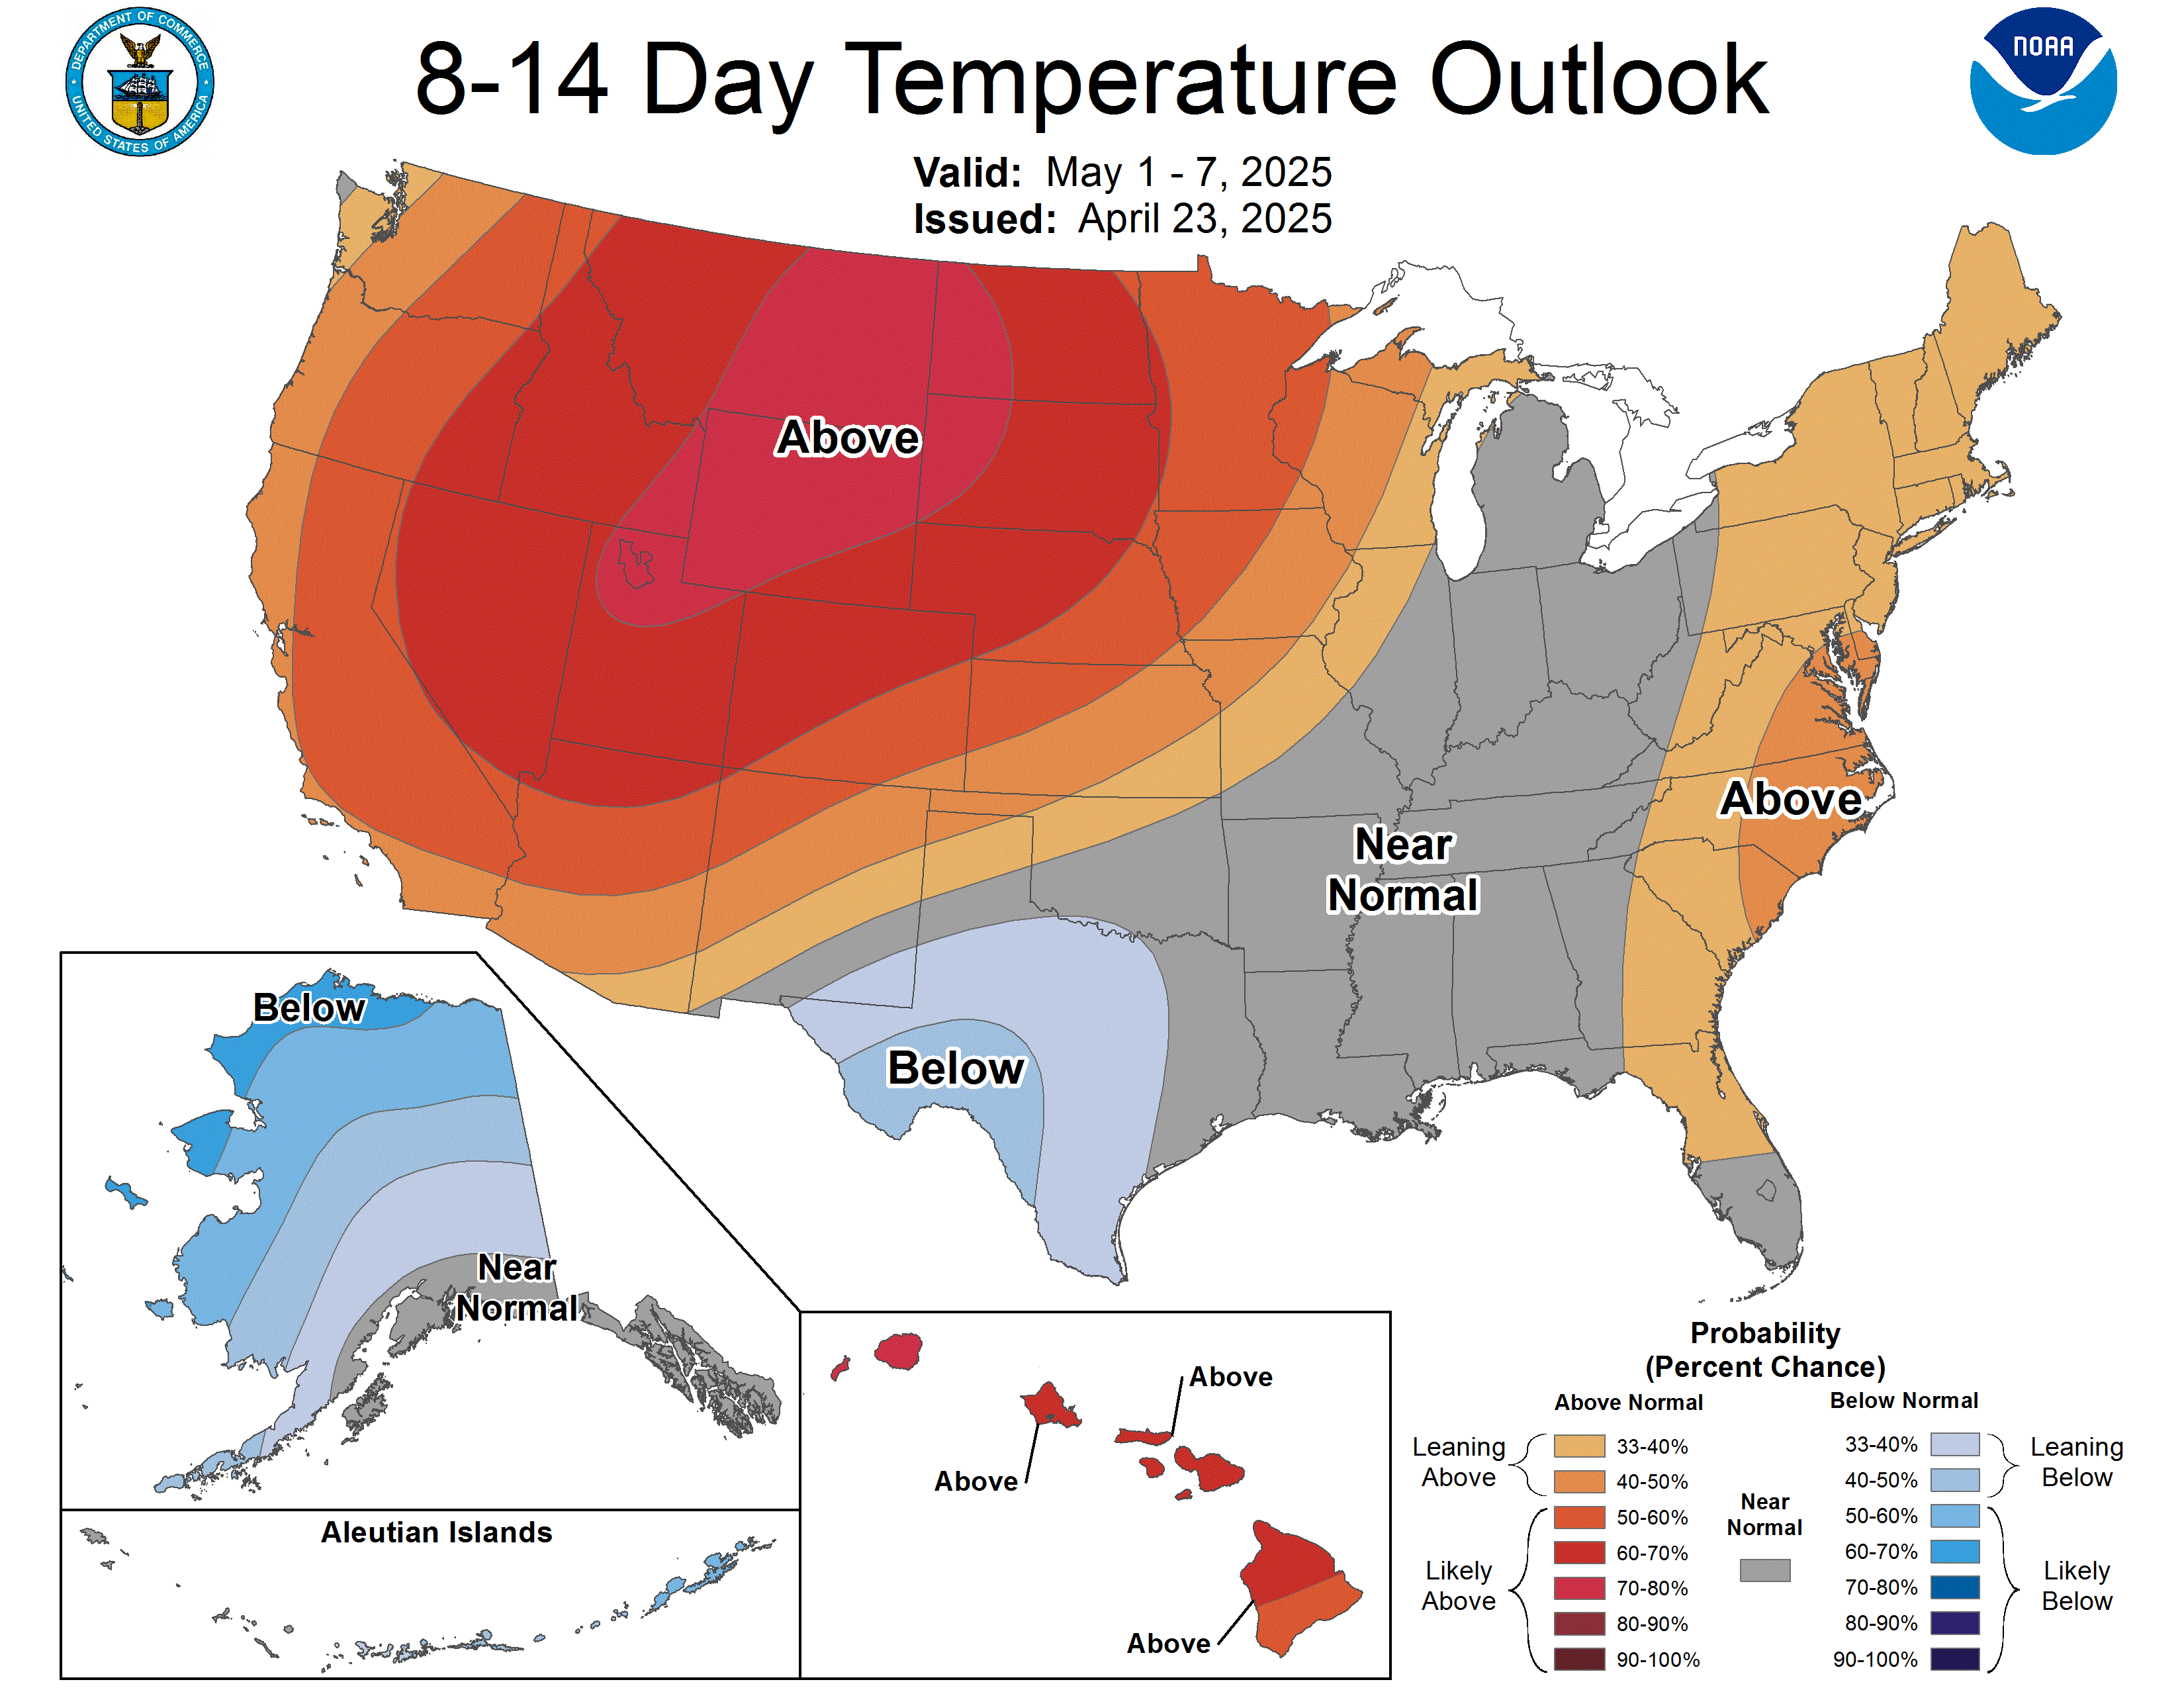 | |
Precipitation Probability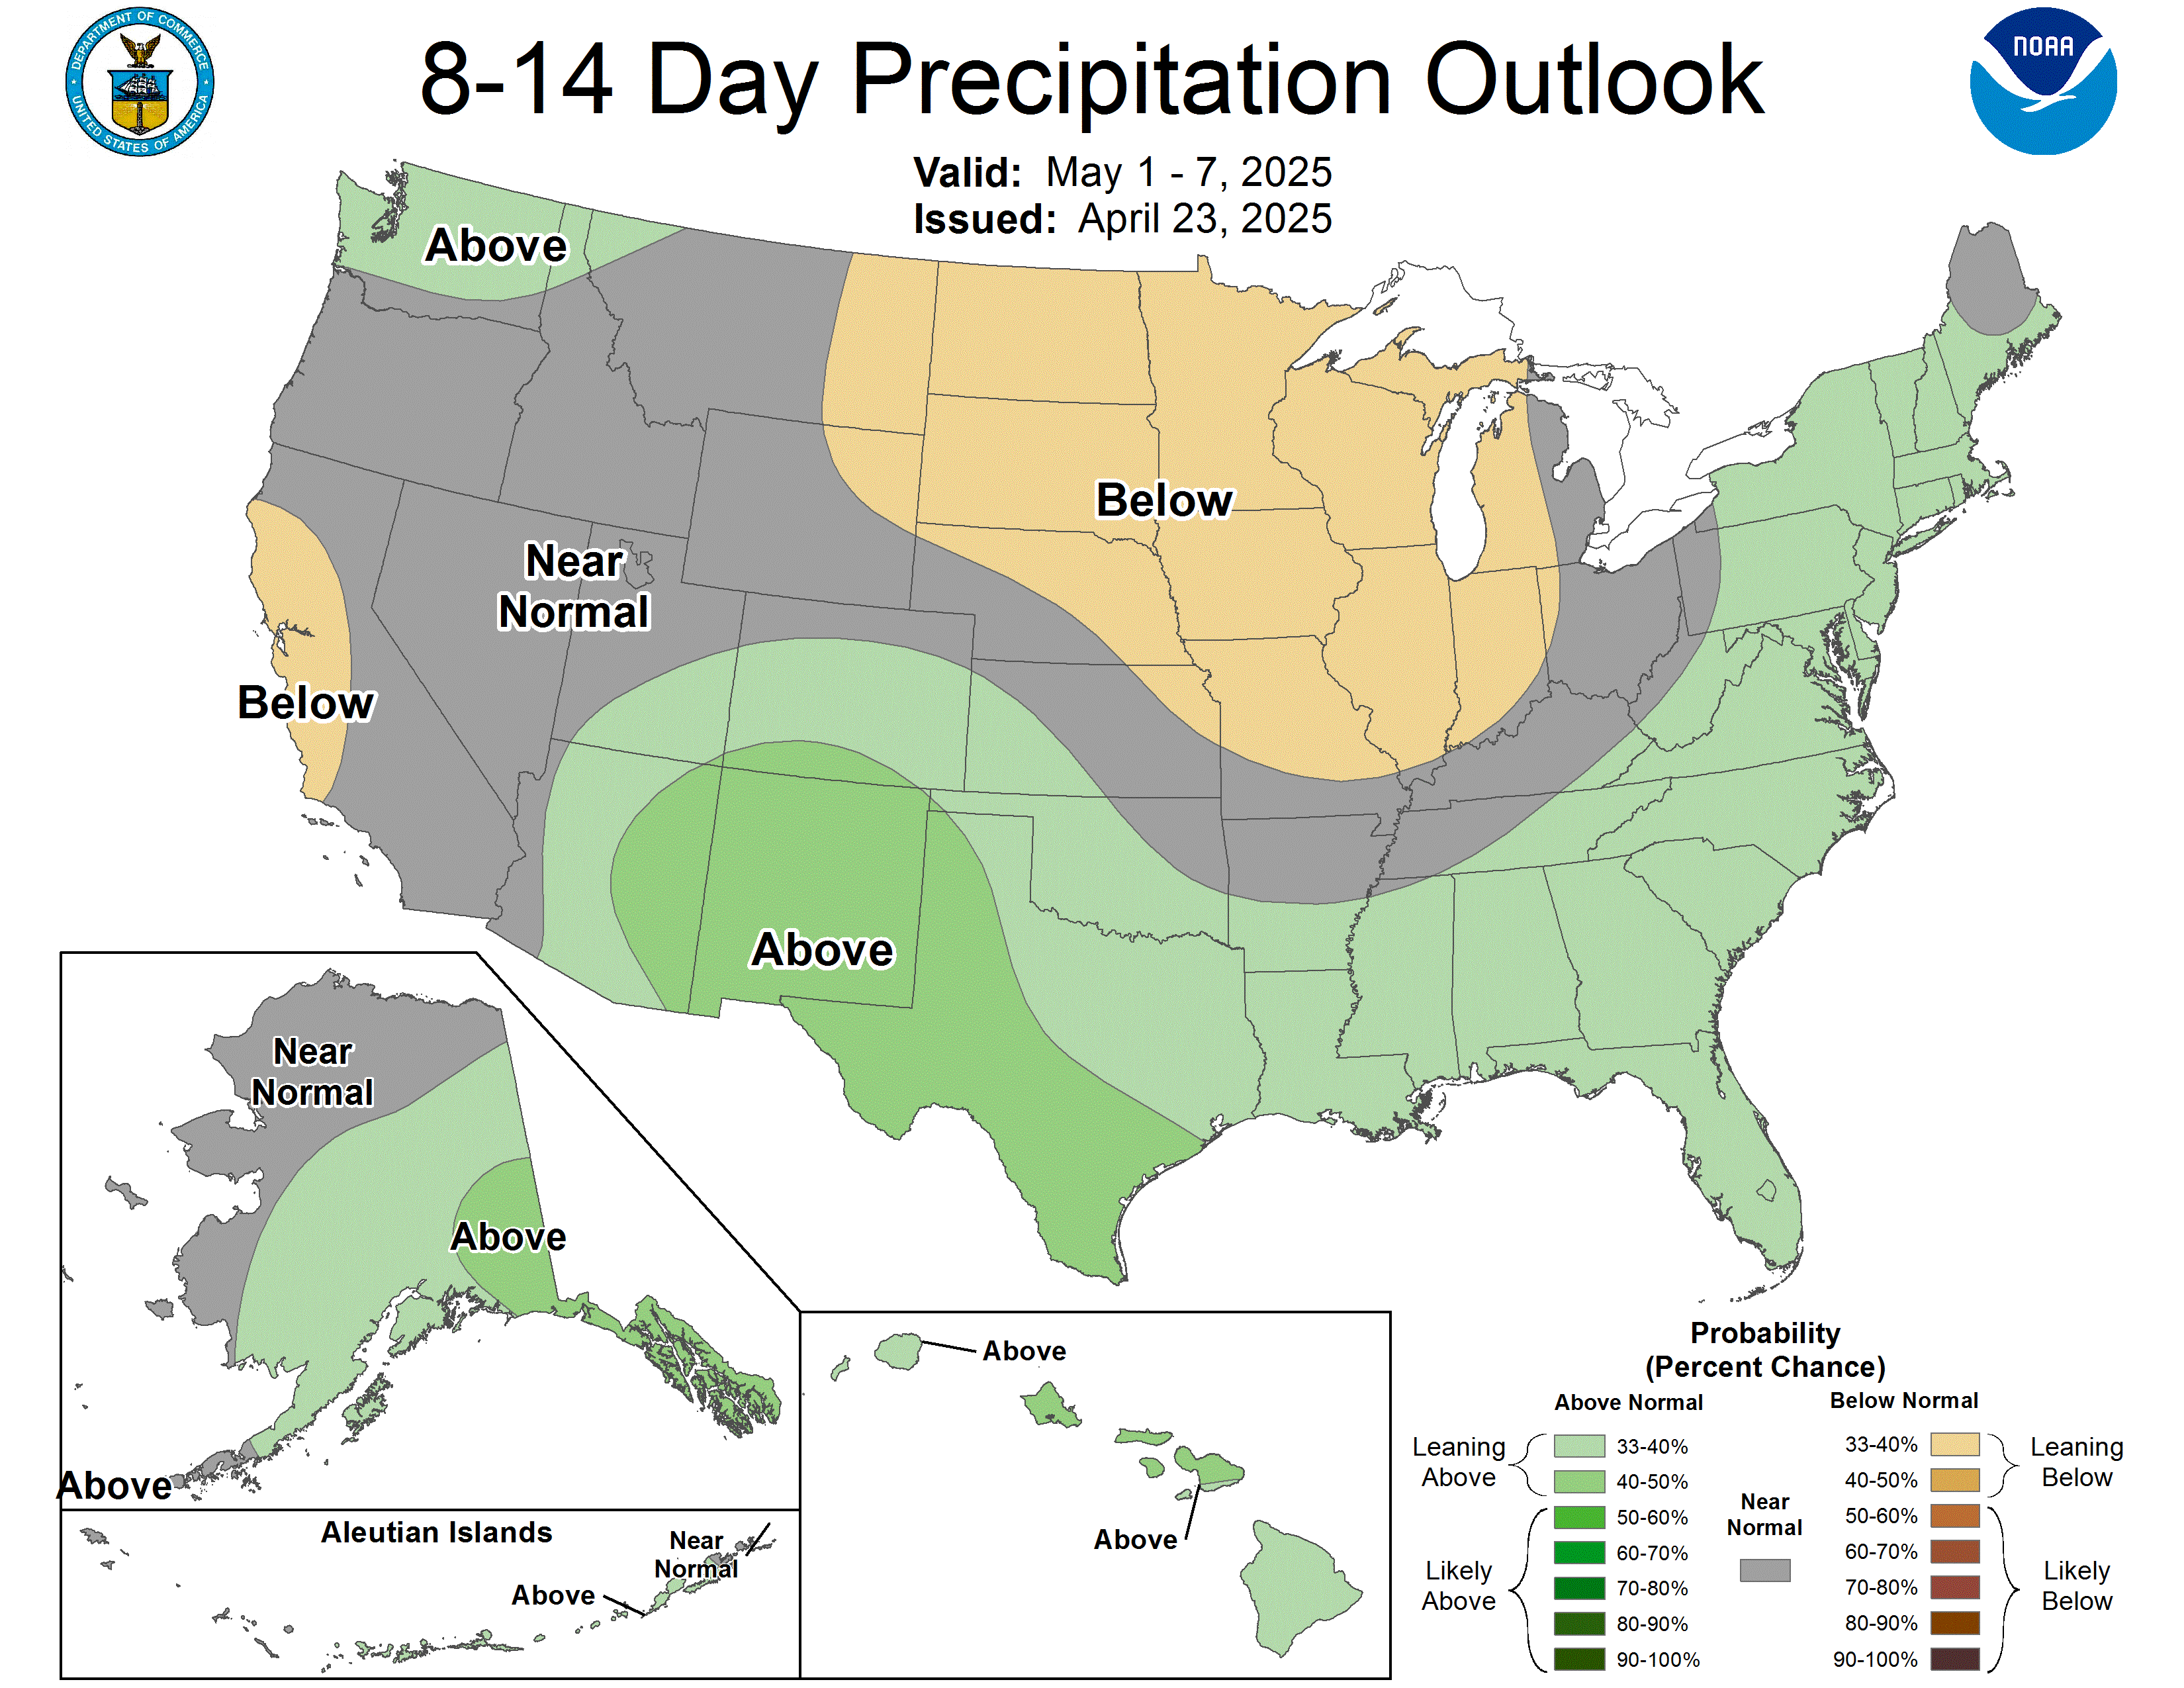 | |
++++++++++++++
Just to repeat from a post above. The huge dome comes in for several days into the Western Cornbelt at the end of week 1, then goes back west. There are no 2 week models that keep it in the Midwest, which is what we really need to keep prices going higher.
This was the last 500 mb map forecast for the 2 week forecast on the just updated 12z European Ensemble model below with the dry-ish rain anomaly for week 2(normal ECB).
Northwest flow into the Midwest in July like this can often lead to perturbations in the flow that trigger clusters of storms. This is likely why the NWS forecast above has only an extremely weak below average rainfall probability in the WCB to CCB and near normal for the ECB.
I have no idea if we dialed all that in with our huge 1 day spike higher.
Changes in the forecast every day will matter. As bullish as today was, it can turn bearish again overnight.


thanks, mike
congrats on the trade
Posting my trades messes with my brain, so I don't.
There are many different ways to trade, the weather trade is your specialty. You are by far the best I've seen. I've learned a lot from you and still learning.
Technical trading is completely different, and you understand that well.
The chart set up for Dec. corn might have been the Key reversal day on 6-30 with fallow through on 7-1. I did not see that one and it had a long weekend of risk. I did not see any set up in beans. But the weather man did.
just my 2 cents
Thanks very much, cutworm!
Wise words from somebody that understands agronomy and crops as a producer as well as understanding markets from every perspective as a trader (seasonals, technicals, fundamentals) .
I don't trade anything like I used to and like you, don't like to post them because, as you stated it messes with your brain and emotions.
Last night's buying set up was the best one I've seen in a long time. I committed to buying the open, maxing out on margin on Saturday morning but intentionally made no grain posts over the weekend.
I love sharing but sometimes it can be counterproductive if I share BEFORE putting on the position.
We have more readers than you might think here and the last thing I wanted was to tip off everybody to buy the open on Sunday Night. The more buyers at the market on the open like me, the higher the price will/would open and the higher my fill is going to be.
I love doing this for free but it makes no sense to suffer from personal performance.
Greenman used to say that posting his trades here made him more disciplined and a better trader with his objective analysis.
I can see that working sometimes, when I post potentially different outcomes which makes for being prepared to be wrong. Unfortunately, I overdo that and it makes me hesitant to pull the trigger on alot of great trades.
I traded for a couple people before, including my wife's business 25 years ago (that I helped her start with my commodities profits).
They gave me 50K. My main account at the time was near its peak at 500 k. I would trade 10 contracts with my main account for every 1 in their account. I constantly fretted, 2nd guessed and did dumb things from worrying about their money because it was THEIR money.
I figured that any money I lost in the main account only impacted me. I had plenty left and all the time in the world to make more. With their 50K, it was the complete opposite, UNHEALTHY trading mindset.
I wanted to make them money so bad and so fast that I made bad trades and dragged my personal (and IRA trading account) in.
I lost a huge portion of their equity but then got my S together and made most of it back. They needed the money suddenly. I pleaded with them to wait another year so I could MAKE them money but they had to have it.
I still feel bad today. My wife saw how much money I was making and trusted me to do the same with her company's profits. Even though they started using my money, I let them down.
What really stinks is that the year before that, i had my best year ever and even before that, she kept telling me she would get the money to open the new account. After each great trade I was like..........AHHHH! If you had opened the account, Metalmorphose (name of the machine shop-I picked the name) would have made X amount!
Then their money finally came and I was on an overconfident high that "found" trades that didn't always meet the criteria of ideal weather trade set ups(like the one last night) because i wanted to make money for them more than I was able to practice patience ad discipline, along with one of the worst things that can happen to a trader.........XX wins in a row and a massive 6 figure account from that which causes you to take dumb risks from overconfidence and most importantly, the feeling that you can afford to take on additional risk because the account has so much money in it.
If you want to really grow the account, you MUST increase the size of trades as it blossoms. But you also must take the exact same trades you did before with the same risks, using the same strategy and same everything that you did to get to the much bigger account size.
++++++++++
I've read that something like 80-90% of commodities traders lose all their money.
I used to say that means the other 10-20% are good enough to make a living off of it.
AI Overview
This 7 day forecast is one of the reasons that I got out too early late yesterday evening, looking for a place to exit based on the potential of being wrong rather than looking for reasons to stay in because I'm right.
7 Day Total precipitation below:
http://www.wpc.ncep.noaa.govcdx /qpf/p168i.gif?1530796126
I'm still leaning bullish. However, after this huge spike up, I would be just as willing to sell up here if the forecast, especially in week 2(which is the bullish part of the forecast) turns much wetter any night this week.
I could have doubled the profit on this trade by just hanging on for x more hours but the bottom line is that the account balance jumped higher by 87% by using the day trading margins and at 10:30 pm tonight, when they update my trading equity for day trading, I will be able to put on day trading positions that are almost double the size that I could before.
The margins and day trading margins in the energy markets are horrible because of the war in Iran.
Over $2,500/contract for ng compared to $500 for beans and $250 for corn. So I can do 10 contracts of corn or 5 contracts of beans and use up the same margin amount as just 1 contract of natural gas.
It's sort of mind boggling to be able to use those really low day trading margins in the grains!!
Hopefully, they will lower that in natural gas before the heating season begins!
Anyways, this is more than what happened today on 1 trade. Lots to consider.


