
Greetings
In a prior post I suggested it was getting 'too wet'. Since then there has been another 2-5 inches in 3-5 days in north central Illinois. Conversations with my tenant, with cautionary demand for 'truth' not farmer BS, strongly suggests :
1. Now too wet. Probably too late and will be too wet to replant the ponds and corners.
2. Most farms will have 3-8% crop loss due to ponds.
3. Yields WILL be negatively affected by adverse wetness.
I surmise grains open HIGHER off this weekend rain, not lower. THE 'TOP" is definitely off yields. Below trend line yields? Tenant says yes (especially on land not mine.--haha)
Technicals, next post
Corn Technicals
Corn may have posted a daily/weekly low on Friday, June 12, 28 days from last daily low and in its 21st week, both the daily and weekly in 'normal' time frames. Daily RSI bottomed at 27, weekly at 39; both in "buy" territory. Corn has fallen 70 cents +/- in 3 weeks (drought to saturated), and now appears to be way over sold.
Note: July corn made new contract low Friday, 3.085, but managed to close plus 1 cent on the day; a small (significant?) reversal.
At a minimum, Corn deserves a bounce.
BEANS
Beans appear to have put in a daily and weekly low on Thursday, June 11at a price of 1108.5. This low was (late) in the daily cycle on the 35th day a little past norm, but acceptable, and in the 23rd week, again past norm, but acceptable range. RSI levels dropped to 29 (tuesday) and 47 on weekly. Beans lost $1.20 in 4 week decline.
Beans closed the week negatively, but off the low at 1113.5
Buy beans---you know where you are wrong.
Previous grains post:
https://www.marketforum.com/forum/topic/120325/
Thanks, tjc.
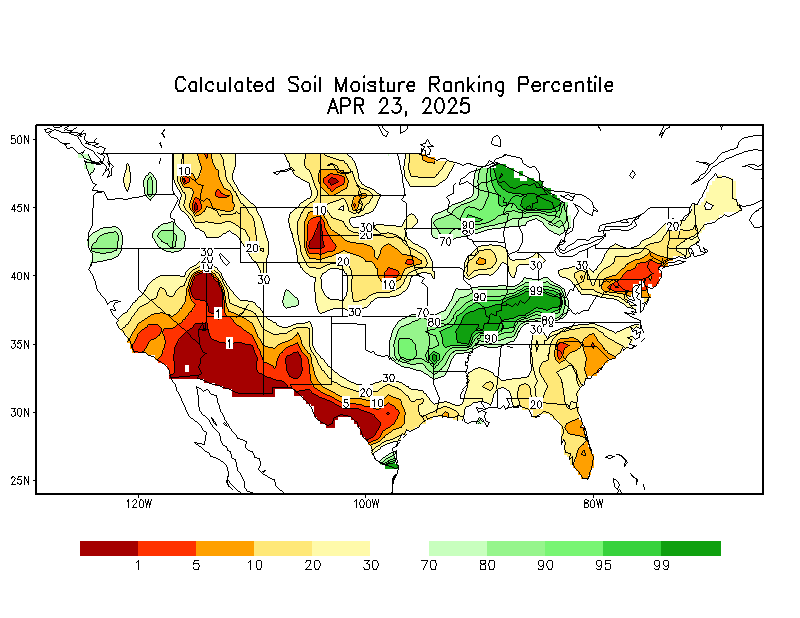
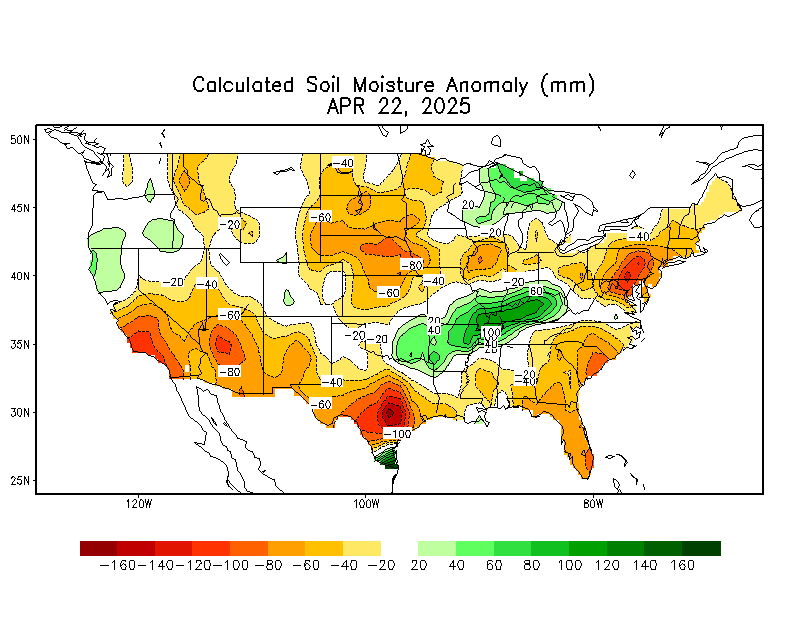
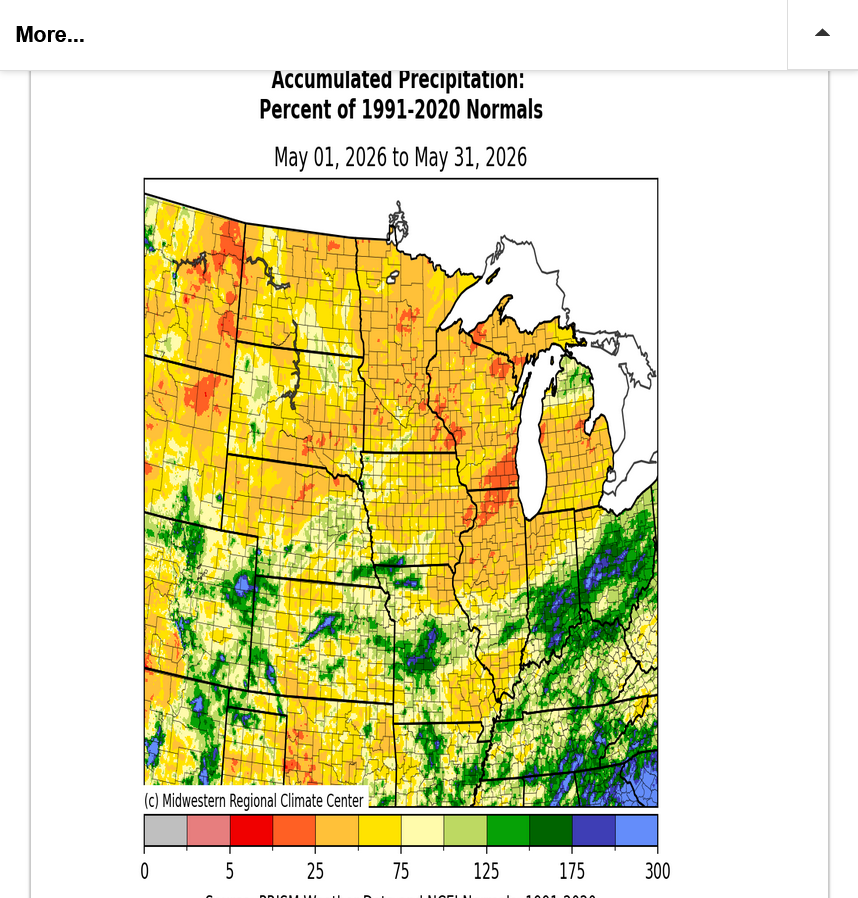
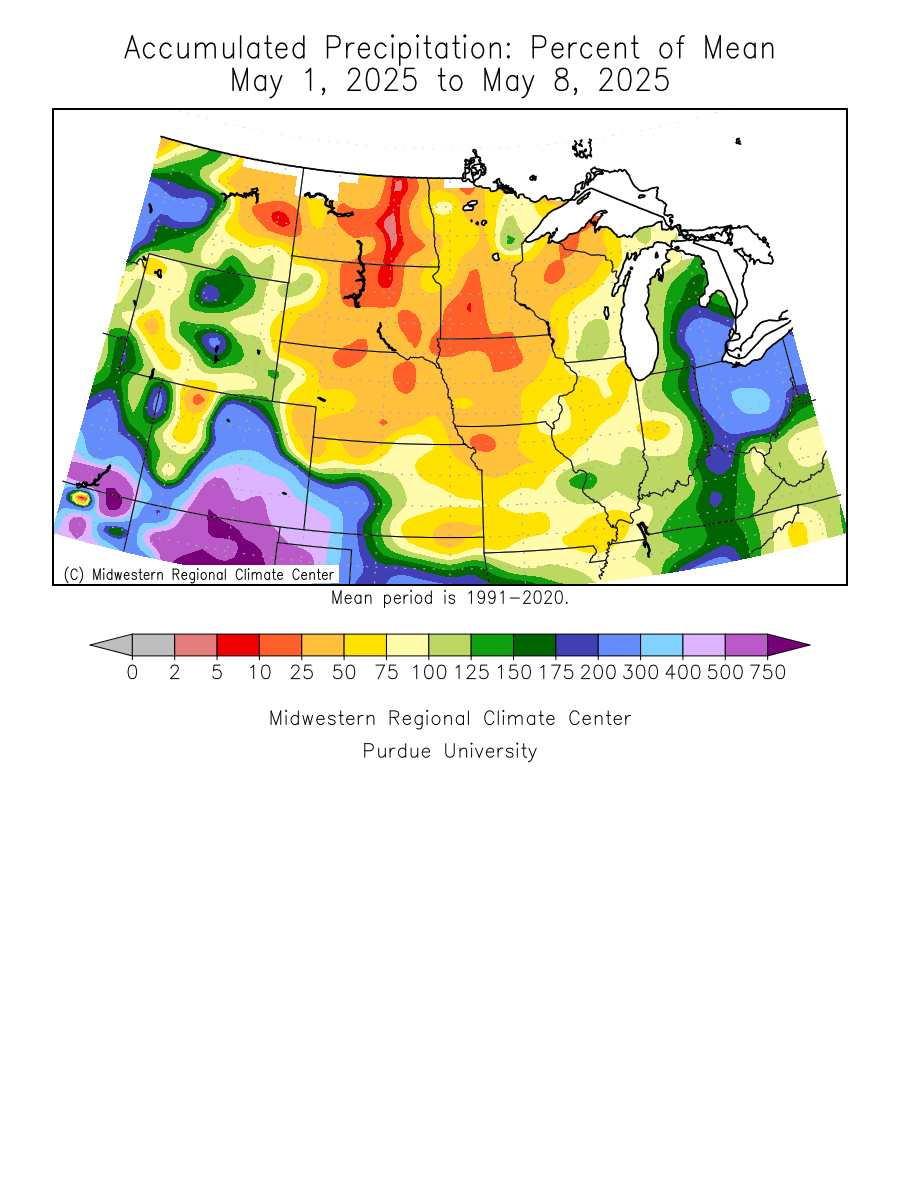
Nice post except that you are suffering from severe backyarditis. Just look at the soil moisture charts below. They tell a completely different story. Yes, there are some key areas that are now too wet and will have yield loss but in the big picture, they are a low % and not historically extreme.
Soilmoisture anomaly:
These maps sometimes take a day to catch up to incorporate the latest data(the bottom map is only updated once a week).
https://www.cpc.ncep.noaa.gov/products/Soilmst_Monitoring/US/Soilmst/Soilmst.shtml#
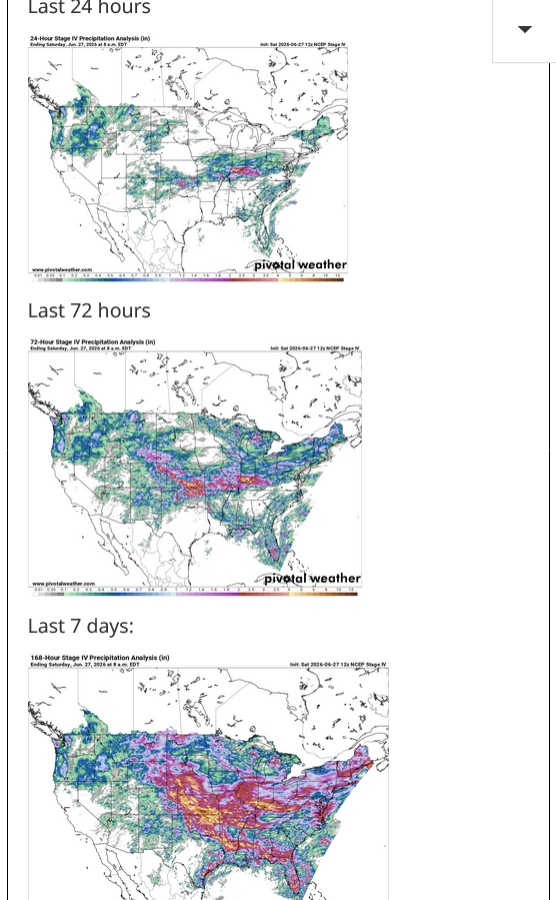
https://www.pivotalweather.com/maps.php?ds=stageiv&p=stageiv_qpe_168h_p&r=conus
Last 7 days: Snapshot:
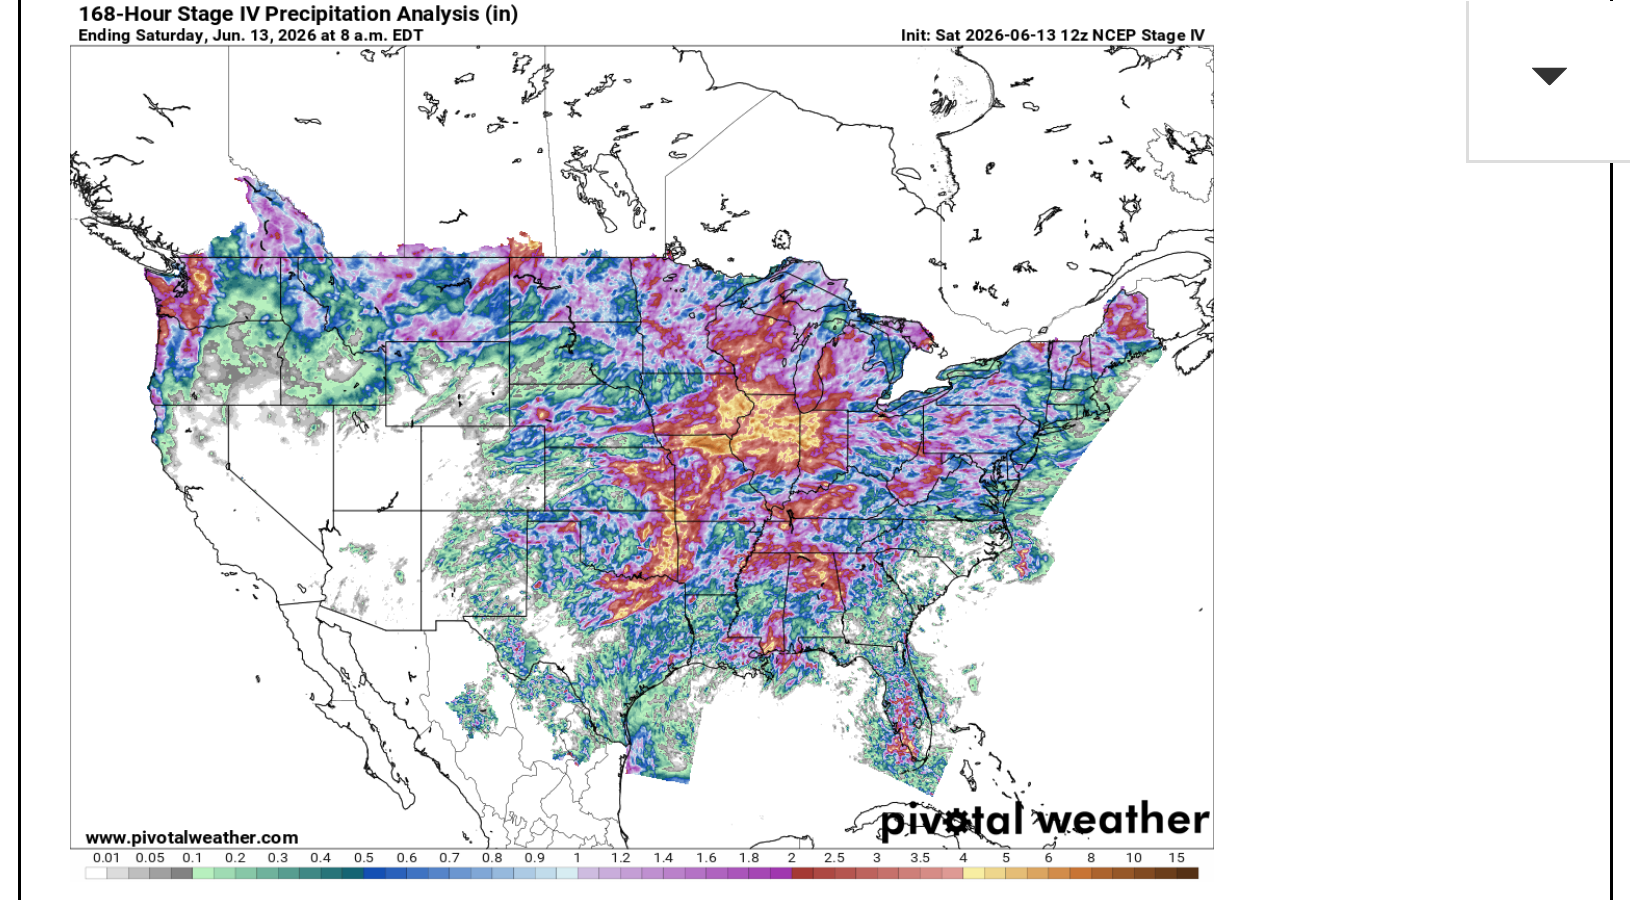
Constant update below:
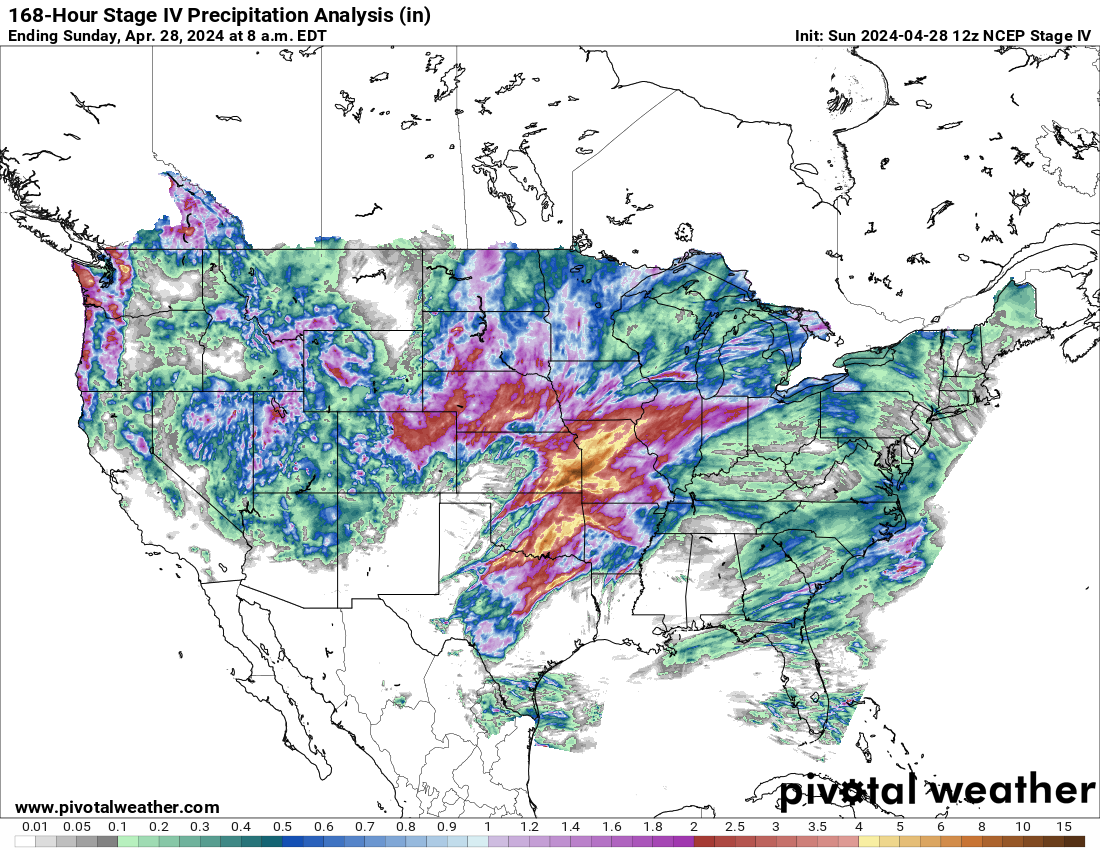
+++++++++++++++=
1. Your trade is well defined with an excellent risk limiting parameter. I contend that the best chance of going higher is if the huge heat ridge builds in during July, although what could also happen is related to your thoughts but with MUCH lower chances of impacting the Composite Man that trades rain makes grain in July.
2. If the Midwest is on the periphery of the dome, a ring of fire pattern could set up that features perturbations tracking around the periphery of the heat ridge/dome that cause repeated, very heavy rain events over the same areas which would EXPAND the limited areas that are you are concerned about right now.
Potential outcome #1 ALWAYS makes the grains go up in July.
Potential outcome #2 rarely does and only when actual events are unfolding because this is NOT a 1993 extremely wet Summer type weather pattern. It's a dome in the S. Plains with heavy rains around the periphery July pattern that features PROGRESSIVE weather systems with many dry days in between and NOT a Bermuda High along the East Coast that BLOCKS the pattern and flow and causes relentless rains from a trough in the Midwest with 1993 the most extreme example. This is the complete inverse of that pattern with a trough along the East Coast guaranteeing progression and northwest flow in the Midwest over the top of the heat ridge.
Northwest flow is capable of creating heavy rains but most Summers will northwest flow also produce abundant sunshine to maximize photosynthesis that powers crop growth/yields and minimize heat in between the widely spaced heavy rain events.
++++++++++++
I'm pretty sure that the bounce off the lows last week was related to the persistent Dome of Death heat ridge on the extended European model moving in during July staying there because of the hot and dry adversity.
I base that objectively on following all the rain events all day long, soil moisture and every important weather model along with observing the markets reaction.
Rain/Drought thread June 2026
Started by metmike - June 1, 2026, 7:51 a.m.
https://www.marketforum.com/forum/topic/120593/
++++++++++
We'll be getting the latest crop condition report tomorrow afternoon which will give us an updated snapshot picture of the ENTIRE crop which has not been great so far this year. Some places have been too dry, which makes it even harder for the Composite Man to fret about more rain in the forecast when that rain will definitely benefit those dry areas.
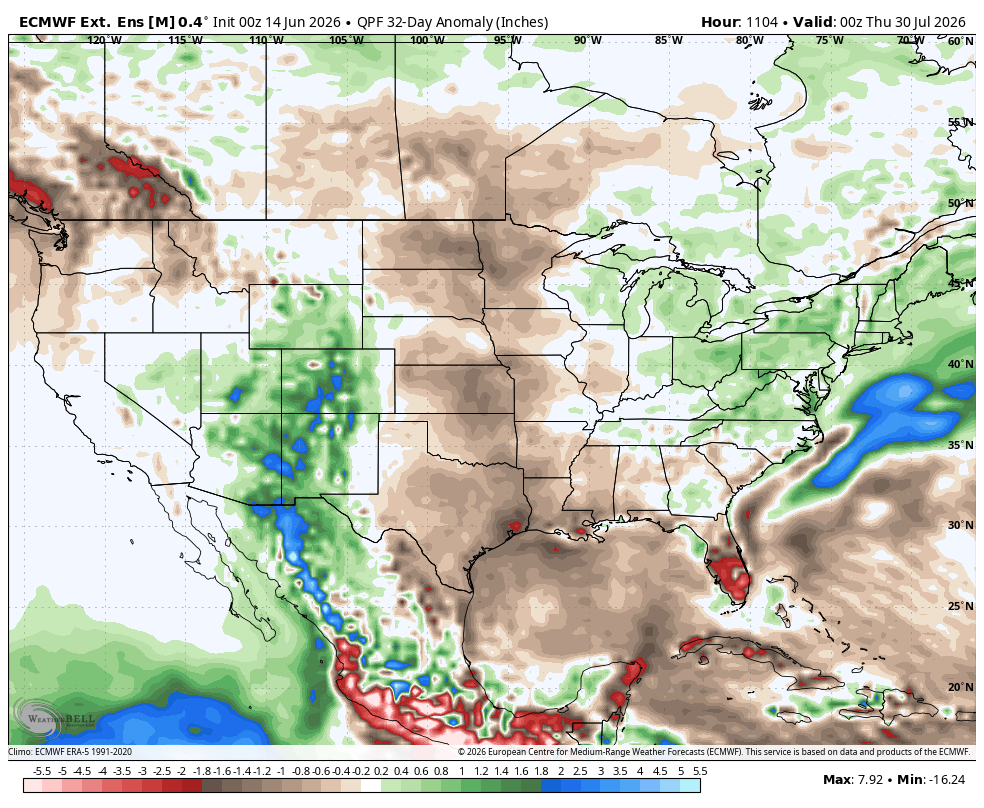
This was the last European model forecast, updated this morning for the month of July.
If the market stays higher this week and puts in a low, it will not be from worrying about too much rain in your big backyard that has high production......unless the rains increase more than they are predicted to now.
That very heavy rain is well known now. As Joe K used to say: they don't call it pastures, they call it futures for a reason.
https://www.marketforum.com/forum/topic/120593/
June 10: Heat ridge builds to a rain suppressing dome. VERY BULLISH!
June 11: Continued BULLISH!
June 12: STILL BULLISH, especially Plains to WCB. July is a key month but is far enough out to change.
June 13 Still Bullish, especially Plains to WCB. Major heat ridge Plains.
June 14: Still BULLISH from intense heat and dry in the Plains/WCB.
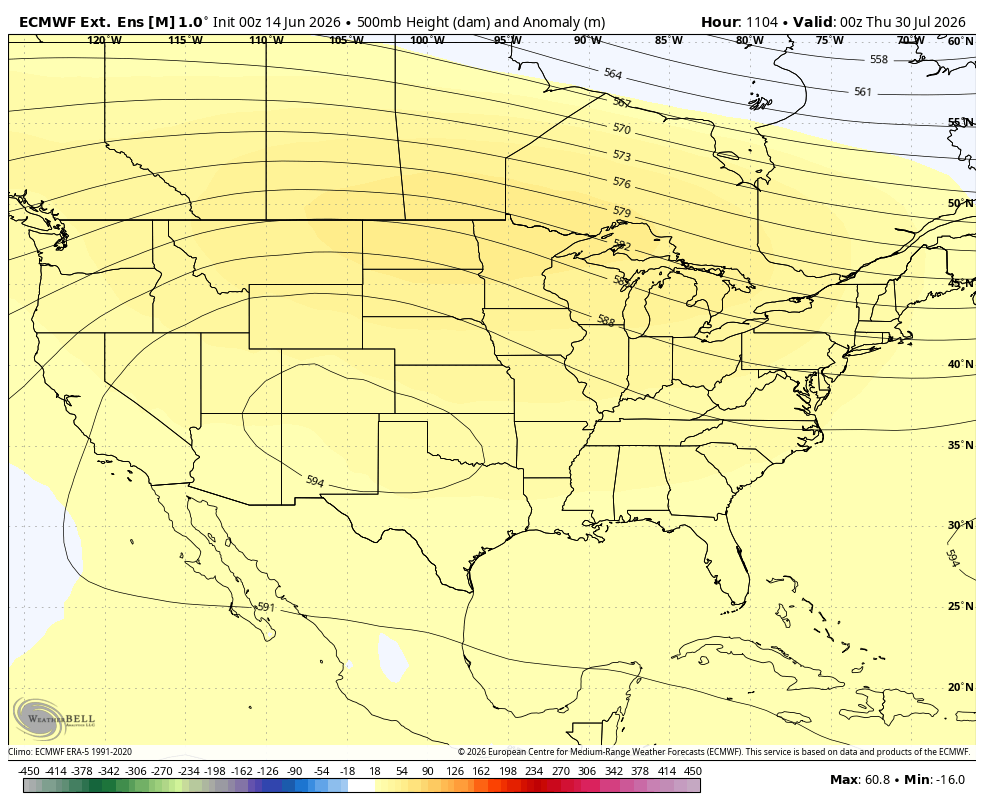
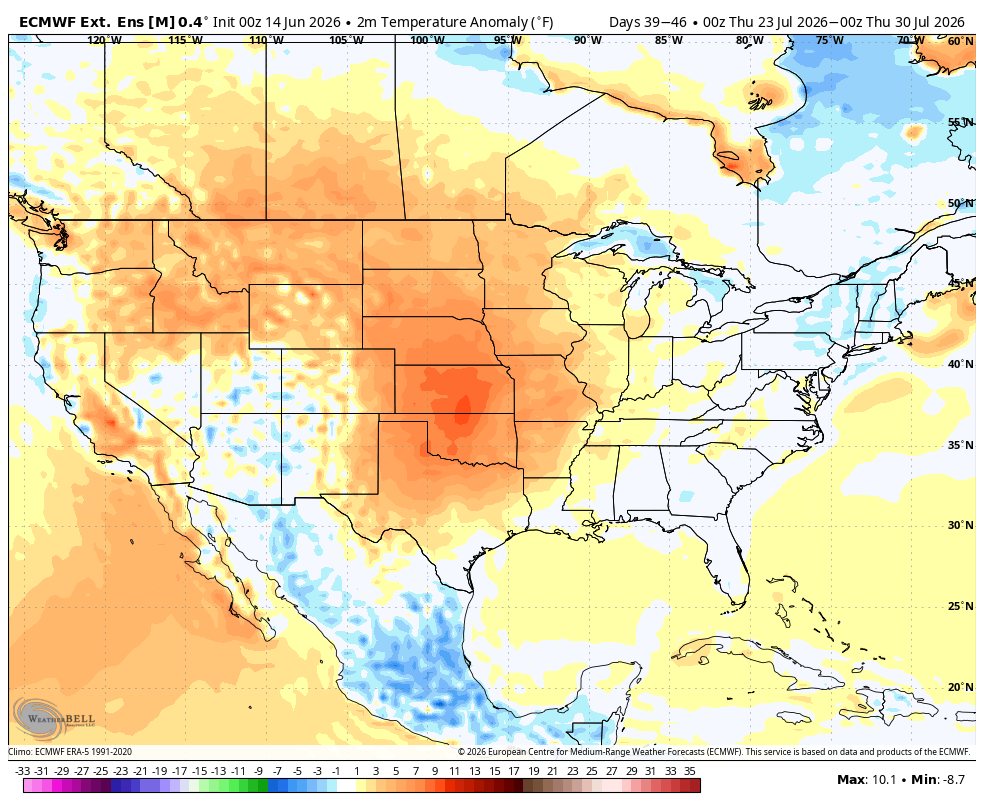
+++++++++++++++++++
6pm: This was the last run of the 12z European Ensemble run:
June 29 at 500 mb below with the prior week temperatures. Interesting that the center of the heat ridge is appearing in the Southeast at that time. This would have much different impacts than if its in the Plains.
I put the week 2 only rains(anomaly) AND the total week 1 and 2 rain anomaly below . Both have tons of additional rains, in addition to very cool temps.


The last 2 week, 12z weather models/forecast continued to keep rain coming with cool temps lingering so the grains opened LOWER since this still is a rain makes grain market.
This is the same reason that the ng market is modestly lower.
Buyers of SN, SX and CN on the open with a stop just below last weeks low got stopped out already.
CZ has traded to .5 cents above it's June low from last week but the only one not below it..........yet. It's early and July still looks very hot and dry and the current pattern could turn wetter if the upper level ridge set up in the Southeast instead of the S.Plains.
The building El Nino could have an impact. It's usually bearish but each year is different.
+++++++++
Again, the market has been trading rain makes grain and continues to trade rain makes grain right now. Everybody knows about the heavy rains in IL recently.
The main change over the weekend was to add a couple more days of cool weather and rain chances in week 2 before the Dome of Death (that never gets closer) arrives in July.
It was supposed to come in the 3rd week of June. Then the 4th week in June. Now it's the start of July. Every day it gets delayed is an extra day of rain makes grain and 1 day closer to making the crop.
The crude being sharply lower might have put a tiny bit of pressure on the grains to but at this time of year, the weather always gets top priority.
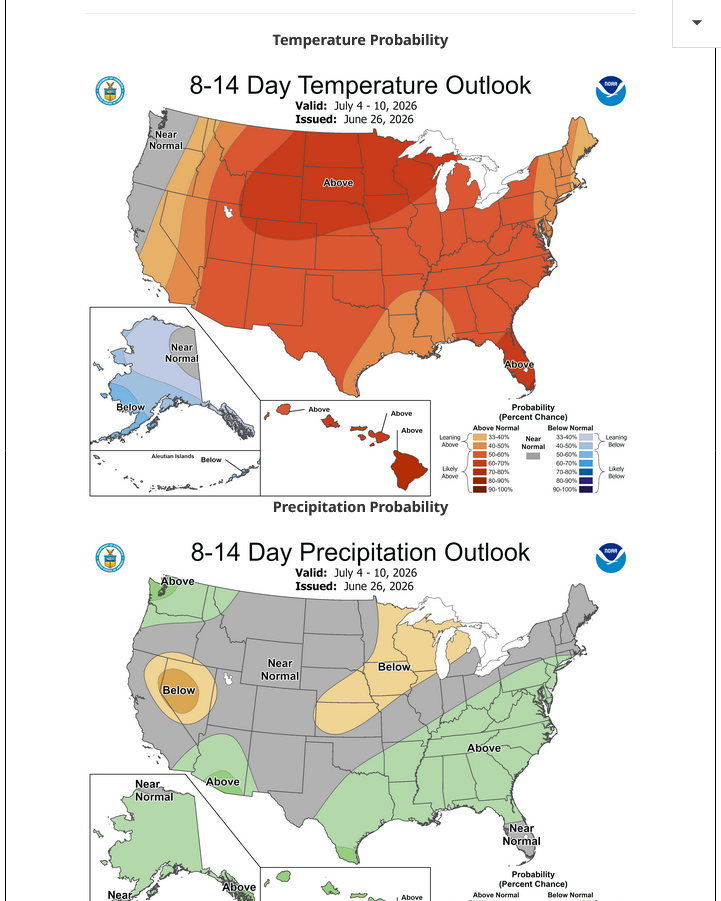
https://www.cpc.ncep.noaa.gov/products/predictions/610day/
Temperature Probability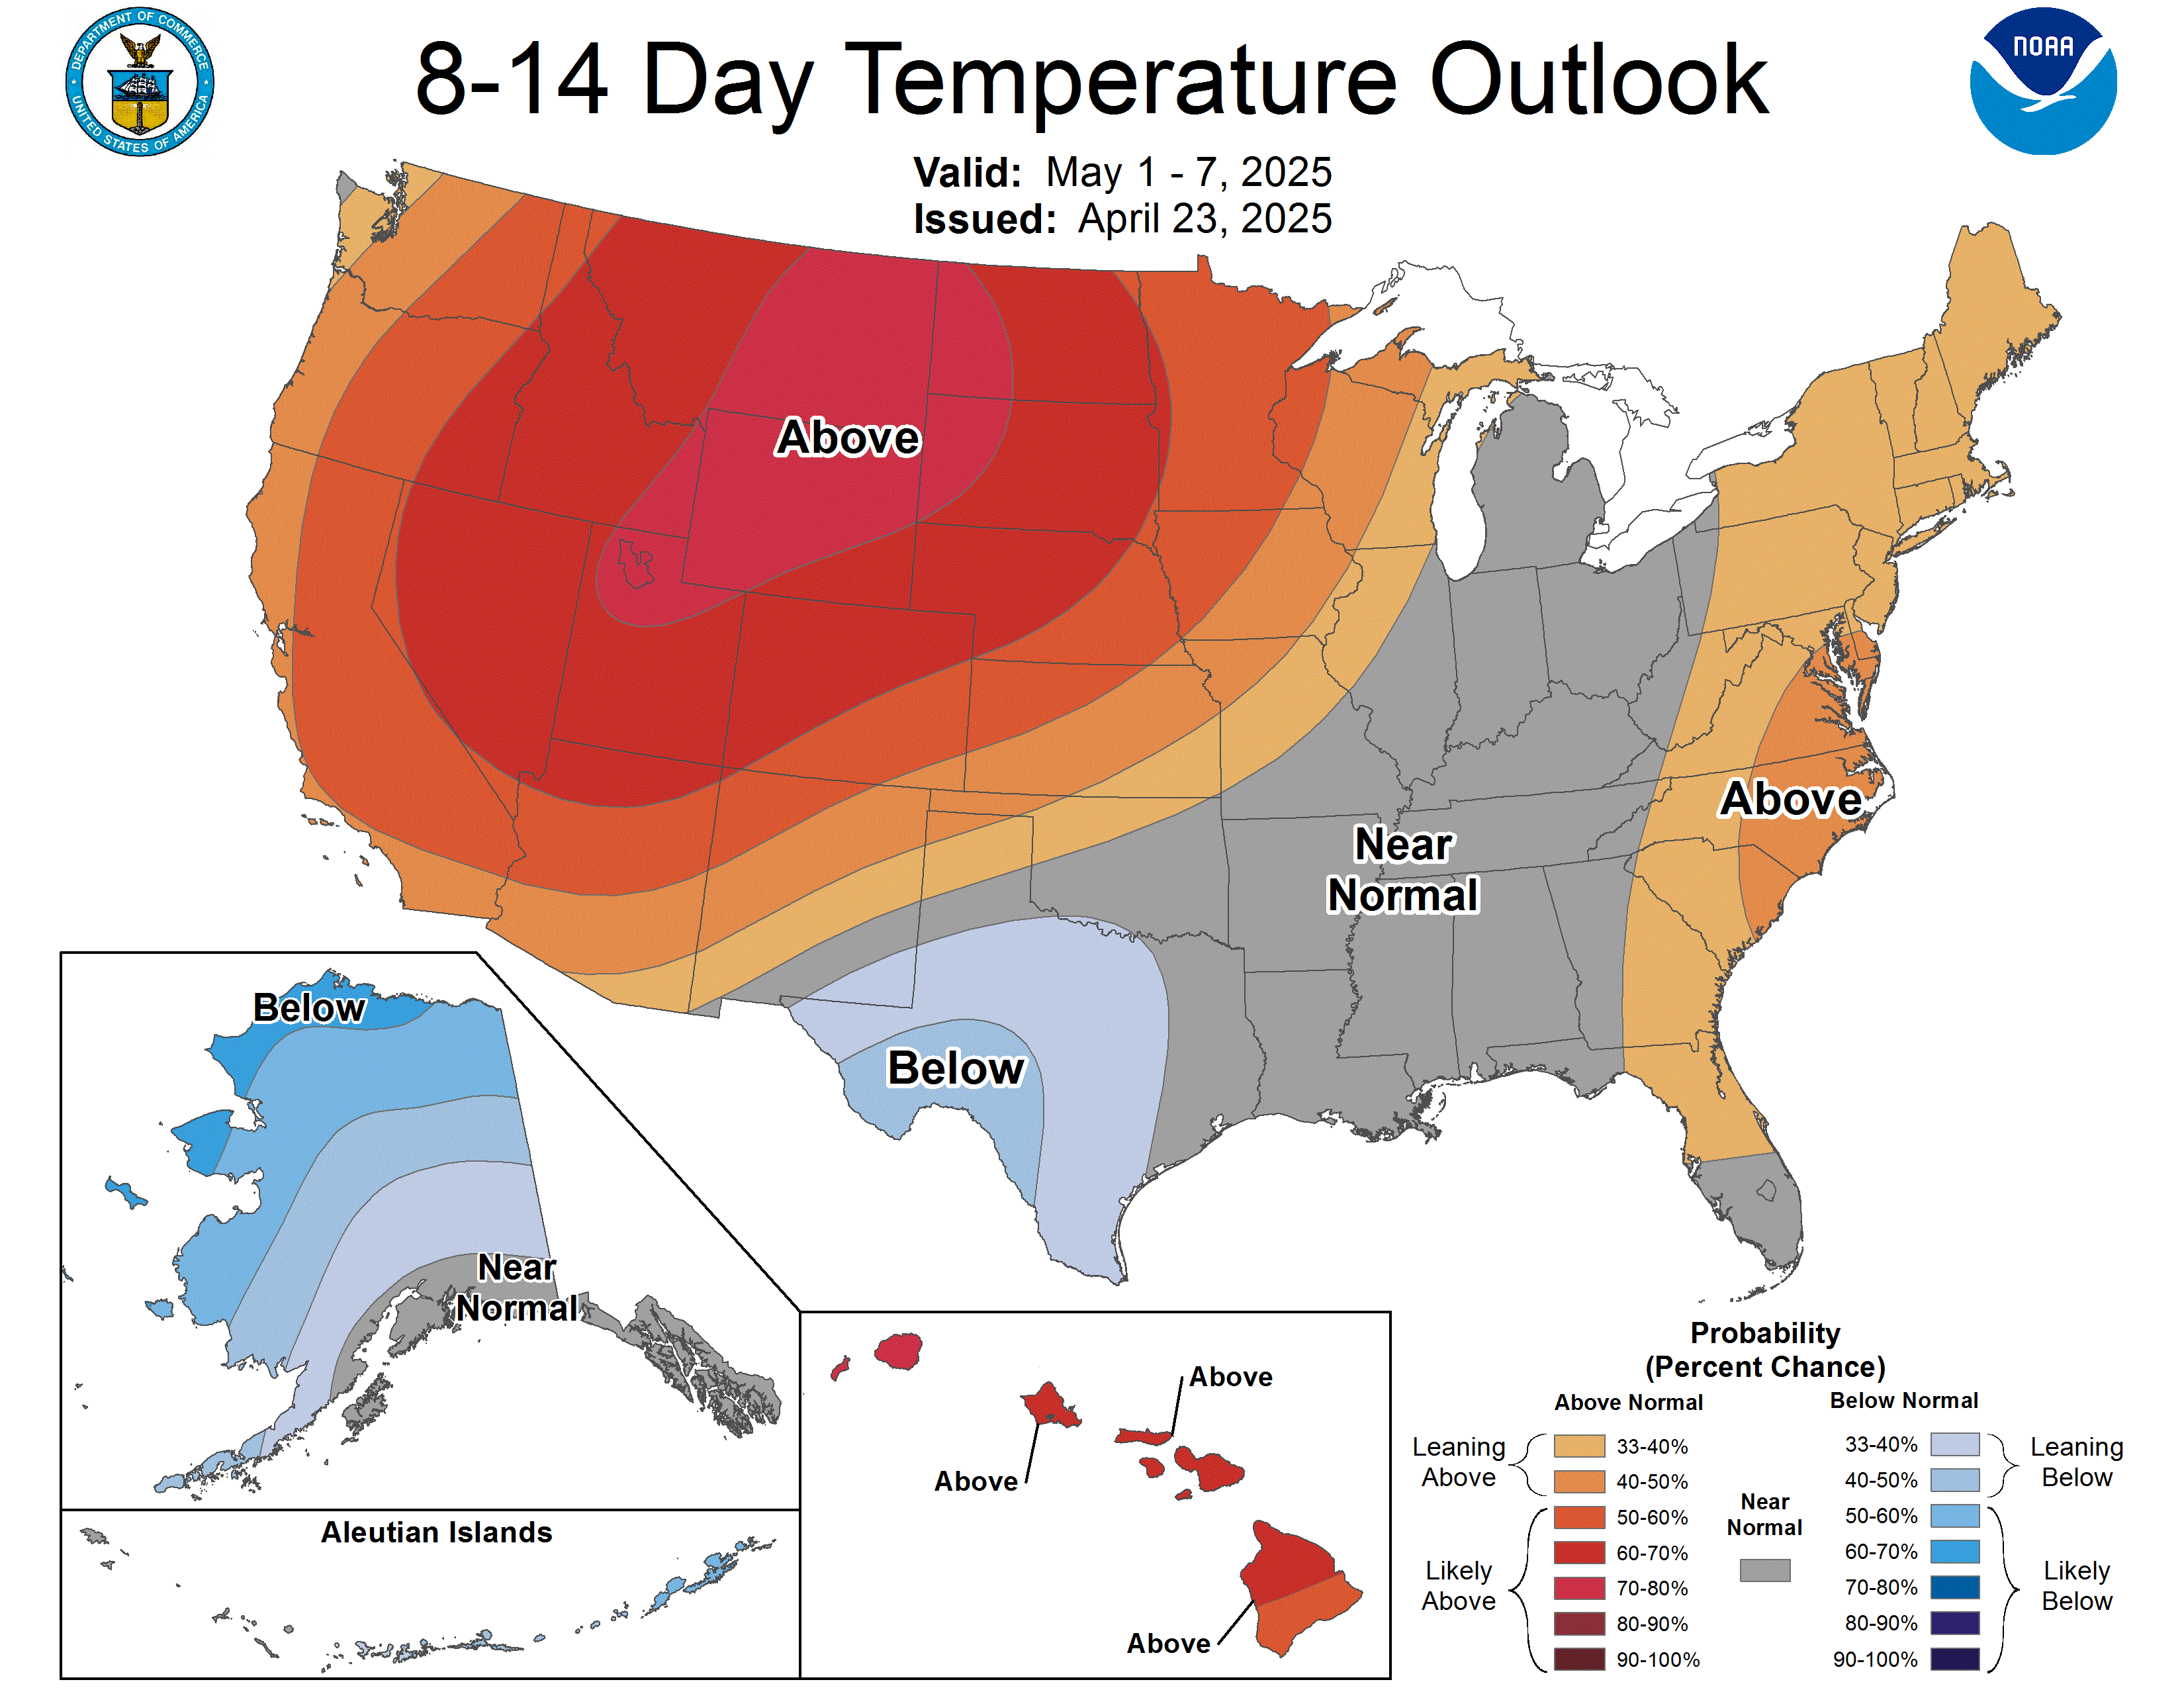 | |
Precipitation Probability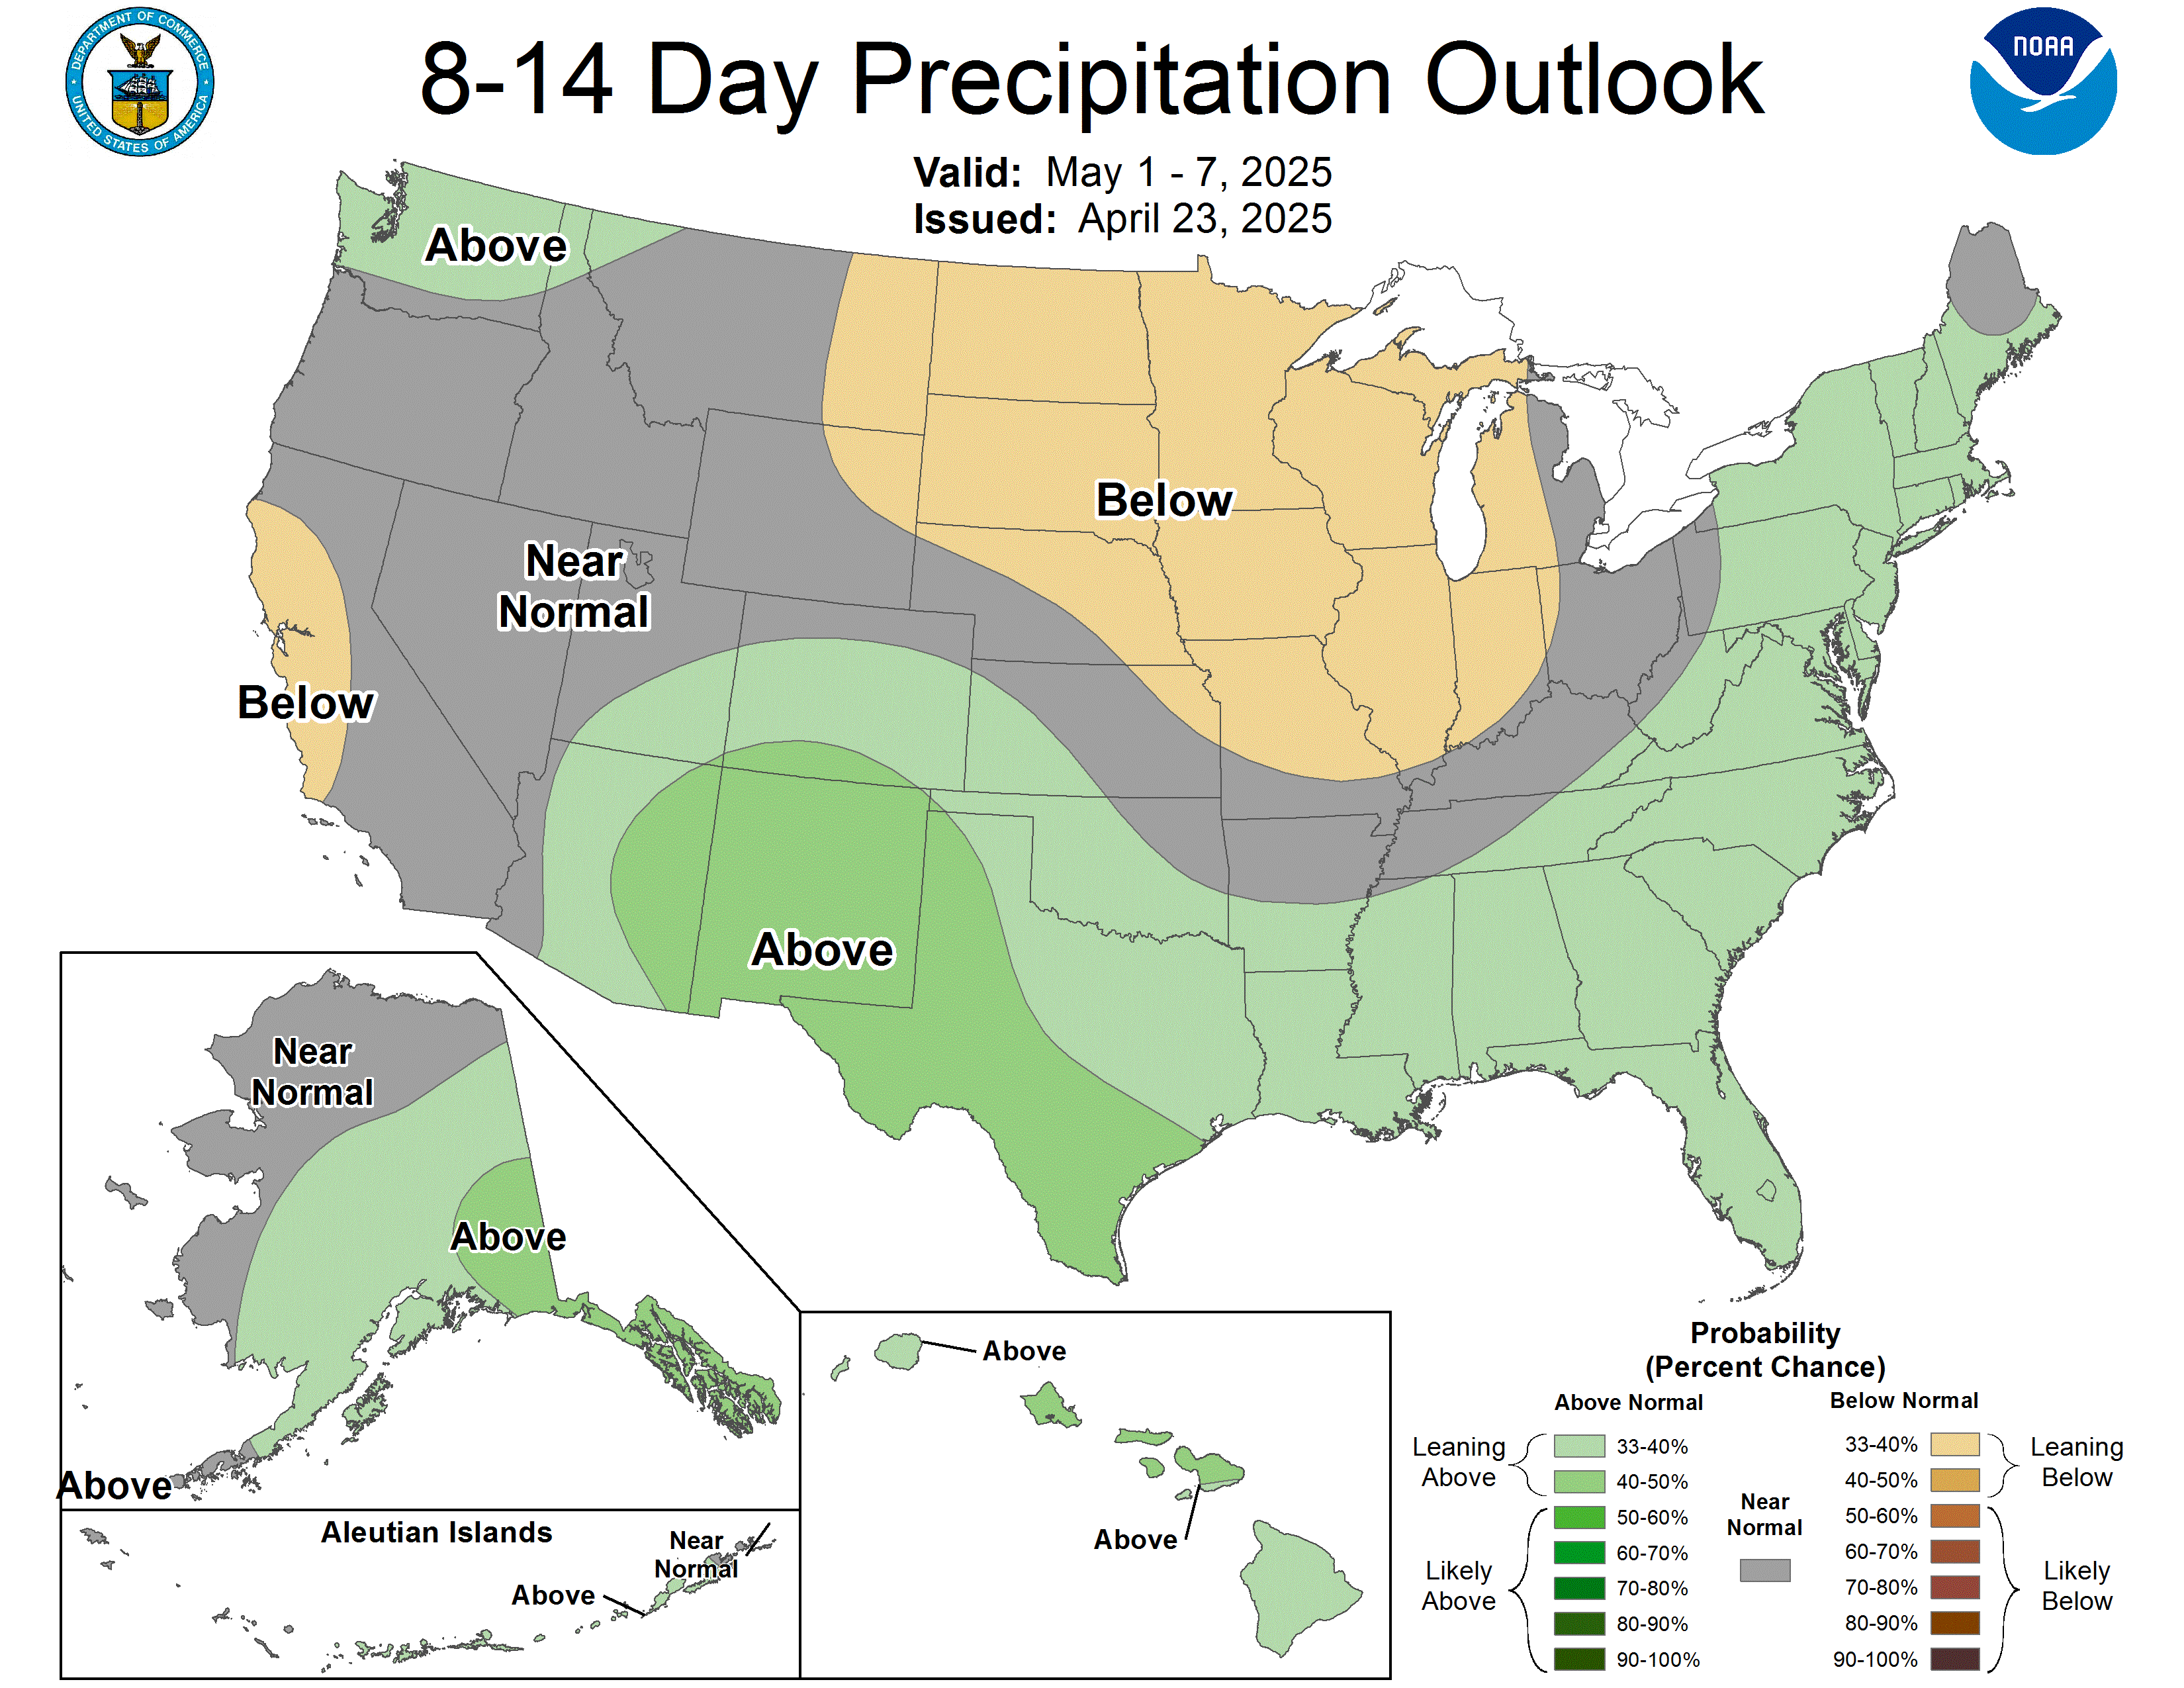 | |
Corn often peaks first after being planted in timely fashion in NON drought years.
https://charts.equityclock.com/corn-futures-c-seasonal-chart

Beans key developmental stage, flowering/pod fill is the latest, late July/August and typically peaks last.
https://charts.equityclock.com/soybeans-futures-s-seasonal-chart

The corn and beans almost always move in tandem, especially since they have very similar planting and growing seasons impacted by the exact same weather systems. If the weather is good from late May onward, for instance, corn will peak and beans will peak early but still hold more risk premium than corn.
good importantly, let's look at the seasonals in July. This is by far the weakest month for corn and beans of any months by an extremely wide margin.
Each year is different, however. This year, we saw our seasonal top a month early because it was dry in April/May which provided great planting and we eliminated that dryness with big rains in many places the last couple of weeks. The markets had peaked when the rains were still in the forecast, well before they fell. That's what always happens with weather (futures) markets.
The markets will be trading future weather, that right now includes expectations for hot/dry in July even though the next 2 weeks count the most, like a bird in hand being worth 2 in the bush.
If that hot/dry verifies in July, there will be much more time to hurt the beans, even though heat in corn pollination and heat fill would not be good for corn. If it verifies, the current prices will look cheap.
There have been numerous rallies in July and all of them have been from hot/dry except for July 1993. Many heavy rain events like those recently but none of them have caused July prices to go higher, other than brief spikes for a couple of days.
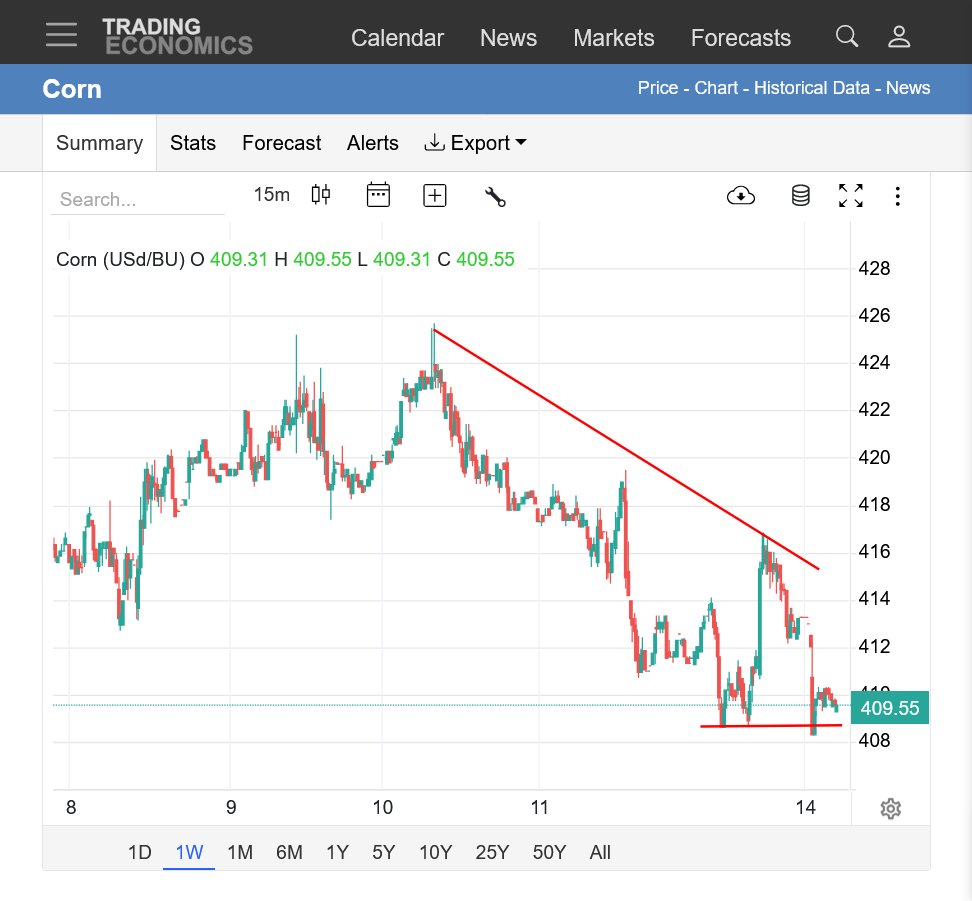
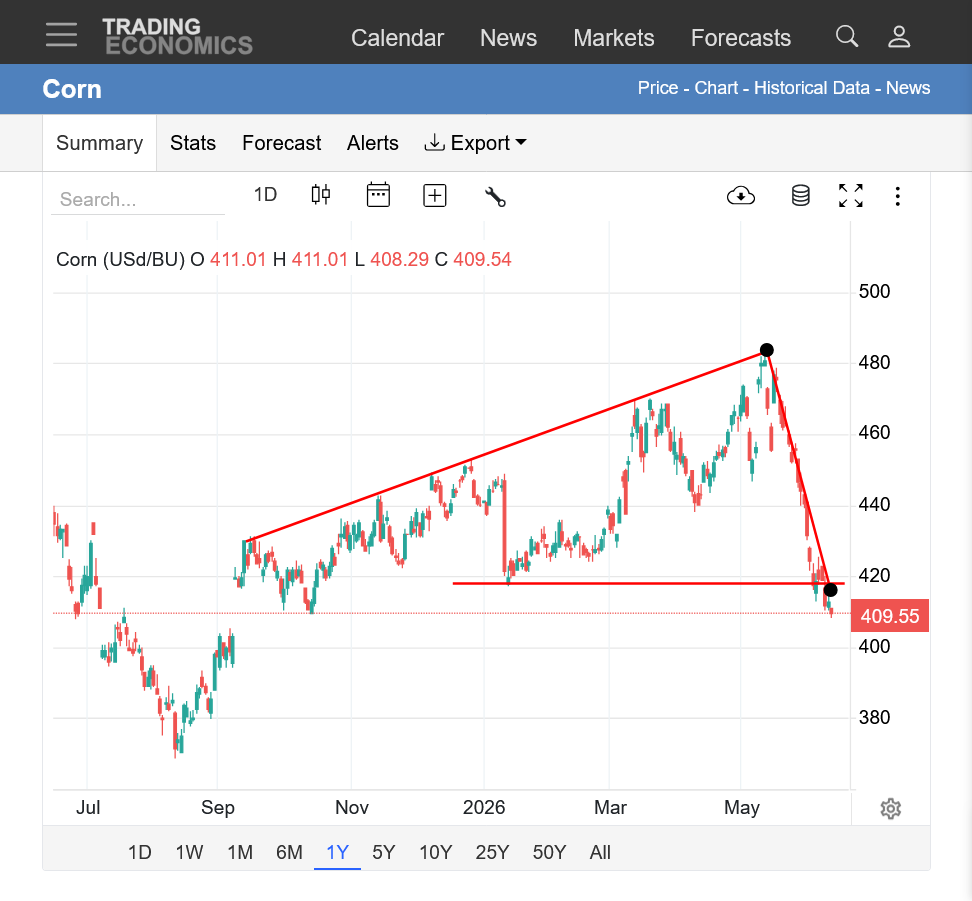
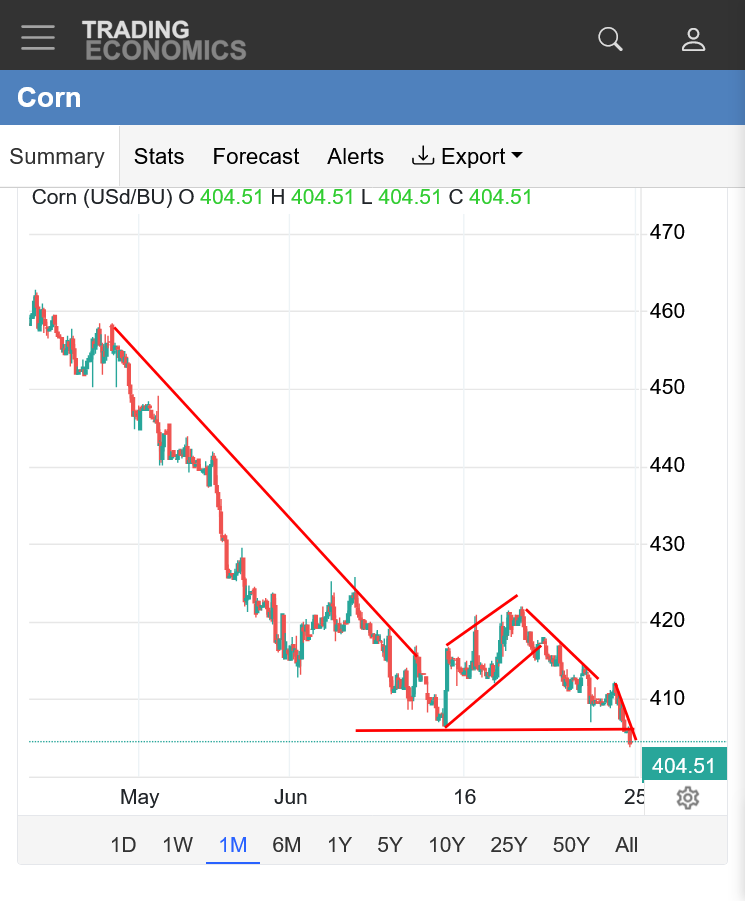
Corn
1. 1 week: Fresh lows tonight but just above that.
2. 1 year Major bottom last August with strong uptrend, then MAJOR top in May and steep downtrend. Trading near 2026 lows.
https://tradingeconomics.com/commodity/corn
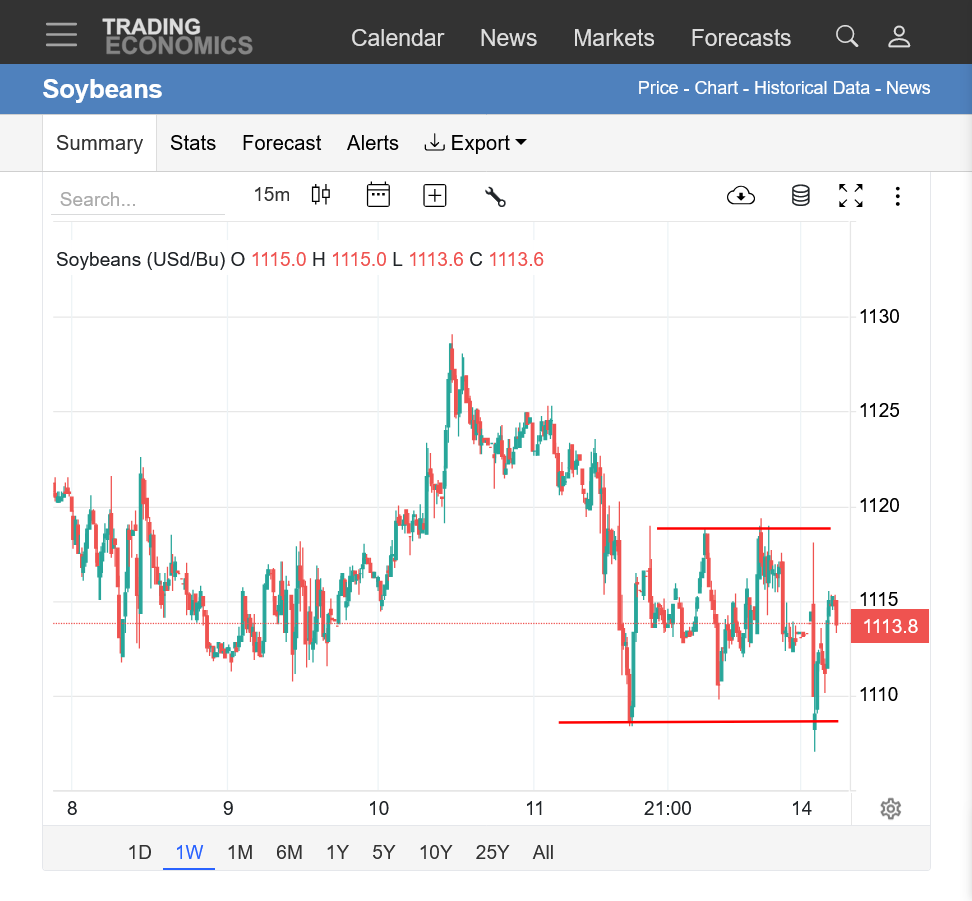
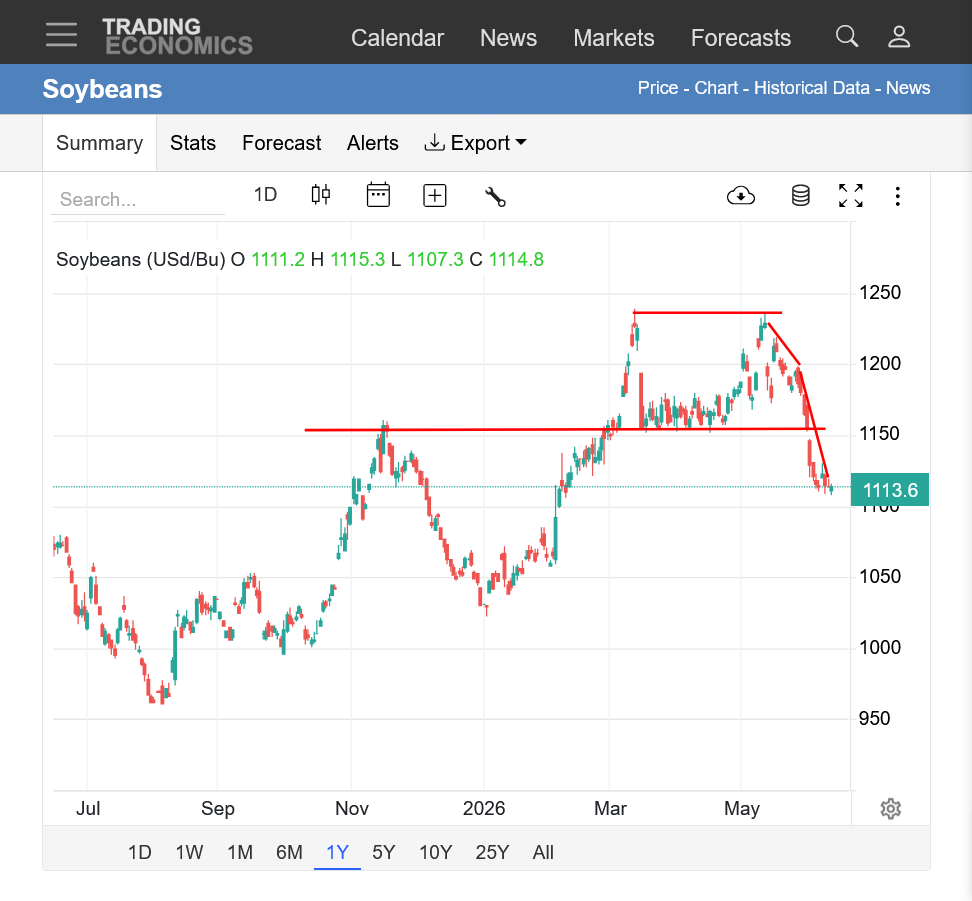
Beans
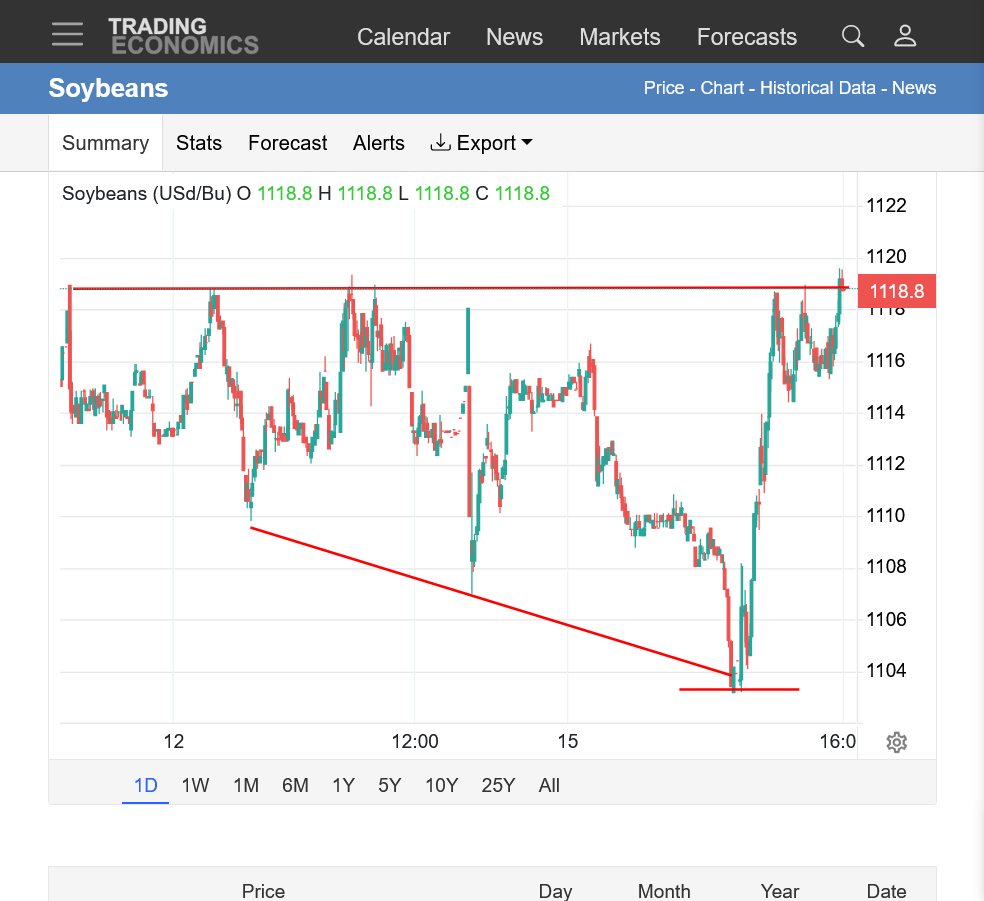
https://tradingeconomics.com/commodity/soybeans
1. 1 week: Fresh lows tonight but now above those.
2. 1 year: Double top Mar-May. Currently well above 2026 lows and stronger than corn.
Brain Splitt gives his technical analysis, and fund positions.
Thank you MetMike for excellent 'weather' post complete with sound trading analysis.
My cycle work 'must' trend from today onward or may need another daily cycle 28 days +/_ to complete.
Farmers--you are just too good at what you do, that is, raising bountiful crops!!
As of 9:36chi time, corn and wheat have turned plus with beans -1.5. Exhaustion? New weather?
YW, tjc!
The pattern coming up is not a 1 way street for weather. In the next 10 days, it's bearish as heck by previous standards. Widespread rains(too much in some spots) and VERY cool temps.
Rain makes grain mentality dominates in late June and with this pattern.
Then we see an abrupt change to the pattern in July to potentially BULLISH. In past Summers, this is when I'm vulnerable to a big loss. 1 July, I lost $286,000 on a trade picking the bottom on the dome of death and was a day early being long 300 CZ and 200 SX with a stop below the lows. The market spike lower, hit my stops and those were the lows of the entire Summer and I couldn't make myself buy again as we soared higher for the rest of July and I would have made a million bucks if I'd just waited 1 more day or if I had waited to buy when I was selling the 300 corn/200 beans to cover on the stops.
This is why I never used to put in stops for my first 15 years trading but on that one, I got nervous when the drawdown was ratcheting higher and had gobbled up so much equity and I was OVER leveraged beyond my emotional and financial means. Maybe my best market call in 3+ decades of trading(picking the spike low bottom just before that 4th of July weekend-that actually happened the day AFTER) and losing the most money ever. My trading style in those days was to put on the biggest position I could for every trade based on margin requirements and have no stops.
Insane by todays standards but I just waited and waited and waited for just the right times to do it and was receiving weather information BEFORE the market that gave me an edge. Today, the market gets MORE weather information than me and some of it minutes faster than me.
Anyways, the point is that if July is really going to feature a dome of death heat ridge, the current heavy rains and cool pattern could be putting in a spike low bottom before we take off higher in July and everybody buying early will get clobbered like I did.
It's very possible too that the longer range models are out to lunch on the July weather pattern and staying short is the right position. Regardless, what we have is sort of a showdown right now. Extremely wet and cool the next 2 weeks followed by the potential of the complete opposite with a PATTERN CHANGE.
Almost every great weather trade has featured a PATTERN CHANGE. When a pattern causing the market to go strongly in 1 direction shifts to a completely opposite pattern that causes the market to go in the exact opposite direction.
This usually happens at tops and bottoms in weather markets. Each time is different and sometimes it's a FAKE weather pattern change because weather models, especially starting in week 2 have growing errors and reduced skill.
tjc,
I started typing that response above an hour ago before reading your post and didn't finish it until after your comment but it addresses your comment exactly.
++++++++++++
Also, the initial plunge in prices was so powerful after the top because THE FUND HAD RECORD LONGS!
Funds selling massive contracts were the main fuel that fed the intensity of the drop. They are sitting ducks at major tops and bottoms in weather markets when the weather pattern changes.
Much of that fuel is used up. The funds are still long beans but not AS long.
Regardless, if the weather stays bearish, the funds will build a short position in corn and cover the rest of their beans but at a MUCH, MUCH less rate that happened right after the top.
In other words, the easy money being short has been made because we already harvested the speculative longs that got caught with the WRONG position in record fashion and all had to cover at the same time.......with sell signals flashing on their screens based on technical, weather and other longer term indicators which reversed from the buy signals which caused them to add more and more to establish their record long position.
It really was caused by all the recent rains showing up in the extended models over 2 weeks ago. This is mostly dialed in. Adding more rains now, is not NEW news like it was back in May, after the Midwest had dried out and we had a flash drought in some key growing areas and funds had record longs to cover.
The selling set up in May was perfect and tjc nailed it like a pro and shared that with us.
It's way more complicated and tricky now. Uncertainty abounds on the weather that matters the most.
What if I knew with 100% certainty that July 2026 will be one of the hottest, driest months ever in the Cornbelt but the market doesn't know that or at least embrace that for several more days?
That was the recipe for my biggest loss ever! The market is always right at any point in time but almost always wrong about the price for next week and next month. The trick is predicting how much the market will be wrong by and most importantly, predicting WHEN the market will start on the new, course correction to being right down the road and having the right speculative position on to maximize the markets course correction WHEN its taking place while at the same time, trying to minimize risk and most importantly, recognizing the potential that WE MIGHT BE WRONG and never get married to any position at any time.
Do daily and even hourly checks.
If I was not already long/short here, would I want to put this position on right now? If unsure, at least put in stops. If the answer is no, consider taking profits or covering for a small loss to keep it from turning into a huge loss.
If the answer is yes. Stay the course with confidence.
MetMike
We all have trading 'flaws', and mine might be that I anticipate a bottom/top reversal situation, execute the trade, then sweat a drawdown UNTIL market does in fact reverse.
My suggestion "it might be too wet" perhaps is a fundamental reason for a trade; the low RSI, cycle timeframes indeed justified my "search" for reason to initiate a trade. Perhaps today is exhausting shorts. The close will be important.
Thanks, tjc,
The close tells us something that I teach in chess.
"The most important move in the game, is what your opponent did last"
HOWEVER, the close only tells us what the markets thoughts were at the end of Monday.
On Tuesday's session the market will be focusing on NEW information and discard the old information it had on the close Monday. Our opponent will have dialed in new information and made additional moves based on that, starting with the open at 7pm Tonight and continuing Tuesday.
The new information will include crop conditions/ratings at 3pm this afternoon and most importantly, weather updates from models that replace the OLD information from the weather models the market is trading this morning.
The only reason that I trade grains(and NG) is because they respond to changes in the weather models that TRUMP whatever close the market makes on a particular day or whatever price the market was trading BEFORE the change to the weather.
Corn and soybean ratings went UP 1% since last week. This should not be a surprise to the market.
Cotton saw a 3% reduction in the Good/Excellent but was offset by a 3% reduction in the Very Poor category and a 6% increase in the fair category. This is pretty unusual and is probably neutral.
https://release.nass.usda.gov/reports/prog2426.pdf
++++++++++
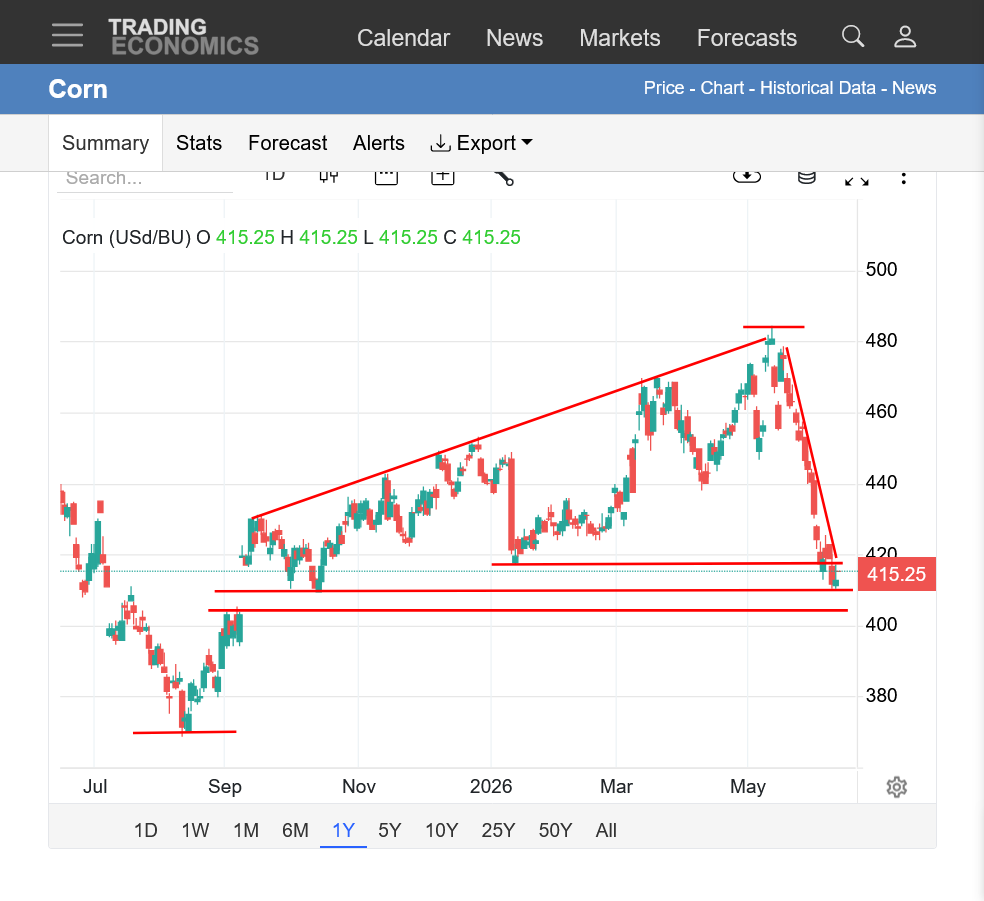
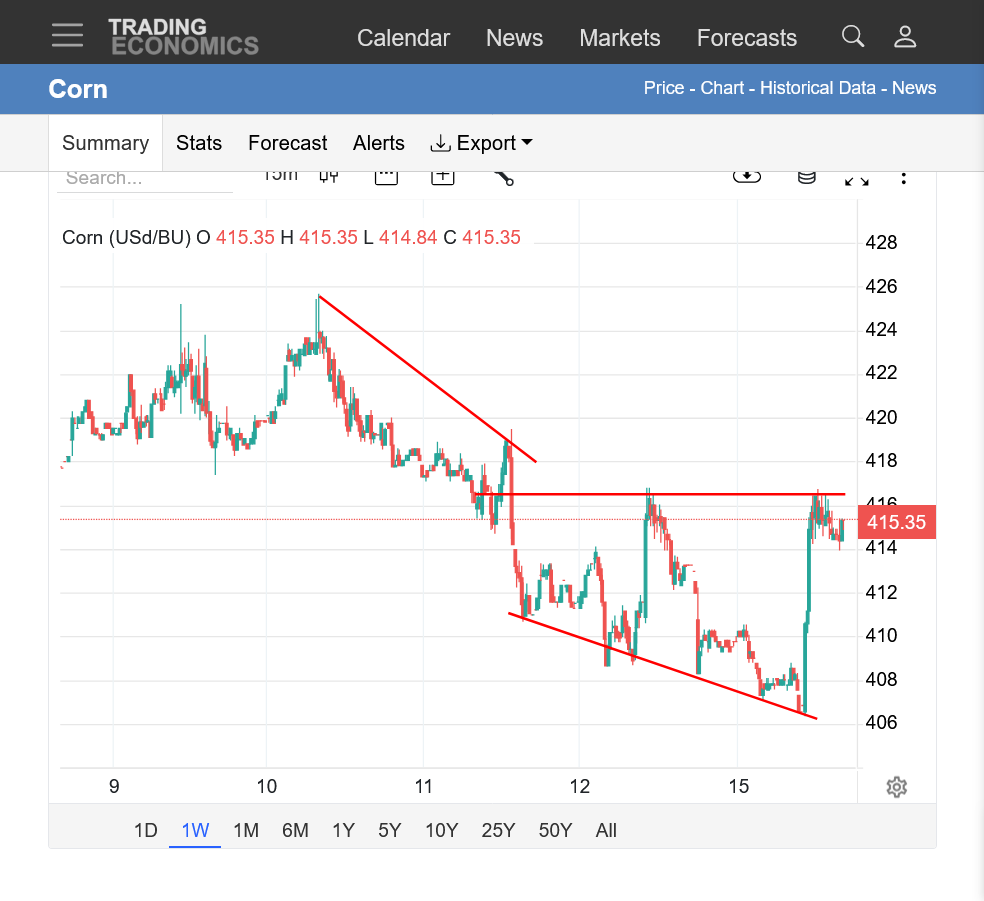
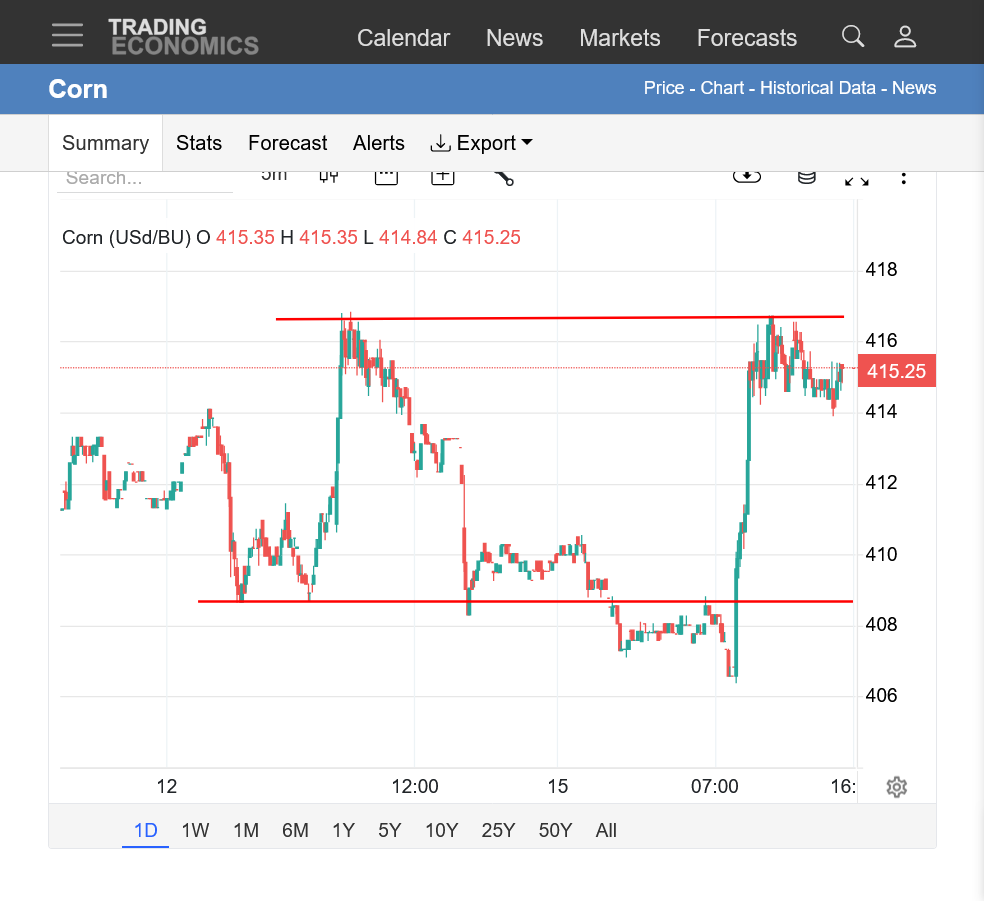
https://tradingeconomics.com/commodity/corn
1. 1 year MAJOR low late last Summer, followed by strong uptrend, then MAJOR top in May and collapse in price as funds sold off their record long, speculative position. We are at some major support here that includes a gap from last September and oversold. Note
2. 1 week: Strong downtrend. Descending triangle/wedge at the end.
3. 1 day: New lows for the move overnight but the big funds game in at 8:30am with huge buying. Double top or are we going to break out to the upside here?
Soybeans below:
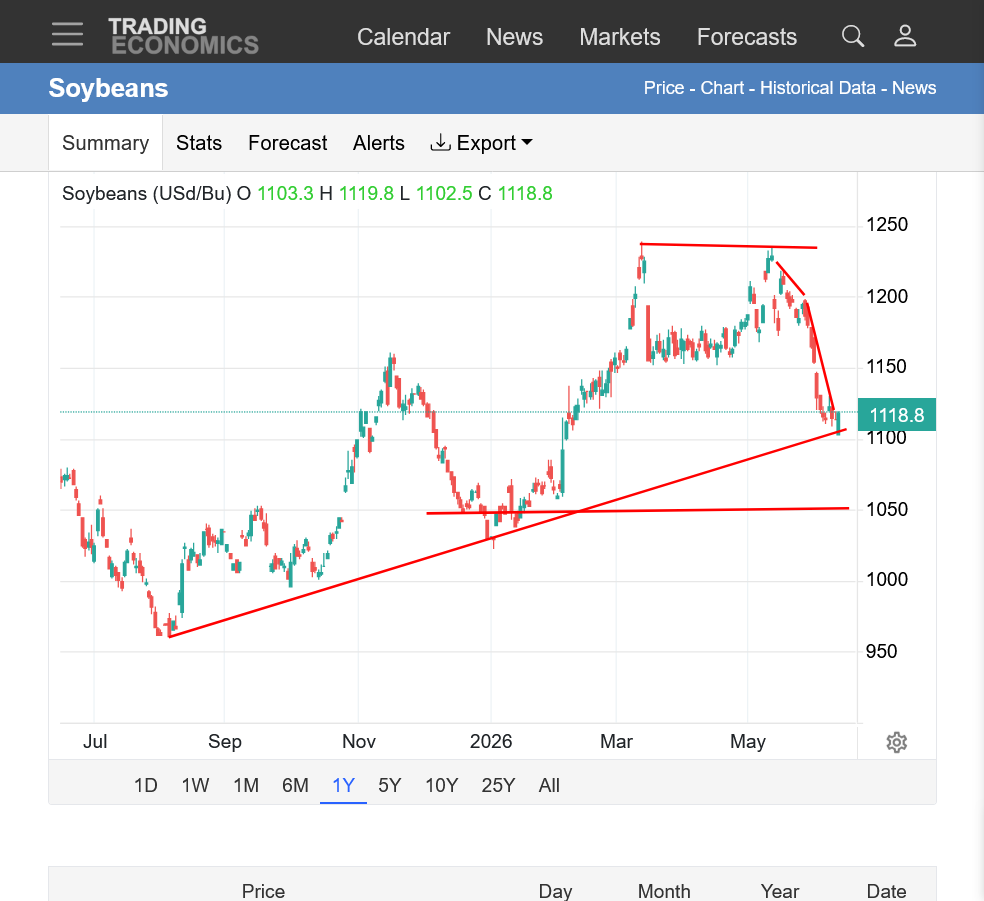
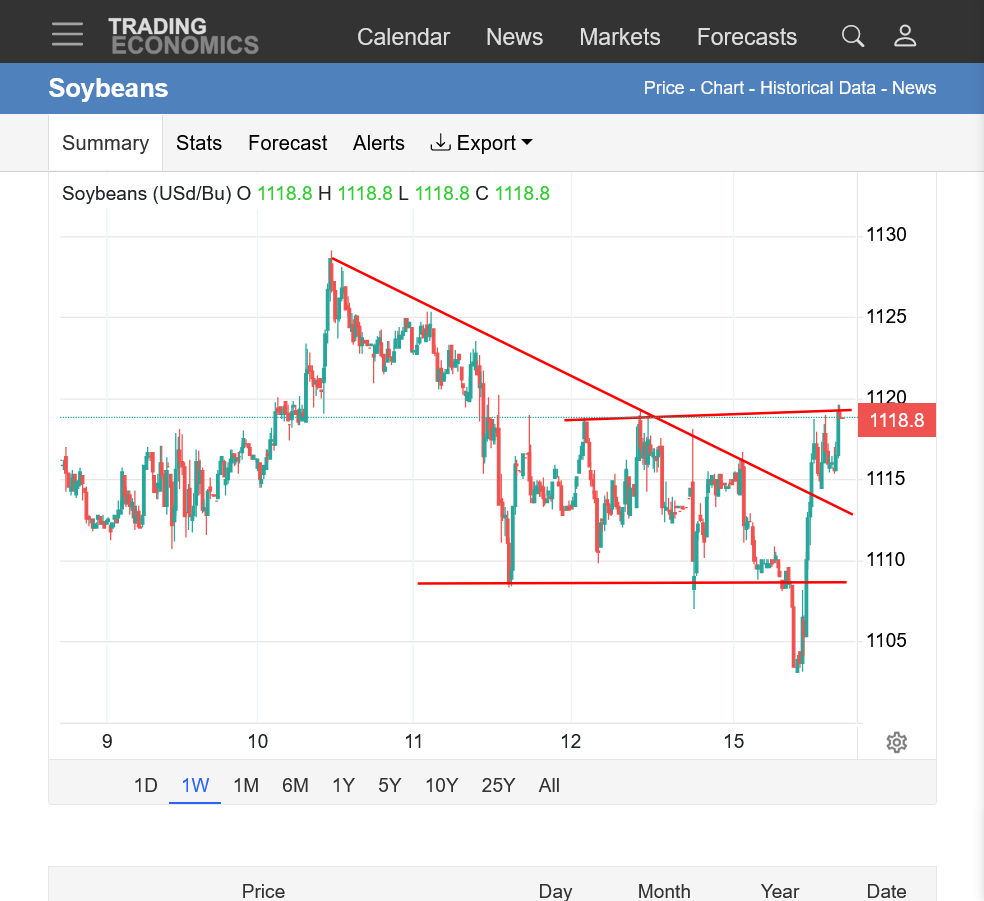
https://tradingeconomics.com/commodity/soybeans
1. 1 year: Stronger than corn recently. Barely holding the uptrend line. Staying ABOVE 2026 lows so far. Corn usually does lose risk premium earlier and faster in the growing season with beans critical period(flowering) coming later.
2. 1 week: Strong downtrend to new lows with a reversal up at 8:30 am when the big funds came in buying. At resistance.
3. 1 day: Closer look at the #2. Reversal with huge fund buying on the day session open. Closing on resistance. Descending wedge but it's just a 1 day chart pattern.
This last long range GEFS for most of July continues to look more bearish other than for the N.Plains.
This is a ring of fire pattern with perturbations coming around the periphery of the heat ridge triggering active storm clusters with breaks with sunshine in between. All the rain east of the heat ridge will help to keep temperatures down.
An important factor in July that's independent of other factors is soil moisture.
If soil moisture is high, its very tough to generate long lasting heat. Recent rains that have eradicated drought in so many places in the Midwest and South have reduced odds of July being a hot/dry month..


Grains were lower again overnight because this is still a "rain makes grain" market at this time.
If the the weather forecast gets MUCH wetter, which can happen then the market can change to a "rain makes too much grain" market but that doesn't change the fact that based on everything the market knew and was trading the last several days, this was still a rain makes grain market. That includes the known excessive rains that fell in IL.
In other words, this is the difference between skill and luck.
For instance, if I make a really bad call based on not understanding the market at the time(excessive rains being bullish) and the weather pattern changes, not because I was predicting that change or understanding it but because I just got lucky that DOES NOT turn my being really wrong before into being right then but just being too early.
That logic is the worst thing for trading mentality. Traders that make really bad assessments but get lucky and assign it to being smart..........which reinforces the exact WRONG things for long term success.
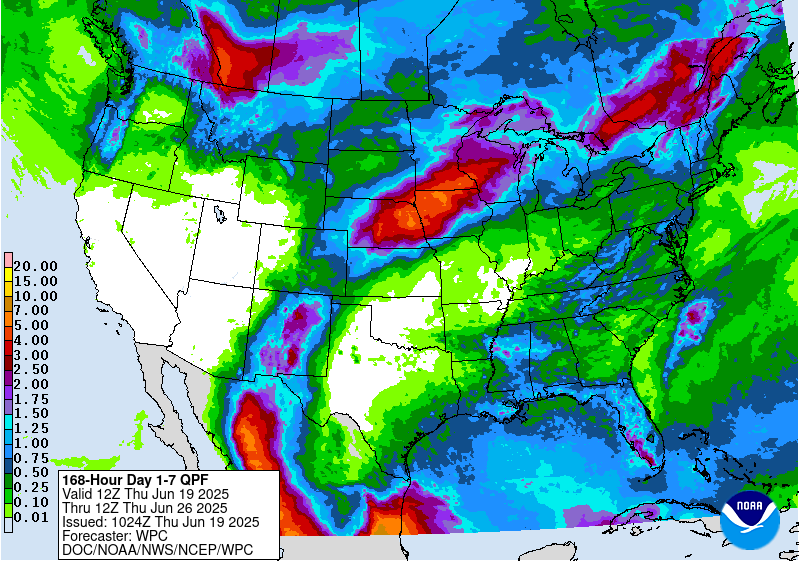
June 16: EXCESSIVE RAINS along the western Gulf Coast( some in cotton country). Heavy but mostly beneficial rains CCB and ECB(small % will have TOO MUCH). Not dry anywhere.
http://www.wpc.ncep.noaa.govcdx /qpf/p168i.gif?1530796126
+++++++++++++
A trader needs to be in tune with the market's mentality AND the reality of potential threats. Imagined threats that turn into real threats without substantive, authentic understanding of weather or the realistic impact on crops because of changes days later are not indicators of skill. They are luck.
Beans are -10c here because of the "rain makes grain" mentality.
Why do we know this with certainty!
The map above ADDED rains, the 2 week models ADDED rains overnight and the long range GEFS last evening ADDED rains and it caused the market to GO LOWER.
Those changes take us closer to evolving into a too much rain hurts grain mentality but the pattern has not justified that the past week.
+++++++++==
It's interesting but the last long range European model just came out (shown below) and it's even HOTTER and Drier for July which has always been the legit threat to the crop. So if we gain some traction, it will be from that and NOT the threat of heavy rains. Actually, these heavy rains AHEAD of the potential dome of death are making it much LESS bullish.
If the 2 week forecasts were dry and not all wet, as they are currently, these maps below would be thru the roof bullish!!!


While the market was closed for 45 minutes, the maps I showed above came out from the EE model showing July to be even hotter and drier.
On the reopen at 8:30am, the C and S markets took off like a rocket because of that NEW information.
Like I've been saying, IF July ends up being like this forecast, prices right now are cheap. The problem has been that the 2 week forecasts keep extending the cool temps and rain and delaying the dome of death that this model insists will be the dominant feature in July.
It appears the NG and grain traders believe hot and dry.
Now the age old 'fight'---did the fundamentals or technicals predict the reversal?
Thanks, tjc,
As I showed last week, over the weekend, just now and all the time, it was the weather that changed FIRST, then the market reacted. This is the only reason that I even trade and its always just weather markets.
I told you about the hot/dry EE extended change BEFORE the 8:30 am open.
For people not in tune with the latest weather, THEY see the price changes/technicals FIRST because they don't have access to the latest weather model changes. Today was the quintessential example.
The price reaction/technicals are the early birds with the best weather putting on their positions. Others, that don't have access to the weather information the instant new models come out can often make money by FOLLOWING those early birds using the weather information but only if it doesn't change back.
I have shown here many hundreds of times the knee jerk reactions in natural gas that happen seconds after weather forecast data with cooler or hotter temps is released to the ones with access to the latest weather.
This is not even debatable. It's a rock solid fact which makes trading weather markets worthwhile.
++++++++++==
I will add too that if this heat ridge builds farther east(like some short range models try to do), the pattern could quickly turn into an excessive rain threat.
Regardless, a major heat ridge ANYWHERE, especially with the juice from an El Nino is a potentially bullish weather pattern in July.
The El Nino anolog for July weather in the Cornbelt is favorable weather. Usually coolish and on the wet side. However, each year is different and this year, the models are trying to develop a major heat ridge that is not typical of El Nino years so the outcome might be much different than the analogs.
Depends on the location of the heat ridge.
MetMike
As always, highly informative.
This Forum knows I am long (early, but getting healed).
IS your weather info sufficient for you to buy a setback?
"Most" of the time, a LOW is set, big reaction, time passes, test of low comes with relatively favorable risk reward to buy with a stop below the LOW.
Second question, is this grain setup, probably more so NG, a favorable situation to use calls?
Thanks, tjc!
I thought your risk/stop was below last weeks lows?
Did I misinterpret this?
Beans closed the week negatively, but off the low at 1113.5
Buy beans---you know where you are wrong.
Monday "created" a new low. I stated my analysis MUST take hold Monday. Thus Monday low 1102.5 (I would use 1099.5)
Second question, is this grain setup, probably more so NG, a favorable situation to use calls?
Thanks for the question again, tjc. I've answered that several times before here but not for awhile.
This looks like my last response a year ago for the natural gas market and I can gladly build on those thoughts.
By metmike - July 14, 2025, 12:38 p.m.
+++++++++++
Buying calls limits your losses to how much you paid for them for somebody that is willing to pay a ton of extra money to stay in the market as long as possible.
By definition, a "weather" trade if properly analyzed, uses the WEATHER's profound impact on the price of the commodity. If the market is NOT reacting in your favor, then you picked the wrong market and wrong weather.
When that happens, it's a signal to the weather trader to get out.
Buying calls or puts can buy you more time when the move goes against you but in weather markets when you are wrong it just causes you to deny that you are wrong because the call or put keeps you in when you should be getting out.
The weather changes ALL THE TIME. A person with futures could have a nice profit on a weather trade, see this and cover quickly. Even if they had a loss, they would cover when the reason to be in.....the weather changed.
With calls and puts, you have don't need to worry about being wrong so much. You have a defined risk and 80% of the time, those calls and puts expire worthless.
But here's the worst thing. If you are wrong about the price, you lose a limited amount of money. If the price stays the same.......you lose all you call/put value and money(with futures you break even). If the price just goes a little in your favor, you often lose money too because it's not enough to cover the cost of your call or put. In many futures markets, you have to win big for it to pay off and even then, the win will not be as big as if you traded futures.
The sellers of options always over price them because they are the ones taking on the risk. They win 80% of the time because of that. The buyers pay out the wazoo because they don't want the risk.
As a weather trader, I embrace the risk because it's all about me being right or wrong and being able to use that without giving a ton up because I'm not able to manage risk or too afraid that I might be wrong.
If I'm too afraid of being wrong on weather trades, then it means that I should do weather trades.
The other thing is the timing for me. I can be in and out of a weather trades using futures within hours and get wonderful fills electronically in a flash. The weather models change fast enough in natural gas for that to make sense.
Options are not so liquid, especially overnight(which is often the best time to trade because models come out 24 hours a day). So even if 80% of options did not expire worth. And even if they weren't greatly overpriced and all the other things mentioned above, I want the opportunity to get out in liquid markets that feature large sized bids/offers within a few ticks of each other at all times.
If I got long a ng call today and it closed break even, then the European model showed a big change after midnight, instead of bailing quickly and easily like I can in the futures to eliminate my exposure to the downside WEATHER reaction to the updated weather forecast, I would be sort of stuck with my call and HOPING the weather would change back.
Options are especially good for using hope to replace sound analysis in a weather market and replacing confidence from that with the hope.
Those are my thoughts as a weather trader which is the only reason I started trading for a living in 1992.
It took a couple of years to replace my income(and much more) as a tv meteorologist so the first 2 years, though extremely successful were more of a hobby until I massively grew the account from 2K to 6 figures in 4 years.
I had all my money stolen on October 31, 2011 at MFG, then again in July 2012(which included the borrowed money to open the new account and the MFG money that came back).
Since then, the account has never hit 6 figures because other traders get weather information faster than me. In the 1990's, I had a satellite dish on the roof getting the NWS stuff the instant they did.
Now, some trading firms have their own in house models that run just US data which yields solutions slightly faster than the main weather models come out.
+++++++++++++++=
So this is just me and how I trade. There are many other ways to trade and very few markets are weather markets.
tjc likes to use options and certainly is an authority on when and how to use them with markets that are sending strong signals of a top or bottom. In this case a bottom after a big move down and his well defined parameters. He accurately picked the May top based on his analysis and used futures to make money.
My favorite trades are also those at a top or bottom but always in weather markets when the weather pattern suddenly flips to the opposite EARLY IN THE PATTERN CHANGE before the market has had a chance to respond.
For every day or even hour after the price reversal, is that much more you have to risk. So timing is everything and that includes not being too EARLY, as described previously.
Yes, calls allow you to be early and withstand a day or 2 of drawdowns but for me, if the market doesn't react in a day or 2, then I'm the one that's WRONG and not just EARLY.
tjc,
You did a great job picking the bottom this week(so far).
TY MetMike
Grains appear to have created a daily/weekly low on Monday. The old adage says to buy near the low 3 days later. I will attempt to add to positions tonight (Thursday session) with strategic open orders.
Although my analysis used the LEAD contract JULY, I will use Nov beans and Dec C/W so as NOT to get in a delivery situation. (Although, one of my best ever trades was a squeeze in March oats!)
Please, just my two cents.
In a weather market during the growing season, it's best to use the new crop which is being impacted by the weather but the front months will usually work well too and on occasion, outperform the new crop as big moves in most commodities are led by the front months.
Just my thoughts too. In weather markets, the weather forecasts change a lot. If the new pattern change lasts for many weeks, pull backs, like you project can be a good opportunity to add or put on a new position. This can happen when the new pattern looks shaky.
However, when the new weather PATTERN changes back to the old weather pattern, the pull back is not a correction at all. It's A RESUMPTION of the previous trend from that previous pattern.
To identify this specifically with this current trade.
1. If July turns out as hot/dry as the European Ensemble model or there's a zone of excessive rains that repeat over and over in key production areas that develops. Prices can keep going higher.
2. However, if the current pattern keeps lingering and the EE model because its so far out is missing the forecast, then we WILL make new lows in July.
3. Prices NEVER go up in July without extreme, widespread and long lasting adversity. Even in years with modest adversity and slightly lower yields forecast often feature steady to lower prices. Protect your position or take profits if possible (probably not unless you do it quickly) if the adversity in July goes away in the forecast.
4. The market will not advertise when price premium comes out. We may come in 1 day, like yesterday and the funds, instead of buying, will in selling the heck out of C and S after 1 bearish EE model for July and suddenly we are at new lows in a flash.
I'll just show this seasonal chart again to enforce my point about being long C and S in July. The magnitude of the huge drop after making the highs in May was from record fund longs covering their position at the same time.
There isn't the same speculative fuel left for it to happen again with more bearish weather but the large funds are likely to build a big short position in Corn with good July weather and cover the rest of their longs in S.
Soybeans HAVE HELD THE UPTREND, CORN HAS NOT but as you can see below, this is actually typical with the seasonal. Corn peaks first by around 2 weeks on average. (reality is that in individual years, they move in tandem). We had our seasonal top early this year. This does NOT mean we will bottom early. Only the weather turning bullish will cause that.
There have been half a dozen July's that did turn very hot and dry since I've been trading for 3+ decades which caused an early Summer bottom. This could be one of them. Each year is different and no 2 weather patterns were exactly alike. Similarities yes.
1993 was the only one that was extremely bullish from too much rain.
The Summer of 2026 will be juiced from a rapidly developing El Nino. It won't be at Super El Nino strength until this Fall/Winter.
Interestingly, the hype of that El Nino and what it will do to crops, especially in India can often make large specs more willing to buy in anticipation of that. India is a huge producer of oilseeds that compete with soybean oil on the global market. The soybean oil market has been leading the beans which has been a bit unusual.
Corn often peaks first after being planted in timely fashion in NON drought years.
https://charts.equityclock.com/corn-futures-c-seasonal-chart
Beans key developmental stage, flowering/pod fill is the latest, late July/August and typically peaks last.
https://charts.equityclock.com/soybeans-futures-s-seasonal-chart
Weaker again overnight.
Really, the only thing holding us up here is the BULLISH, longer range European model for a hot and dry July.
No trading on Friday so this is a long weekend with an extra day being closed with higher than usual risk in BOTH directions.
1. If we get 3 days closer to the impressive heat ridge on the extended EE model and the GEFS shifts in that direction and the end of week 2 forecasts show the same thing, we can gap higher. The EE extended update will be out in a couple of hours but it's Thursday and can only impact trade today. It's ancient weather forecast history in 3 days as far as the market will be concerned.
2. If, instead the forecasts keep adding more wetter and cooler days in week 2, we can gap lower and this week will end up just being a bear flag with a downside break out early next week on our way to new lows, considering this time of year, the market NEVER goes up for long without THE THREAT of long lasting, widespread weather adversity that threatens to lower crop yields significantly.
Scenario #2 is slightly more likely right now based on past analogs. However, there is a scenario #3 which would be similar to the current forecast. Bearish for another 10+ day........THEN turning hot and dry for July.
OK, I take back #2 being more likely after looking at the latest late week 2 forecasts and seeing the amount of impressive ridge building at the end of the period.
+++++++++++
Late morning: The EE model continues to look extremely impressive with the heat ridge building in July, now going into the start of August with that 500 mb heat ridge forecast.
Grains are ignoring it ahead of a long weekend that features a ton of rain the next 2 weeks BEFORE the heat ridge and with higher confidence than the heat ridge that has been in the forecast for many weeks.
If this actually happens, the rains will eventually dry up and it WILL be bullish grains. This forecast can change a great deal in 3 days.
European Ensemble 500 mb map day 46. Week 6 temps(7 days) + Rain anomaly days 16-46(weeks 3-4-5-6)


In 1983 I as I remember I could not get planted until 1swt week of June then about the solstice. it quit raining. Then drought. I think it was the year of PIC.
Was 1983 an El Nino year?
What was the PDO that summer?
What was the Indian Dipole that year?
Chart of 1983
Corn (Globex) Historical Prices Charts - xHistorical Commodity Futures Charts' : CBOT
You are exactly right, cutworm.
I remember that year crystal clearly because it was my first year as a tv meteorologist (for WEHT-TV, Evansville, IN) forecasting weather for this agricultural community.
It was exactly as you said and no other year that extreme(although we've had pattern changes from wet/cool to hotter and drier in previous July's).
Like somebody flipped a switch and over night we went for wettish and cool to very hot and mostly dry at the end of June. During July/August almost every high here was 90+ with numerous days of 100+.
With regards to the ENSO stage, it was the diametrically, polar opposite of this one.
We are currently racing towards a Super El Nino (crossing the El Nino threshold recently) from a weak La Nino last year.
In the Winter of 1982/83 we had a SUPER El Nino and during the Summer of 1983 we were crashing lower into a La Nina later that year. When the hot/dry weather hit, the El Nino was already dead, unlike right now where it's just getting started.
I remember going back and finding/showing some Summer 1983 weather maps here but it might have been on the old forum. I'll try to do that again ASAP!
Oceanic Niño Index Graphs and Charts
Maps from the Climate Prediction Center
Been focusing on other things the last few days, including different threads here.
On the crop ratings, they were unchanged. Seasonally, crop ratings tend to slowly drop as the growing season progresses so NOT dropping is slightly bearish.
U.S. corn and soybean conditions were steady on the week after last week's cool, wet weather, but spring wheat ratings eased slightly. Winter wheat harvest progress has reached 40%, the date's fastest pace since 2012.
The weather for the grains is potentially bullish in week 2.
This much rain in week 1 is the main bearish element but we have some MAJOR HEAT on the way:
7 Day Total precipitation below:
http://www.wpc.ncep.noaa.govcdx /qpf/p168i.gif?1530796126
Week 1(see previous page which is constantly updated) is bearish from too much rain in too many places but week 2 is looking increasingly BULLISH with HOT and mostly dry weather in most places.
Week 2 only forecast from this last 0z European Ensemble model. It's very hard for the grains to go up in July but a forecast like this below is the type that can do it. Last map is the upper level ridge at the end of the period.
The heat ridge starts week 2 much farther east, then it quickly retrogrades to the Plains.


The weather turns bullish for grains. After big rains the next week in many places.
7 Day Total precipitation below:
http://www.wpc.ncep.noaa.govcdx /qpf/p168i.gif?1530796126
1. 500 mb Day 8 below
2. Day 14 below
3. Week 2 rain anomalies.


U.S. soybean conditions were unchanged on the week at 66% good/excellent. But ratings eased in the top 5 states, which planted 47% of this year's area. Several #CropWatch26 producers this week reported that cool and in some cases overly wet weather has hampered bean growth.
U.S. corn conditions were unchanged this week at 68% good/excellent despite declines in Iowa and Illinois. Aside from Nebraska, most top states remain above their five-year average. #CropWatch26 producers report that corn has fared the cool, wet weather better than soybeans.
This was this mornings BULLISH 6-24-26 updated 30 day forecast for the entire month of July from the European Ensemble model with the position of the DOME on the last day of the month.
Huge problems for the bulls are the amount of rain in the week 1 forecast and a reminder to everybody that to make C and S go up in July, you often need more than just slightly adverse weather. This is in fact extreme enough to make C and S go higher. If this verifies, then prices will likely be higher in a month than where they are right now.
Also, there's a big USDA crop report next Tuesday.
Also, crude prices have been crashing lower.
Also, the DX has been going up, which makes our grain exports more expensive.
Also, big funds just covered a record long position. After doing that, they are more likely to want to be short instead of reversing again and getting long.
Also, it's very tough for the atmosphere to cause a July like that one predicted below when soil moisture is abundant for such a large area. Each year is different. It can still happen but it's just tougher.
This is also the complete opposite of the El Nino analog.


Regardless off all that, readers here that know grains and weather don't need me to tell them that this forecast above is BULLISH for July.
In July, however, the saying of a bird in hand is worth 2 in the bush applies to the weather.
In other words, the benefits of a ton of widespread rain in week 1 is often worth more than a dome with hot and dry after that.
I am absolutely looking for a place to buy here with a July forecast looking like the above.
Get all the comprehensive weather here:
Eric was in with our weather this morning:
June 24, 2026: 22 Zettajoules… | Late June Ridge Placement Delivers Excessive Heat | Cold Northwest
Eric talks about how hot temps during silking affect yield. Skip to 20:00. Very interesting.
Edit;
High Night Temperature Effects on Corn Yield | Pioneer® Seeds
Thanks, cutworm!
Speaking of corn, here's the technical picture. In most seasons growing seasons, even thought the C and S will move in tandem from the impact of weather, C will top first and beans after that( with August being the most important weather month for S.
That is happening this year, so far. Corn has been weaker than the beans! However, the week 2 weather turns very bullish!
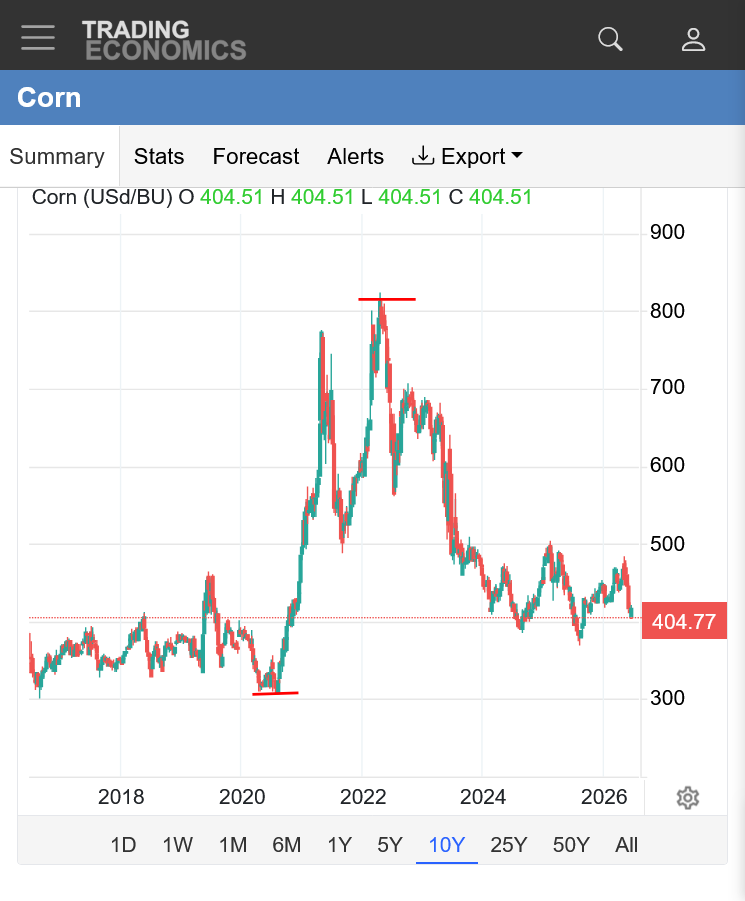
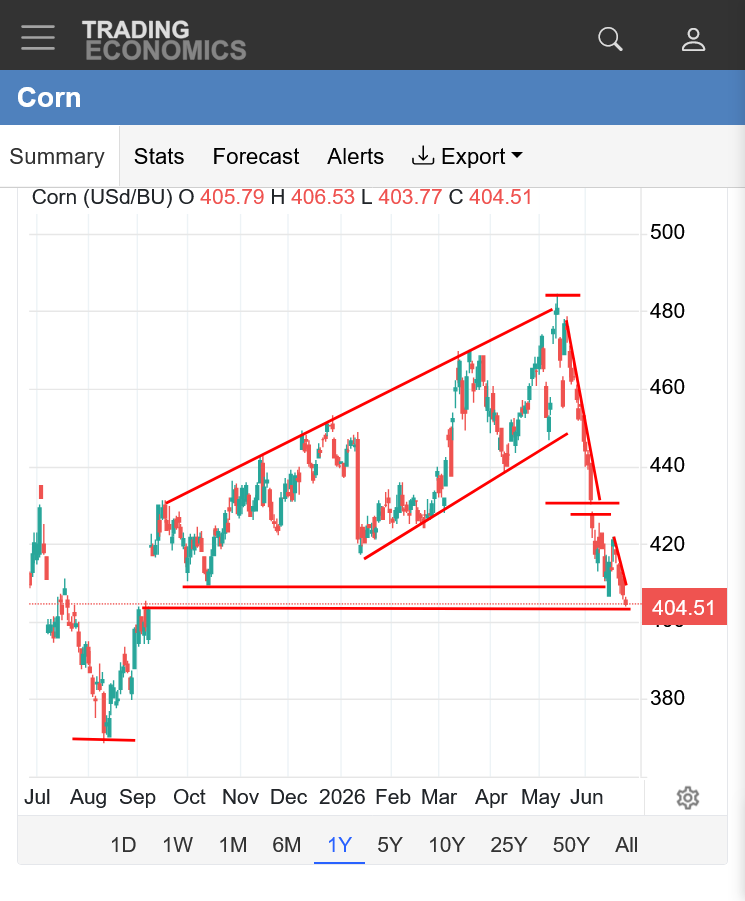
https://tradingeconomics.com/commodity/corn
1. 10 years: MAJOR LOW in 2020. MAJOR HIGH in 2022.
2. 1 year; MAJOR LOW August 2025. Upside break away gap higher September 2025, followed by STRONG uptrend(fueled by record fund buying) to our MAJOR SEASONAL HIGH in May 2026, followed by a collapse lower after the crop was planted in timely fashion and huge rains showing up in the forecast for the dry areas of the Midwest. tjc called this top exactly! Fueled by record fund, long liquidation. Downside breakaway gap in early June. Right now, filling the gap higher from last September this week. Easily the lowest price in 2026(beans are still above their 2026 low).
3. 1 month: Steep downtrend, followed by a bear flag (continuation pattern) and currently breaking out to new lows for the move.
4. 1 week: Steep downtrend from more robust rains, bear flag, then a downside breakout to an even steeper down trend.
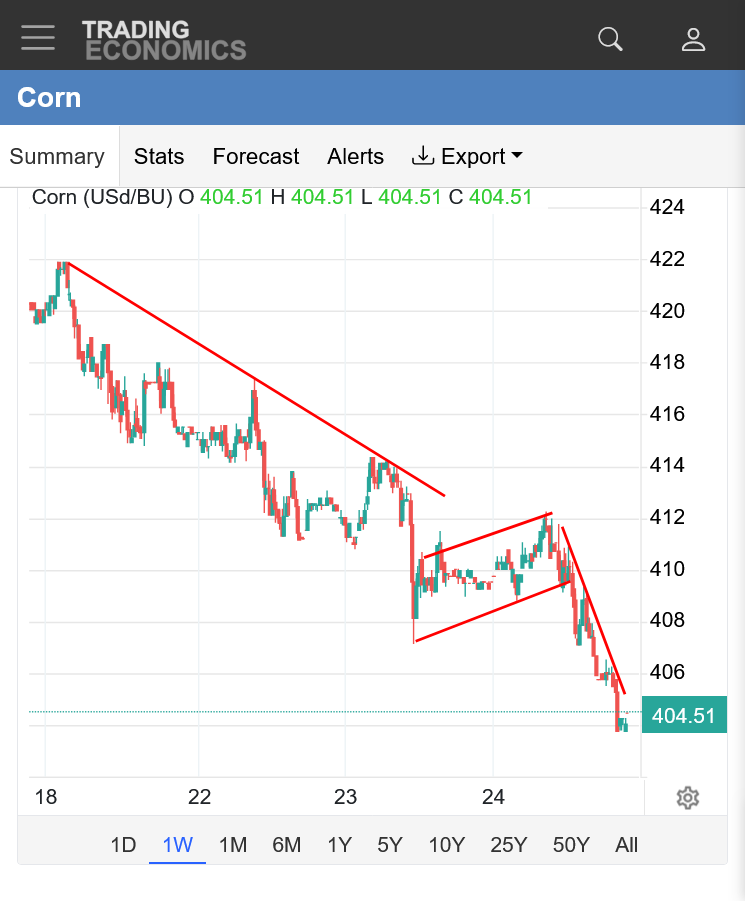
6-25-26: Corn did a major reversal up overnight and is likely to close near the highs today because of the bullish July weather approaching!
Beans have been not as weak as the corn. Funds have liquidated most of their longs, where as with corn, they did that and may be getting a bit short.
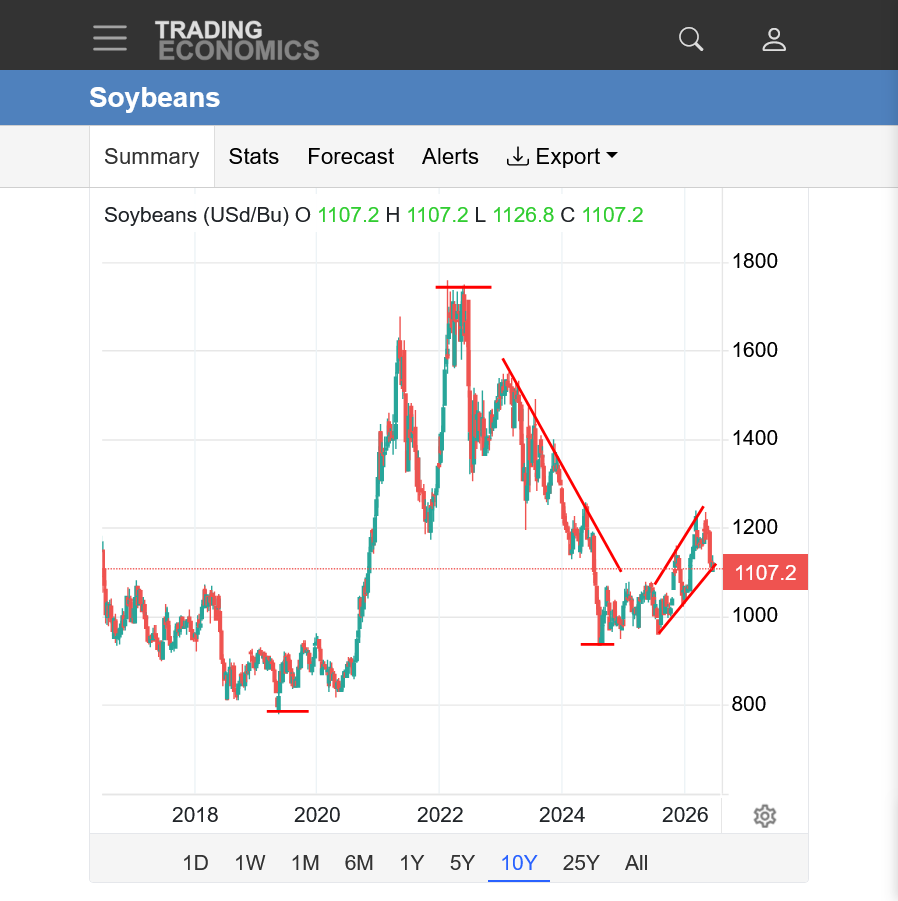
https://tradingeconomics.com/commodity/soybeans
1. 10 Years: MAJOR low in 2019 BEFORE the low in corn. MAJOR high in 2020. Steep downtrend 2022, 23, 24. Major low late August 2024 on HOT/DRY finish to growing season that hurt supply/yields. Low in July 2025 on bullish weather. Steep uptrend until recent high in May 2026 on great planting, then big rains in the forecast for dry places. Drop since then down to uptrend line today.
2. 1 year: MAJOR low at the end of July 2025. Steep uptrend until the March/May 2026 double top. Steep downtrend. Bear flag but breaking out to the downside right now testing or breaking out below the 10+ month long uptrend line.
3. 1 month: 2nd top in May. Steep downtrend, then bear flag. About to break out below the 10 month long trend up but still well above the 2026 lows and also just above the low on June 15th. Can bullish July weather hold this level?
4. 1 week: Downtrend, then bear flag, then steeper down trend. On the lows for the week.
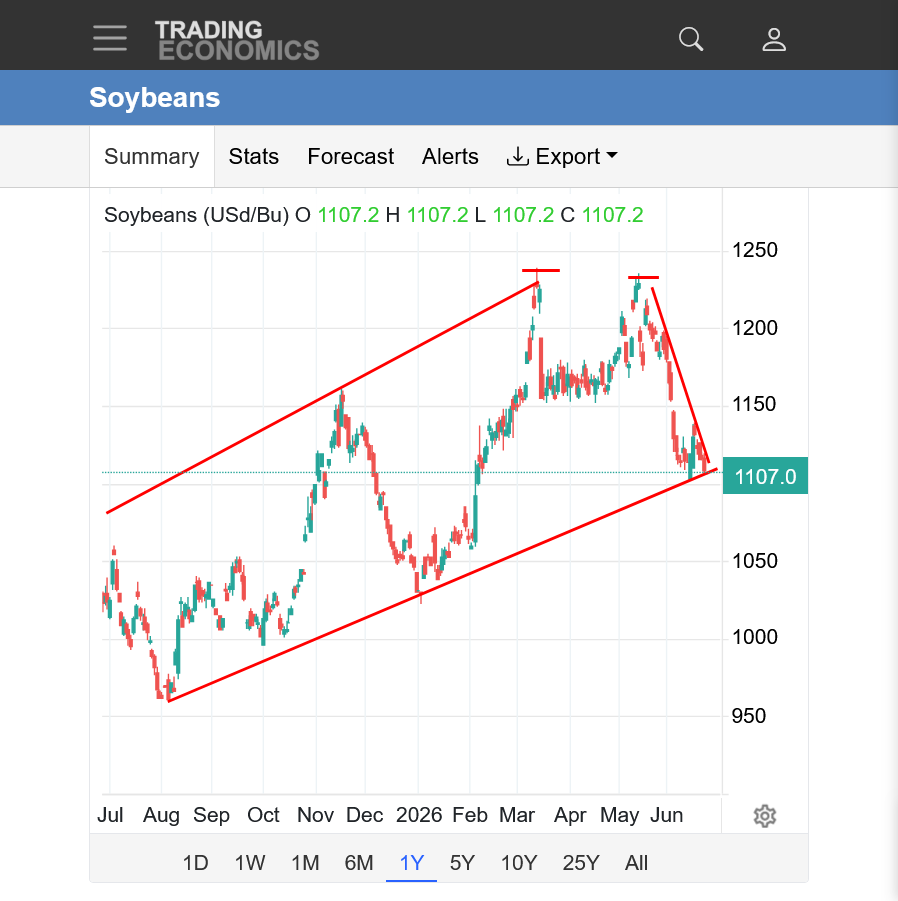
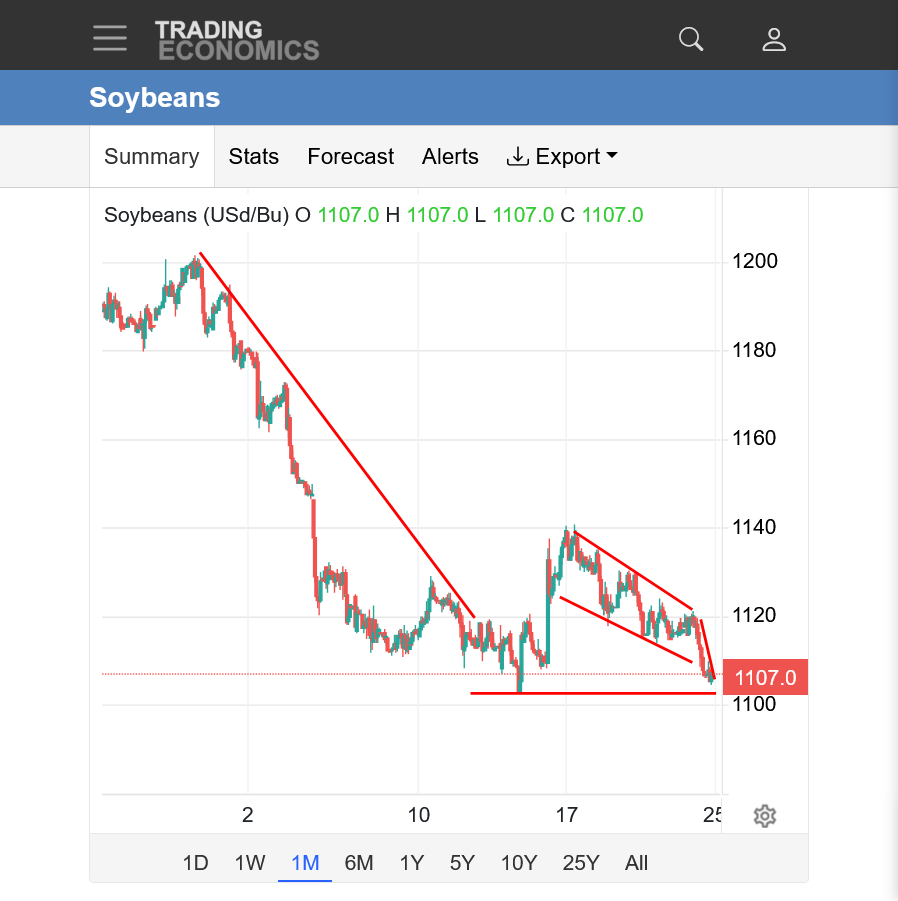
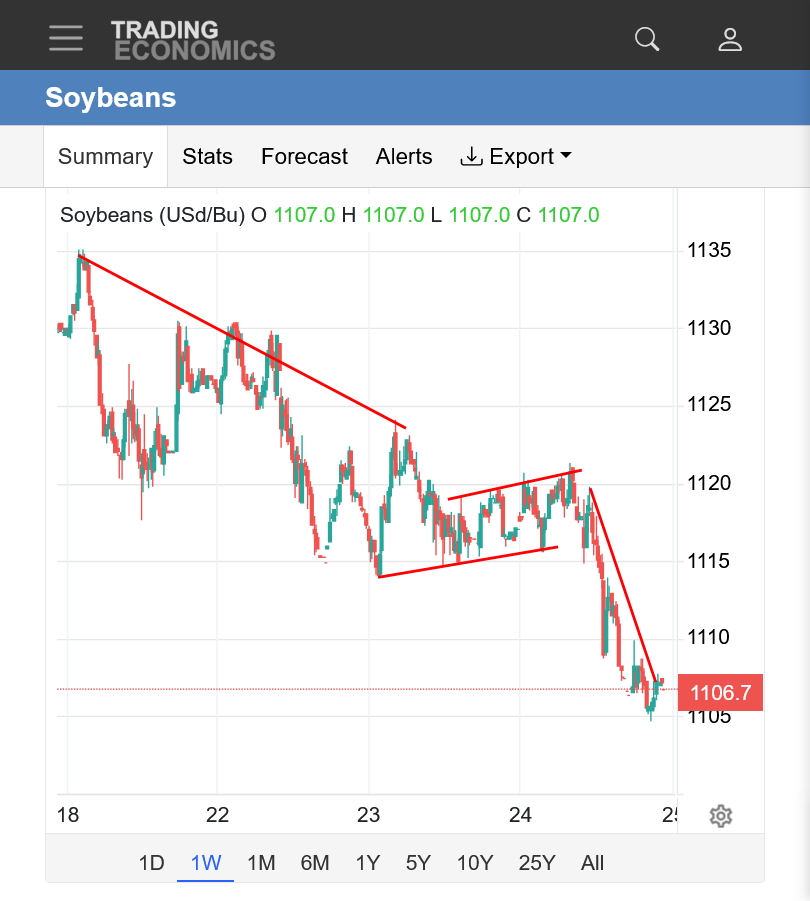
6-25-26: Beans tested and HELD their uptrend line overnight!!!! Tested and held their June lows!
The very bullish July weather forecast we've been showing is the reason why. It just took a couple of days to overcome all the negatives AND we took out all the week 1 rain for IA overnight too!
By metmike - June 24, 2026, 7:36 a.m.
The weather turns bullish for grains. After big rains the next week in many places.
7 Day Total precipitation below:
http://www.wpc.ncep.noaa.govcdx /qpf/p168i.gif?1530796126
The biggest difference between Wednesday's post above and today is the updated 7 day rain forecast shown above no longer has significant rain in it except for areas within 150 miles of either side of the Ohio River. So the bullish, week 2 part of the forecast can take over price determination without the competition of the week 2 rains.
There is a potential for a gap higher open on Sunday Night, building on yesterday's POWERFUL reversal up.
However, next week's dome of death is going to retrograde much farther west. If it gets too far west, then this would allow for northwest flow into the Midwest by mid-July which could turn us bearish again.
Regardless, I'm STILL barely bullish as indicated 2 days ago with the buying set up and only if the dome stays longer, in 2 days, if the models only have the dome over the Midwest for 10 days, then shift to northwest flow........I'll flip back to bearish.
We got 3.1 inches of rain. Most of it welcome although that's a bit too much for just 19 hours
Great site for getting rainfall data. Just put in your zip code!
https://www.raindrop.farm/rainfall-totals/zipcode
++++++++++++++++
After looking at the latest guidance coming out this morning(that gets us back to northwest flow as week 2 advances and the dome shifts farther west and the fact that we had a lower close, which leaves yesterday's reversal up/bottom unconfirmed, I'll still lean bullish but not with the previous gusto.
This mornings EE July forecast is still hot/dry as was last night's July forecast from the GEFS, so there's NO WAY that I can be bearish.
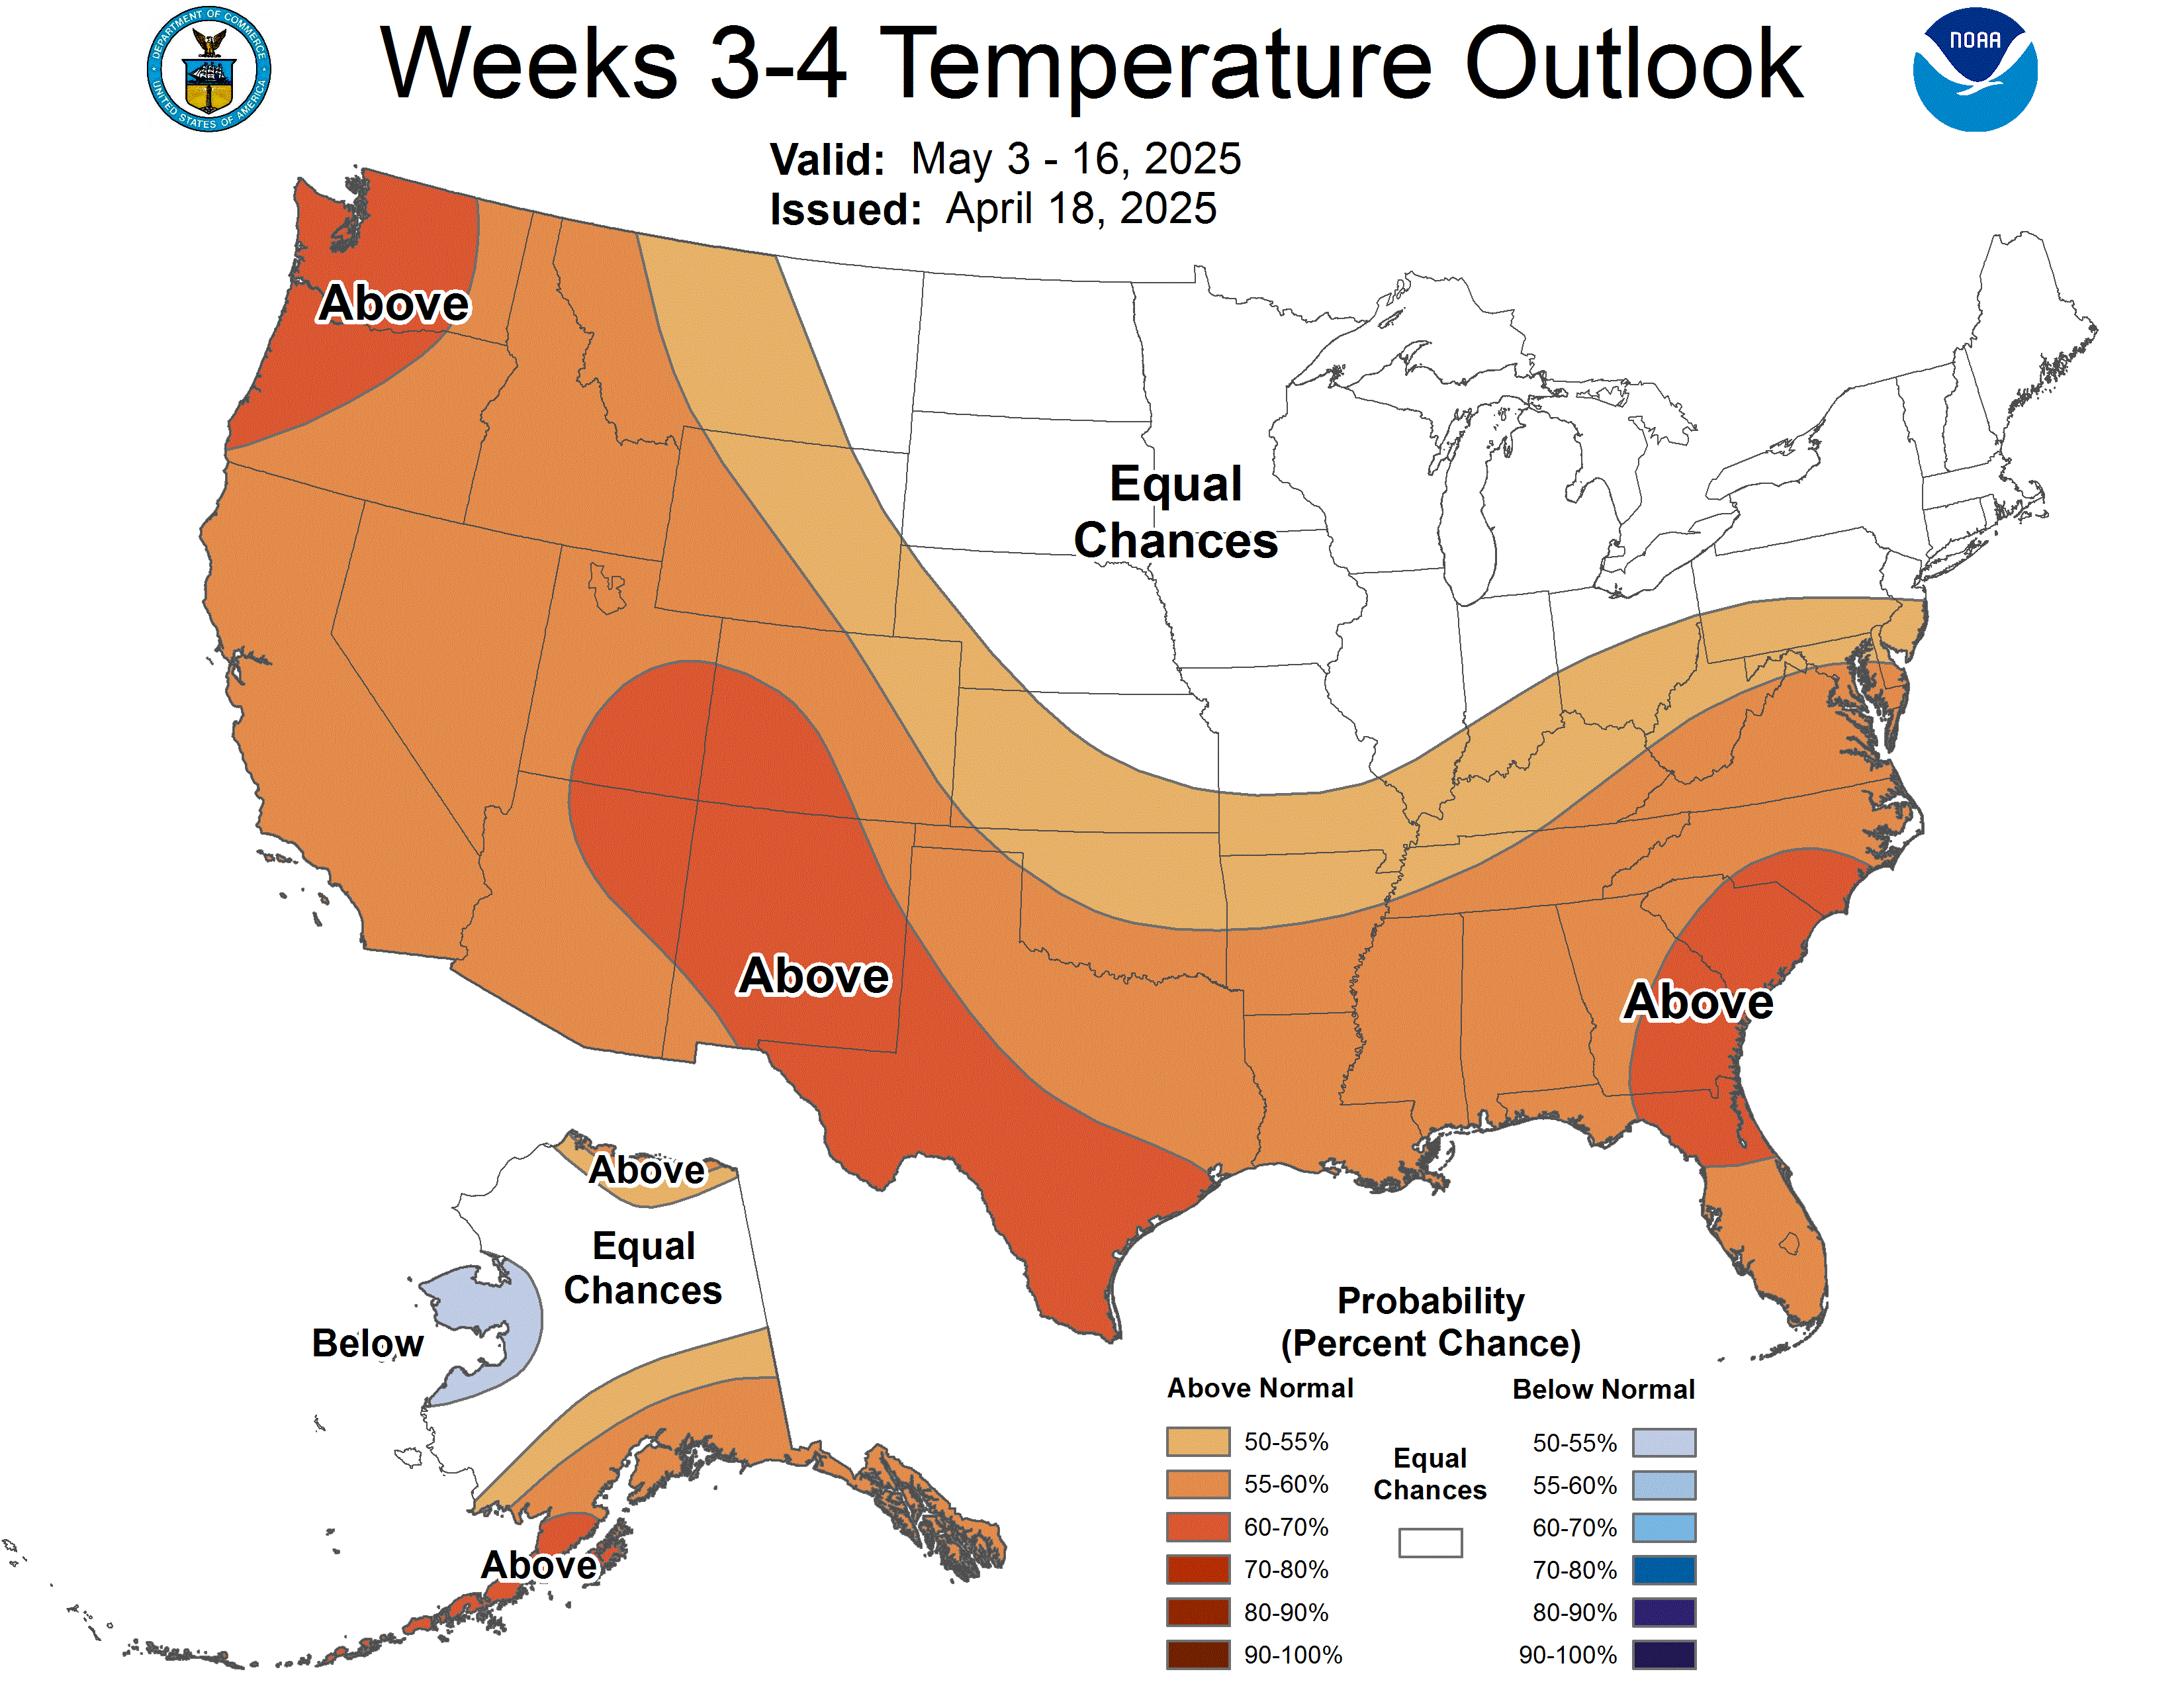
This was the just updated weeks 3-4 forecast from the NWS for mid/late July.
This is NOT bullish without heat in the Midwest(just the opposite). It suggests a heat ridge in the West and northwest flow into the Cornbelt.
Only the European Ensemble model stands out with its HOT AND DRY forecast for July.
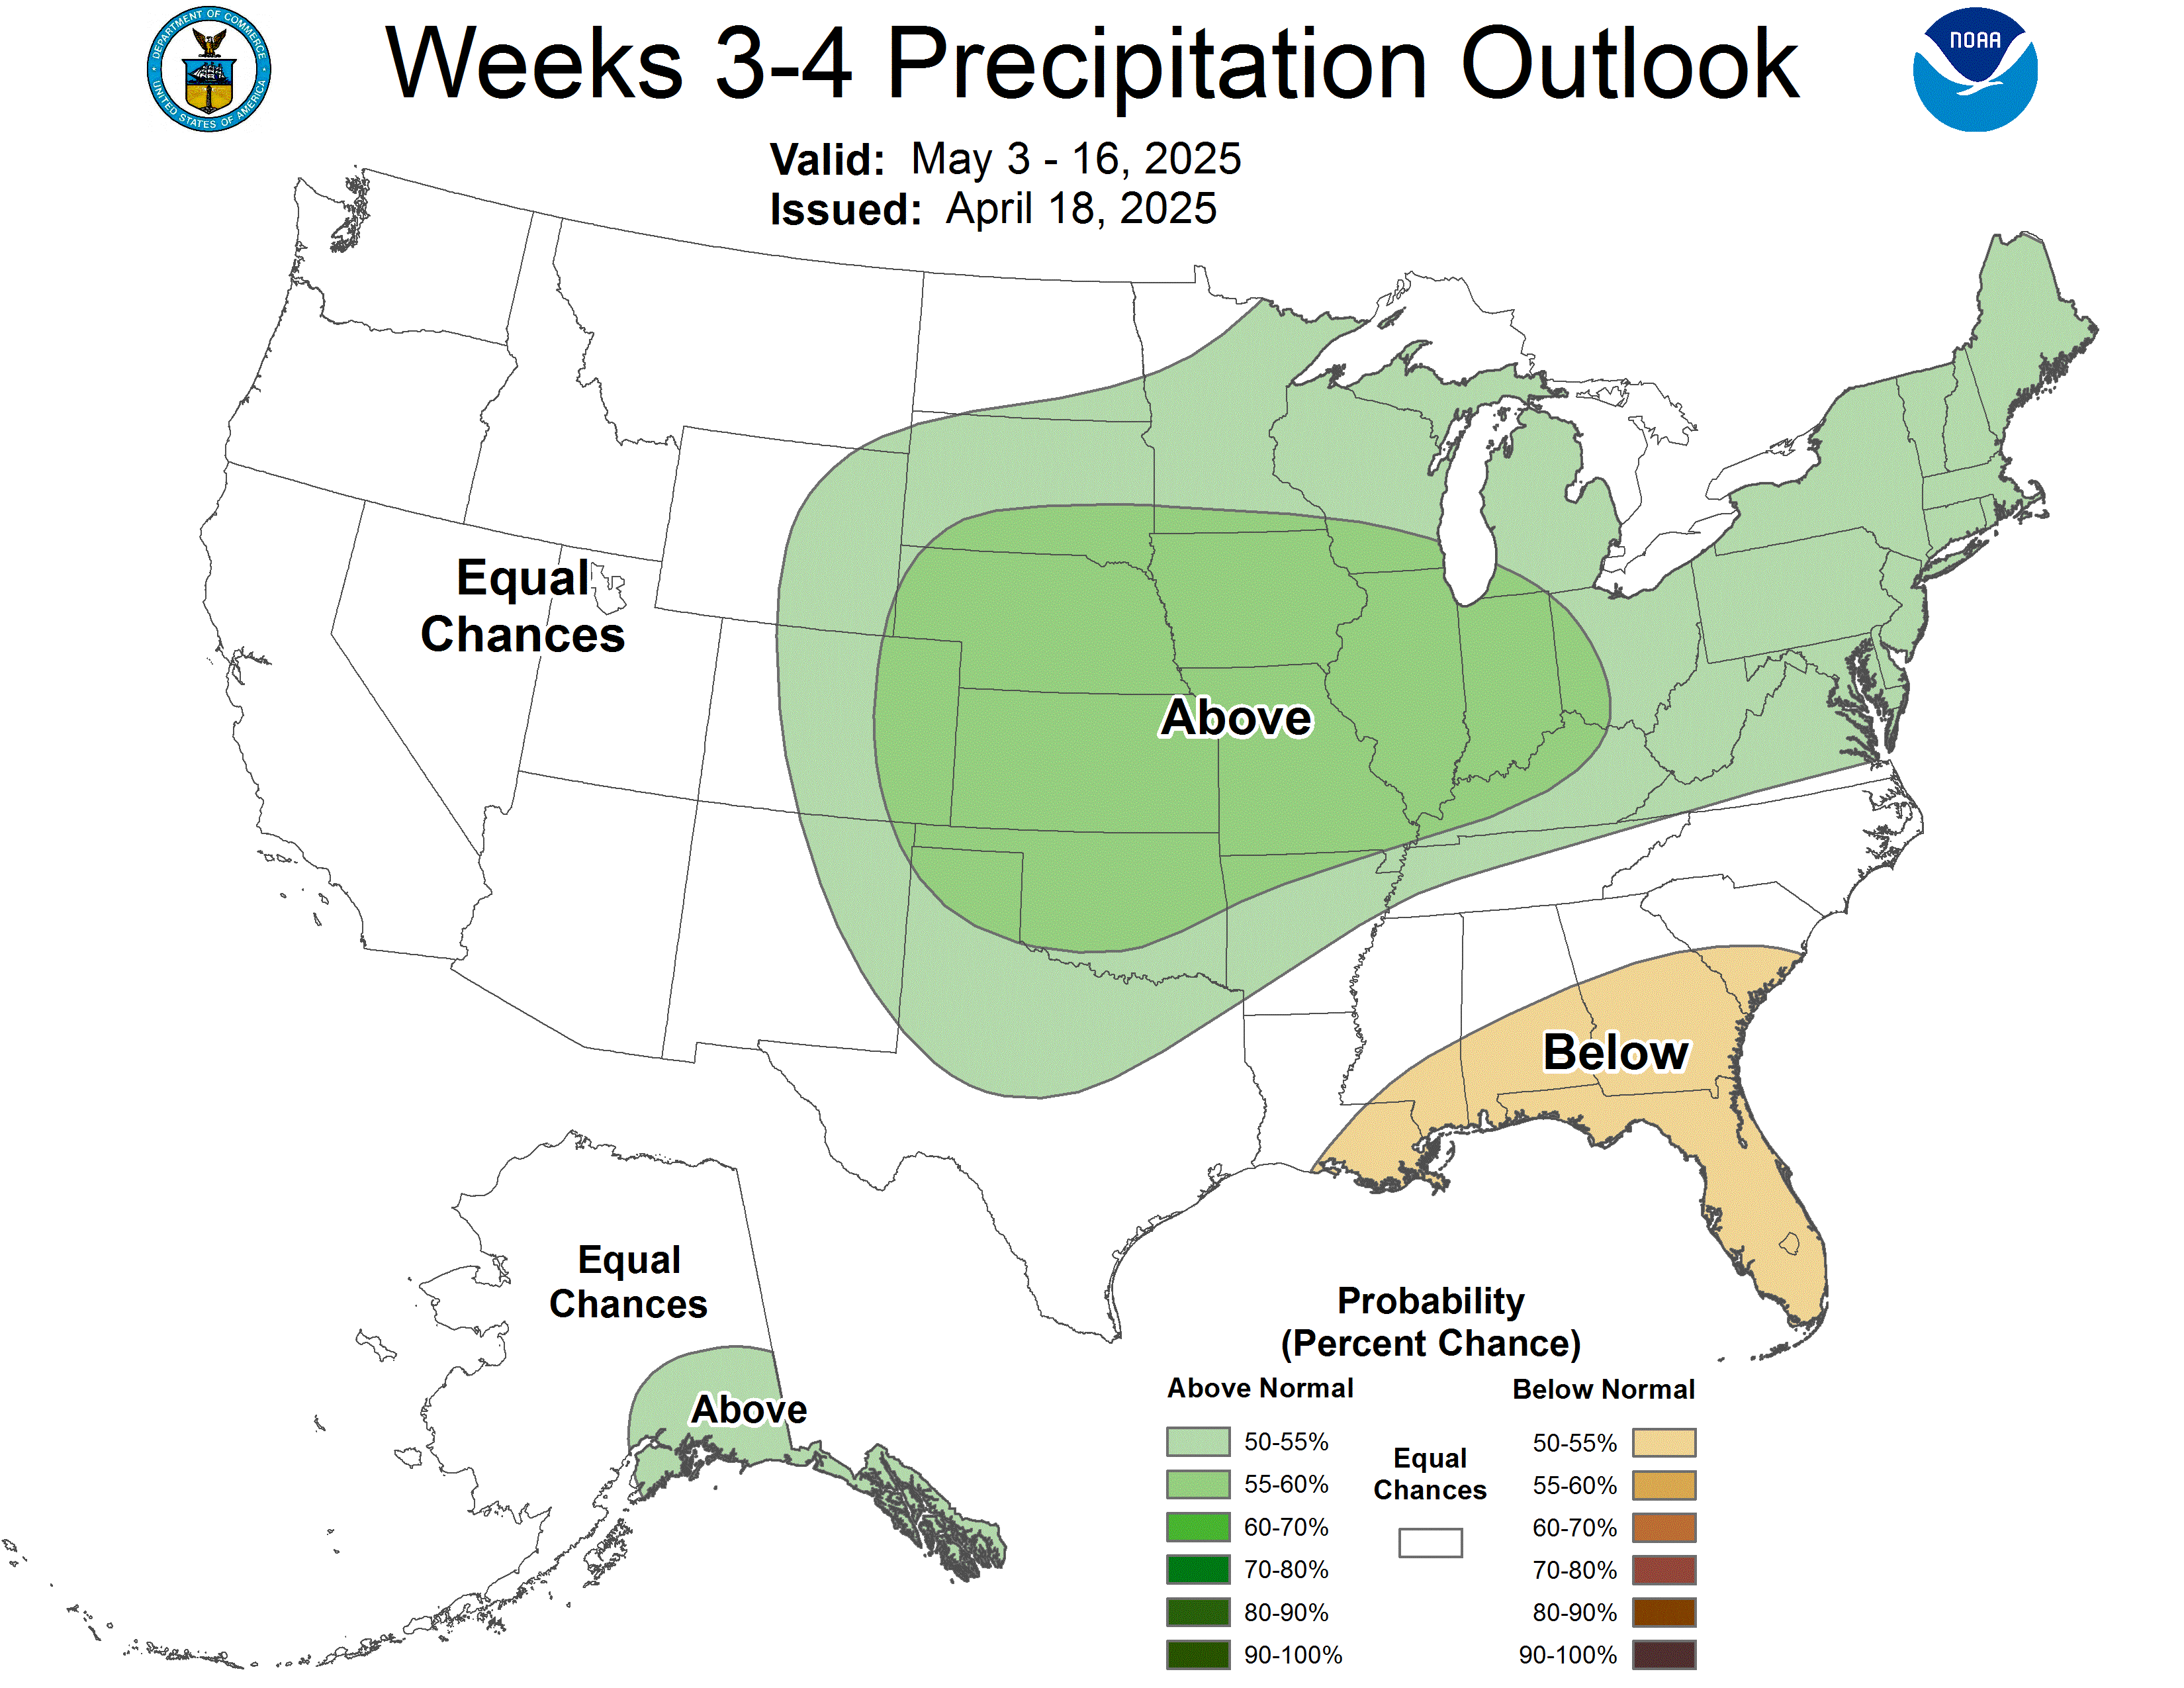
This was the last NWS week 2 forecast that caused me to get bullish the grains earlier this week(after the robust rains in week 1 played out. This is a snap shot to show Fridays forecast that will be updated every day.
Use the link below for the latest forecast:
https://www.marketforum.com/forum/topic/83844/#83852
This weather MUST continue for more than a week to really get bullish. The European Ensemble model is the one that is hot and dry for July.
My biggest % losses ever were:
1. 1994 margined out long C and S on a Friday and holding. The NWS 6-10 day came out after the close with MA temps and NP(no precip). I was already celebrating over how much money we would make the next week. The celebration ended early Saturday morning when the pattern started changing fast over the weekend. I barely got out on Monday Morning's open before we locked limit down(saving over half of my capital) for the entire day and opened another half limit lower on Tuesday.
2. In the early 2000's long 300 CZ and 200 SX before the 3 day July 4th weekend but early. We opened lower on Monday Night and kept going lower even though I was confident of the pattern change to hot/dry. I stayed up all night, watching it gradually push me to -$250,000 under water which was around half the equity and I was worn out and couldn't take it anymore. So I put my first sell stop in just under the lows for the day session open. The market hit my stops, which ended up being the lows for the entire Summer and reversed higher, then going straight up for the rest of the month.
Not putting that stop in and holding on for 2+ weeks and I would have made a million bucks. I couldn't get myself to get back in after the price was so much higher, starting the next day. Having no position after the holiday, I would have been buying, exactly when I was selling to cover.
Timing is everything when you margin out/over extend, which is how I traded. A smarter Mike would have had half the position, then ADDED at the cheaper price instead of crying uncle from emotions.........fear of losing all my money overcoming confidence in my weather forecast.
++++++++++++
An important aspect is that we should always evaluate trades based on THE LAST THING WE DID.
1. In the first trade, the last thing I did was sell. But it was the high for that week and I never celebrated a loss with such gusto. It cut my losses from potentially wiping me out to still having money to trade. I started shorting the market on Wednesday of that week and ended up making back more than the losses by the end of that Summer.
2. With the 2nd trade, I also sold. But it locked in the worst loss ever. It completely devastated my trading mindset for the rest of that Summer as I spent every hour of every day calculating how much money I WOULD HAVE made if I didn't get stopped out on the exact lows for the Summer. Seriously, the lowest ticks for CZ and SX were my trades. That was the only loss in my first 20 years, where I couldn't get over it quickly and start with a fresh mind right away.
++++++++++++
The potential big money maker in July 2026 would be if it turns hot/dry for the entire month. Even though that's against the powerful down seasonal, the most money is made from WEATHER PATTERN CHANGES in WEATHER MARKETS!
It's been cool and wet, after great planting. The market has been trading that bearish, price pressuring weather since May's top. That's why we were at the lows this week.
The only way to hurt this crop is with high heat and below average rain. If that happens in July, no way that prices in a month will not be MUCH higher.
By an amount that is GREATER than what the potential drop is with more bearish weather. As somebody that trades weather pattern changes, this is why the current set up favors being long.......if the hot/dry forecasts are right.
Over 5.6 inches of rain now since Thursday evening!!!!
I intentionally didn't empty my rain gauges because I wanted to track the total, not each event but had to empty them because the last mark near the top is 5.5 inches!!!
This area will appreciate the dry weather for the next week. With the soils now water logged, it will be near impossible for actual temperatures to hit 100. A bit more humidity/higher dew points but not as extreme heat.
+++++++++++++++
For much more on how soil moisture has a profound impact on weather systems, especially on temperatures in the Summer:
Re: : 6-25-26 MAJOR heat wave coming next week
By metmike - June 27, 2026, 9:58 a.m.
+++++++
Re: Re: : 6-25-26 MAJOR heat wave coming next week
By metmike - June 27, 2026, 10:19 a.m.
++++++++++++++++
6-27-26, 3:30pm: We're up to 6.2 inches in the last 48 hours.
++++++++++
6-28-26: 6am: We're up to 7.9 inches since Thursday evening! 2 months worth of rain in less than 3 days!!!!
6-28-26: 3pm: We ended with just over 8 inches in less than 72 hours! Some places north and east of here got around 12 inches.
Freeze frame below:
For all the latest updated drought metrics, go here:
The weather changes since the market closed on Friday have been mostly bearish.
1. Adding rains to week 1 in the Upper Midwest
7 Day Total precipitation below:
http://www.wpc.ncep.noaa.govcdx /qpf/p168i.gif?1530796126
2. Week 2 on most models has the Midwest in northwest flow and the heat ridge too far to the west/southwest to be really bullish. Still the potential for July to feature hot/dry weather, especially in the WCB.

https://www.marketforum.com/forum/topic/83844/#83852
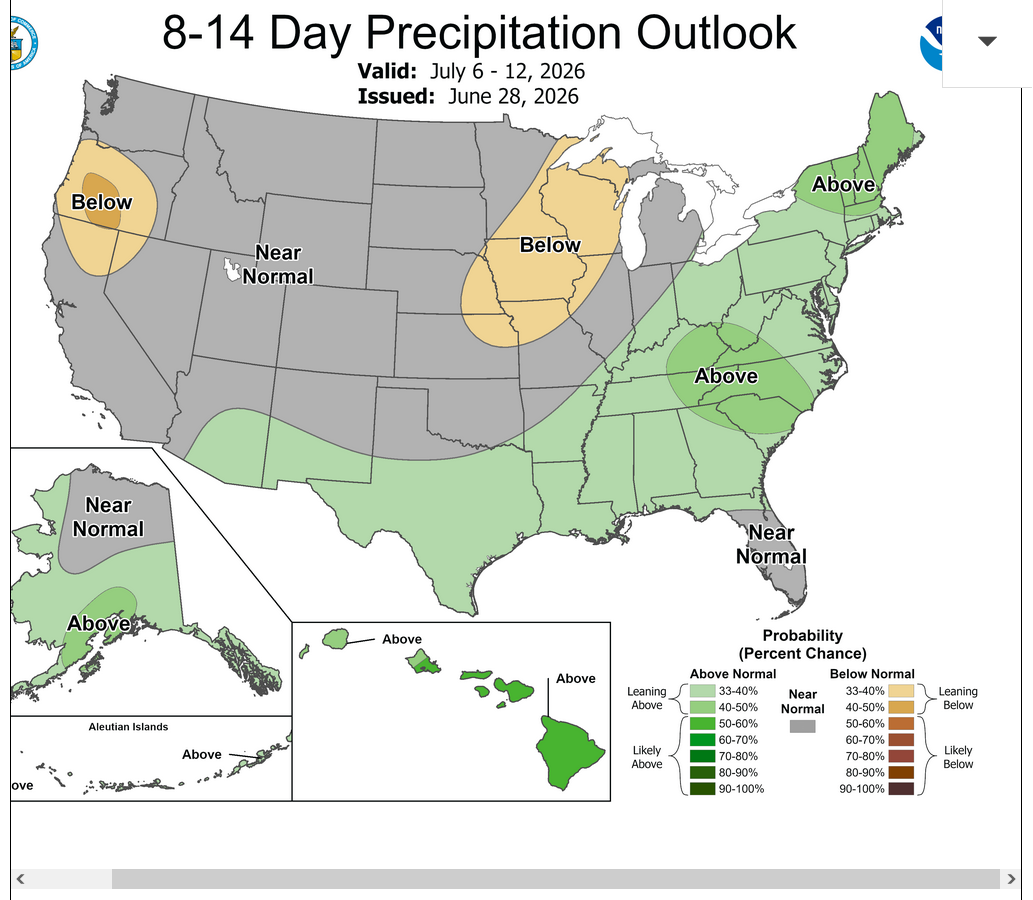
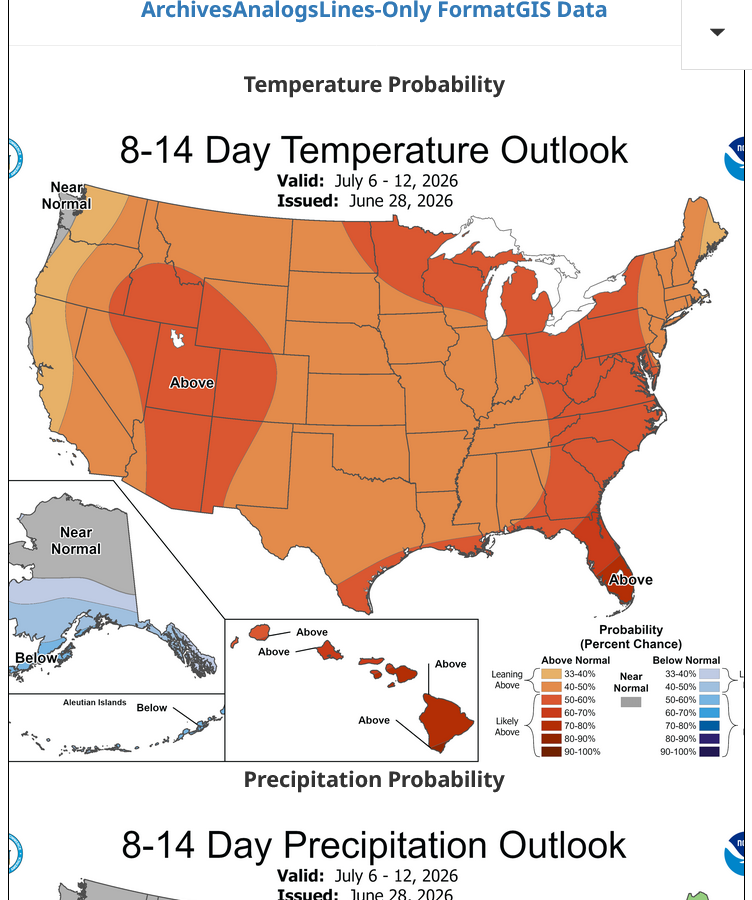
3. The extended European Ensemble model keeps insisting that July will be hot/dry but the American model is less bullish and the EE model appears to have a hot/dry bias because a month ago, it was forecasting the hot/dry pattern change to have started in mid-June. This has been the EE forecast for the past month but it has been continuously pushed forward. This is a good long range forecast model but even the best model at this range loses skill fast for the later periods. I do think it's correct about the big dome and heat which other models agree on.
1. This is when the heat ridge peaks on July 15th.
2. Month of July temperature anomalies.
3. Month of July rainfall anomalies
4/5/6. GEFS model for same maps/time frames. Weaker dome. More more NW flow into the Midwest, cooler east, MUCH more rain Central/Eastern Cornbelt.


The saturated soils of central Illinois, many parts of Indiana and Ohio 'might' actually improve with 2/4 days of heat and sun. But clearly the 'top is off yields'. Nitrogen loss is probably too late to replace. Market may not care until harvest, unless Metmike's European model takes 'hold' and all of July is heat.
Cutworm, your assessment?
I think you're right, tjc!
However, big specs that control the price movement in late June/July that just covered a record long position (from rains) are not likely to start buying again from rains that already fell.
We got up to a foot of rain here in countries just north and east of Evansville, IN and it must have hurt, even though it was dry before the event. Just too small of a production area.
As a huge gardener for 2 decades, I can tell you that expansive roots are a producer/gardeners best friend.
The bigger the root system, the more nutrients in the soils they can absorb. Semi dry soils early in the growing season can be the best thing for crops. It forces the roots to expand in order to obtain more moisture. In doing so, those same roots can access the other minerals needed to optimize growth.....FOR THE REST OF THE GROWING SEASON!
Plant in the dust and the bins will bust are sort of based on that(as long as ample rains follow).
However, saturated soils always result in SHALLOW roots for the same reason. The reduction in yields from saturated soils early in the growing season cannot be compensated for. Even with abundant rains that are more than enough thru August. Those shallow roots will NEVER absorb the same amount of minerals that deep, expansive roots will.
On top of that, as tjc mentioned, many of those important nutrients that producers ADD to the soil get washed away from excessive rains, especially nitrogen on corn, for instance. A huge part of the increase in today's corn yields is coming from added urea/nitrogen.
If it's top dressed, guess what happens with an 8 inch rain that features most of that excessive water running off?
All that extra nitrogen and phosphorus running off in to streams, then rivers, then into the Mississippi River cause a big dead zone in the GOM every year. In years with the heaviest rains in the Midwest, the dead zone is worse. Drier years without excessive rains are the ones with a smaller dead zone.
https://www.marketforum.com/forum/topic/27498/#27499
+++++++++
Based on this and where these really heavy rains fell, I would guess the dead zone in the GOM later this year will be greater than usual.
+++++++++++
On the 2012 drought:
https://phys.org/news/2012-08-good-news-bad-drought-gulf.html
"In all, we found about 1,580 square miles of hypoxia compared to about 3,400 square miles in August 2011. What has happened is that the drought has caused very little fresh-water runoff and nutrient load into the Gulf, and that means a smaller region for marine life to be impacted."
DiMarco has made 27 research trips to investigate the dead zone since 2003.
We opened near unchanged for both C and S but immediately sold off modestly from the weather turning more bearish over the weekend as indicated earlier.
https://crops.extension.iastate.edu/encyclopedia/nitrogen-losses-after-heavy-rains
+++++++++++
Regardless of whether a producer can add back nitrogen lost from excessive rains, saturated soils ALWAYS cause shallow root systems. Deep, expansive roots are a producers best friend to maximize crop yields.
So I think that may be an even greater factor to reduce yields than the washed out/leached out nutrients. Regardless, tjc is likely right but the market will still trade rain makes grain at this time of year(unless its like 1993 and the Great Floods).
++++++++
I will also add that if that bullish EE forecast for July ends up being right, these are cheap prices. That may be holding us up here to some extent and keep the funds from loading up short.........which in almost every other season, they would be doing when the July forecast is bearish. It's NOT bearish, just not AS bullish but the EE seems to be an outlier with how bullish.
++++++++++
1. This was the just out 18z GEFS rain forecast for week 2. NOT bullish
2. Below it was the overnight run, 3 runs ago. The models are getting wetter with time.
This is NOT a widespread, excessive rain set up because northwest over the top of a heat ridge is progressive. We need the heat ridge to be along the East Coast or far eastern Cornbelt to pump in moisture AND block the systems movement/stall them.


Tuesday is the big stocks and acreage report. Wide range of guesses.
In my back yard (45 miles nw of Cincinnati) we had a very wet and cold may, after a warm dry April. Early corn is very uneven, from some areas sprouting later than others. I think this will have a small negative effect on yield.
Wet spots will not produce anything as replanted crops also drowned out.
Because of the wet and cold May the early planted corn is going to be shorter than normal, may or may not effect yield??
We should start tassel in the next week. Tasseling will be spread out as some planted early some late.
I'm thinking slightly below Trend, Just a guess at this time.
Weather?????
Will China but corn? and beans? We are competitive on Corn but not Beans
thanks very much, cutworm for that detailed, expert crop report from SE Indiana!
For sure our weather patterns this year have fluctuated. Even more than usual.
++++++++++++++++
6:30 am 6-29-26: Overnight changes continue to confirm the bearish changes mentioned over the weekend.........and the forecast for July MUST have major adversity to rally grains. The EE long range has that but the 2 week forecasts now matter the most and they have flipped to being increasingly bearish.
This is just 1 model that goes out 384 hours, the Canadian Ensemble and the market doesn't watch it much but the other 2 week models have been following an increasingly bearish pattern the farther in the forecast we go.
1. This was the last map a week ago, at the end of 2 weeks. Potentially very bullish!
2. This was the last 12z update today for the same time frame. MUCH LESS bullish for the Midwest
3. This was the last 12z update that goes out 7 days farther than a week ago. Bearish for July!!!!
384h GZ 500 forecast valid on Jul 8, 2026 12UTC
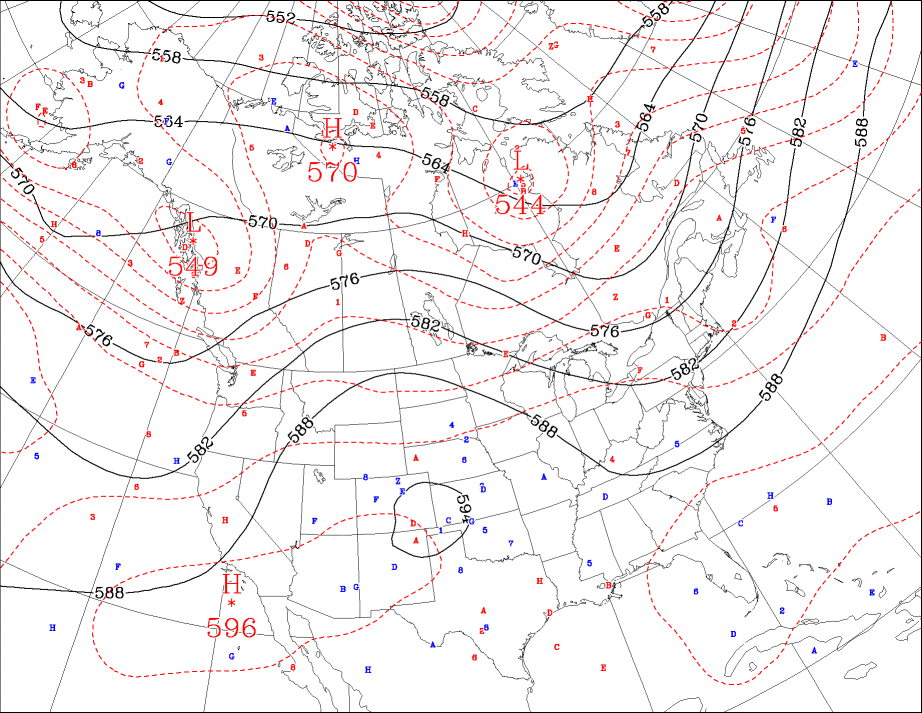
216h GZ 500 forecast valid on Jul 8, 2026 12UTC
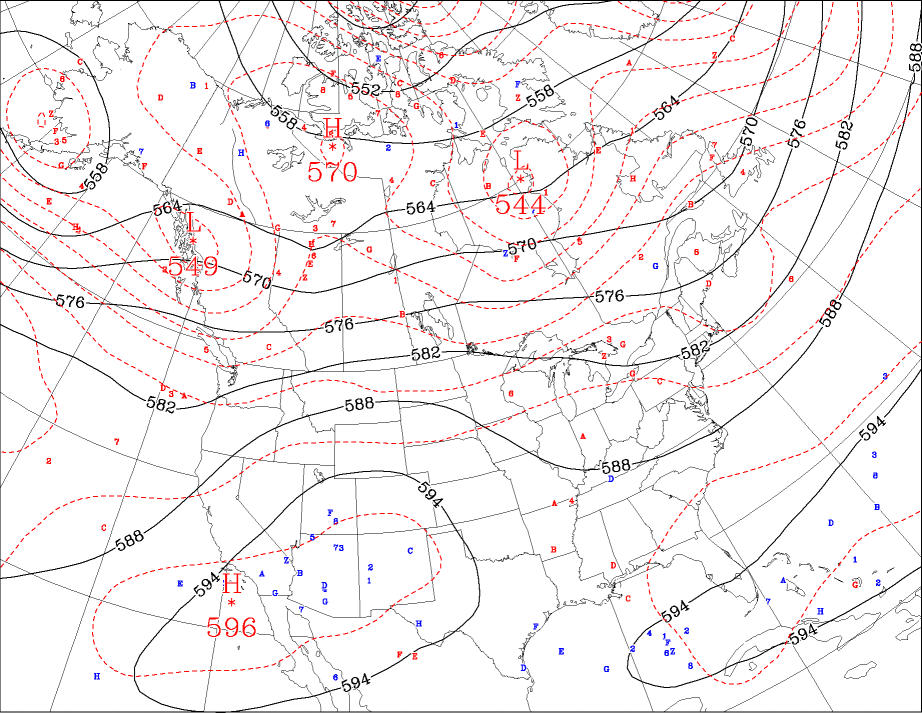
384h GZ 500 forecast valid on Jul 15, 2026 12UTC
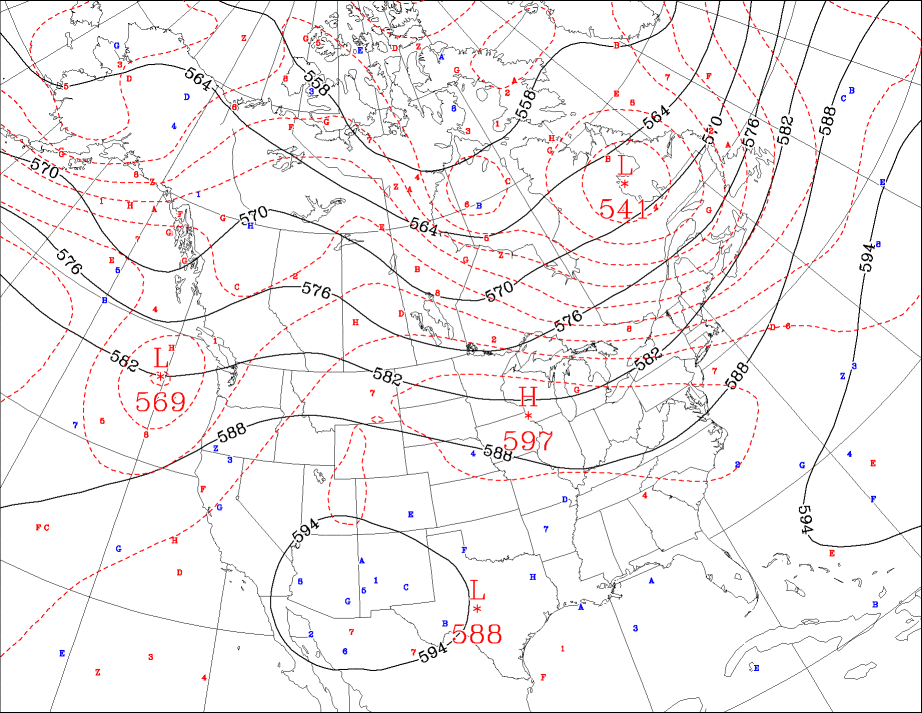
https://weather.gc.ca/ensemble/charts_e.html?Hour=384&Day=0&RunTime=12&Type=gz
+++++++++
Based on these changes that have been pretty consistent across the entire array of week 2 models for some time, I would say that the bullish European Model forecast for July is full of doo doo!
It's been getting less and less weighting in my forecast and in fact, was a big part of why I stopped posting the daily updates here:
Rain/Drought thread June 2026
16 responses |
Started by metmike - June 1, 2026, 7:51 a.m.
https://www.marketforum.com/forum/topic/120593/
++++++++
A key part of those constantly updated discussions(several times/day in some cases) was that extended EE model daily update. What's the point in spending all that time showing something that's busted to tell everybody it's busted?
I can still show it, like I did yesterday but instead, I'll pick and choose products, like the one above that TELL THE REAL STORY!
Do you think that someone knows what the report tomorrow says???
Great question, cutworm.
A topic that we've discussed before. In this case, I doubt that it was the reason for the fall in prices. I think that history will show that price moves the day before a USDA report are based on estimates of private firms and everybody except those that really know already.
Those firms use information that they think will be used by the USDA for the report to generate the USDA numbers. Insiders in the USDA know exactly what the market thinks and why. Some of them also know the actual numbers and when the numbers will be a huge surprise. They also know how to massage numbers to maximize surprises.
There will never be any proof, other than circumstantial evidence, where reports make no sense or when they go from higher than the highest estimate to the next report, lower than the lowest estimate(or from 1 extreme to the other quickly).
It would be like coin flip hitting 5 heads in a row, followed it hitting 5 tails in a row. That can happen but that's called random variation. There should be near 0 random variable in crop reports in today's age. Adjustments for sure. Updates for sure but when you are at the shooting range and your firearm is shooting to the right every time and causing you to miss to the right, you make an adjustment to that causes it to shoot a bit more to the left.............just enough to get CLOSER to the bullseye.
The USDA crop reports have gone from missing the entire estimate target to the right in 1 report to missing the entire estimate target to the left in the next report.
What are the chances that this is the only government department in existence, where everybody working there are all little Mother Theresa's that would never exploit their knowledge of inside information, along with their ability to impact the numbers?
By silverspiker - March 31, 2019, 5:37 p.m.
++++++++++
This is entirely speculative with no proof and there will probably never be any proof. I could be wrong.
Not sure what the market expected but crop ratings often drop a bit as the season goes on. C and S ratings dropped 1% since last week.
+5% for the Spring Wheat was a bearish surprise.
U.S. corn and soybean conditions dropped 1 pt each on the week, but spring wheat conditions surged 5 pts, topping analyst estimates. Winter wheat harvest pace, while still ahead of average, was slower last week than all analysts expected.
The change in the C and S rating matters MUCH less than the weather from this point on.
+++++++++
Eric's awesome weather update this morning:
Overnight, the week 2 AND July forecast from the European Ensemble model was even a bit more bullish.
That was not the case for all the other models although the GEFS July forecast is a bit hotter/drier in the WCB.
The USDA will determine prices for the rest of this session in just over an hour.
I will keep open the possibility that the EE, although an outlier that's getting low weighting.........could be right.
New thread:
Grains/USDA report 6-30-26
Started by metmike - June 30, 2026, 3:39 p.m.


