These opinions come from a constantly practicing, authentic environmentalist that conserves EVERYTHING, minimizes energy use, waste and avoids purchasing new items that are not needed. Feeds wildlife during harsh Winter conditions. Does not liter and has been a part of the local Evansville community organizations with a similar mindset to make our world more beautiful and environmentally friendly since moving here in 1982!
https://keepevansvillebeautiful.org/
+++++++++++++++++++++++
One of the saddest things about this fake climate crisis which is twisting a climate optimum for life into a disaster for the planet, is that it now makes it much more difficult to properly manage what the real crisis's are:
There are some real serious crisis's going on being ignored, shown with the irrefutable evidence in the posts below.
1. Many insects, including bees are dying off-May 25, 2019-correction-I was misled, bees are not dying off.
2. Massive dead zones from agricultural runoff affect the oceans and lakes around the planet.
3. Underground aquifers that supply vital water to 1.5 billion people are being sucked dry with some of it wasted for environmentally toxic endeavors.
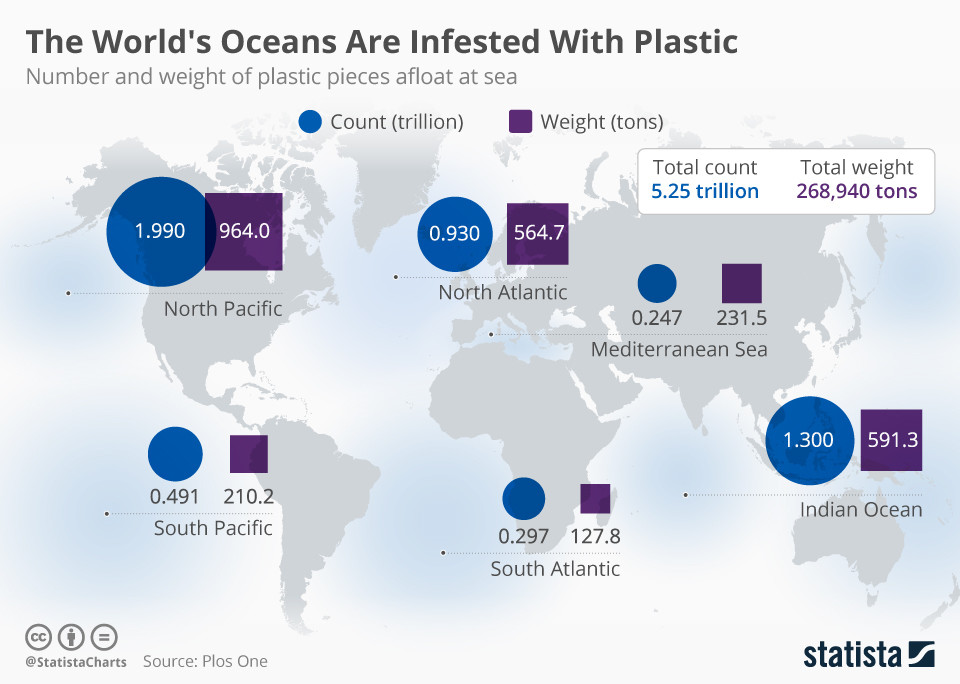
4. Many trillions of pieces of plastic are collecting in the oceans and the rate of increase is accelerating........as all the attention goes towards fighting the fake climate crisis.
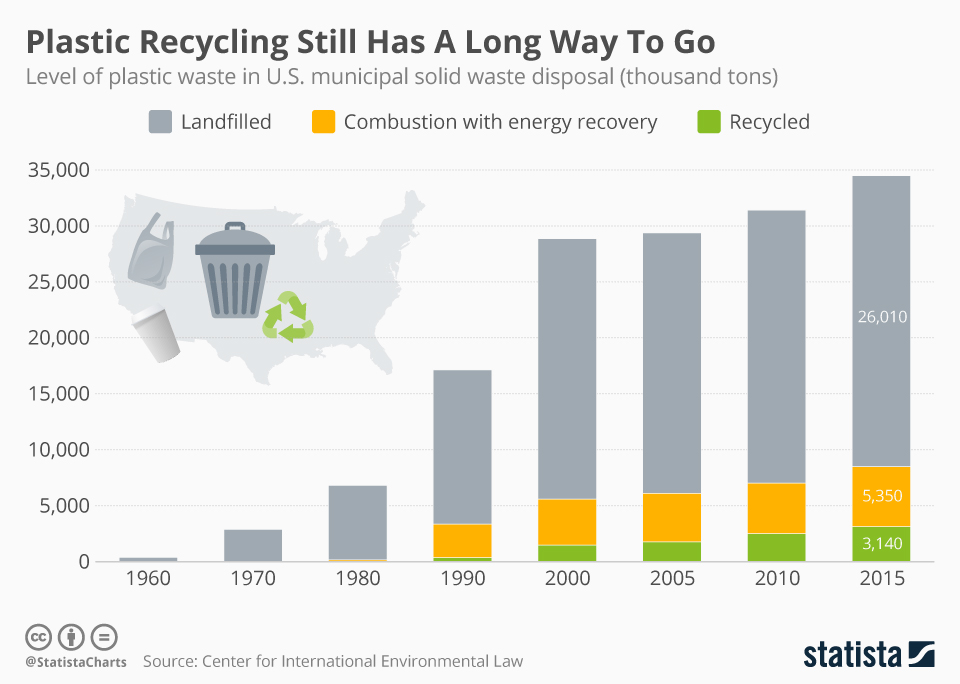
5. February 1, 2021 addition: Landfills/Trash....this is related to #4 above
6. March 1, 2021 addition: Over consumption of and waste of natural resources.
7. April 5., 2022: REAL pollution. Especially the pollution that makes breathing the air unhealthy for billions of people on this planet.
8. Fake Green energy, especially wind turbines and electric cars(batteries).
The environmentalists don't know the difference between the authentic environmental crisis's and the hoax(manufactured) climate crisis. The non environmentalists, realizing that one is a manufactured hoax, assume the other ones are too......if they even hear or read about the other ones because the real ones hardly get much attention.
Almost all of the energy, money, resources, advertising and media attention is being diverted to the manufactured crisis/hoax because it has such a profound ability for influence in the world of politics, power, money(crony capitalism), attention, scientific funding and ratings.
The planets best weather/climate/CO2 levels in over 1,000 years is manufactured into a crisis................while the real crisis(s)-plural get ignored:
++++++++++++++
#1 Threat:
World seeing 'catastrophic collapse' of insects: study(note that I adjusted this based on my research)
Started by metmike - April 6, 2019, 2:11 a.m.
#2 Threat:
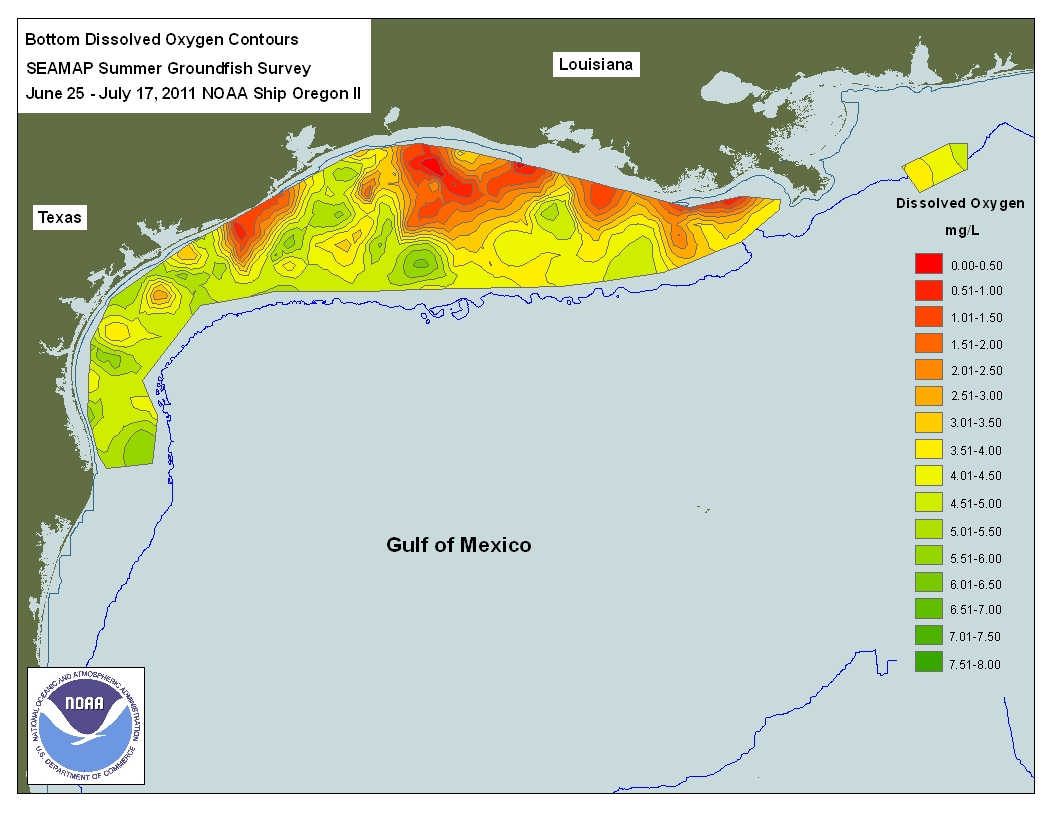
Massive dead zones around the world from agricultural activity(water pollution).
https://en.wikipedia.org/wiki/Dead_zone_(ecology)
Dead zones are hypoxic (low-oxygen) areas in the world's oceans and large lakes, caused by "excessive nutrient pollution from human activities coupled with other factors that deplete the oxygen required to support most marine life in bottom and near-bottom water. (NOAA)".[2] Historically, many of these sites were naturally occurring. However, in the 1970s, oceanographers began noting increased instances and expanses of dead zones. These occur near inhabited coastlines, where aquatic life is most concentrated. (The vast middle portions of the oceans, which naturally have little life, are not considered "dead zones".)

Red circles show the location and size of many dead zones.
Black dots show dead zones of unknown size.
The size and number of marine dead zones—areas where the deep water is so low in dissolved oxygen that sea creatures can't survive—have grown explosively in the past half-century. – NASA Earth Observatory (2008)[1]
This area below is the DEAD ZONE where runoff from the Mississippi goes.
In March 2004, when the recently established UN Environment Programme published its first Global Environment Outlook Year Book (GEO Year Book 2003), it reported 146 dead zones in the world's oceans where marine life could not be supported due to depleted oxygen levels. Some of these were as small as a square kilometre (0.4 mi²), but the largest dead zone covered 70,000 square kilometres (27,000 mi²). A 2008 study counted 405 dead zones worldwide.[3][4]
https://www.futurity.org/phosphorous-algae-freshwater-1702482-2/
Though essential to plant growth and a key trace element of many organisms, an overabundance of phosphorus in river basins can cultivate algae blooms in freshwater gulfs and lakes that those rivers feed. The eventual decomposition of the algae consumes vast amounts of oxygen, creating so-called dead zones that choke out marine life.
A dead zone the size of New Jersey occupies the Gulf of Mexico.
#3 Threat:
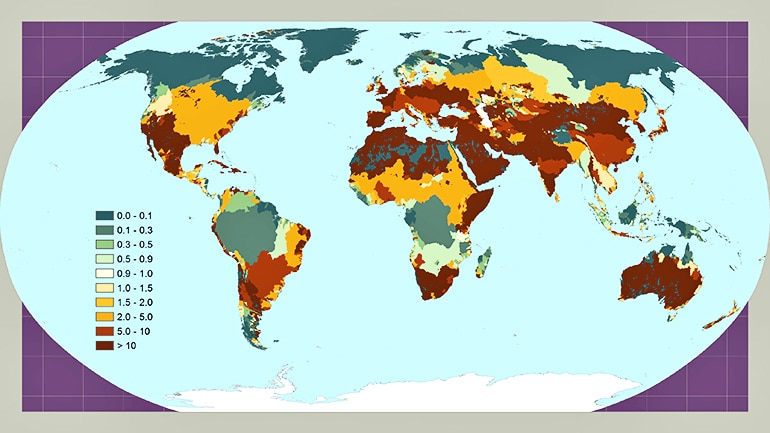
Pumped dry-the Global CRISIS of vanishing ground water!
https://www.usatoday.com/pages/interactives/groundwater/
"In places around the world, supplies of groundwater are rapidly vanishing. As aquifers decline and wells begin to go dry, people are being forced to confront a growing crisis."
January 19, 2019
Water scarcity is getting worse around the world as aquifers are drained faster than they can be refilled. The most significant contributor to the problem is industrial farming, due to its heavy use of potable water for irrigation.
According to the U.S. Department of Agriculture, about 80 percent of U.S. consumptive water (and more than 90 percent in many Western states) is used for agricultural purposes1 and, worldwide, groundwater is being used up at a faster rate than it can be replenished.
One-third of the largest groundwater aquifers are already nearing depletion,2 with three of the most stressed aquifers being located in areas where political tensions run high as it is.3 To give you an idea of how quickly groundwater is being depleted, consider what's happening in the High Plains Aquifer (also known as the Ogallala) in the American Midwest.
Here, the water level has been dropping by an average of 6 feet per year, while the natural recharge rate is 1 inch or less.4 Once this aquifer is depleted — and many wells have already run dry in the area — 20 percent of the U.S. corn, wheat and cattle output will be lost due to lack of irrigation and water for the animals.
According to Jay Famiglietti, a senior water scientist at NASA's Jet Propulsion Laboratory, the majority of our global groundwaters "are past sustainability tipping points,"5 which means it's only a matter of time until we run out of fresh water.
Precious water sources are also threatened by pollution from large-scale monocrop farms and concentrated animal feeding operations.6 According to a report7 by Environment America, corporate agribusiness is "one of the biggest threats to America's waterways." Tyson Foods Inc. was deemed among the worst, releasing 104.4 million pounds of toxic pollutants into waterways between 2010 and 2014.
Researchers have warned that many lakes around the world are now at grave risk from fertilizer runoff that feeds harmful blue-green algae (cyanobacteria),8,9 and once established, it's far more difficult to get rid of than previously thought. The answer, according to the authors of this study, is better land-use management that addresses fertilizer runoff. Dramatic reductions in fertilizer use are also recommended.
Indeed, the long-term solution to many of our water quality and water scarcity issues is to phase out the use of toxic pesticides, chemical fertilizers and soil additives, and to grow crops and raise food animals in such a way that the farm contributes to the overall health and balance of the environment rather than polluting it and creating a dysfunctional ecosystem.
https://www.earthday.org/2018/04/05/fact-sheet-plastics-in-the-ocean/
"The billions upon billions of items of plastic waste choking our oceans, lakes, and rivers and piling up on land is more than unsightly and harmful to plants and wildlife.
The following 10 facts shed light on how plastic is proving dangerous to our planet, health, and wildlife. To learn more about the threat and impact of plastic pollution and to get tips to reduce your plastic consumption, download our Plastic Pollution Primer and Toolkit today!"
https://www.biologicaldiversity.org/campaigns/ocean_plastics/
"In the first decade of this century, we made more plastic than all the plastic in history up to the year 2000. And every year, billions of pounds of more plastic end up in the world's oceans. Studies estimate there are now 15–51 trillion pieces of plastic in the world's oceans — from the equator to the poles, from Arctic ice sheets to the sea floor. Not one square mile of surface ocean anywhere on earth is free of plastic pollution.
The problem is growing into a crisis."
 © LITTERBASE -- Map shows where most ocean trash ends up.
 © LITTERBASE -- This map shows ways in which species are affected by litter. Purple is colonization, orange is entanglement, green is ingestion, yellow is other (partial screenshot of full map)
BTW, the ocean acidification crisis is bs!
Scroll down here:
https://www.marketforum.com/forum/topic/25818/#25867
Gore, made the polar bear the global warming mascot in 2007 because of melting ice in the Artic and told us that they were threatened with extinction because of global warming.
Since then, polar bear numbers have been increasing...........by around 25% since 2005!
Let's let one of the world's top authorities, Susan Crockford tell you about it:
"Since 2005, however, the estimated global polar bear population has risen by more than 30% to about 30,000 bears, far and away the highest estimate in more than 50 years."
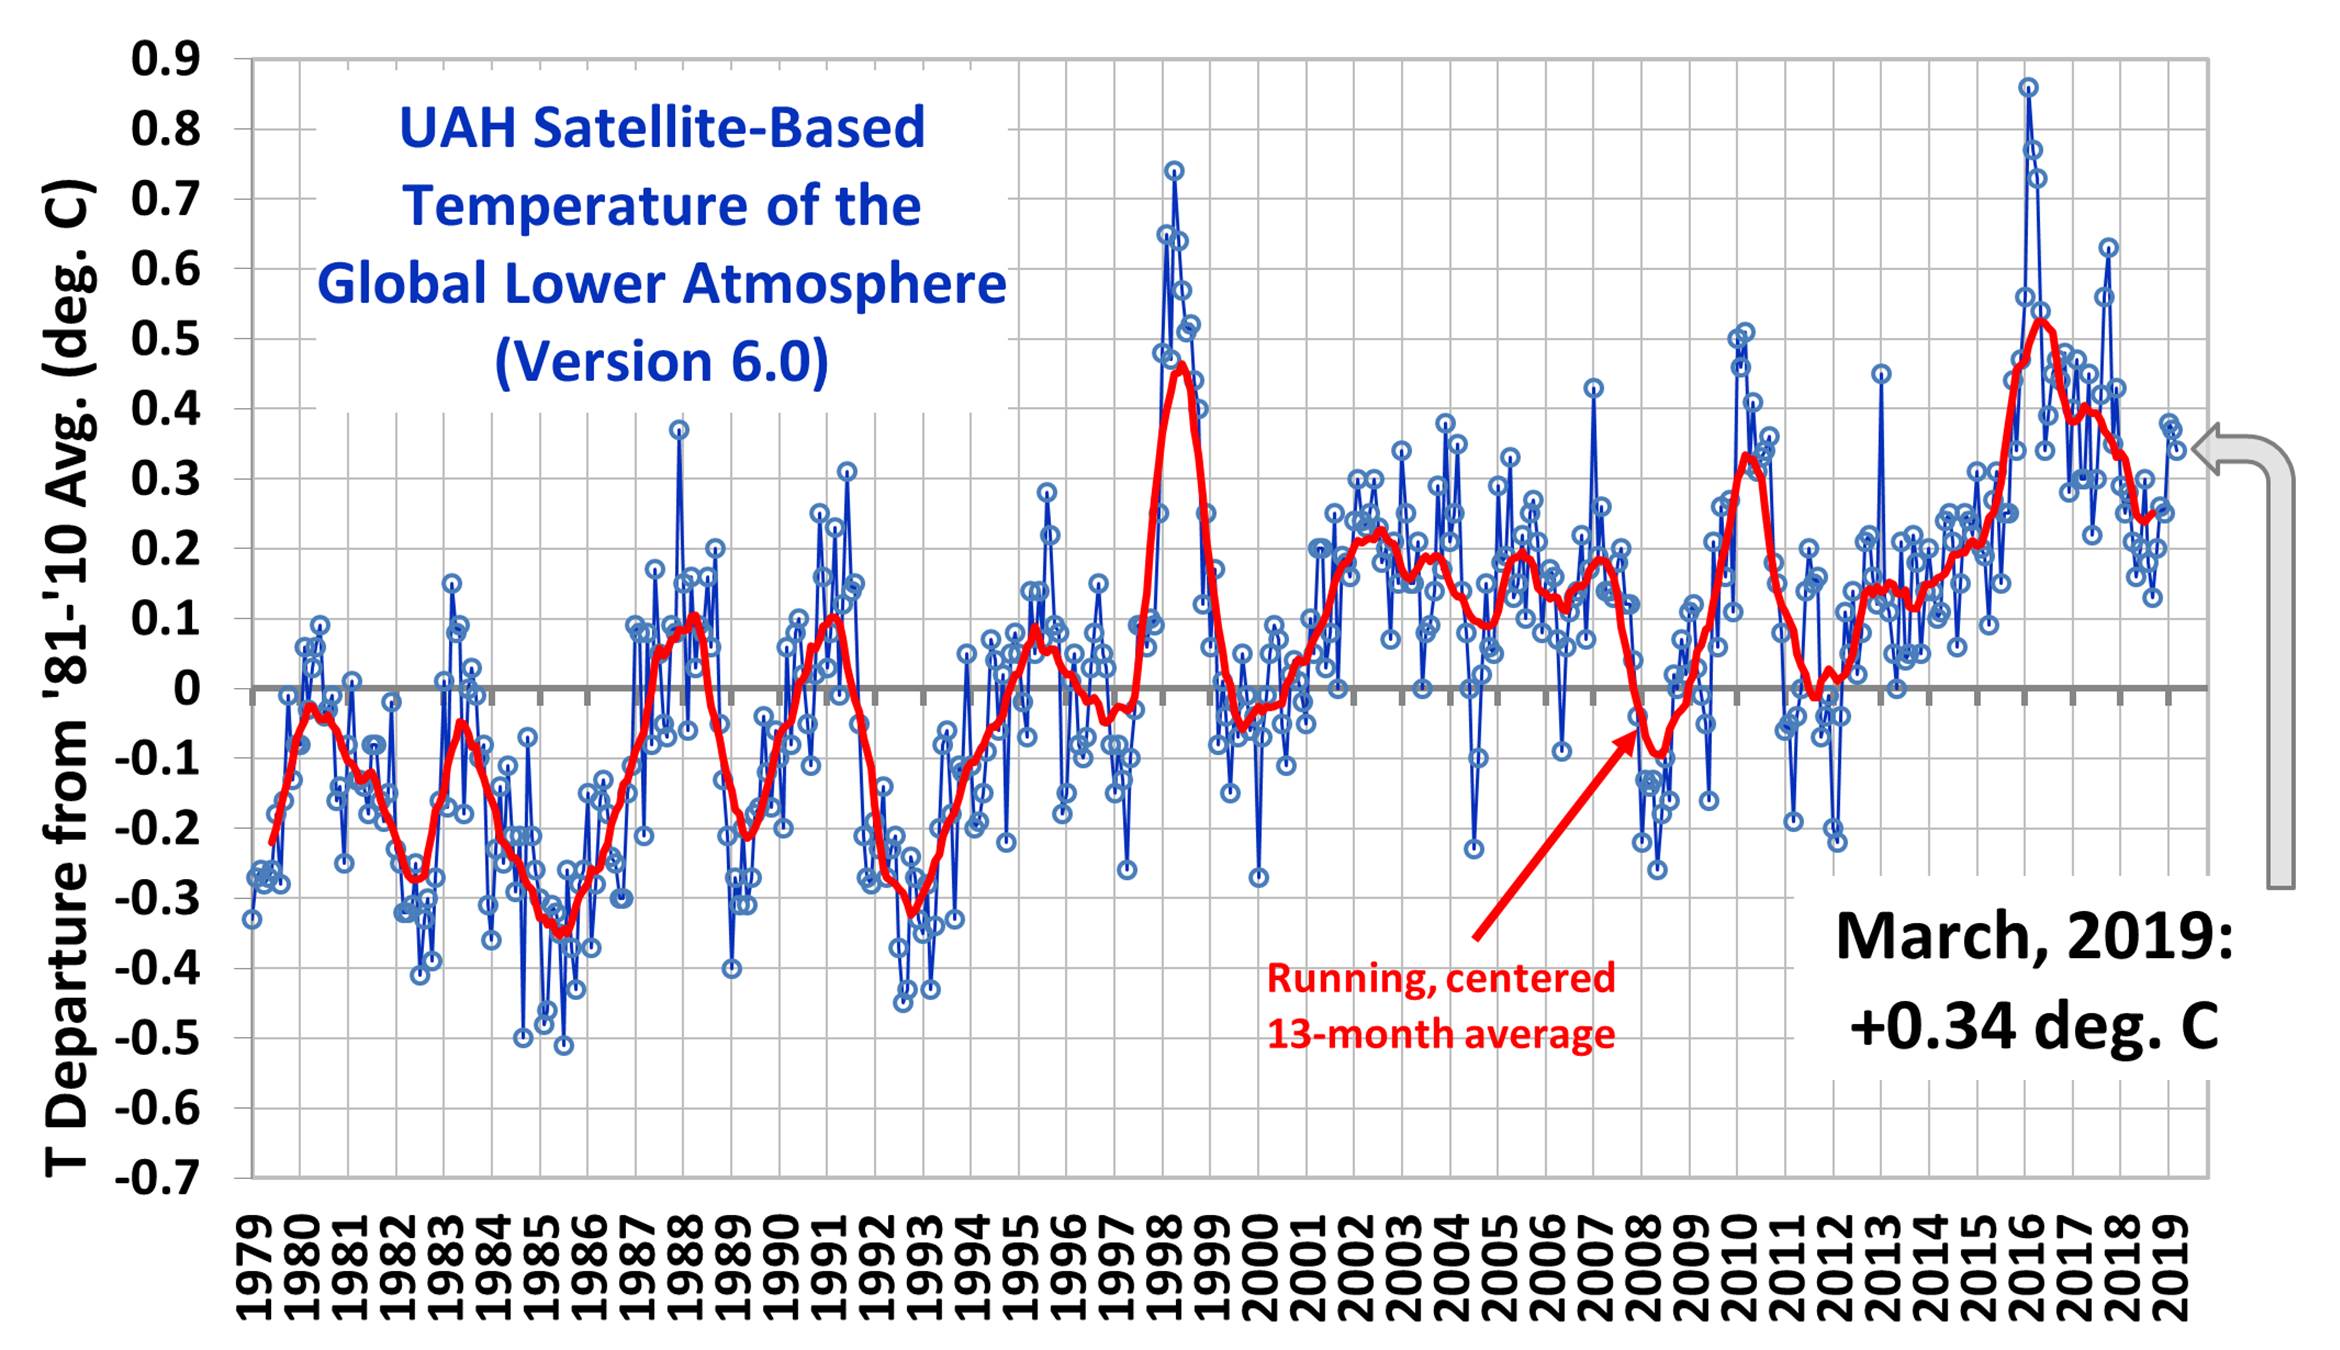
The global temperature has continued to warm slightly and beneficially( up just over 0.1 Deg. C since then) This is part of the reason that the last 40 years have featured the best weather and climate in the last 1,000 years, for life on this planet, the last time that it was this warm, during the Medieval WARM Period.
The last 12 years have continued on that beneficial path for life and the planet......with regards to the weather, climate and CO2 levels only............those things that you've been told were bad.........have all been very good to life.
http://www.drroyspencer.com/2019/04/uah-global-temperature-update-for-march-2019-0-34-deg-c/
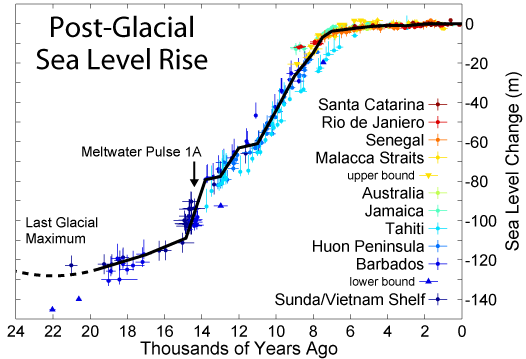
Sea levels have been rising at just over an 1 inch/decade for the last 150 years. This has continued.
Sea levels are a bit more than an inch higher than they were in 2007, when Gore predicted they will go up 20 feet in the next century(at his predicted rate, the oceans would be increasing 2 feet/decade, not 1 inch)
https://curryja.files.wordpress.com/2011/07/post-glacial_sea_level.png
Gore said that global drought would increase.
Instead the planet has continued to green up. Not just a little greening in a few places.........a massive amount of greening in many places. Enough to make the forecasts from 12 years, completely wrong by a wide margin!
Death by GREENING!
40 responses |
Started by metmike - May 11, 2021, 2:31 p.m.
https://www.marketforum.com/forum/topic/69258/
++++++++++++
Nobody has repealed this law:

Carbon pollution? Hogwash!
Carbon is a solid!
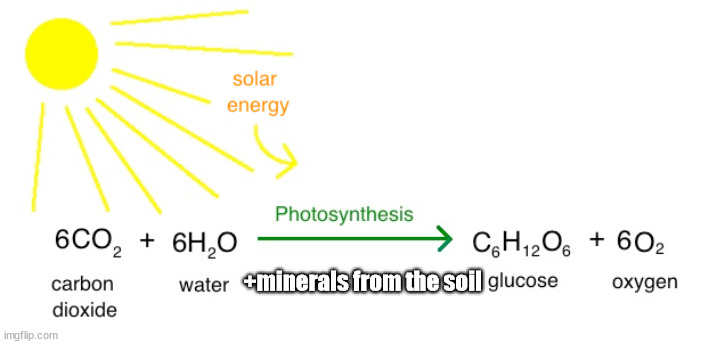
CO2 is a beneficial gas massively greening up the planet and increasing food for all the creatures on it!
++++++++++++++
National Climate Emergency??????????!!!!!!!!!!!
21 responses |
Started by 12345 - April 24, 2024, 8:25 p.m.
https://www.marketforum.com/forum/topic/103492/
Crops were supposed to be adversely effected.
Instead the complete opposite happened.
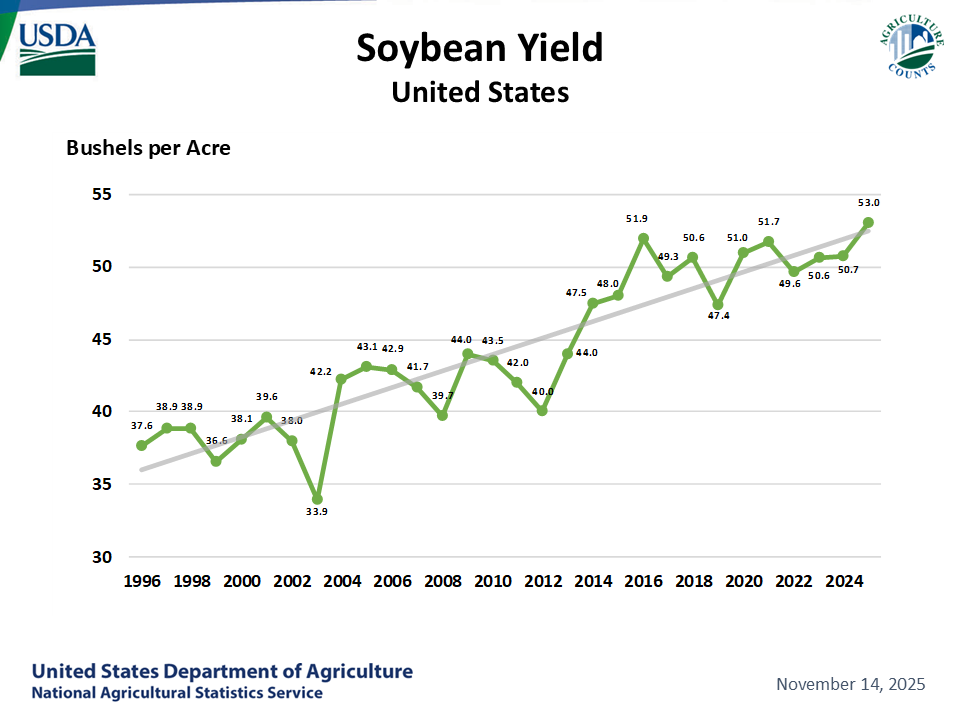
Crop yields and world food production have been smashing records. Not in spite of climate change but BECAUSE of it's massive benefits. CO2 fertilization is adding 25% more to our crops because of the increase from 280 parts per million to 408 ppm.
The US Cornbelt, the highest producing crop region in the world has had only 1 major, widespread drought in the last 3 decades(2012, with the previous one being in 1988), when historically, prior to this climate change, the average was to have 3 times as many droughts.
https://www.nass.usda.gov/Charts_and_Maps/Field_Crops/soyyld.php
Anybody ever read history............Dust Bowl decade of the 1930's!
https://www.epa.gov/climate-indicators/climate-change-indicators-high-and-low-temperatures
WOW, they doctored the data and changed the graph to manufacture the current one at that link!!!!
Here were the real 1930's:
https://www.marketforum.com/forum/topic/76030/#76059
They lived thru the worst weather decade in recorded US history......by an extremely wide margin!!!
The 1930's Dust Bowl.

Drought indexes.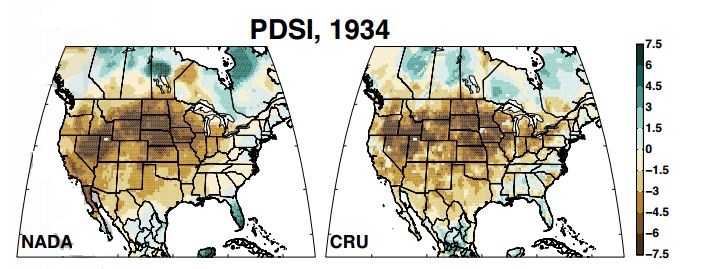

So then, what does the authentic science tell this atmospheric scientist (and others that discard the delusional, fake science predictions from AOC) about conditions that will be most likely in 12 years, the period that AOC refers to:
1. Global temperatures will likely continue to go up at around the same rate and be +0.11 deg. C 1/10th of 1 deg. C warmer..........beneficial to most life in 2030.
2. Sea levels will likely be just over 1 inch higher in 2030.
3. The planet will likely have greened up even more from the atmospheric fertilization/benefits of warming in 2030.
4. Crop yields will likely be even higher in 2030.
5. Global drought will likely be around the same or slightly less in 2030.
6. The weather will not be more extreme and the climate will have continued on the path towards another climate optimum but still not as warm as the Holocene Climate Optimum of 5,000+ years ago that was warmer than this.
https://en.wikipedia.org/wiki/Holocene_climatic_optimum
 Temperature variations during the Holocene from a collection of different reconstructions and their average. The most recent period is on the right, but the recent warming is only seen in the inset.
BTW, it's not just AOC and Gore saying this stuff,
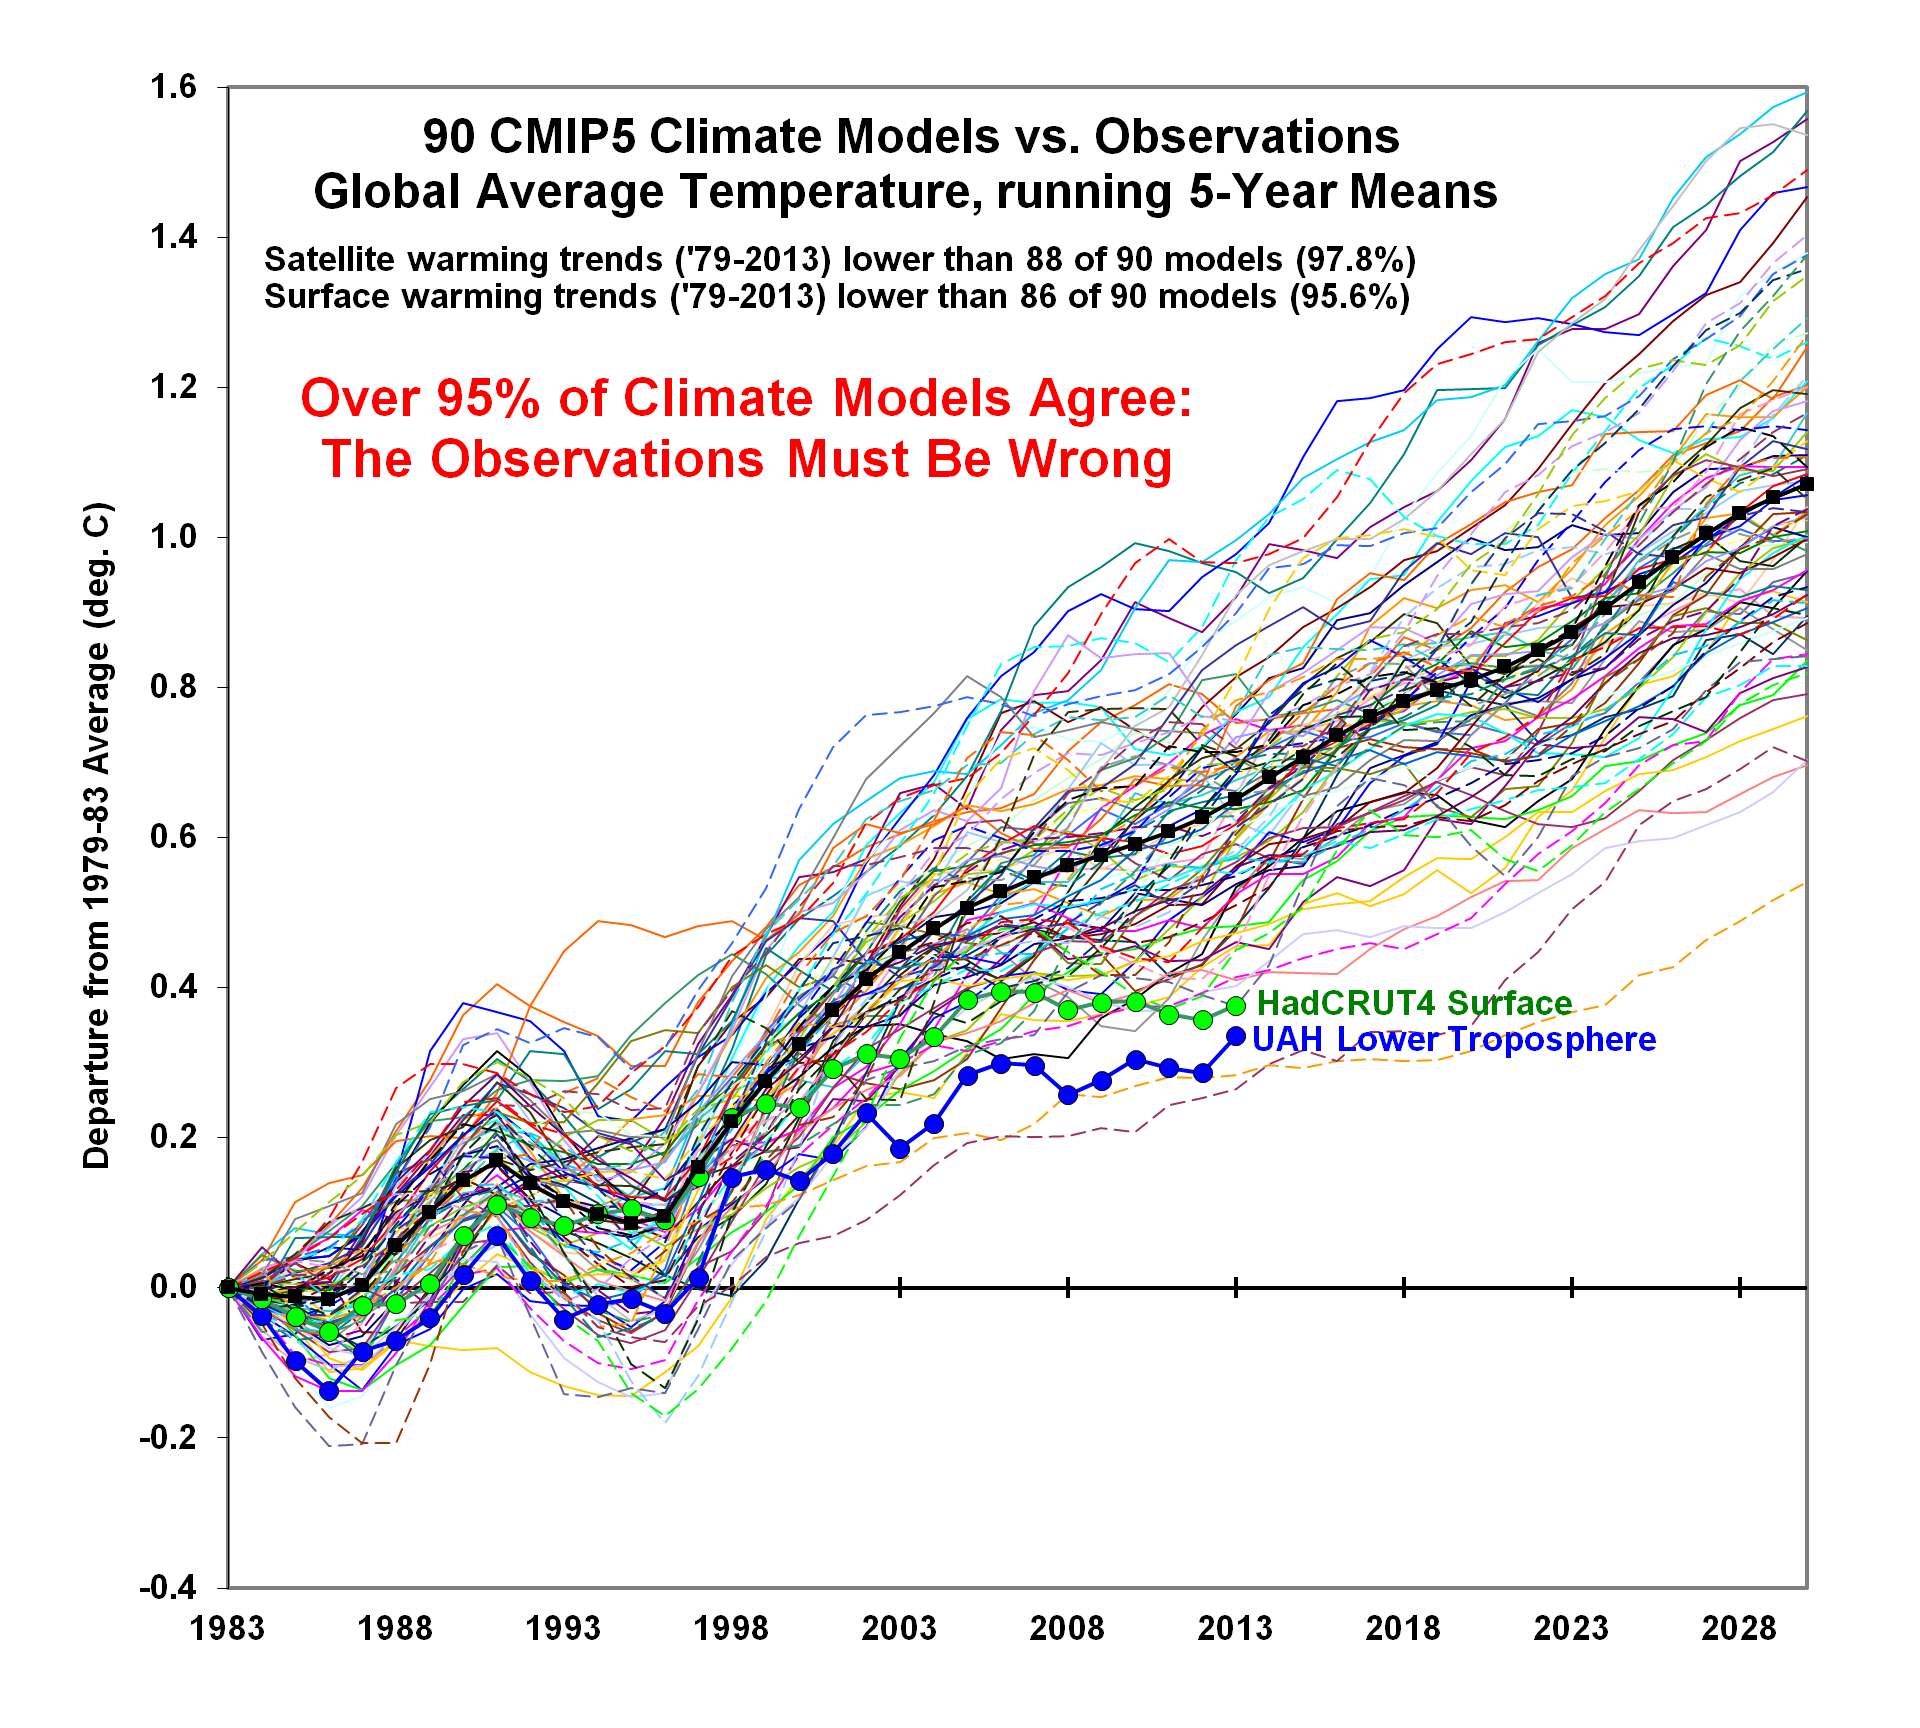
They may be the most exteme but the mainstream media gushes the junk climate science out everytime we have an extreme weather event(which has all been part of normal, expected extreme weather). The scientific papers/studies that totally contradict the reality of our world are mind boggling.
The crisis is entirely based, 100% based on computers programmed to simulate the atmosphere for the next 100 years based on a speculative theory that's been busting badly in real time..............but the political agenda(global socialism via the Climate Accord) and scientists careers/reputations and funding and carbon tax potential all need the theory to be right...........so the wonderful benefits to life and this planet from recent climate change are hidden and models programmed for disaster are used as (fake)evidence to manufacture the future crisis.
http://www.drroyspencer.com/2014/02/95-of-climate-models-agree-the-observations-must-be-wrong/
I'm adding to the end of a couple of my discussions because it makes the most important distinction between being a sincere environmentalist and the scientific position about CO2's role as a beneficial gas during the current climate optimum.
Re: Re: Re: Re: Re: Re: Re: Re: Re: Re: Re: Re: Re: Re: Re: Fresh Water crisis???
By metmike - July 18, 2019, 3:58 p.m.
https://www.marketforum.com/forum/topic/34796/
The EPA-s endangerment finding which allows it to regulate CO2 as a pollutant is one of the biggest piles of dung in political history, masquerading as science.
I’m a passenger in a car right now, headed to Detroit or I would show it to you.
Keep in mind that I’m an environmentalist.
I conserve water and energy, I turn the ac completely off in the Summer when my wife is not home and the heat down to as low as50 in the winter when she’s gone.....seriously-I damaged her tropical plants a couple of times-I wear a sweat shirt, my winter jacket, a hat and gloves with finger holes to type on the computer. I often wear a pair of down pants over my jeans.
I minimize use of plastics and paper/ cardboard. We used to recycle but got out of that routine. My kids would collect aluminum cans, crush them then we would sell them. They made $100 doing this.
I also exercise vigorously and exhale massive amounts of beneficial CO2 to do my part in helping to green up the planet (-:
Unless you are very active or get dirty, there is no need to shower every day. I shower after exercise or working outside and getting dirty. Showering every day Is a waste of water if you just do it out of habit. Green lawns are aesthetically appealing but they waste billions of gallons of water.
The point of telling you this is that the hypocritical gatekeepers of the information that brainwash us about the fake climate crisis are maximizing their use of those fossil fuels to enjoy all the comforts they provide in their lives.......and calling people like me deniers for providing authentic science that contradicts their scary, speculative computer model simulations going out for the next 100 years.
And they have the gumption to tell us exactly what we have to do or we will lose the planet in 12 years, with solutions that will have zero effect on climate and don’t address any real environmental problems with our water, air or soils.
All the climate reality discussions can be found here:
There are other items that can be added to the 4 above and one of them, that has recently been brought to my attention are LANDFILLS.
![]()
#5 Landfills
https://www.conserve-energy-future.com/causes-effects-solutions-of-landfills.php
https://www.clf.org/blog/all-landfills-leak-and-our-health-and-environment-pay-the-toxic-price/
+++++++++++++
http://css.umich.edu/factsheets/municipal-solid-waste-factsheet
Municipal Solid Waste (MSW), commonly called “trash” or “garbage,” includes wastes such as durable goods (e.g., tires, furniture), nondurable goods (e.g., newspapers, plastic plates/cups), containers and packaging (e.g., milk cartons, plastic wrap), and other wastes (e.g., yard waste, food). This category of waste generally refers to common household waste, as well as office and retail wastes, but excludes industrial, hazardous, and construction wastes. The handling and disposal of MSW is a growing concern as the volume of waste generated in the U.S. continues to increase.1

+++++++++++++++++

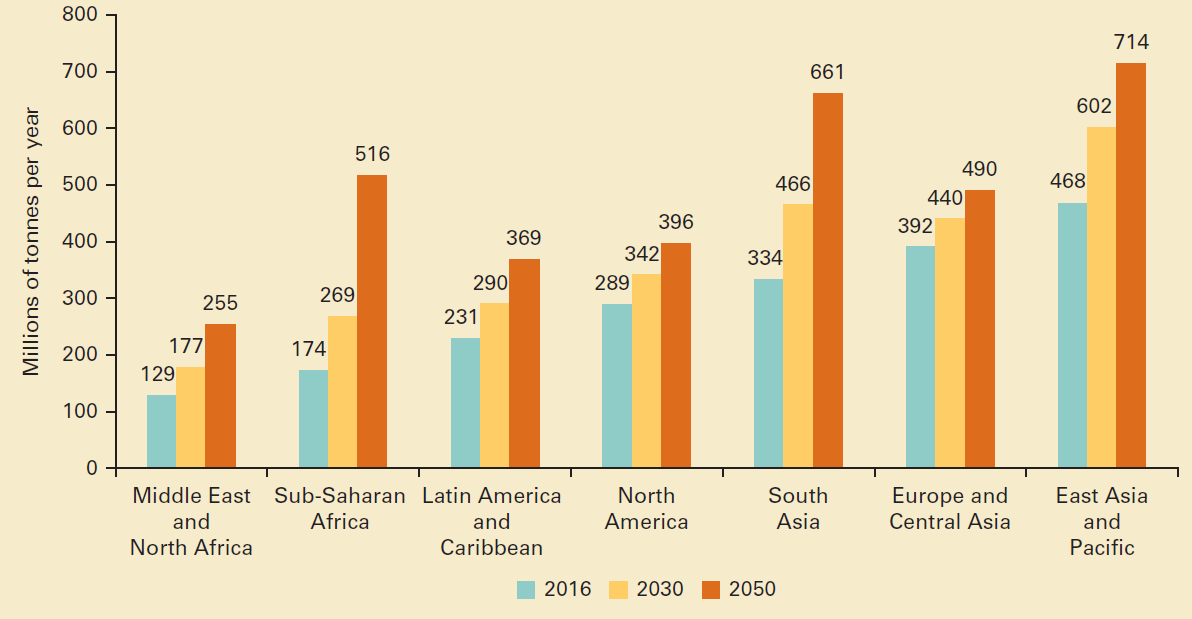
A Global Snapshot of Solid Waste Management to 2050
https://datatopics.worldbank.org/what-a-waste/trends_in_solid_waste_management.html
Projected waste generation, by region (millions of tonnes/year)
+++++++++++++++++++++++++++++++++++++++++++++++++++
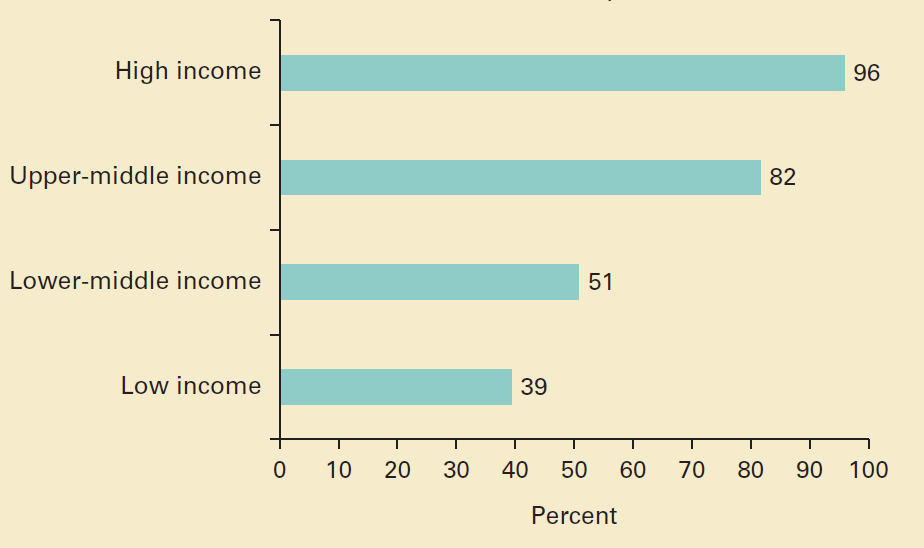
Waste collection is a critical step in managing waste, yet rates vary largely by income levels, with upper-middle- and high-income countries providing nearly universal waste collection. Low-income countries collect about 48 percent of waste in cities, but this proportion drops drastically to 26 percent outside of urban areas.
Waste collection rates, by income level (percent)
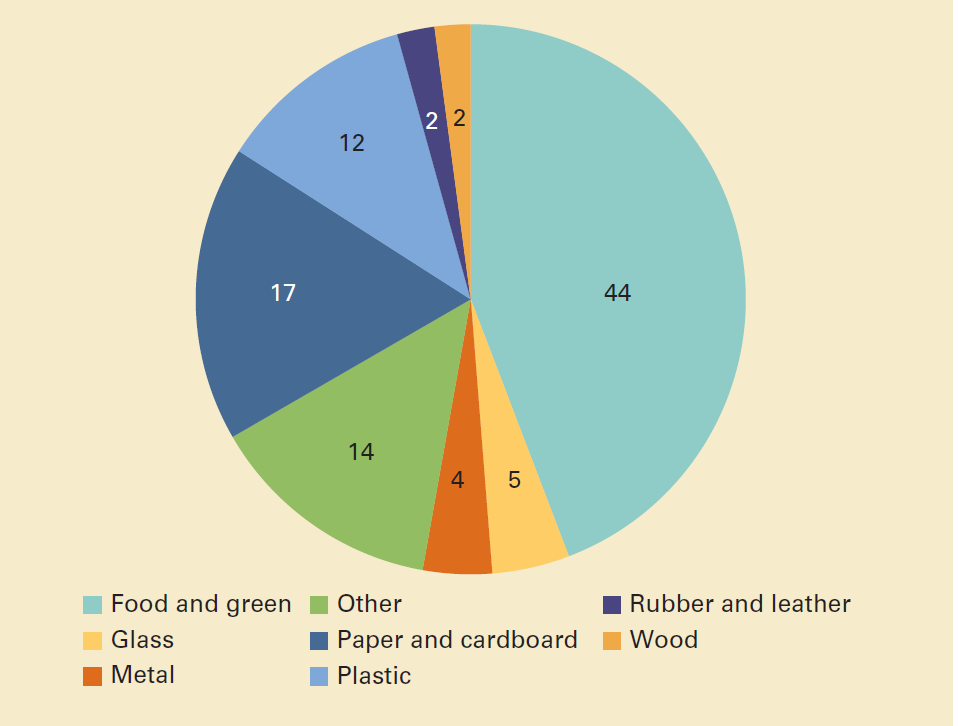
Global waste composition (percent)
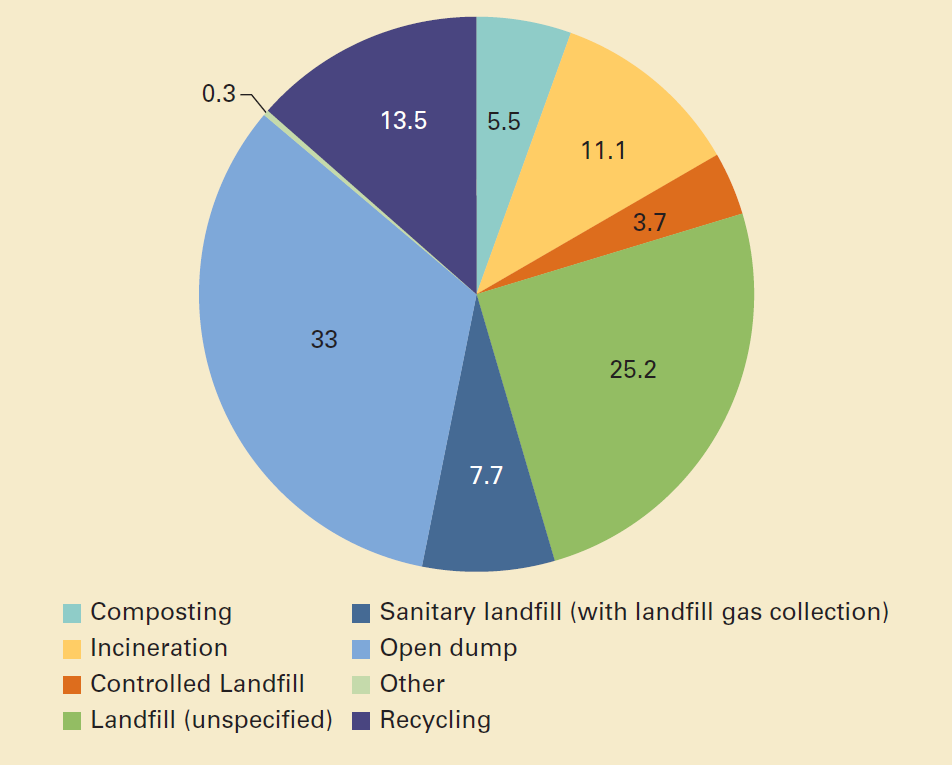
Global treatment and disposal of waste (percent)
I'm adding another major item to this thread:
#6 Over consumption and wasting of natural resources
https://www.businessinsider.com/everyday-ways-to-reduce-waste-2017
So while 75 people out of 100 are actively concerned about the environment in their daily lives, only 1 out of 5 makes a conscious effort all the time.
If you want to make a difference but don’t want to commit to anything truly life-changing just yet, here are 16 ways to lessen waste without added inconvenience:
https://www.theguardian.com/environment/blog/2011/oct/31/six-natural-resources-population
Freshwater only makes 2.5% of the total volume of the world's water
The fear of reaching peak oil continues to haunt the oil industry. The BP Statistical Review of World Energy in June measured total global oil at 188.8 million tonnes, from proved oil resources at the end of 2010. This is only enough to oil for the next 46.2 years, should global production remain at the current rate.
A similar picture to oil exists for natural gas, with enough gas in proven reserves to meet 58.6 years of global production at the end of 2010.
Without this element, plants cannot grow. Essential for fertiliser, phosphate rock is only found in a handful of countries, including the US, China and Morocco. With the need to feed 7 billion people, scientists from the Global Phosphorus Research Initiative predict we could run out of phosphorus in 50 to 100 years unless new reserves of the element are found.
This has the largest reserves left of all the fossil fuels, but as China and other developing countries continue to increase their appetite for coal, demand could finally outstrip supply. As it is, we have enough coal to meet 188 years of global production.
Scandium and terbium are just two of the 17 rare earth minerals that are used in everything from the powerful magnets in wind turbines to the electronic circuits in smartphones. The elements are not as rare as their name suggests but currently 97% of the world's supply comes from China and they can restrict supplies at will. Exact reserves are not known.
in the air, water and soils.
https://www.who.int/news/item/04-04-2022-billions-of-people-still-breathe-unhealthy-air-new-who-data
Meanwhile, the evidence base for the damage air pollution does to the human body has been growing rapidly and points to significant harm caused by even low levels of many air pollutants.
Particulate matter, especially PM2.5, is capable of penetrating deep into the lungs and entering the bloodstream, causing cardiovascular, cerebrovascular (stroke) and respiratory impacts. There is emerging evidence that particulate matter impacts other organs and causes other diseases as well.
NO2 is associated with respiratory diseases, particularly asthma, leading to respiratory symptoms (such as coughing, wheezing or difficulty breathing), hospital admissions and visits to emergency rooms
In the 117 countries monitoring air quality, the air in 17% of cities in high-income countries fall below the WHO’s Air Quality Guidelines for PM2.5 or PM10. In low- and middle-income countries, air quality in less than 1% of the cities complies with WHO recommended thresholds.
Globally, low- and middle-income countries still experience greater exposure to unhealthy levels of PM compared to the global average, but NO2 patterns are different, showing less difference between the high- and low- and middle-income countries.
About 4000 cities/human settlements in 74 countries collect NO2 data at ground level. Aggregated, their measurements show that only 23% of people in these places breathe annual average concentrations of NO2 that meet levels in the recently updated version of WHO’s Air Quality Guidelines.
metmike: Note that CO2 is not mentioned 1 time in this report. CO2 is NOT pollution. There absolutely is NO climate crisis.
https://en.wikipedia.org/wiki/Air_pollution
Carbon dioxide (CO2): Because of its role as a greenhouse gas it has been described as "the leading pollutant"[46] and "the worst climate pollutant".[47] Carbon dioxide is a natural component of the atmosphere, essential for plant life and given off by the human respiratory system.[48]This question of terminology has practical effects, for example as determining whether the U.S. Clean Air Act is deemed to regulate CO2 emissions.
metmike: Note the underlined statement. Science, biology, agronomy and climate/meteorology has always known CO2 as a beneficial gas for many centuries.
Then politics came in, via the United Nations in the late 1980's to hijack climate science for their agenda and redefined CO2 as pollution........even rewriting climate history to wipe out the 3 equally warm periods in the last 3,500 years (Medieval/Roman/Minoan Warm Periods) and hide the warmer, Holocene Climate Optimum just before that.
++++++++++++++++++++++++++++++++++++++++++++++++++
https://www.marketforum.com/forum/topic/78243/#78250
PETER JAMES SPIELMANN June 29, 1989
https://www.apnews.com/bd45c372caf118ec99964ea547880cd0
UNITED NATIONS (AP) _ A senior U.N. environmental official says entire nations could be wiped off the face of the Earth by rising sea levels if the global warming trend is not reversed by the year 2000.
Coastal flooding and crop failures would create an exodus of ″eco- refugees,′ ′ threatening political chaos, said Noel Brown, director of the New York office of the U.N. Environment Program, or UNEP.
He said governments have a 10-year window of opportunity to solve the greenhouse effect before it goes beyond human control.
As the warming melts polar icecaps, ocean levels will rise by up to three feet, enough to cover the Maldives and other flat island nations, Brown told The Associated Press in an interview on Wednesday.
Coastal regions will be inundated; one-sixth of Bangladesh could be flooded, displacing a fourth of its 90 million people. A fifth of Egypt’s arable land in the Nile Delta would be flooded, cutting off its food supply, according to a joint UNEP and U.S. Environmental Protection Agency study.
″Ecological refugees will become a major concern, and what’s worse is you may find that people can move to drier ground, but the soils and the natural resources may not support life. Africa doesn’t have to worry about land, but would you want to live in the Sahara?″ he said."
metmike: Wrong with many predictions and totally wrong with all their extreme predictions, in many cases by a very wide margin for 33 years now. But they won the war on fossil fuels using CO2.
DISinformation (when you control the key players and global narrative) IS effective and does pay in many cases, like this one!
https://en.wikipedia.org/wiki/Pollution
Major forms of pollution include air pollution, light pollution, litter, noise pollution, plastic pollution, soil contamination, radioactive contamination, thermal pollution, visual pollution, and water pollution.
Many more threads on climate:
Climate Reality/Energy-7 new additions
https://www.marketforum.com/forum/topic/27864/
Scroll down for more, please!
Or up for previous posts.
#8. Fake Green Energy, especially wind turbines and electric cars(batteries).
This one is new to the list but the fastest growing with the greatest increase of damage to the planet of any of the other crisis's, with plans of this administration to ramp up this energy source from environmental hell.
Fake Inflation Reduction Act
Started by metmike - Aug. 18, 2022, 12:25 p.m
https://www.marketforum.com/forum/topic/88185/
https://www.masterresource.org/droz-john-awed/25-industrial-wind-energy-deceptions/
19 – The claim that wind energy is “green” or “environmentally friendly” is laugh-out-loud hilarious – except for the fact that the reality is not funny at all. Consider just one part of a turbine, the generator, which uses considerable rare earth elements (2000± pounds per MW).
The mining and processing of these metals has horrific environmental consequences that are unacknowledged and ignored by the wind industry and its environmental surrogates. For instance, just the rare earths of a typical 100 MW wind project would generate approximately:
+++++++++++++++++++++++++++=
Again, our modern society is based on abundant, reliable, affordable electric power. All these specious claims for wind energy are simply part of a long line of snake oil sales spiels – intended to fool the public, and to enable politicians to justify favoring special interests by enriching various rent-seekers (which will then return the favor via campaign contributions and other reelection support).
They get away with this scam primarily for three basic reasons.
1 – Wind proponents are not asked to independently PROVE the merits of their claims before (or after) their product is forced on the public.
2 – There is no penalty for making bogus assertions or dishonest claims about their product’s “benefits,” so each successive contention is more grandiose than the last.
3 – Promoting wind is a political agenda that is divorced from real science. A true scientific assessment is a comprehensive, objective evaluation with transparent real world data – not on carefully massaged computer models and slick advertising campaigns, which are the mainstay of anti-science evangelists promoting political agendas.
++++++++++++++++++++++++++++
These monstrosities that will be covering the natural landscapes of our country, on land and at sea in the next decade, already kill 1 million birds/bats each year and that number will be "soaring" higher.
They are actually boasting about doing something that is severely damaging nature and CREATING a major environmental problem to solve a NON problem(the current climate optimum for life) that features the best weather/climate on this greening planet(from the benificial gas, CO2) in the last 1,000 years...........the last time that it was this warm, during the Medieval Warm Period/Optimum.
Is beauty in the eye of the beholder? Yes, when it comes to pictures.
When it comes to putting up hundreds of thousands of these contraptions across our country, they destroy the view of the natural landscape and also the habitats of some creatures and take the lives of millions of birds/bats.......a few that are endangered.
They tear up the ground by mining of minerals to build them, then after 20-25 years, they fill up landfills as waste.
If this is a pretty picture to you........then you ain't lookin at nature you iz lookin at man destroying nature for crony capitalism! Greedy SOB's putting profits and fraudulent science ahead of authentic environmentalism.

metmike: The question is............who exactly is WINNING when massive wind turbine complexes are expanded across the country?
1. NOT wildlife......just the opposite
2. NOT the environment or the planet.......just the opposite
3. NOT people that need cheap dependable energy or that deserve the truth about energy and science......just the opposite.
4. YES to people in the business of wind turbines and those that get paid, including farmers who rent their land, including local communities and especially politicians that rake in millions from special interest groups.
Wind Energy Finance in the
United States: Current Practice
and Opportunities
https://www.nrel.gov/docs/fy17osti/68227.pdf
++++++++++++++++++++++++
https://cei.org/blog/wind-and-solar-tax-credits-special-interest-subsidies/
Yet during that period, taxpayers funded the PTC at $23/MWh (raised to $25/MWh in 2019). Thus, approximately 95 percent of the benefits of the wind PTC went directly to wind power companies, utilities, and financiers, while only about 5 percent of the benefits went to ratepayers.
+++++++++++++++++
Green Energy Scores a 76X ROI for Their Lobbying Efforts
https://www.transparencyusa.org/article/green-energy-lobby-roi
This article is Part 2 of a four-part series demonstrating how the money in a lobby sector can impact state politics and legislation. We’ve selected the Green Energy sector due to a resurgence of interest in a behind-the-scenes look at renewables following the 2021 snowstorms, but you can follow the money in any industry of interest that is spending lobbying dollars in Austin.
To see the first article in this series, read “How Big is the Green Energy Lobby?” here.
by Tracy Marshall
04/22/2021
The Real Political Powerhouse
Between 2006 and 2029, green energy companies doing business in Texas will rake in an estimated $36 billion in federal and state subsidies.
Conversations about money in politics tend to focus on wealthy donors, big corporations, and powerful political action committees. Scant attention is paid to the role of lobbying. But the numbers show that lobbying is actually the financial powerhouse in American politics.
Our site includes a list of lobbyists in Texas, whose interests they’re representing, and how much they’re being paid, but to get a complete picture of the way money influences lawmakers, other means of influence should be considered.
Businesses, industry groups, and government organizations hire lobbyists to influence legislators in Austin, often by wining and dining them or providing tickets to exclusive events.
Those same organizations sometimes donate to those same lawmakers through their PACs. Executives in those corporations may make individual donations to a politician’s campaign account.
In return, those organizations may get favorable laws, beneficial regulatory positions, government payouts, tax breaks, etc. Known as crony capitalism, it is a distortion of the free market. Practiced by Republicans and Democrats alike, it ultimately creates an uneven playing field benefiting those who are willing to to pay for access and favor from those in power.
While many individuals and organizations play this game, we are currently doing a case study of the lobbying efforts and other monies spent by the green energy industry in Texas. Since the record breaking winter storm which left millions of Texans without power and more than 200 dead, questions and accusations have been swirling about how so much of Texas’ energy grid — at least 25 percent — came to rely on green energy. Last week we provided a list of green energy-related entities in Texas and the money they have spent to lobby Austin lawmakers.
Since 2015, as much as $71.7 million has been spent on lobbying by companies whose primary source of income is renewable energy, including solar, wind and nuclear. That number likely climbs much higher if other companies with a strong interest in green energy are included — companies like Shell Oil and AT&T, who have invested billions in green energy and have a strong lobbying presence in Austin. So what are lobbyist clients getting for all that money spent? Quite a bit, actually.
According to records compiled by the Texas Comptroller’s office and a 2019 study by the Texas Public Policy Foundation, the total cost to taxpayers and consumers for the myriad of subsidies going to green energy operators in Texas from 2006 to 2029 will be $36 billion.
Transparency USA has catalogued up to $71.7 million invested in lobbying by Texas green energy companies since 2015. (That number only includes lobbying of state-level lawmakers, not any lobbying efforts in D.C.) In return, green energy companies have received and will continue to receive subsidies from the Texas government of almost $18 billion — that’s recouping the money they will have spent between 2006 and 2029 about 76 times over.
The available lobbying numbers only cover about seven out of those 23 years. To get a more accurate comparison, we extrapolated those same lobbying numbers over the entire 2006-2029 period where the $18 billion in state and local subsidies would be received. The green energy lobby continues to grow in each available cycle, but there are not enough data points to assume an accurate growth rate. Instead, we’re applying the same rate of investment in lobbying from the known seven-year stretch. Using those numbers as a guide, we estimate a $235 million investment by renewables companies operating in Texas.
At around 76 times the sector’s reportable investment in lobbying Austin lawmakers, it’s an incredible return on investment. And even if our estimate of the lobbying money that will be spent in Texas over the entire period turns out to be on the low end, it’s certainly not going to be off by billions. It’s absolutely going to be money well spent for companies in the green energy sector.
Bottom line: it can pay off — big time — to be in the lobbying game or the fake green/environmental energy business. What private market can compete with that return on investment?
metmike: Now you know!
This one is also new to this thread's list.
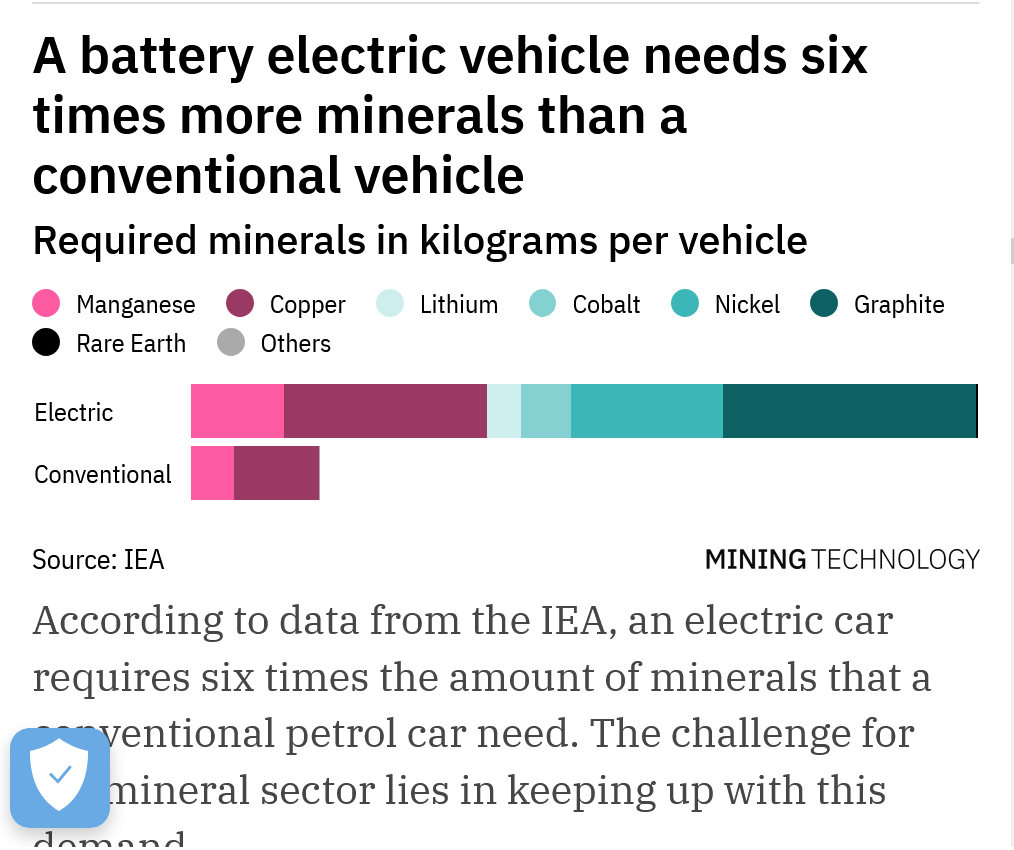
Manufacturing batteries for electric cars:
Today, a typical EV battery weighs one thousand pounds. It contains twenty-five pounds of lithium, sixty pounds of nickel, 44 pounds of manganese, 30 pounds cobalt, 200 pounds of copper, and 400 pounds of aluminium, steel, and plastic. Inside are over 6,000 individual lithium-ion cells.
It should concern you that all those toxic components come from mining. For instance, to manufacture each EV auto battery, you must process 25,000 pounds of brine for the lithium, 30,000 pounds of ore for the cobalt, 5,000 pounds of ore for the nickel, and 25,000 pounds of ore for copper. All told, you dig up 500,000 pounds of the earth’s crust for just one battery.
The sales of electric cars are booming, but the rising demand for transition minerals will pose a challenge for the mining industry.
https://www.mining-technology.com/analysis/concerns-for-mineral-supply-chain-amid-booming-ev-sales/
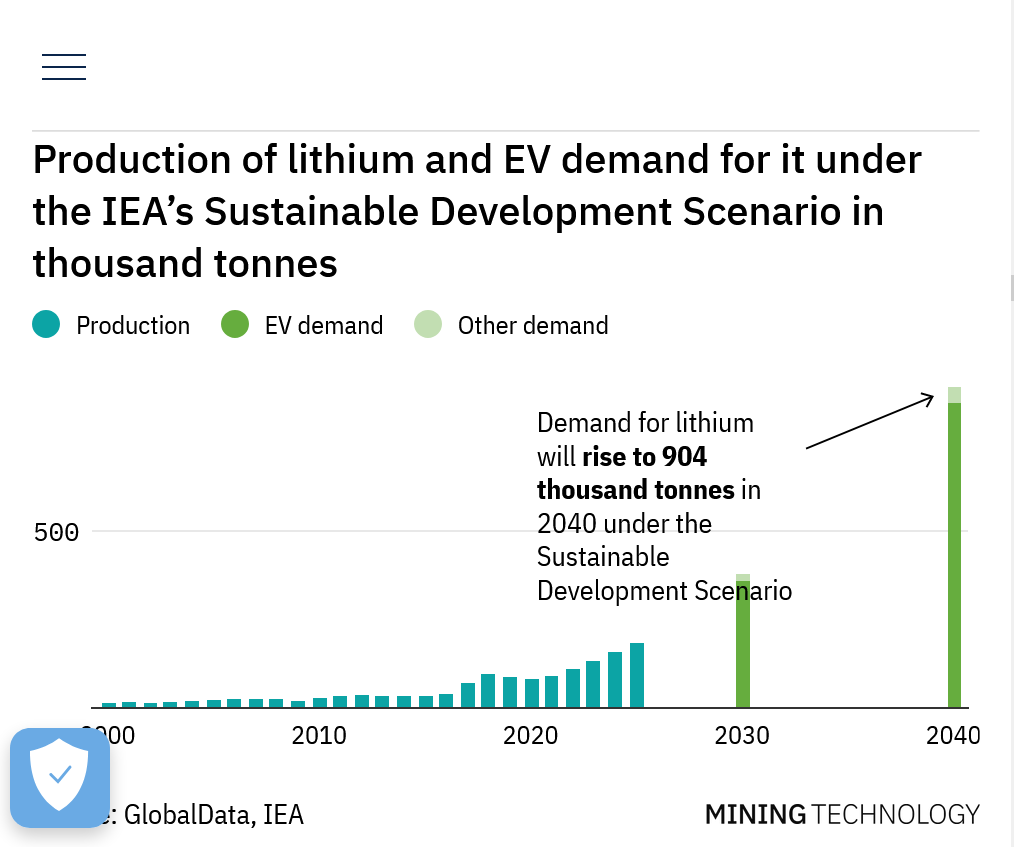
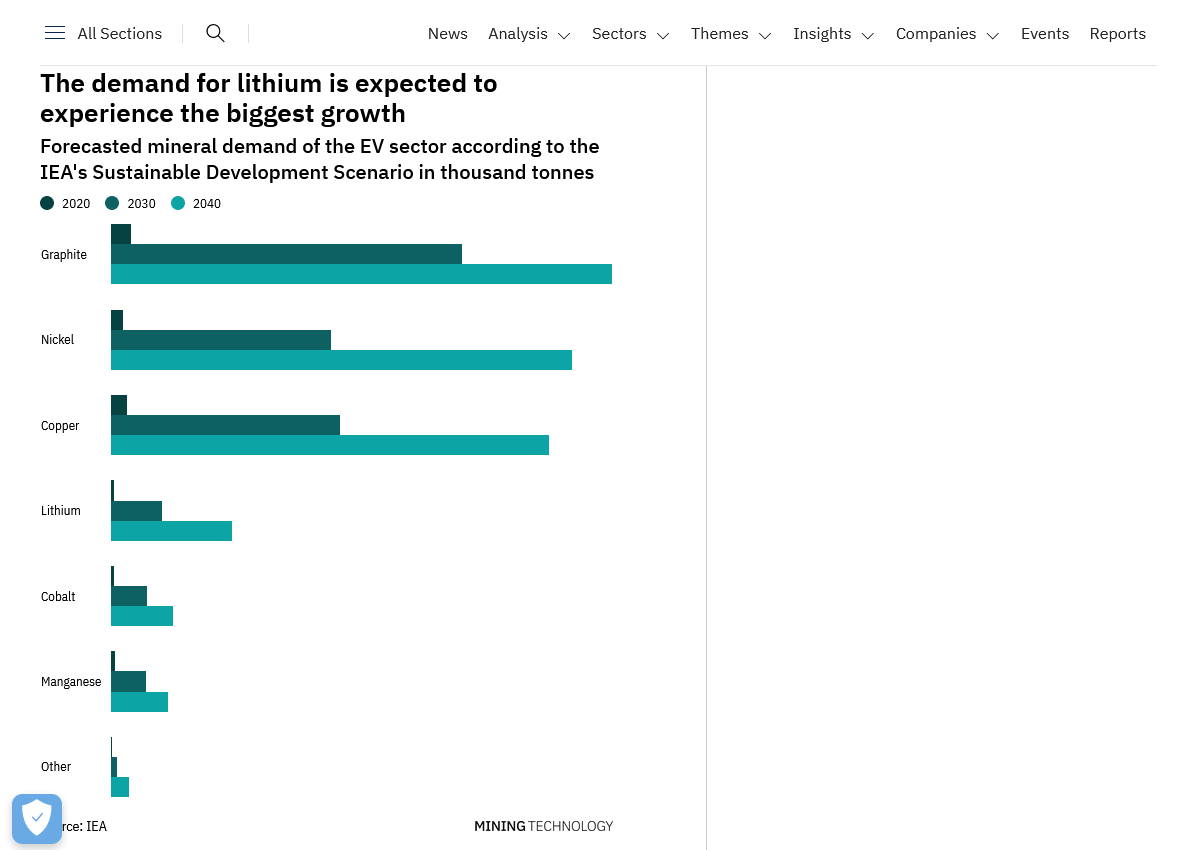
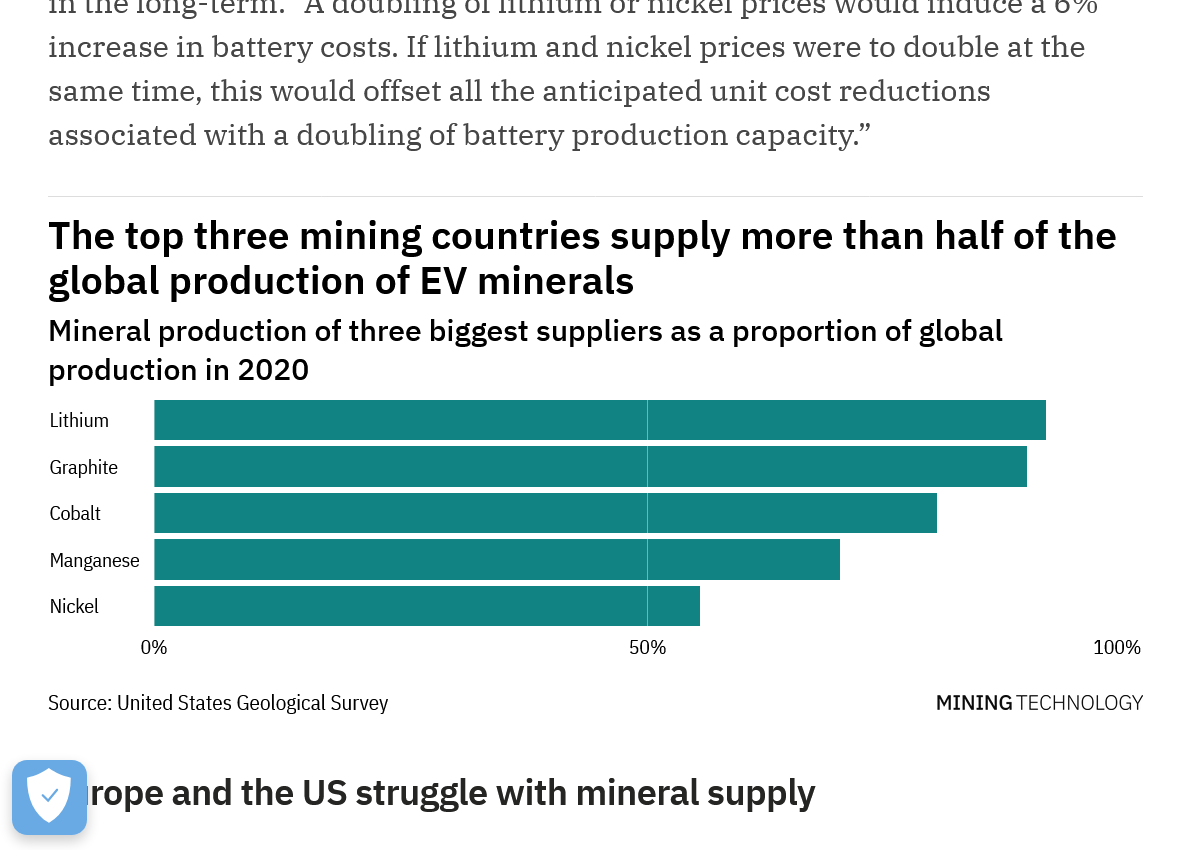
Another challenge for the future supply chain is that unlike some fossil fuels, many of the minerals essential for EVs are produced in just a handful of countries. Over half of the supply of minerals needed for EV batteries comes from the top three producing countries.
In 2020, Australia was responsible for 48% of global lithium production. For graphite, China is the world’s main supplier, with nearly 79% of global production originating from the country. In the same year, the Democratic Republic of the Congo (DRC) supplied 69% of global cobalt.
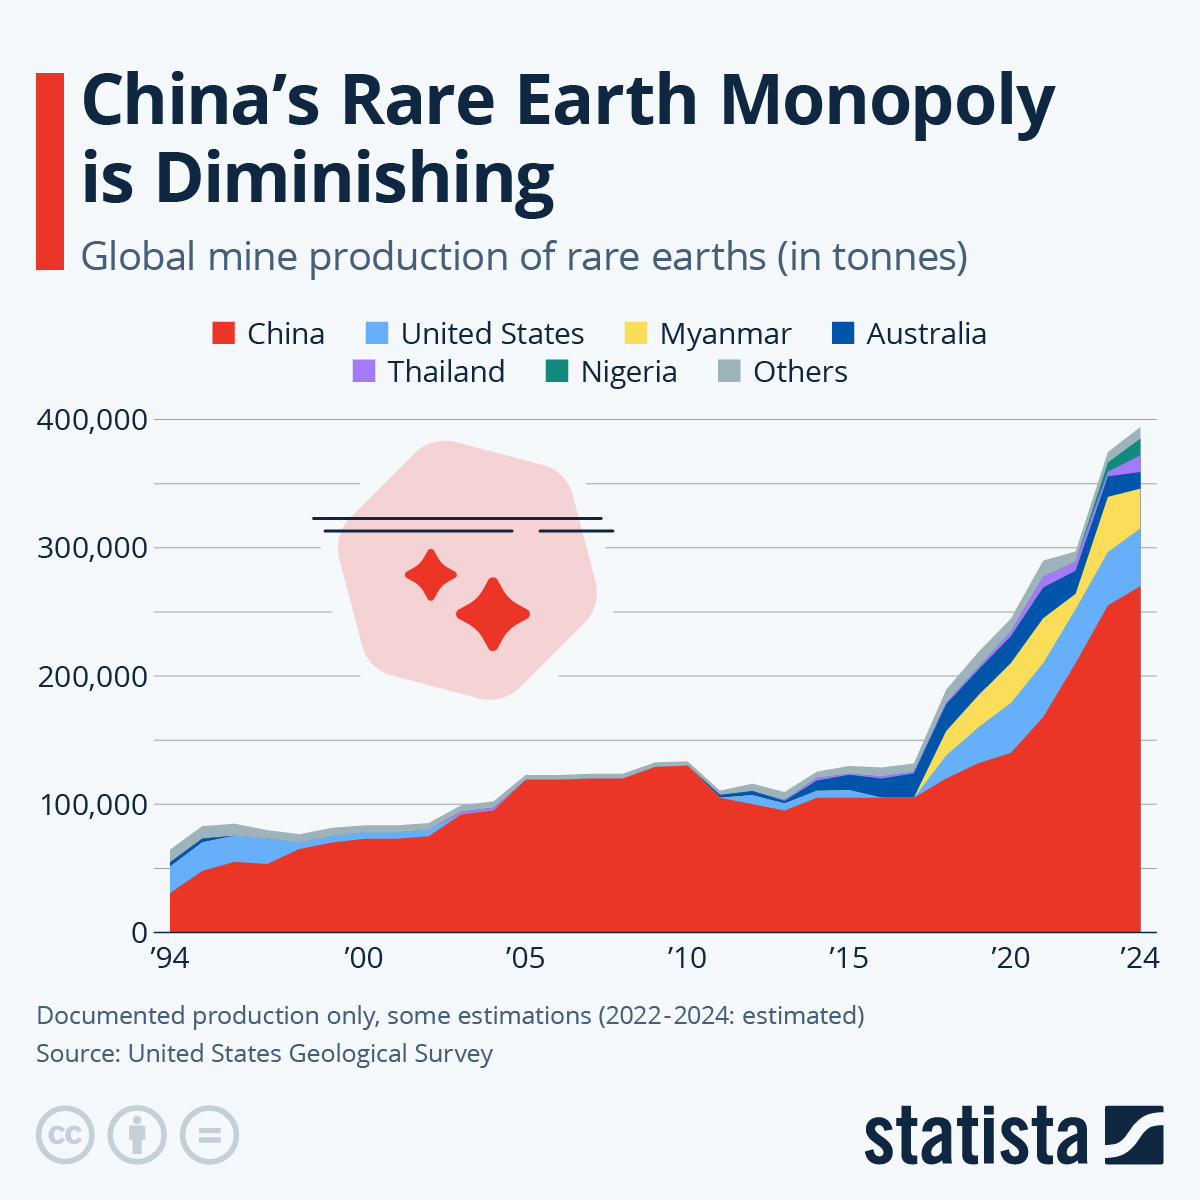
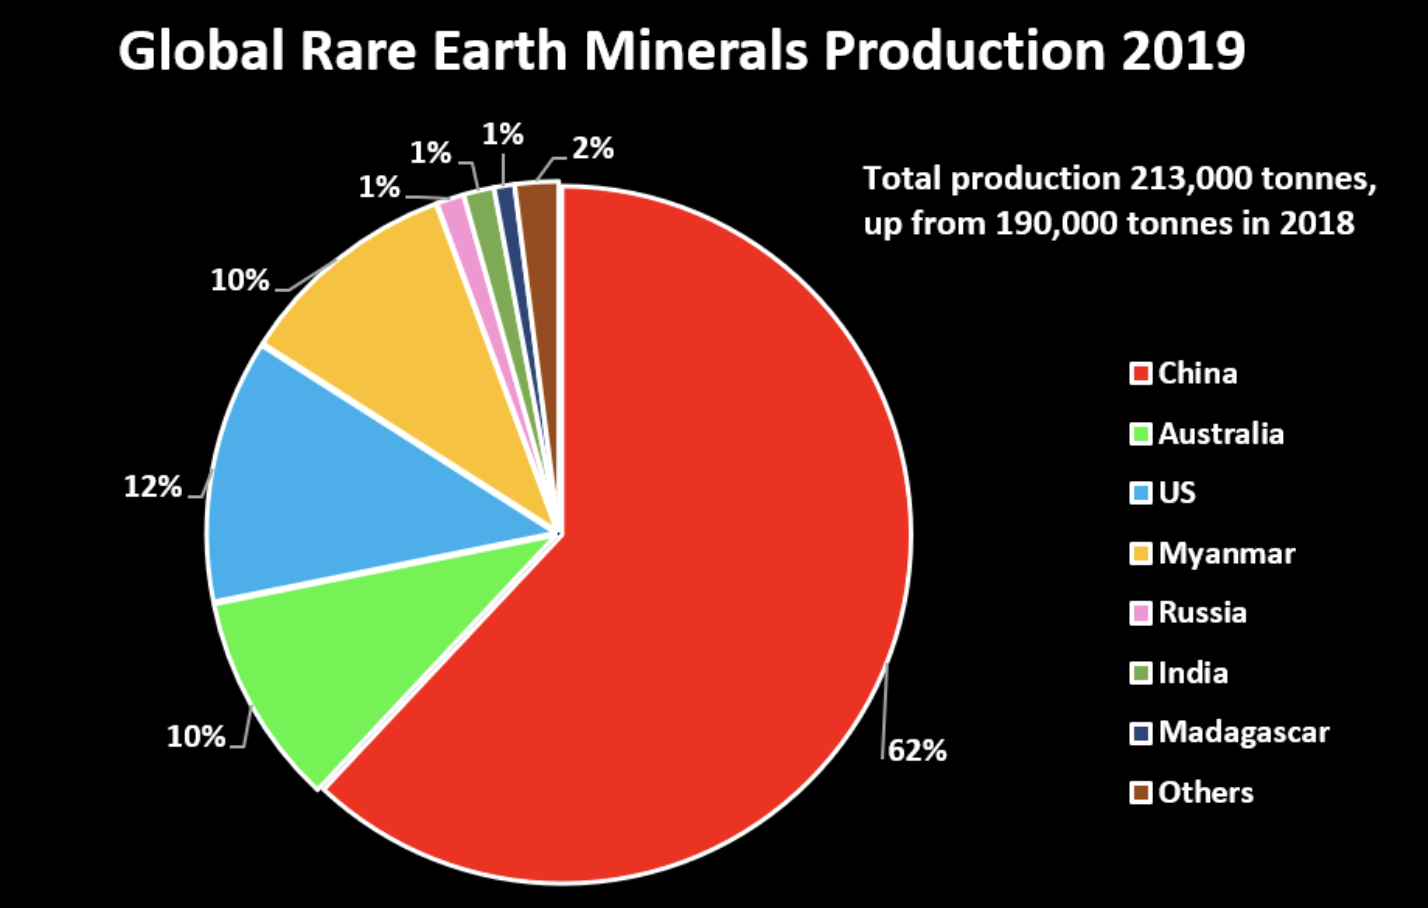
With regards to rare earth metals, China has most of them!
https://www.statista.com/chart/18278/global-rare-earth-production/
https://geology.com/articles/rare-earth-elements/
Note the amount of reserves below:
World Mine Production and Reserves | ||
| Country | Production (Metric Tons) | Reserves (Metric Tons) |
| United States | 38,000 | 1,500,000 |
| Australia | 17,000 | 4,100,000 |
| Brazil | 1,000 | 21,000,000 |
| Burma | 30,000 | not available |
| Burundi | 500 | not available |
| Canada | -- | 830,000 |
| China | 140,000 | 44,000,000 |
| Greenland | -- | 1,500,000 |
| India | 3,000 | 6,900,000 |
| Madagascar | 8,000 | not available |
| Russia | 2,700 | 12,000,000 |
| South Africa | -- | 790,000 |
| Tanzania | -- | 890,000 |
| Thailand | 2,000 | not available |
| Vietnam | 1,000 | 22,000,000 |
| Other Countries | 100 | 310,000 |
| World total (rounded) | 240,000 | |
+++++++++++++
China Dominates the Rare Earths Supply Chain
https://www.weforum.org/agenda/2018/06/90-of-plastic-polluting-our-oceans-comes-from-just-10-rivers/

The Indian government has vowed to clean up the sacred river Ganges. Image: REUTERS/Rupak De Chowdhuri
BACK TO OFFSHORE WIND POWER........
Started by 12345 - March 25, 2024, 5:13 p.m.
https://www.marketforum.com/forum/topic/102805/
| Windturbines killing whales too 36 responses | Started by metmike - Jan. 13, 2023, 10:07 p.m. https://www.marketforum.com/forum/topic/92174/ |
The Water Crisis
Started by metmike - March 29, 2024, 10:21 a.m.
ANOTHER SPECTACULAR EV ROAD TRIP
28 responses
Started by 12345 - Jan. 5, 2024, 2:12 p.m.
Death by GREENING!
44 responses |
Started by metmike - May 11, 2021, 2:31 p.m.
https://www.marketforum.com/forum/topic/69258/
National Climate Emergency??????????!!!!!!!!!!! 42 responses |
Started by 12345 - April 24, 2024, 8:25 p.m.
Microplastics are harmful to human health!
Started by metmike - Dec. 24, 2024, 10:41 a.m.
Green energy?????
List of wind farms in the United States
https://en.wikipedia.org/wiki/List_of_wind_farms_in_the_United_States


![r/dataisbeautiful - [OC] wind turbine density across the US](https://preview.redd.it/wind-turbine-density-across-the-us-v0-kkpu0p2ikfcb1.jpg?width=640&crop=smart&auto=webp&s=26b9d22c051ef1a871f369175f0c07f4a05adb84)
Or Green energy!!!!!
https://www.nasa.gov/technology/carbon-dioxide-fertilization-greening-earth-study-finds/
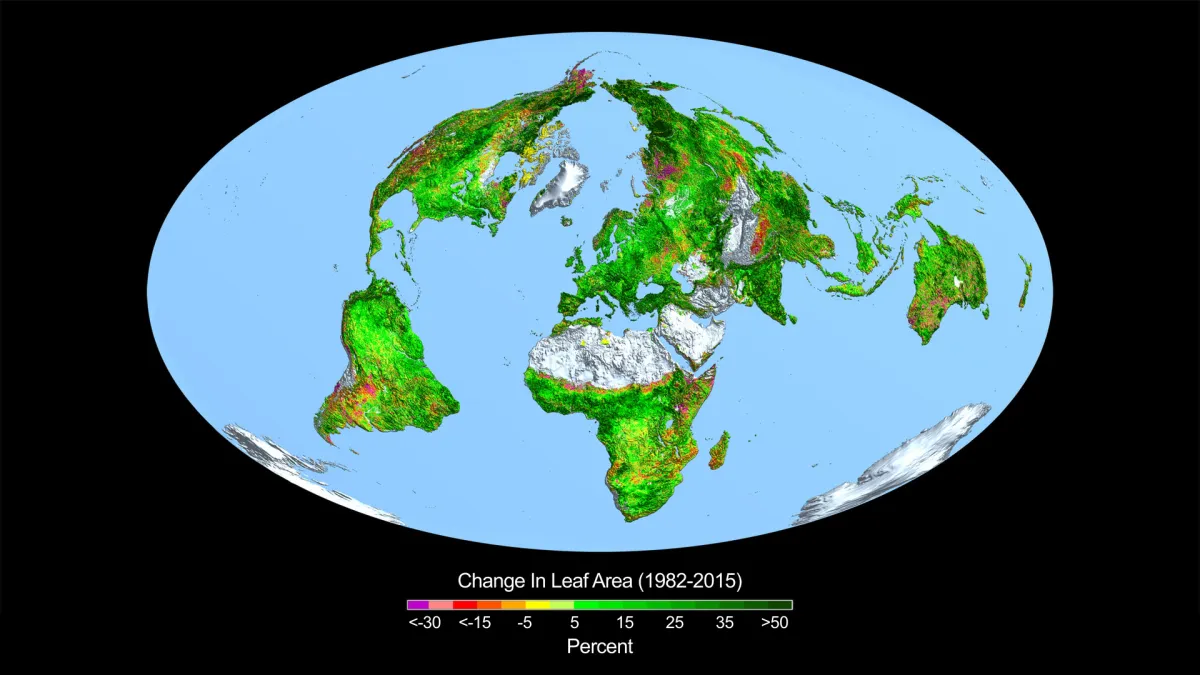
https://e360.yale.edu/digest/carbon-dioxide-climate-change-bigger-trees
https://phys.org/news/2013-07-greening-co2.html

Satellite data shows the per cent amount that foliage cover has changed around the world from 1982 to 2010.
Increased levels of carbon dioxide (CO2) have helped boost green foliage across the world's arid regions over the past 30 years through a process called CO2 fertilisation, according to CSIRO research.