Get all the comprehensive weather here:
https://www.marketforum.com/forum/topic/83844/
++++++++++++
Previous thread:
Rain/Drought thread May 2026
Started by metmike - May 4, 2026, 9:44 p.m.
https://www.marketforum.com/forum/topic/120018/
The way to use these maps below is to just scroll thru them to see the changes with time. Weather markets trade on CHANGES compared to the previous weather forecasts. It also helps to forecast by identifying TRENDS!
The last map in the series ALWAYS gets the most weighting. Compare it with previous maps above it for perspective!
Do consider that as the calendar page turns, rains that just fell will come out of the updated forecast as another day is added at the end of the forecast. A huge rain that just fell(that was in the forecast yesterday) can make the latest forecast look much drier than it really is.
This WEEK 1 map from the NWS is updated 2 times a day, automatically:
June 1st: Rains in the Plains progress into the western cornbelt and CCB but erode/dry up as they track northeast.
June 2nd: Just like yesterday. Rains in the Plains/WCB dry up as they head east.
June 3rd: Same as before. WEEK 1 Rains in the Plains/WCB dry up in IL/IN/OH.
June 4: Big rains WCB in week 1 that make it into northern I//IN/OH. MUCH WETTER than yesterday!
JUNE 4 PM: Big Week 1 rains dry up in the ECB.
June 5: BIG rains spread into the Central and Eastern Cornbelt after already hitting the WCB!!!
June 6/7: Widespread week 1 rains.
June 8: Widespread week 1 rains. HEAVY in CCB!
June 8, PM update: Rains dry up a bit in the ECB.
June 9: More, almost all beneficial rains (CCB) that dry up in the ECB(which needs much more)
June 10 More rain CCB and South that stalls out in those locations instead of progressing across the entire belt.
June 11: Heaviest rains deep South! Moderate rains CCB. Less west and east.
June 12: Heaviest rain Southern Cornbelt. Even heavier deep south. New drying pattern N.Plains to Northwest belt.
June 13: More rain the farther South we go. Mostly dry in the Plains.
June 14: Excessive rain western Gulf states!!! Some unwanted rain(not excessive) in places of the CCB. BENEFICIAL rains in the ECB. Not enough rains in the Upper Midwest but with COOL temps and sunshine, along with the beneficial higher CO2 still good growing weather for crops.
June 15: EXCESSIVE RAINS western Gulf states(10 inches?) !!! Heavy rains parts of the central and southern Cornbelt, some places too much, most places beneficial. Dry-ish Northern Plains/Upper Midwest but VERY COOL.
June 16: EXCESSIVE RAINS along the western Gulf Coast( some in cotton country). Heavy but mostly beneficial rains CCB and ECB(small % will have TOO MUCH). Not dry anywhere.
June 17: Heaviest rains along the Gulf Coast now(remnants of Arthur). Lightest rain Upper Midwest. Most of the Midwest rain will see beneficial rain but not in locals that saw recent excessive rain.
June 18: Huge shift west in heaviest (welcome) rains to central/southern Plains. Lesser amounts headed east where they will still be beneficial in the ECB. Remnants of TS Arthur along the central Gulf Coast.
June 19: Widespread mostly beneficial rain southern 2/3rds. A bit dry Upper Midwest But cool, so no stress.
June 20: Tons of widespread but not excessive rain except for the Upper Midwest which is cool, so not being hurt.
June 21: Added new map below. This is a threat that lasts 1 day from a progressive pattern. The next chance of rain in that area will be at the end of the week.
June 22: Need to start a new thread. This much rain without excessive heat and low risk for excessive rains is always going to be bearish after the crop has been planted.
http://www.wpc.ncep.noaa.govcdx /qpf/p168i.gif?1530796126

Excessive rain threat.
Scattered areas of flash flooding are possible in the red zone. Locally 6 inches of rain can't be ruled out in a few spots. Some of these areas were hit with excessive rains earlier this month as noted by tjc here.
https://www.wpc.ncep.noaa.gov/qpf/excess_rain.shtml
https://www.wpc.ncep.noaa.gov/discussions/hpcdiscussions.php?disc=qpferd
Current Day 1 Forecast

+++++++++++++++++++++++++++++++
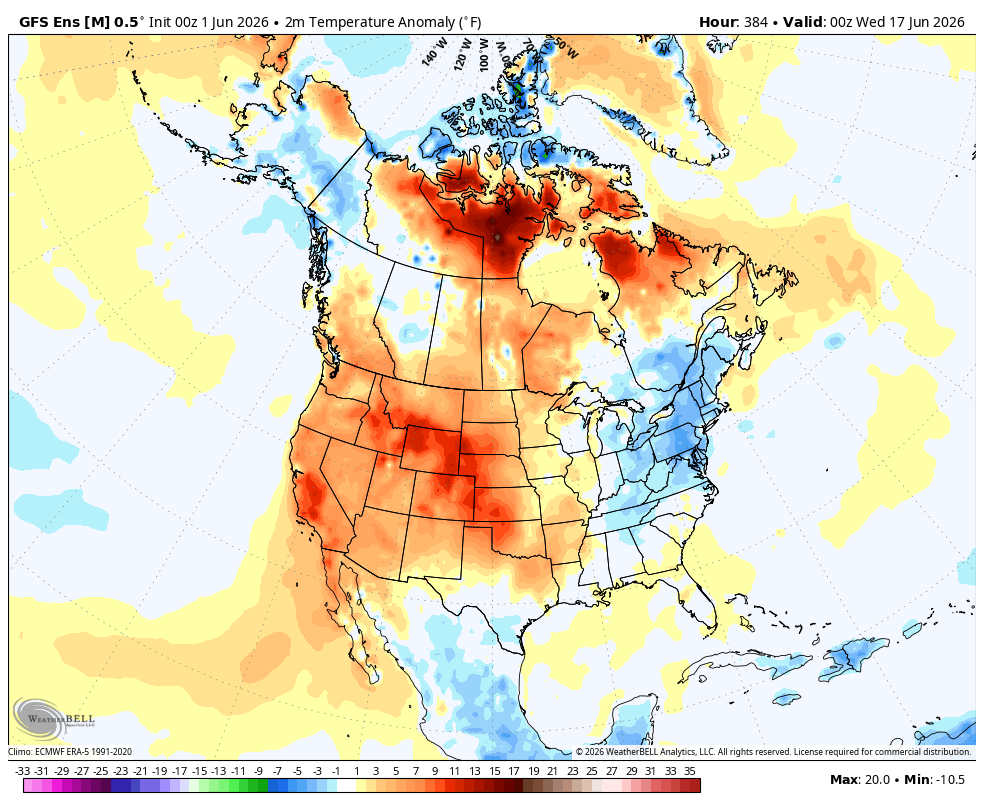
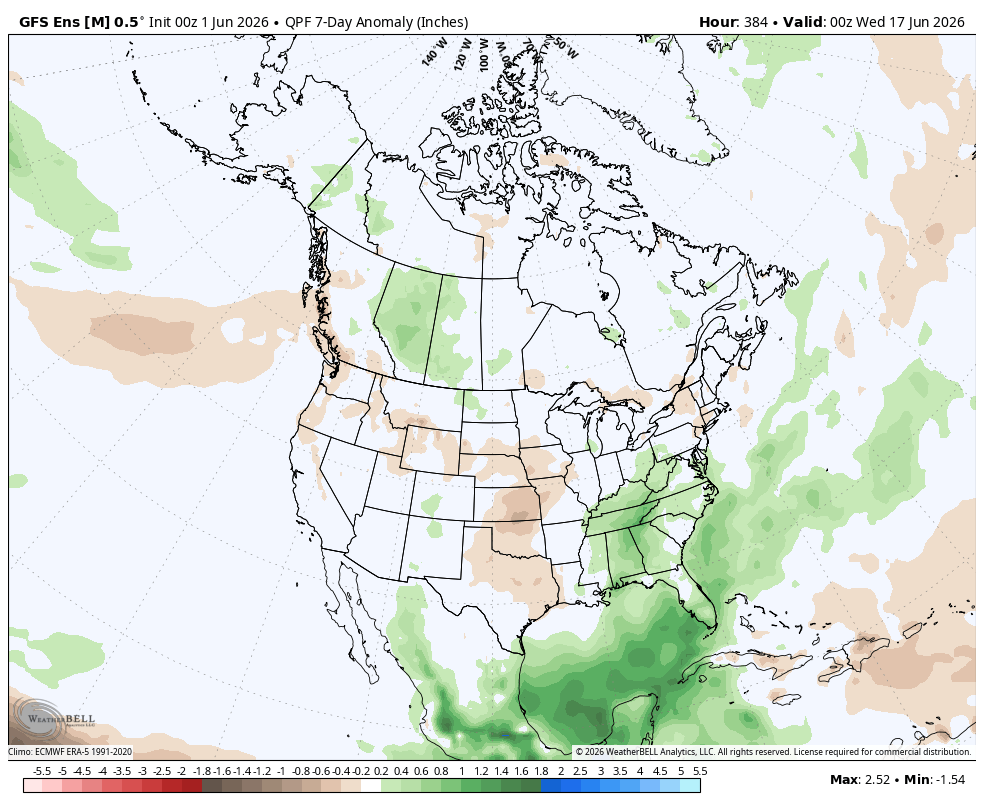
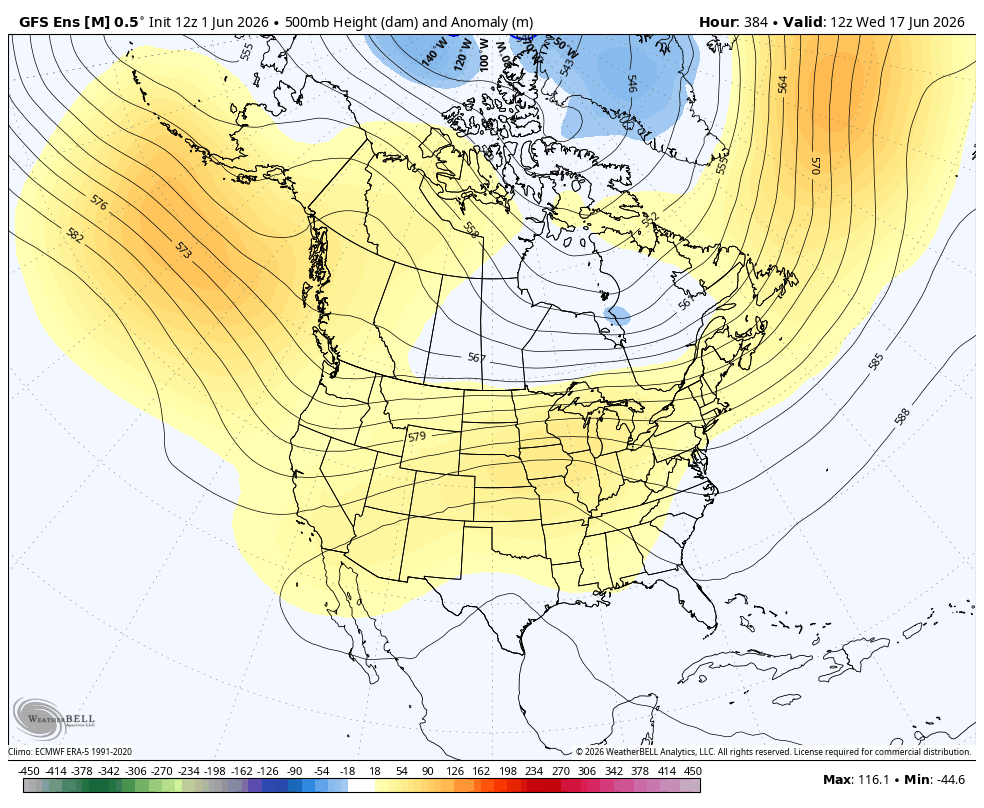
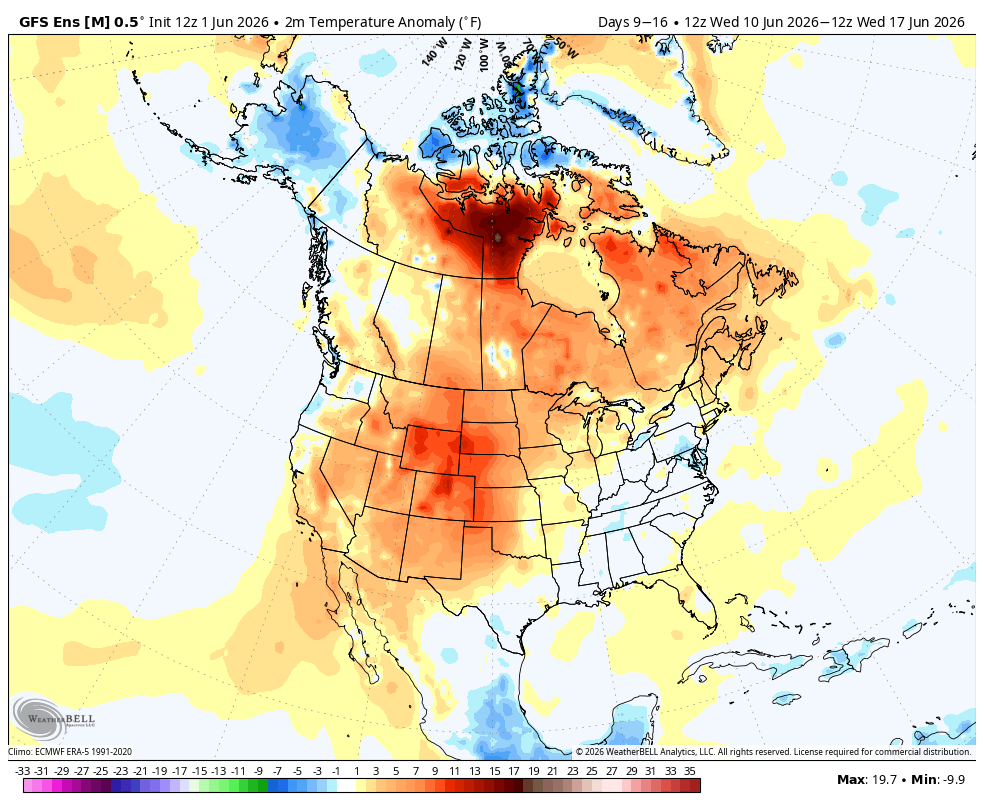
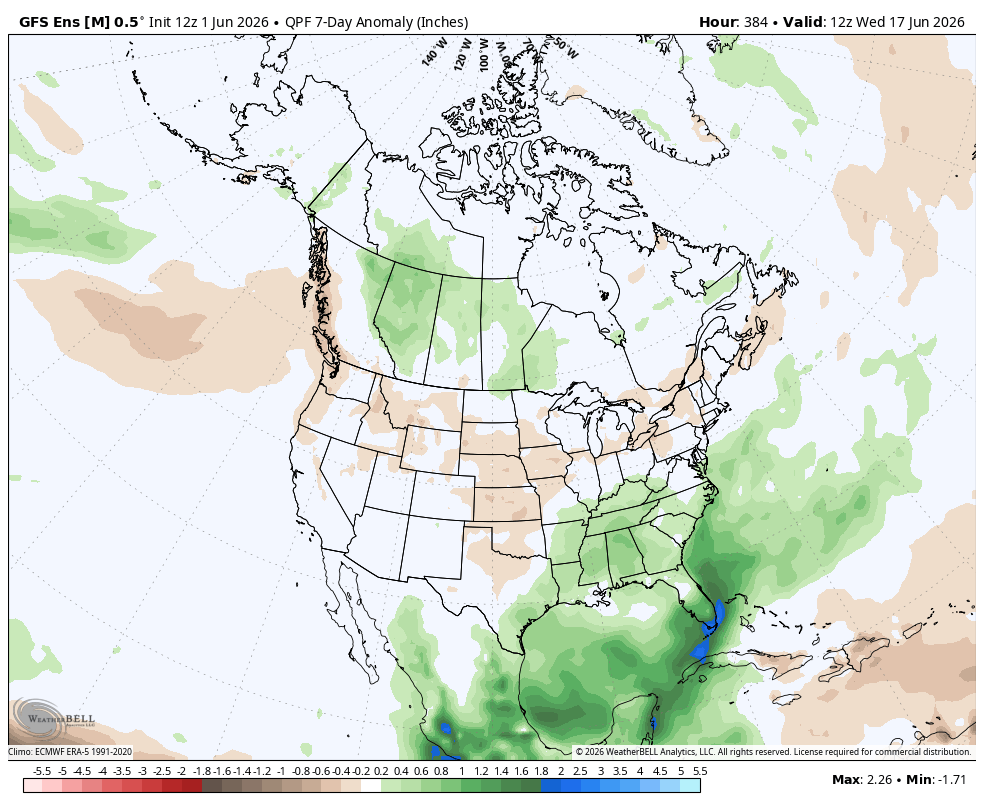
Below is the GEFS solution, Day 16- 500 mb map+ week 2 temps/rain anomalies.
June 1: 0z run: June 15 heat ridge West to Plains. Cool Northeast. Dry Plains to WCB.
June 1: 12z run: More bullish than European model below!
June 1: 18z Run: I included a different product for map #2 that shows the CHANGE in heights in the new 18z GEFS compared to the previous 12z run. It has shifted towards the EE model now! Still dry in the WCB but MUCH LESS bullish with the heat ridge is now GONE in the Midwest.
June 2: 6z: Back to a bit warmer/drier compared to the previous solutions and more bullish. This is in contrast to the BEARISH EE below.
June 2 12z: The GEFS continues to be MUCH more bullish than the EE below.
June 3 6z: Weak trough? A tad MORE rain than yesterday. Still less bearish than the EE below.
June 4: 6z run: MUCH wetter week 2.
June 6: 12z run: MUCH COOLER and wetter too. As bearish as it gets in June!!!
June 8: 6z run: Still cool and wet in week 2. Drying/warming-Plains at the end of the period????
June 10 6z run: Last of the cool air with a new MUCH hotter pattern with heat kicking in at the end of the period and progressing from west to east.
June 11: 6Z: Cool air and rains linger an extra day in week 2.
June 13 12z: Cool air keeps lingering. Hot West to Plains. Still bearish.
June 14-18z run: Heat ridge starting to build in towards the end of week 2, cutting back on rain amounts.
June 15-6Z: Heat ridge building farther east than previous runs. More potential heat. Different than EE below.
June 16-18z: Heat ridge building, rains continue widespread
June 18-0Z: Impressive heat ridge building into the S.Plains. Starting to shut down rains underneath the center.


++++++++++++++++++++++++++++++++++
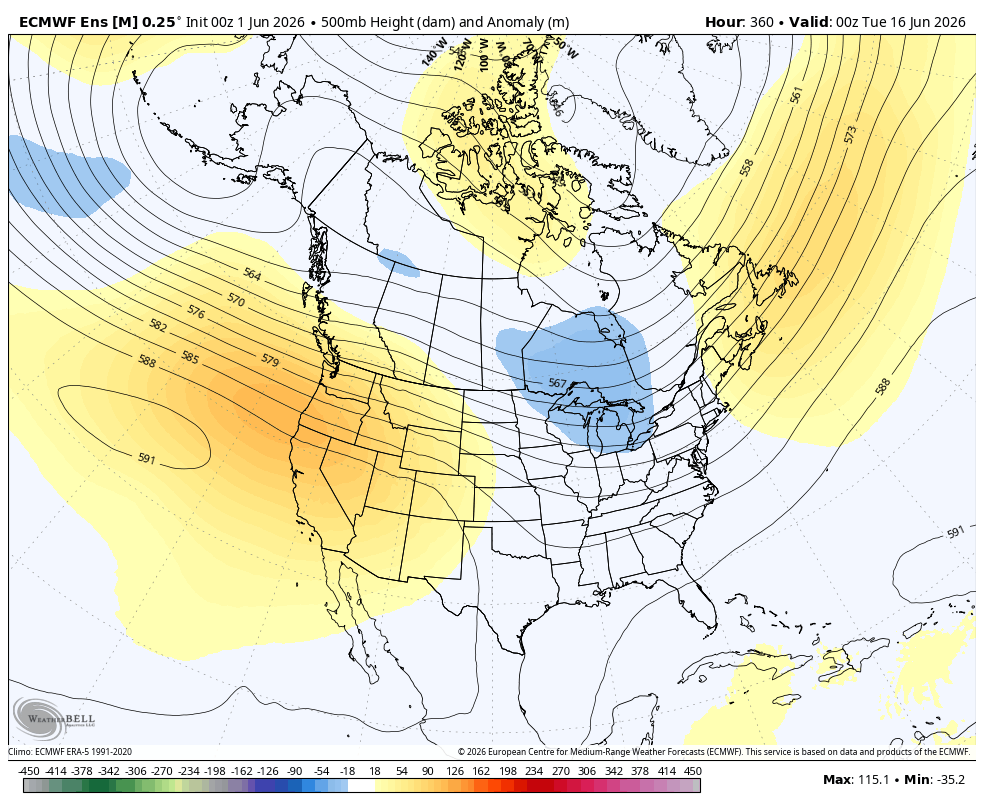
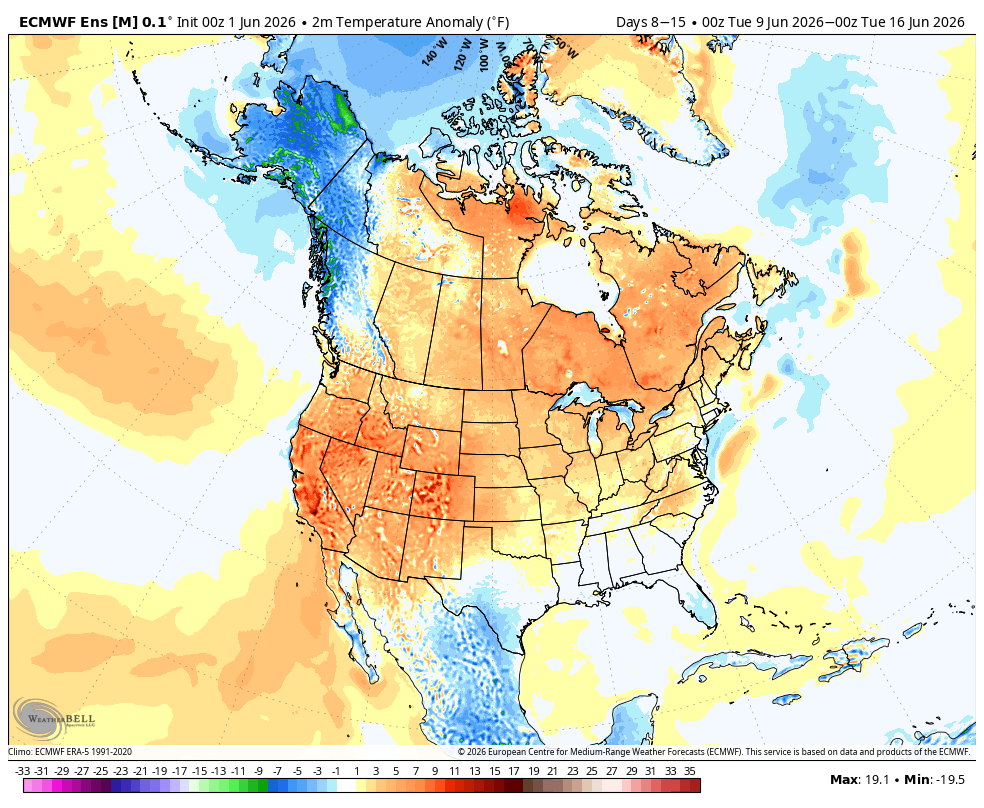
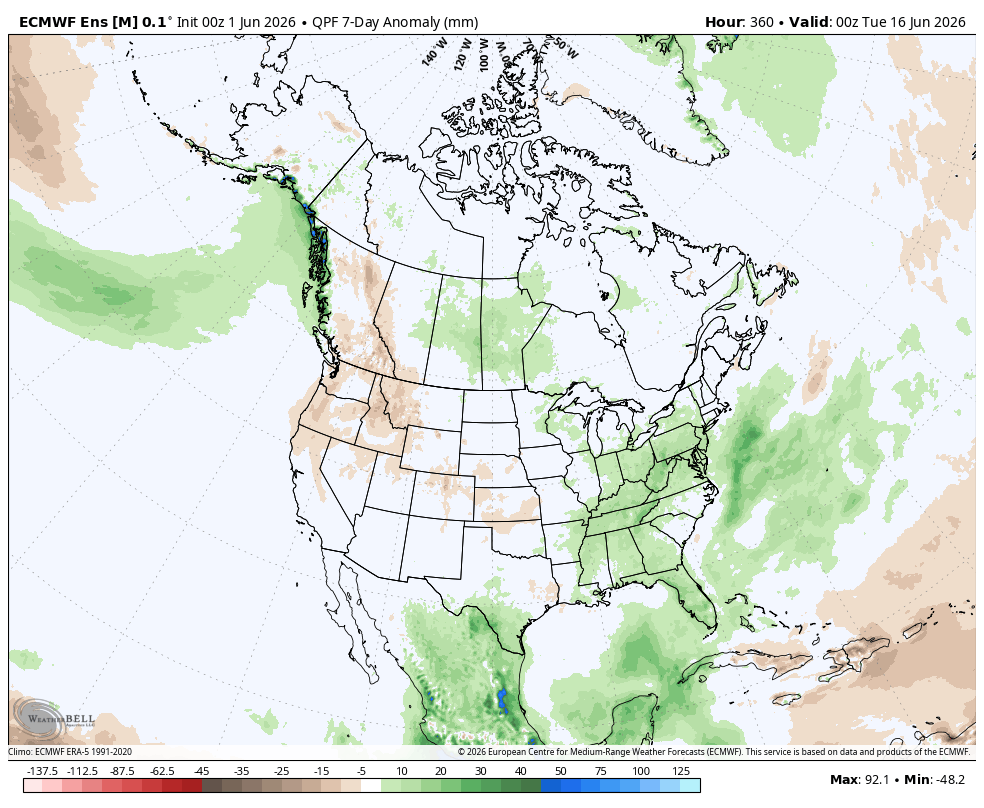
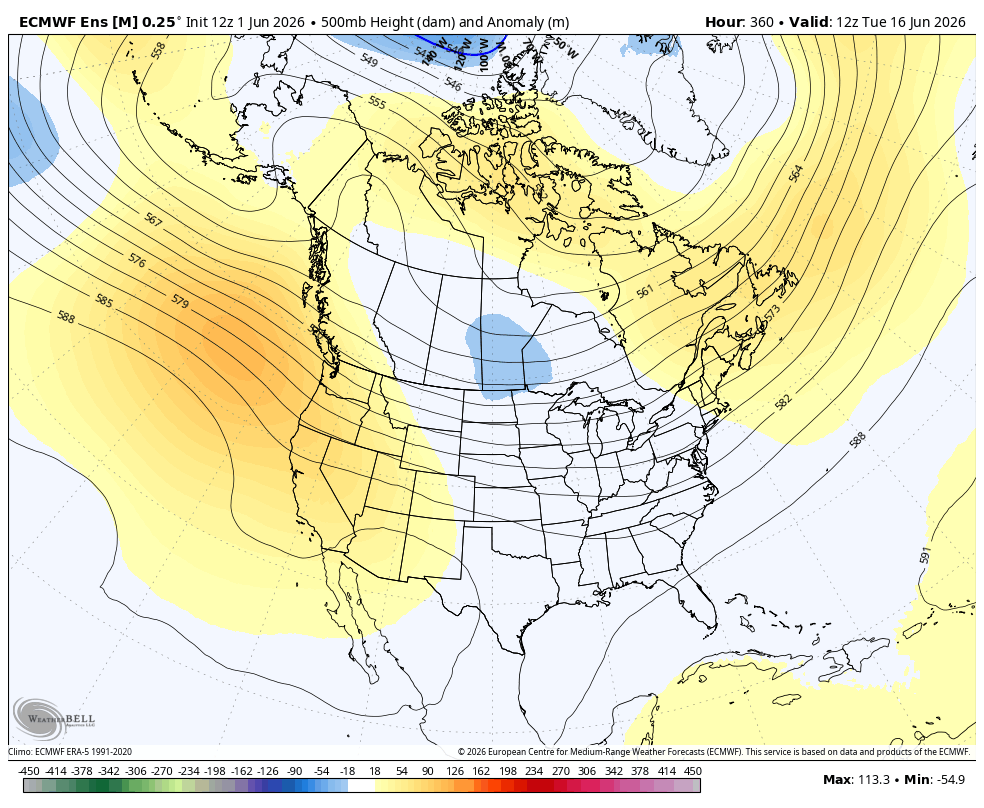
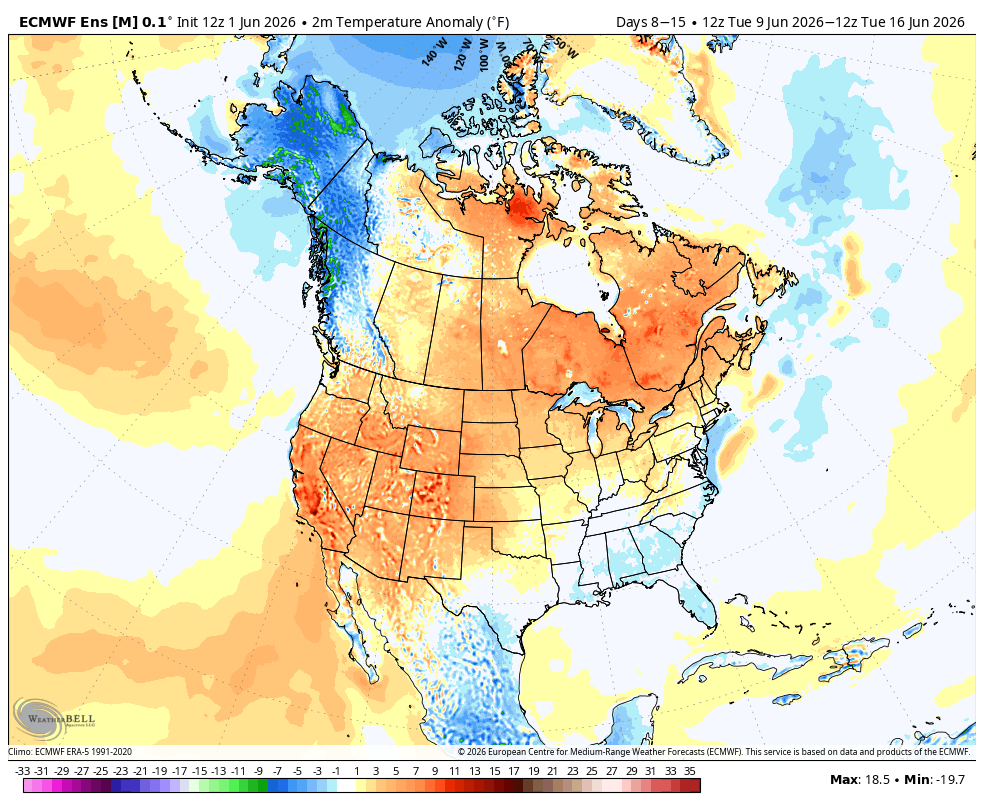
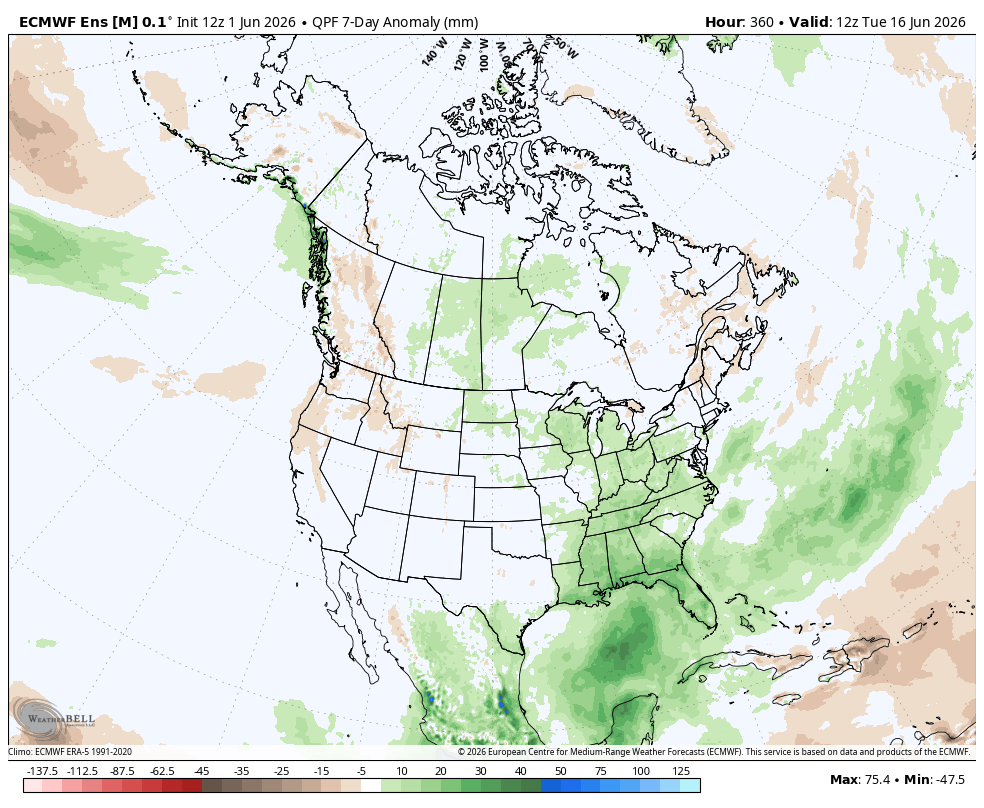
Below is the European Ensemble model. Day 15- 500 mb map+ week 2 temps/rain anomalies.
1. June 1: 0Z run: June 15 heat ridge backs west!!! Great Lakes trough.
2. June 1 12z run. MORE bearish with Midwest trough and rain! (out after the close)
3. June 2, 0z run: More bearish than GEFS but not AS bearish as yesterday. The heat ridge is dead which is the bearish part but temps will still be above and rains around average.
June 2, 12z: Continues much more bearish than the GEFS! Weak troughing in the Midwest with decent rain chances along with some modest heat.
June 3: Even MORE BEARISH! COOLER and WETTER. Upper level trough.
June 4: Still bearish but with a tad less rain.
June 6/7:, : It doesn't get more BEARISH than this in June!! Wet and cool almost everywhere.
June: 8: 0z: Still very bearish with below temps everywhere and above rains, more in the South.
June 10: 0Z Enormous change from previous runs late in the period as the predicted heat ridge in week 3 is now part of week 2. Temperatures go from widespread below previously to ABOVE spreading from west to east. Ring of fire rains continue around the periphery of the heat ridge in much of the Cornbelt.
June 11: 0Z run. Cool temps/rain for an extra day vs yesterday before the HEAT DOME builds into the S.Plains.
June 13: 12z: MUCH cooler!!!
June 14-12Z: Cool air continues to linger along with rain chances in week 2. Continued bearish. Upper level ridge possibly in the Southeast. That's potentially much different.
June 15-0Z: Reinforcement of cool, wettish(not excessive) forecast for the Midwest.
June 16-12z: Ridge building but rains continue on top and around it that prevents heat in the Midwest.
June 18: 0z: Impressive ridge building but ring of fire rains around the periphery keep the Cornbelt with rains.


++++++++++++++++++++++++
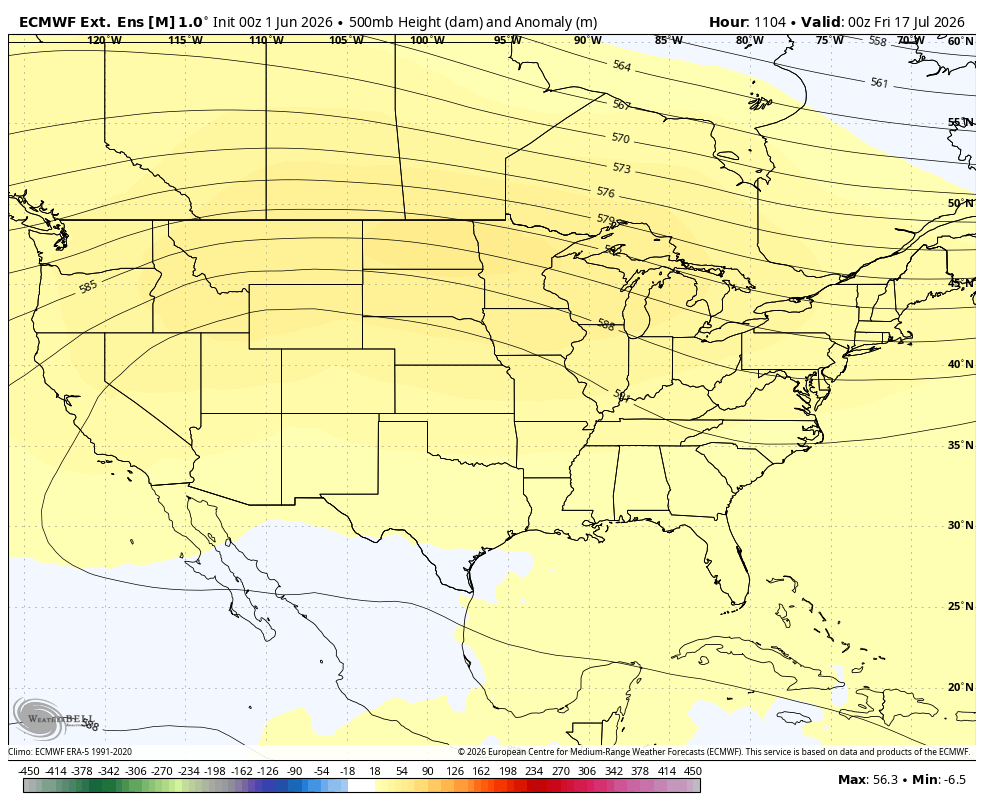
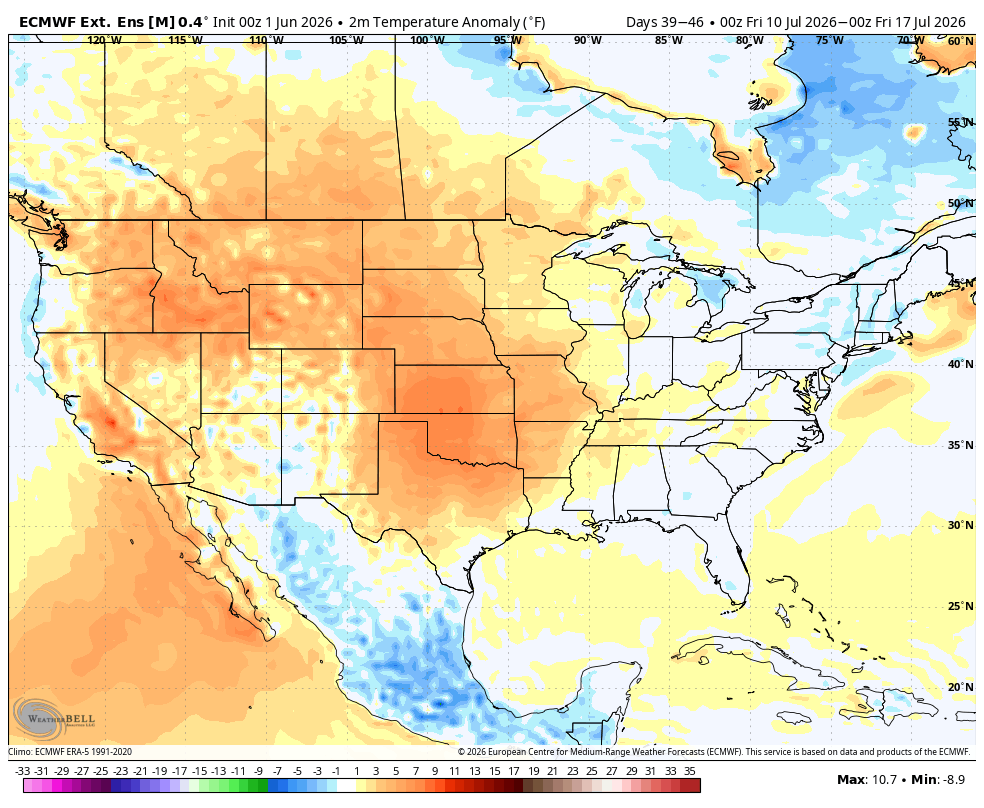
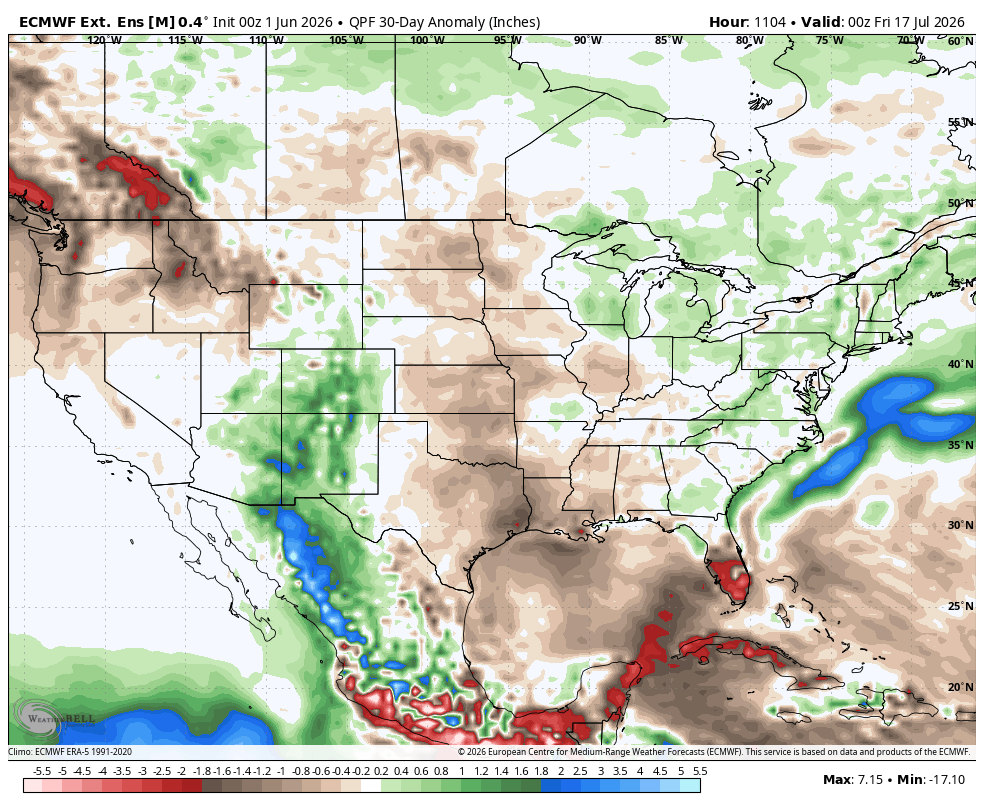
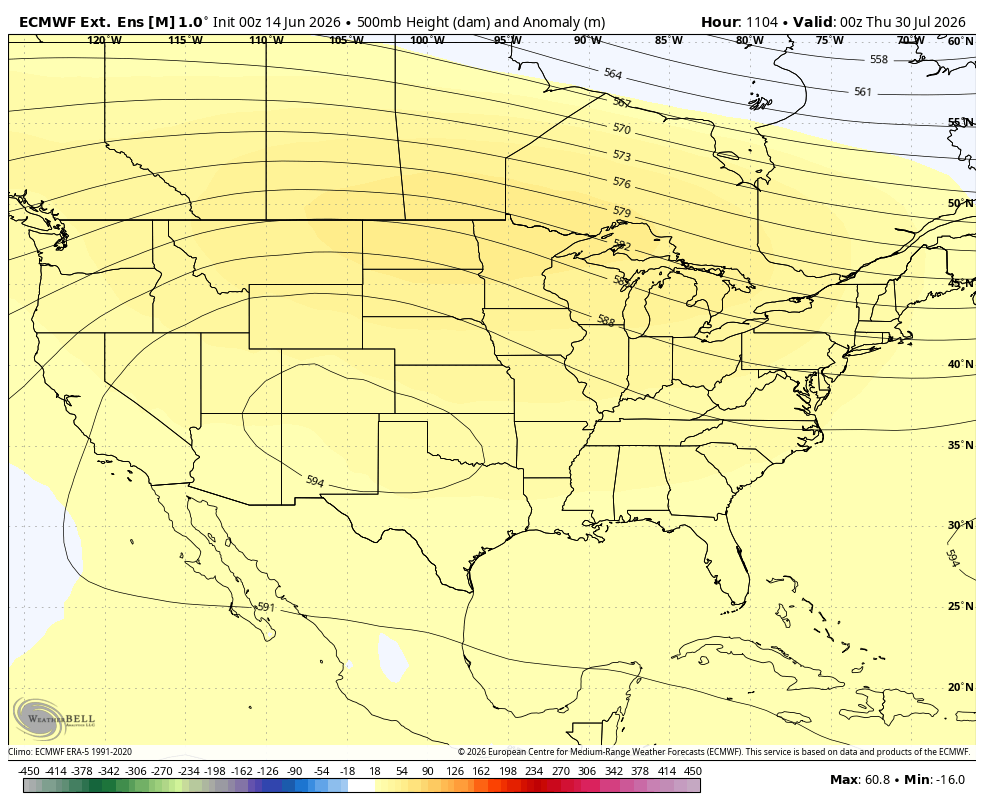
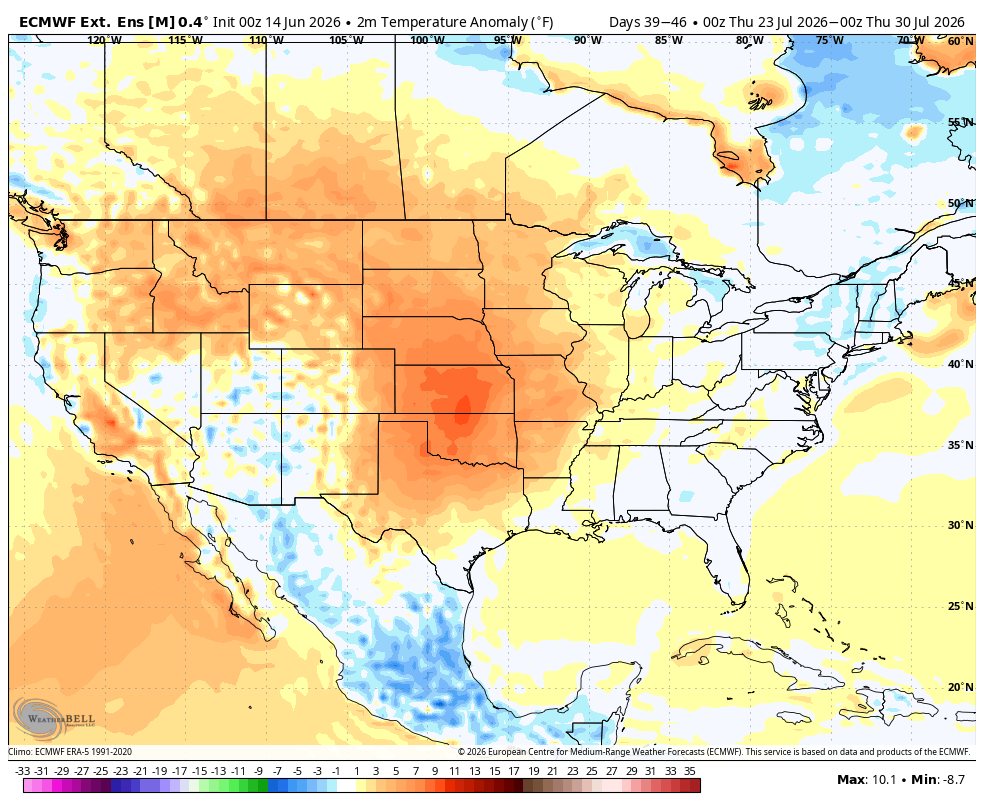
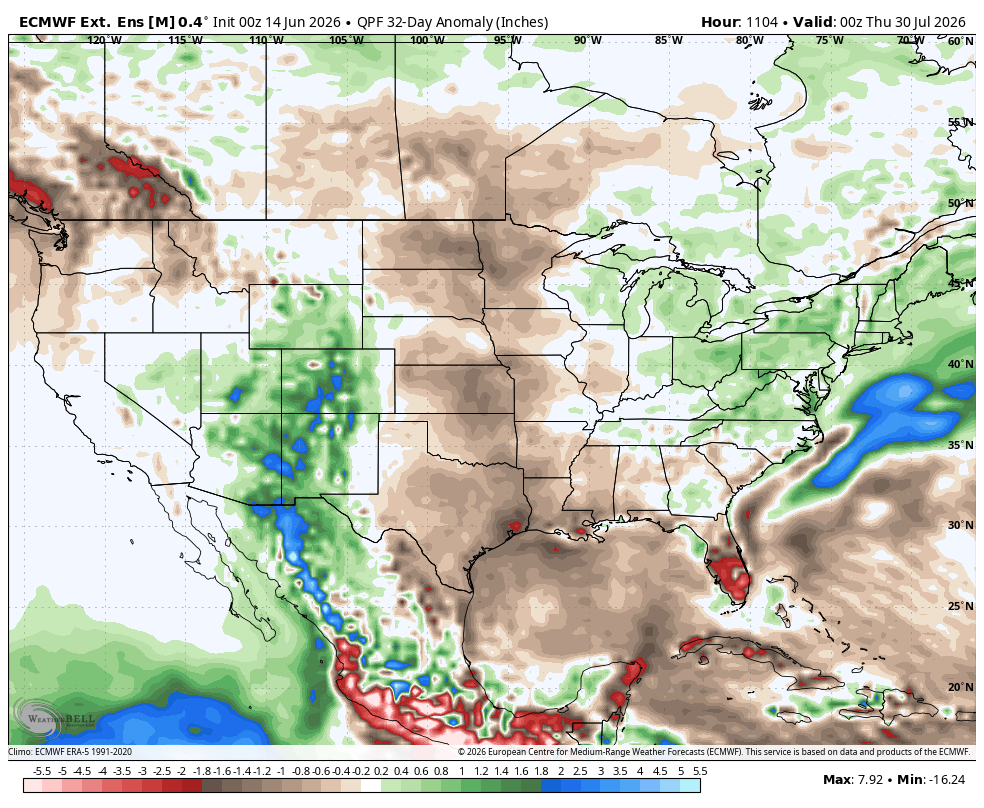
European Ensemble 500 mb map day 46. Week 6 temps(7 days) + Rain anomaly days 16-46(weeks 3-4-5-6)
1. June 1: 500 mb Heat ridge July 16-HOT Plains. DRIER!(30 days thru July 16)
2. June 2: 500mb Heat ridge July 17-Hot/dry Plains. Rains favored east. NOT bearish!
3: June 3: Upper level ridge slightly weaker. Hot/dry Plains. Rains favored East! No major threat.
4. June 4: Same as yesterday but a tad drier.
5. June 6: Heat ridge Southern Plains. Rains favored East. NOT bearish! Weeks 1-2 count MORE in June!
6. June 8: Heat ridge S.Plains. Hot/dry Plains to WCB. Bullish but weeks 1-2 count most in June!
7. June 9: Huge heat ridge. Hot/dry with storms around the periphery. Bullish!
8. June 10: Heat ridge builds to a rain suppressing dome. VERY BULLISH!
June 11: Continued BULLISH!
June 12: STILL BULLISH, especially Plains to WCB. July is a key month but is far enough out to change.
June 13 Still Bullish, especially Plains to WCB. Major heat ridge Plains.
June 14: Still BULLISH from intense heat and dry in the Plains/WCB.
June 15: Same solution but added MORE rain. Looks like ring of fire pattern with clusters of locally heavy but PROGRESSIVE storms tracking around the periphery of a big heat ridge to the south (and breaks in the action).
June 16: HOTTER AND DRIER in the Cornbelt for July on this model!!!
June 17: Still BULLISH for July! Especially for the Plains and WCB.
June 18: Now goes out to the first days in August. Continued very bullish!
June 19: Not quite as hot with a slight reduction in massive heat dome but still dry and bullish!


+++++++++++++++++++++++++++++++++++
GEFS +500 mb map on day 35. Week 5 temps(days 28-35). Rain anomaly days 5-35(weeks 2-3-4-5).
June 1: Hot West to Plains to WCB. Wet ECB
June 2: Hot West to Plains. DRY Plains to CCB. This is bullish but pretty far out. Red = -2 inches vs average.
June3: Intense Heat Plains. Dry WCB. WET southeast with ring of fire storms on east side of the heat ridge.
June 5: Weaker heat ridge. Added rains.
June 7: Stronger heat ridge(Rockies/Plains/WCB). Wet E/SE of that!
June 8: Hot/Dry West to Plains to WCB. Wet Southeast of that.
June 9: Same as yesterday
June 10: HOT West to Plains. Dry Plains to Upper Midwest. Wet Southeast.
June 11: HOT West to Plains. Cooler/wetter Midwest/South.
June 12: Heat DOME Southwest to Plains. Ring of fire perturbations around the periphery dropping into the Midwest. Heavy rains Southeast Cornbelt to South.
June 14: Heat DOME West to Plains. Northwest flow into the Midwest. Heavy rains Southern Cornbelt to Deep South.
June 15: Heat ridge not as strong. More bearish now!
June 16: Major Heat West to Plains. Active ring of fire perturbations/storm clusters around heat ridge with heavy rains and northwest flow east of the heat ridge, especially southern Cornbelt and northern Gulf states.
June 17: Hot/Dry West to Plains. Storm clusters around the periphery of the heat ridge with rains that look heaviest south of the Cornbelt. Heat stalls trying to shift east with northwest flow east of the ridge. More bearish than the European model.


Great site for getting rainfall data. Just put in your zip code!
https://www.raindrop.farm/rainfall-totals/zipcode
+++++++++++++++
6-10-26:
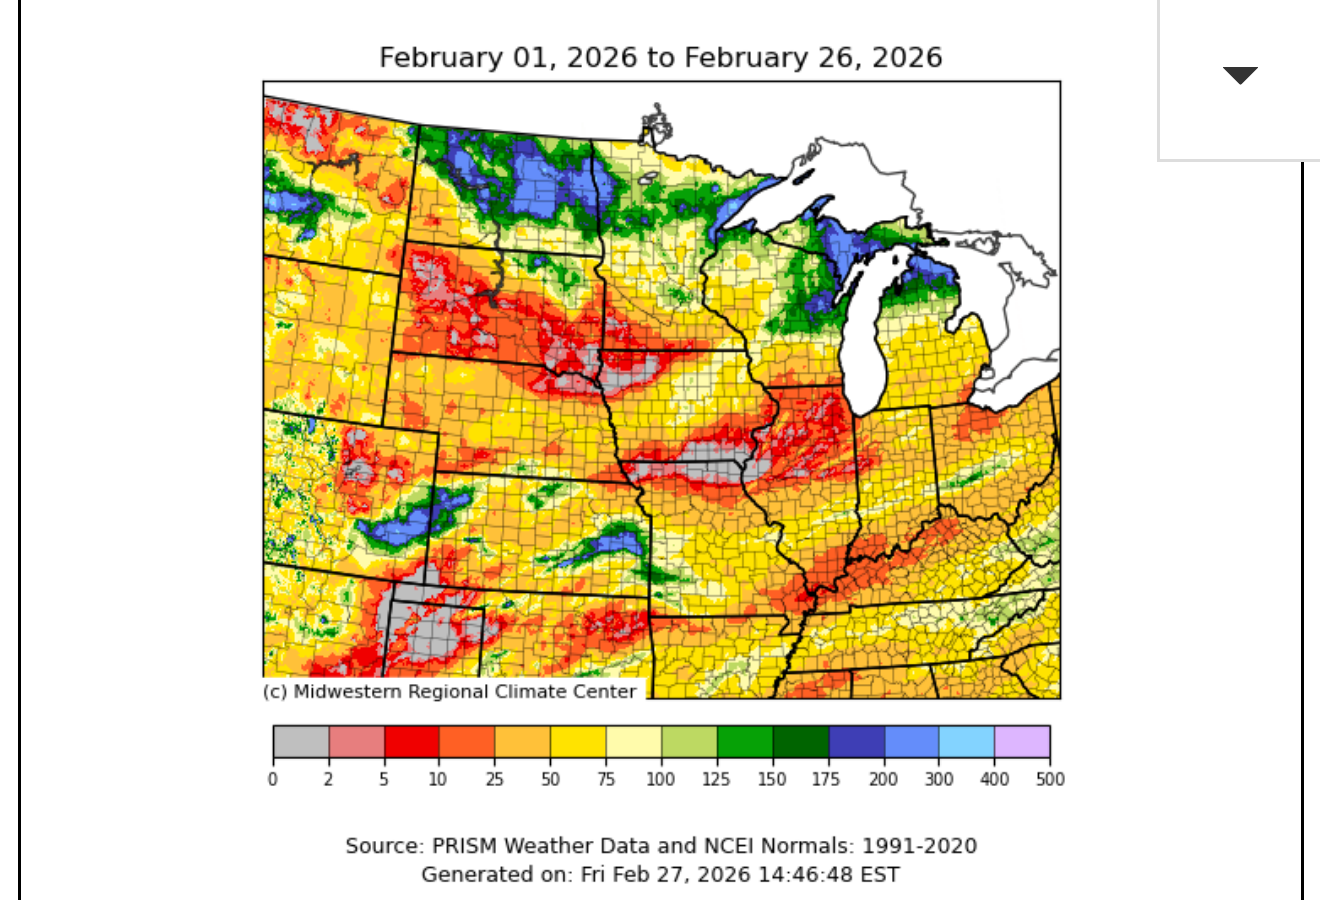
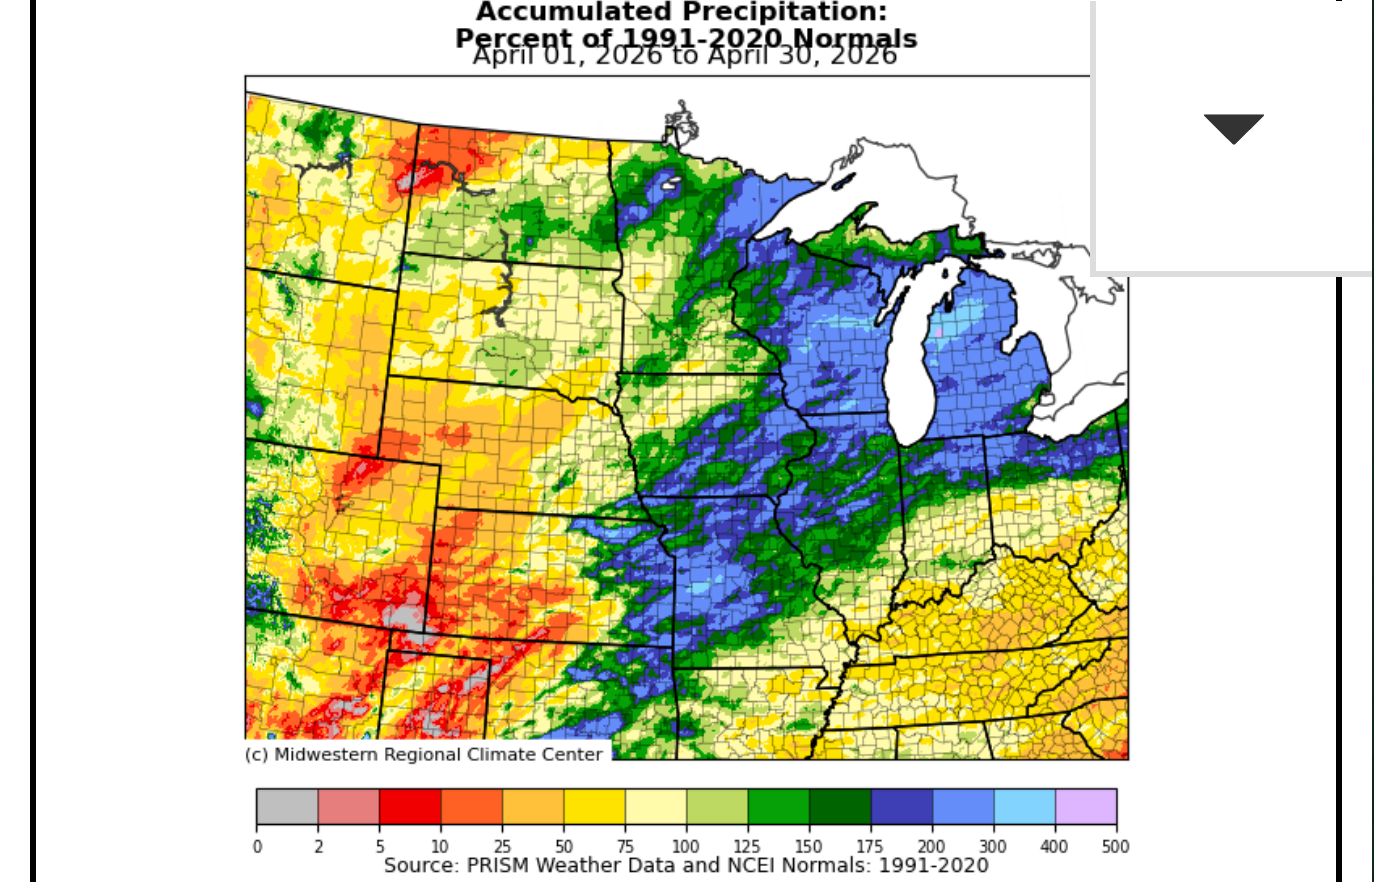
Much of the Midwest and Great Lakes had their soil moisture recharged in April. Now much of the South saw the drought intensity greatly reduced in May/June.
+++++++++
Soilmoisture anomaly:
These maps sometimes take a day to catch up to incorporate the latest data(the bottom map is only updated once a week).
https://www.cpc.ncep.noaa.gov/products/Soilmst_Monitoring/US/Soilmst/Soilmst.shtml#
![]()


++++++++++++++++++++++++++++
Main link:
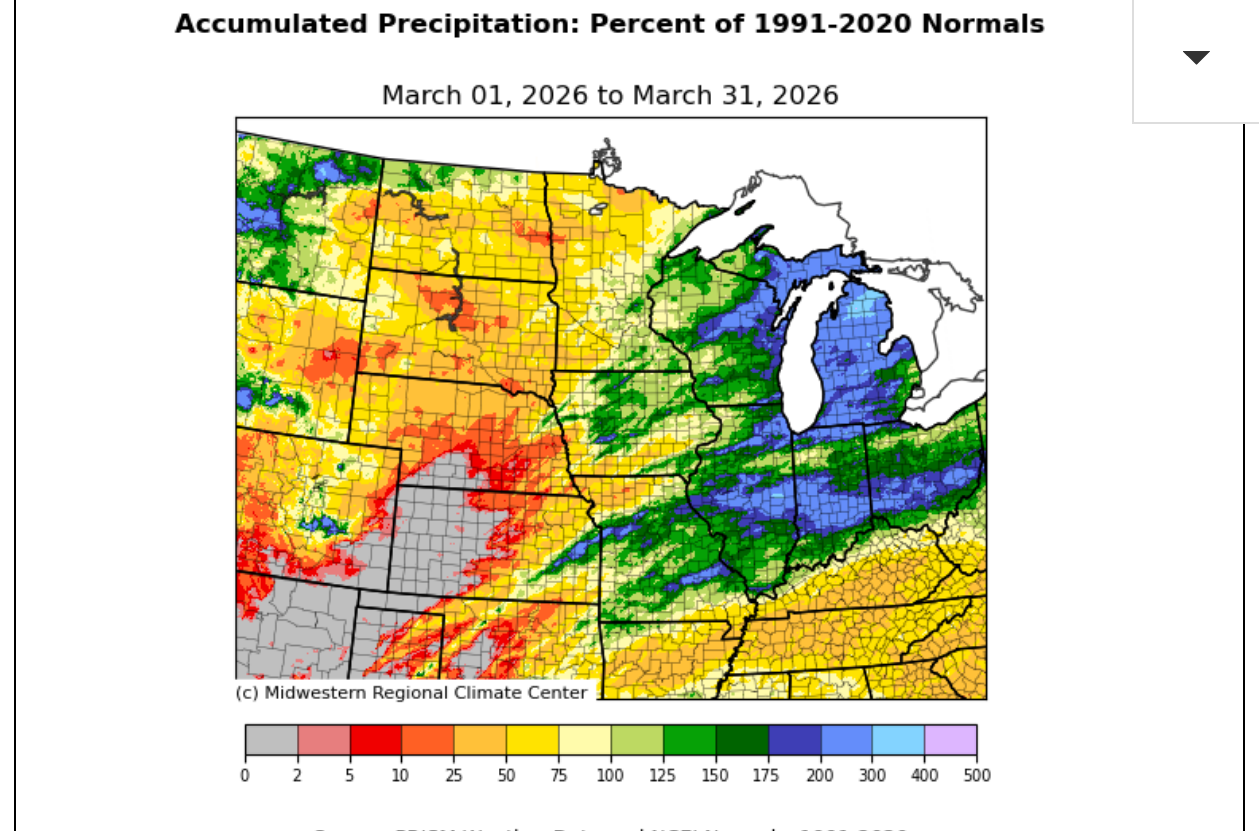
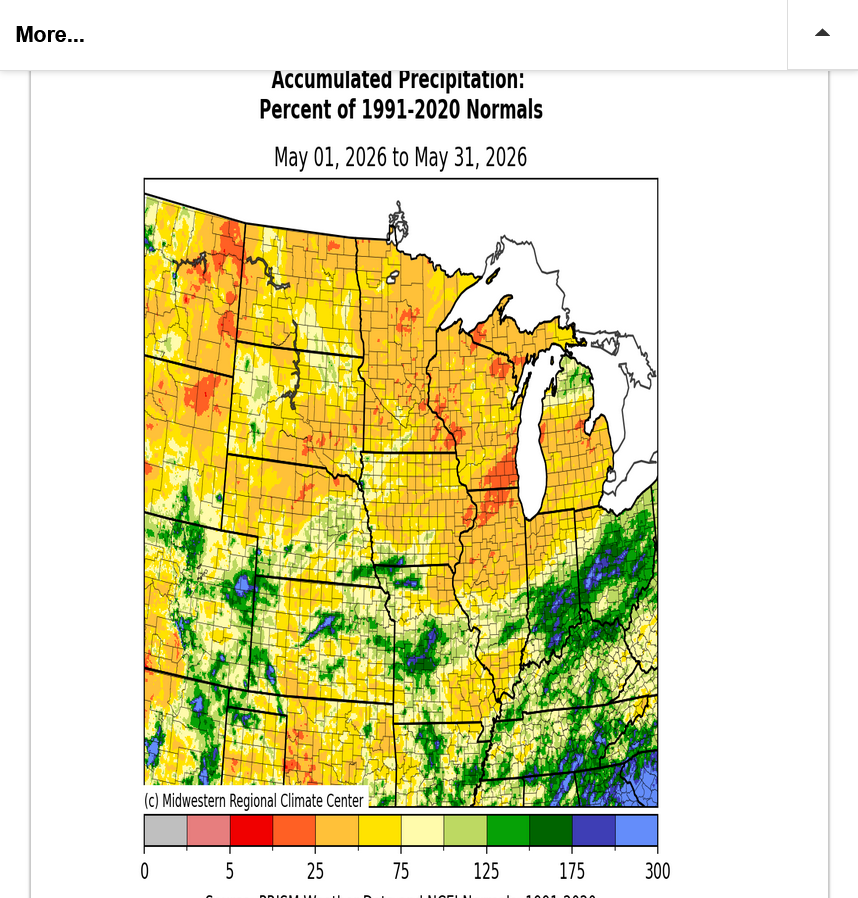
https://mrcc.purdue.edu/ag-climate-dashboard
Updated daily below:
https://mrcc.purdue.edu/cliwatch/watch.htm#curMonths
Snapshot below:

NEW LINK:
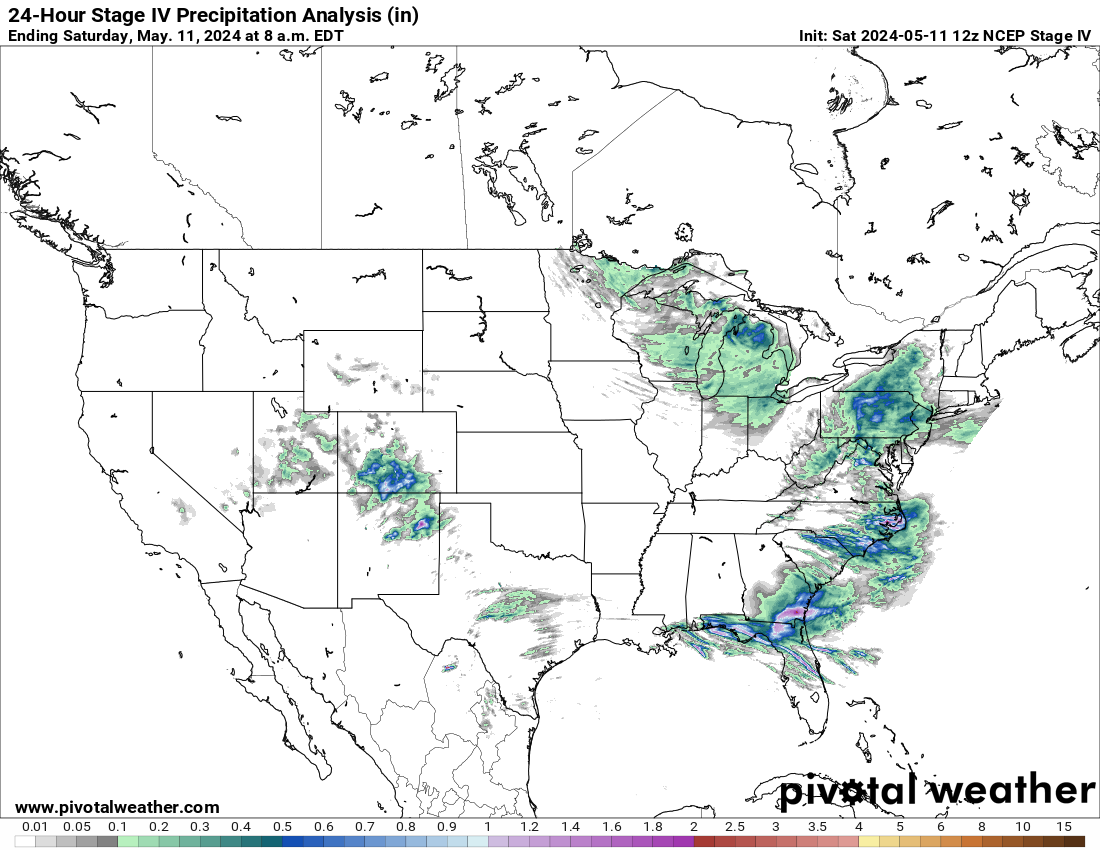
https://www.pivotalweather.com/maps.php?ds=stageiv&p=stageiv_qpe_168h_p&r=conus
Last 24 hours
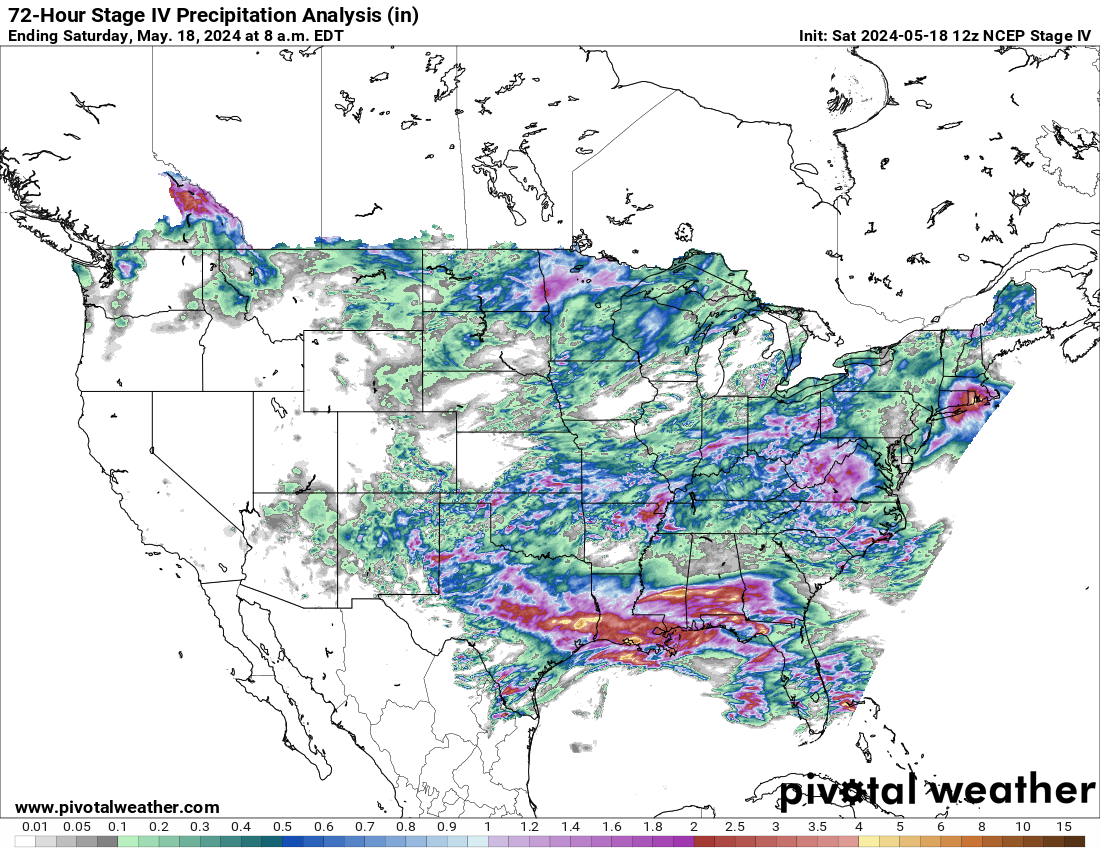
Last 72 hours
Last 7 days:
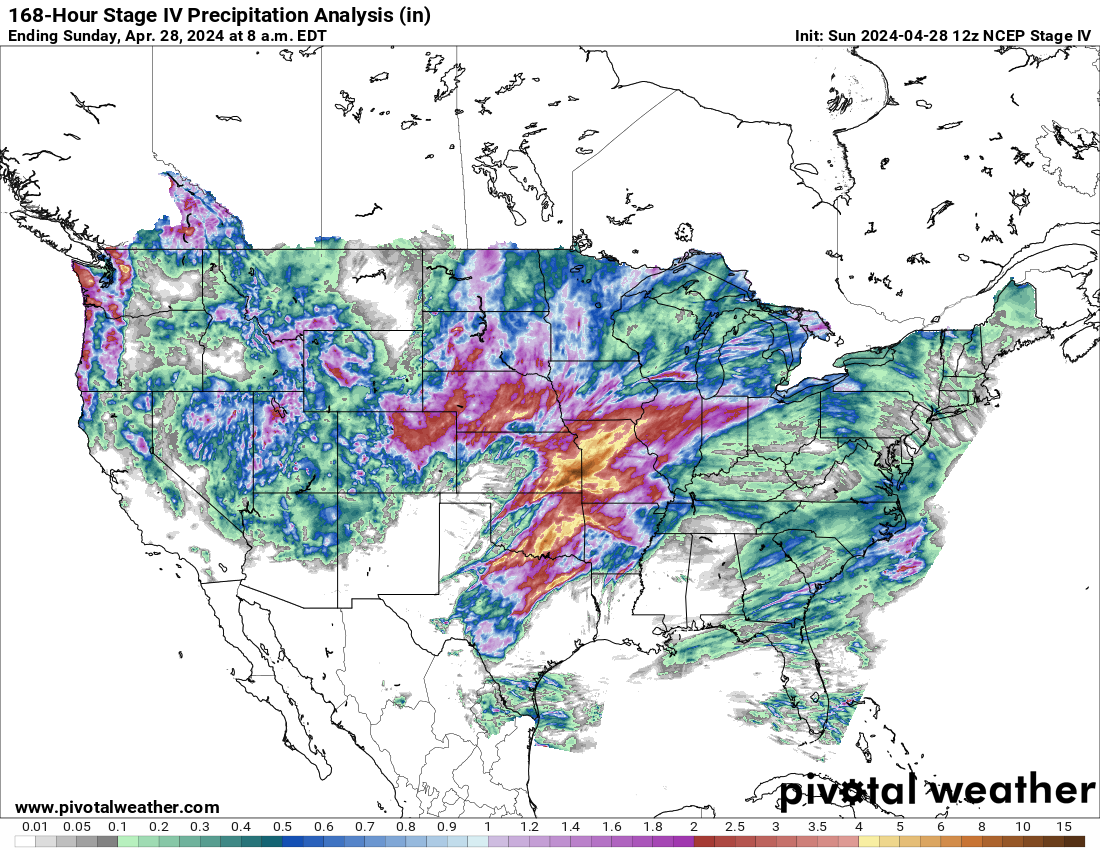
https://www.drought.gov/current-conditions
Thru June 16, 2026
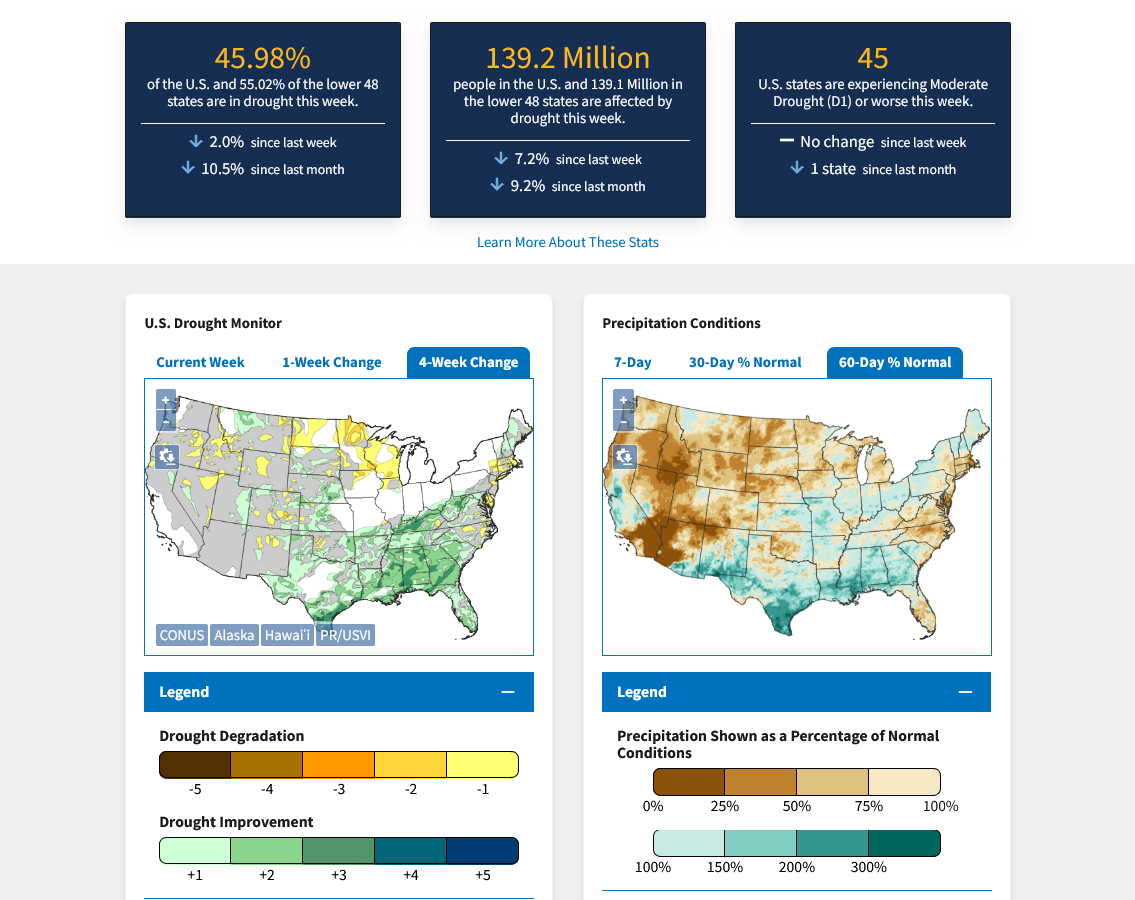
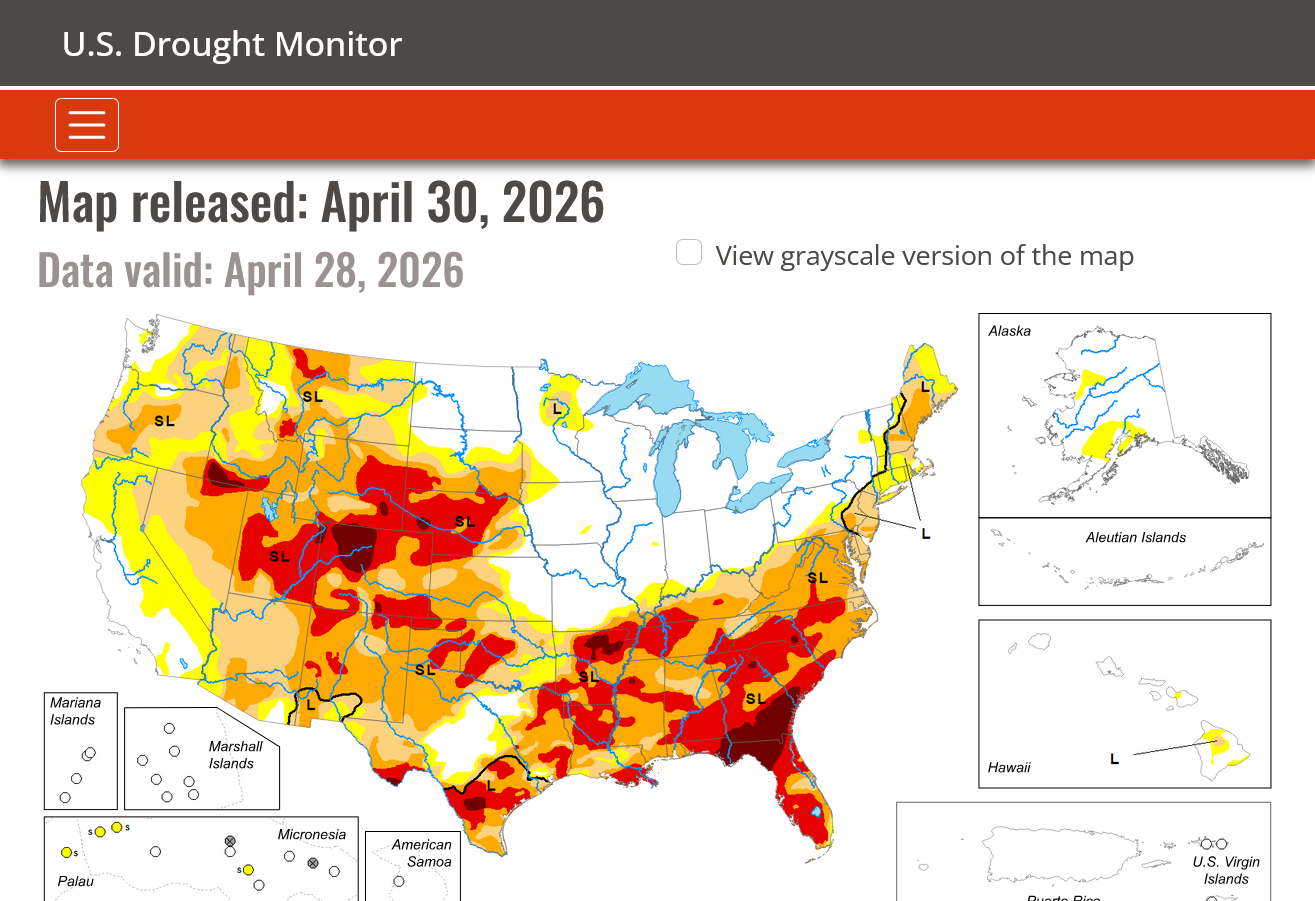
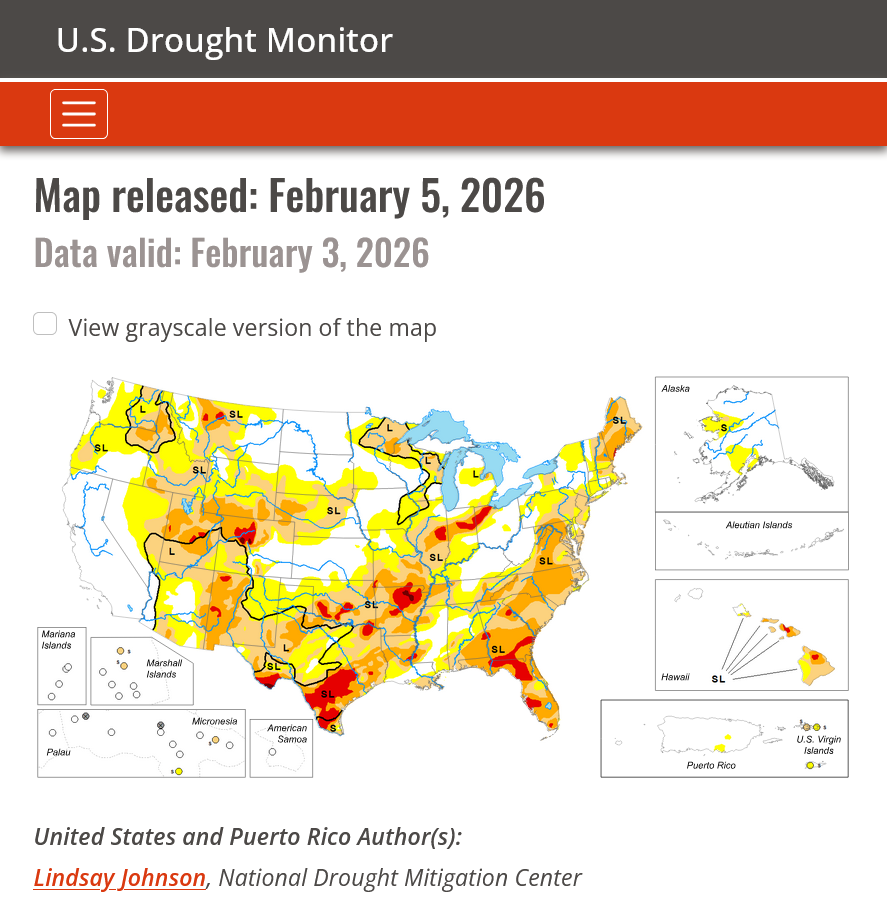
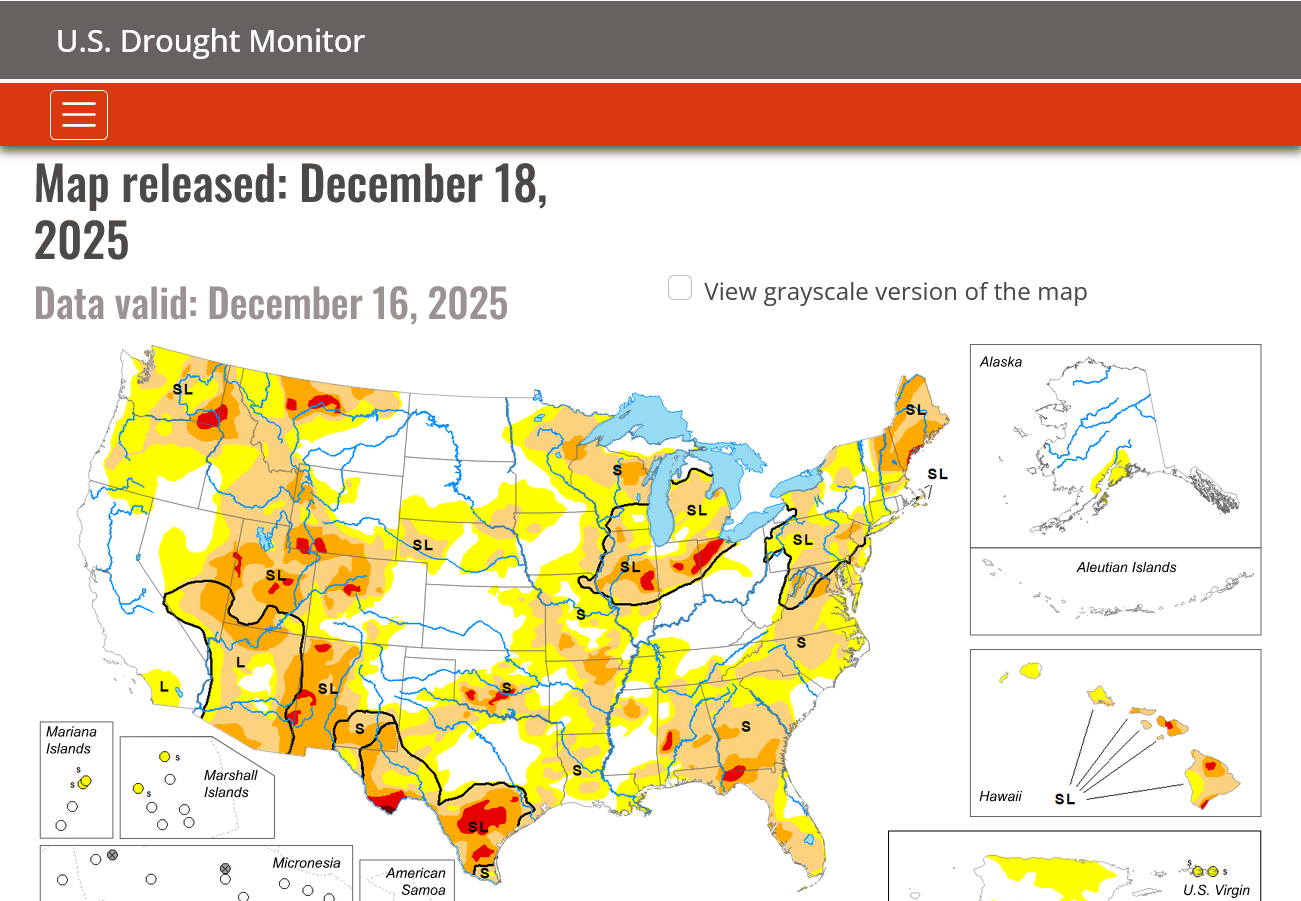
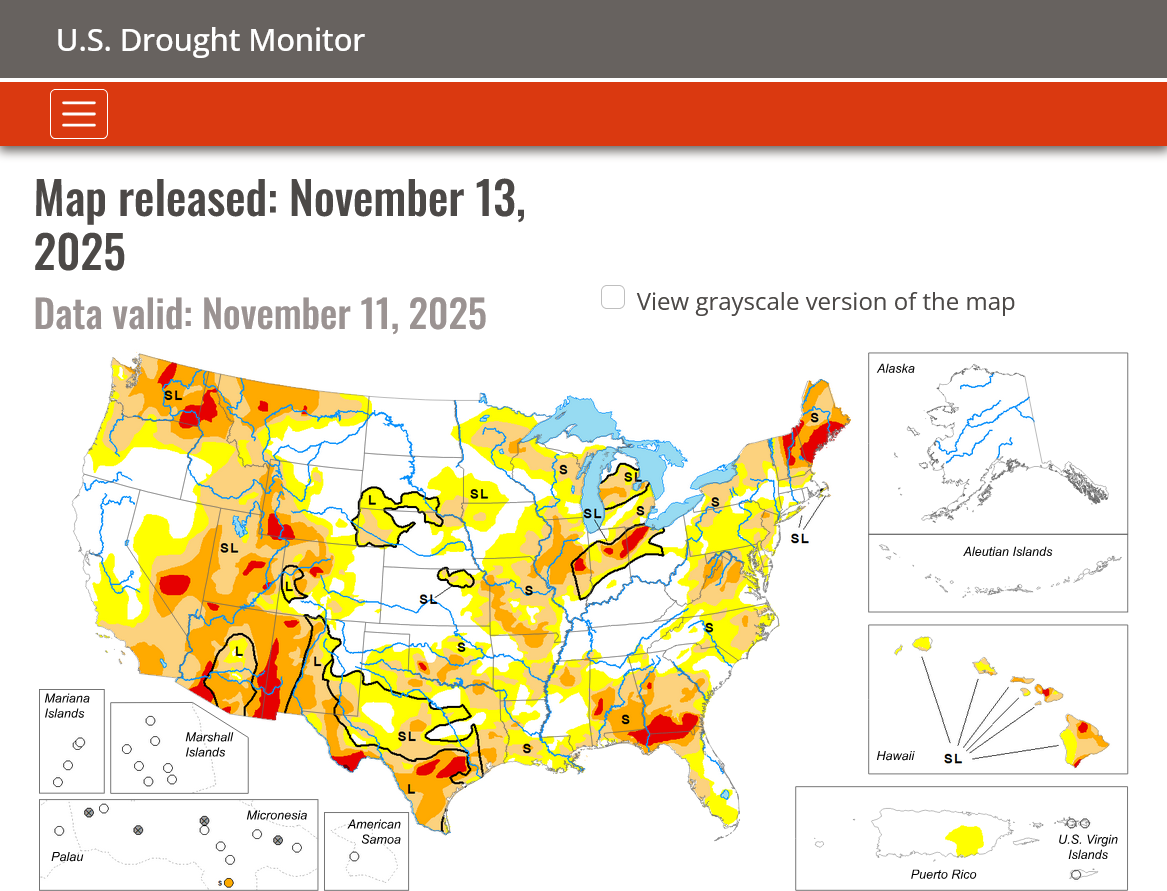
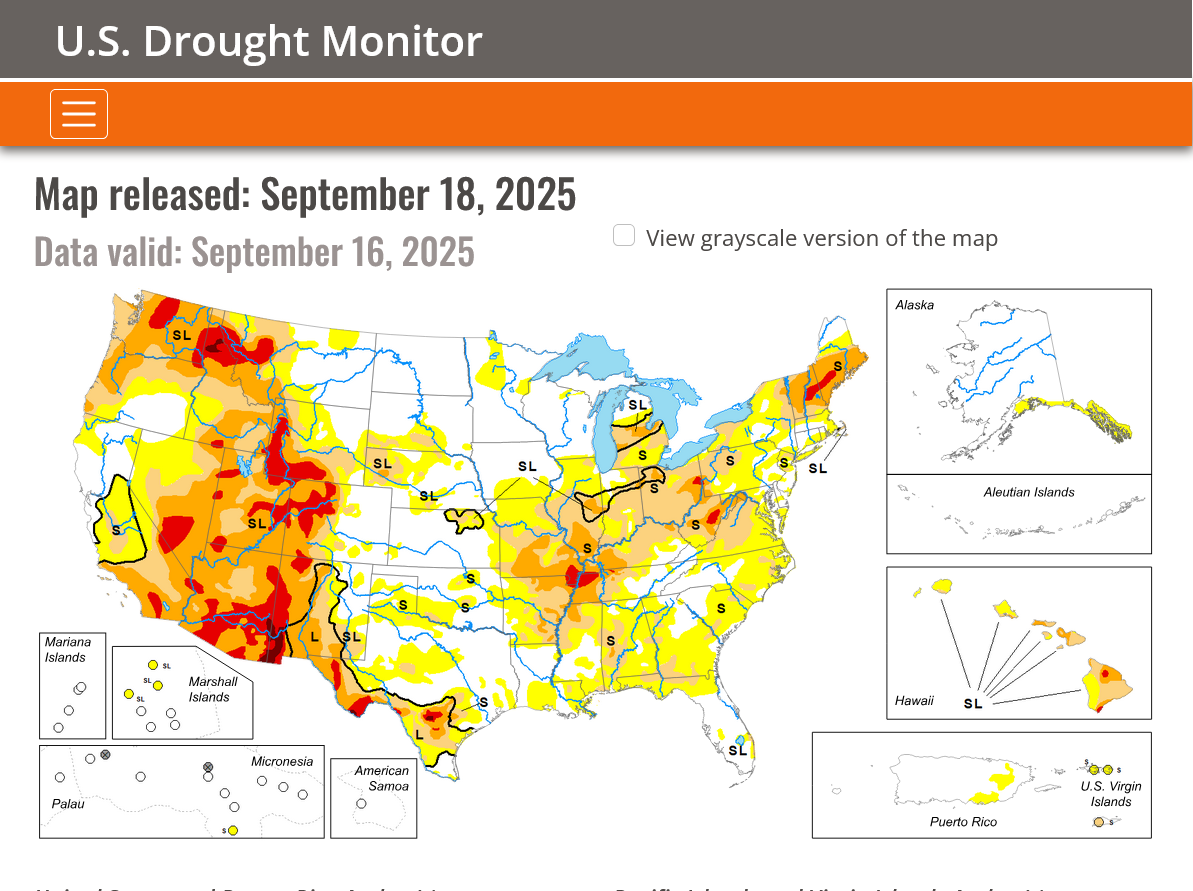
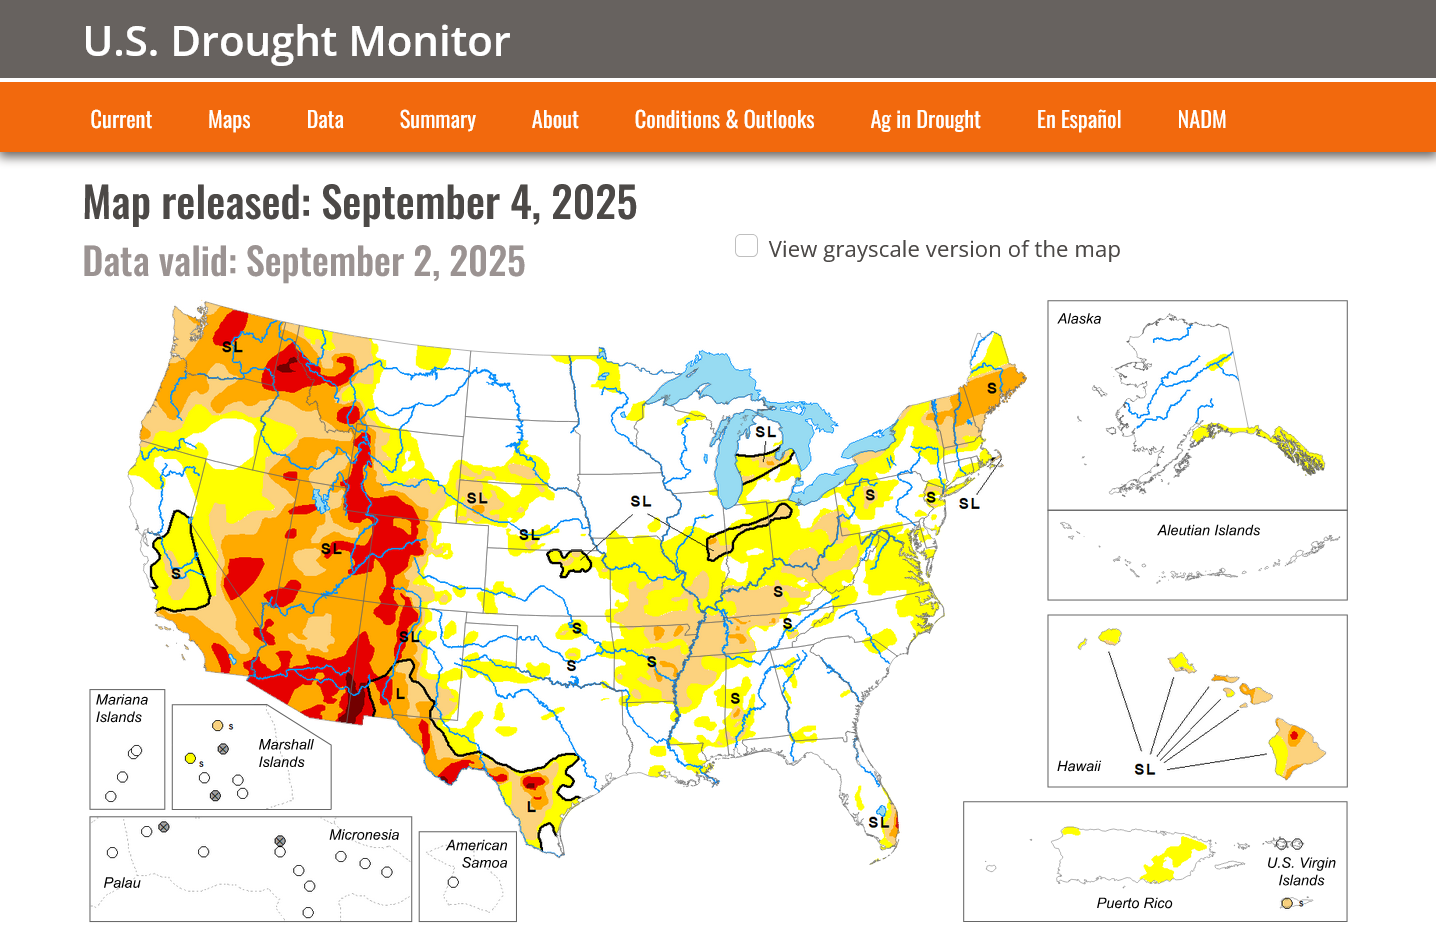
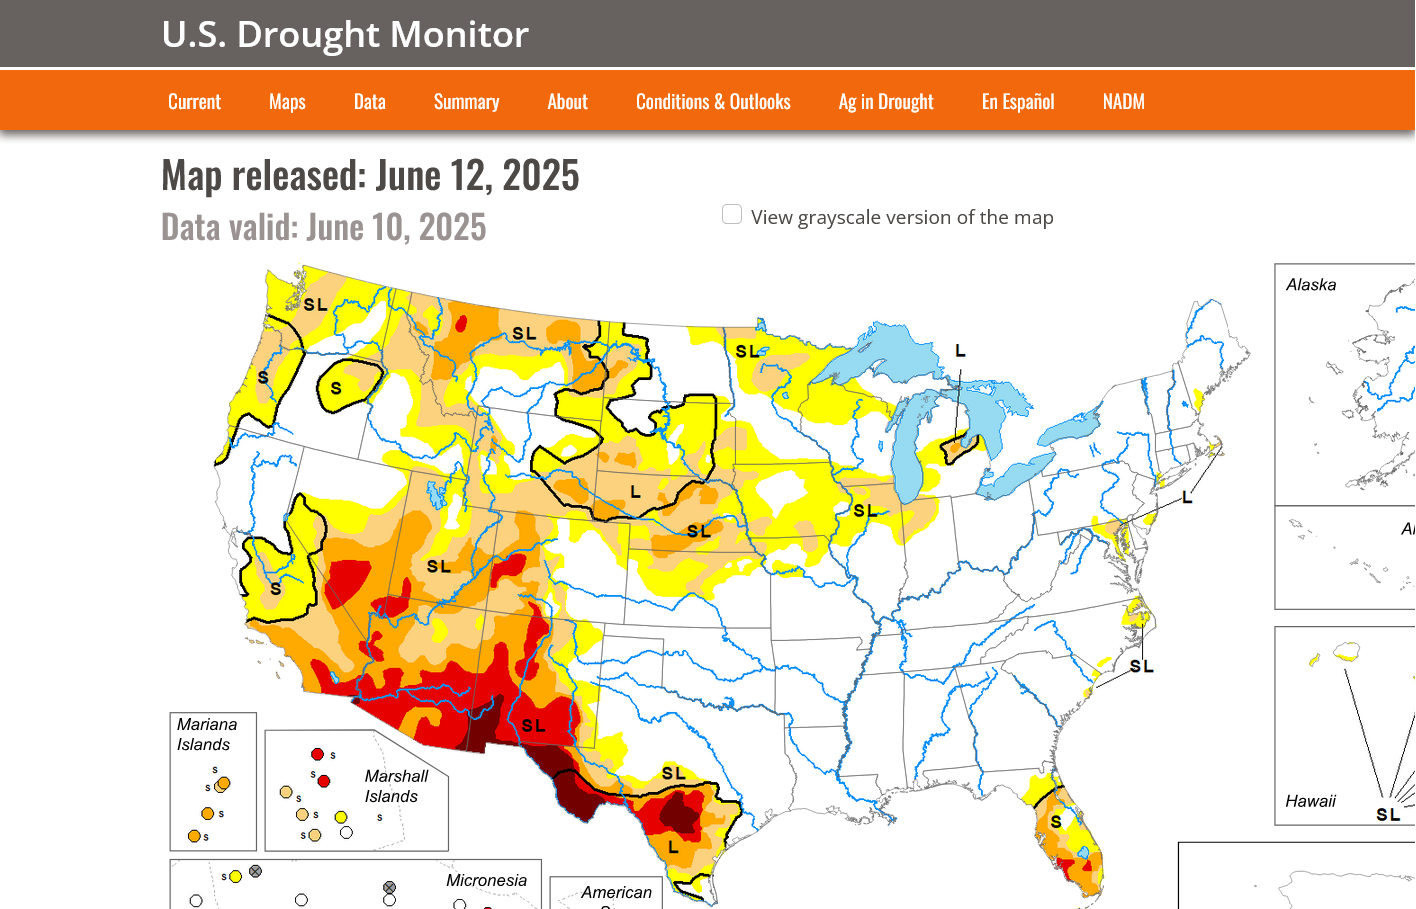
DROUGHT MONITOR
https://droughtmonitor.unl.edu/
Drought improved a great deal in the south the past month!
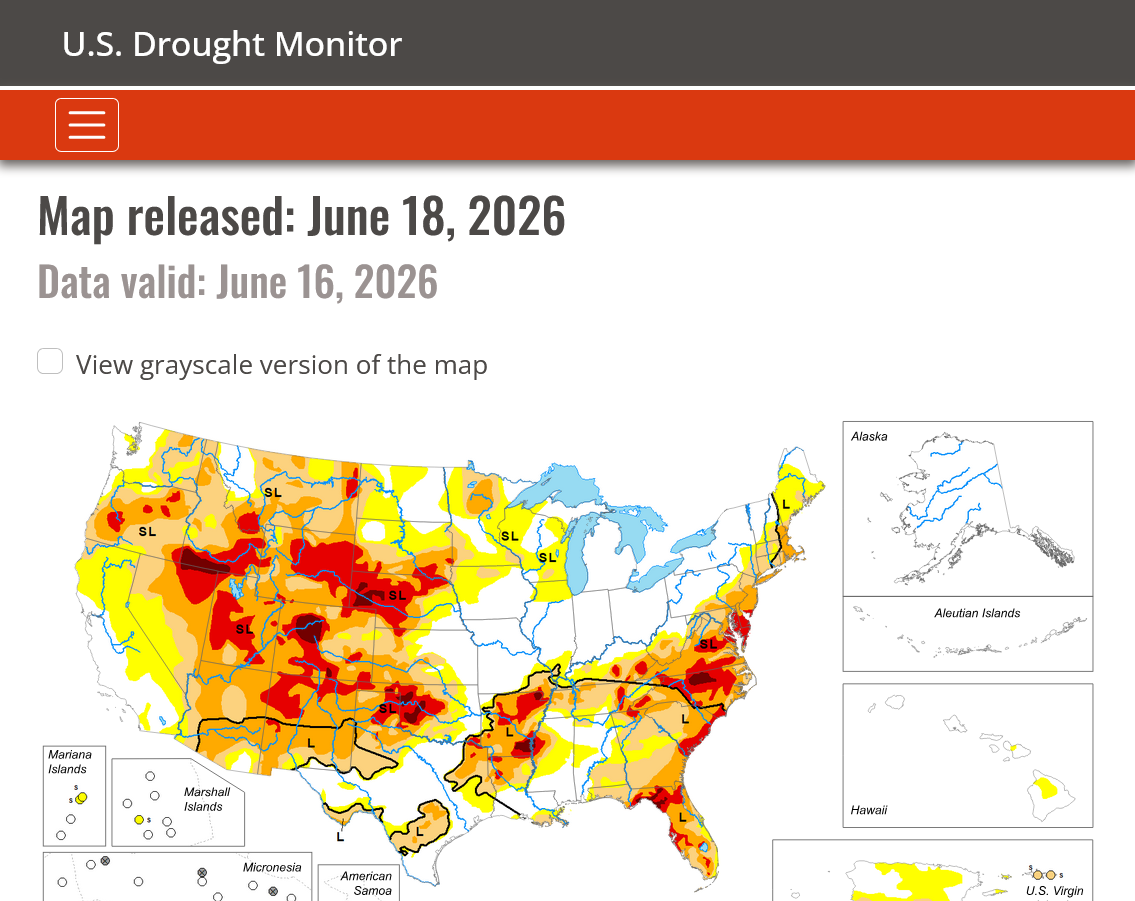
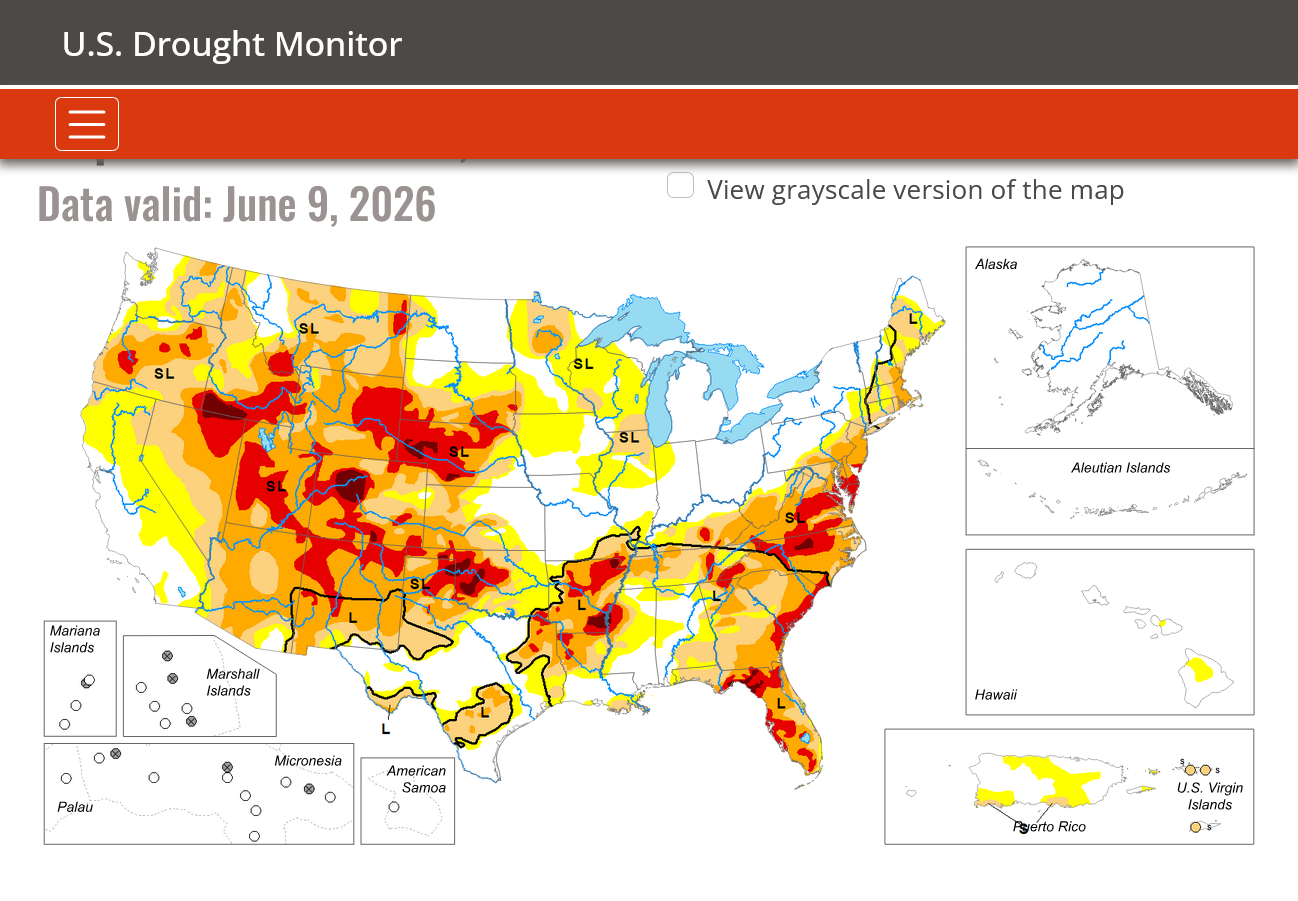
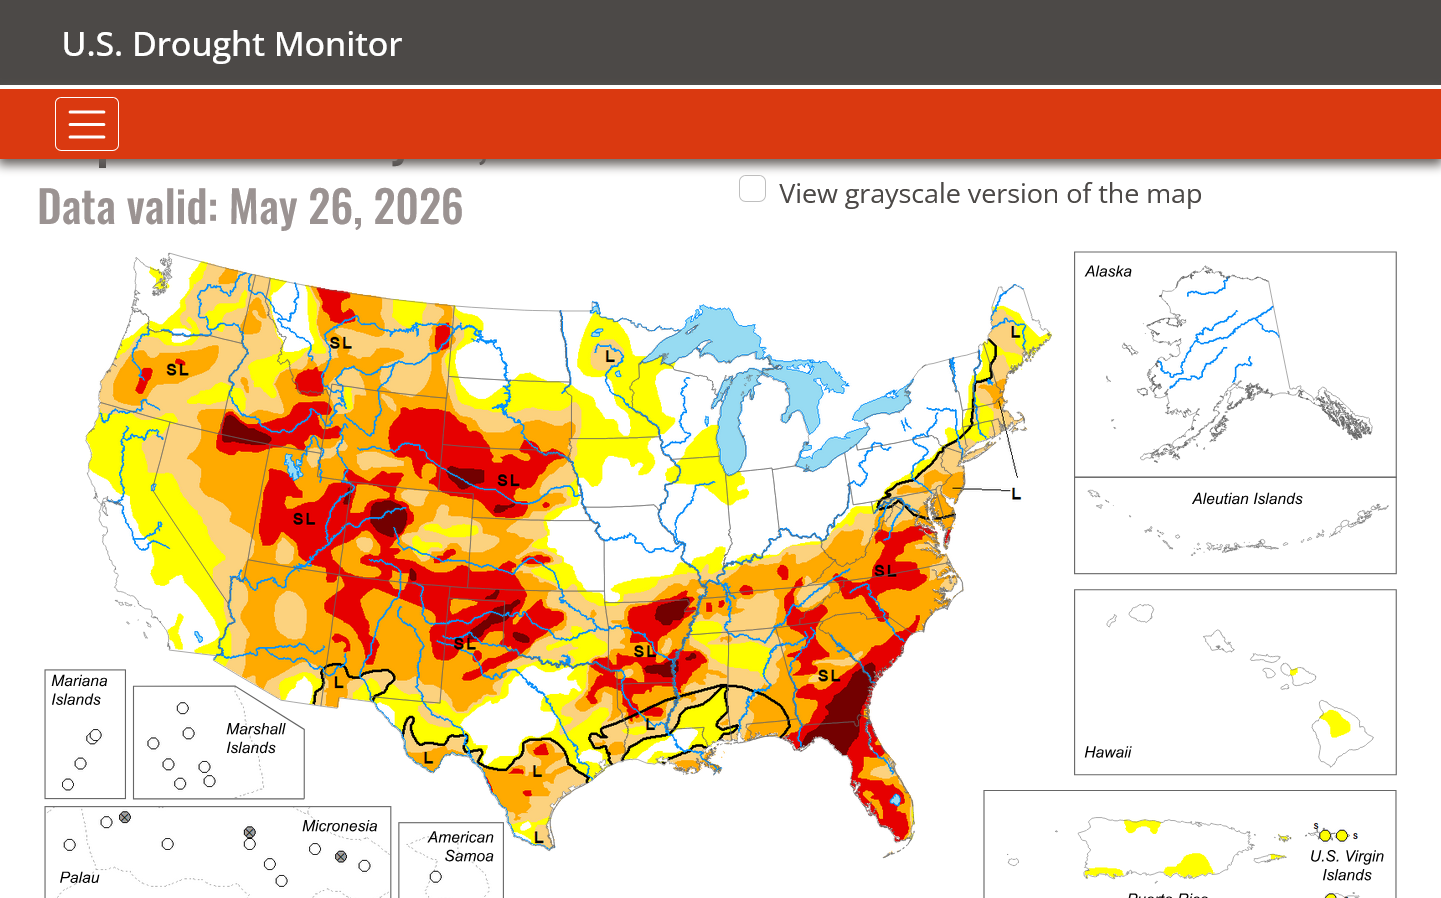
Drought gone in the Midwest. Much more rain needed elsewhere.
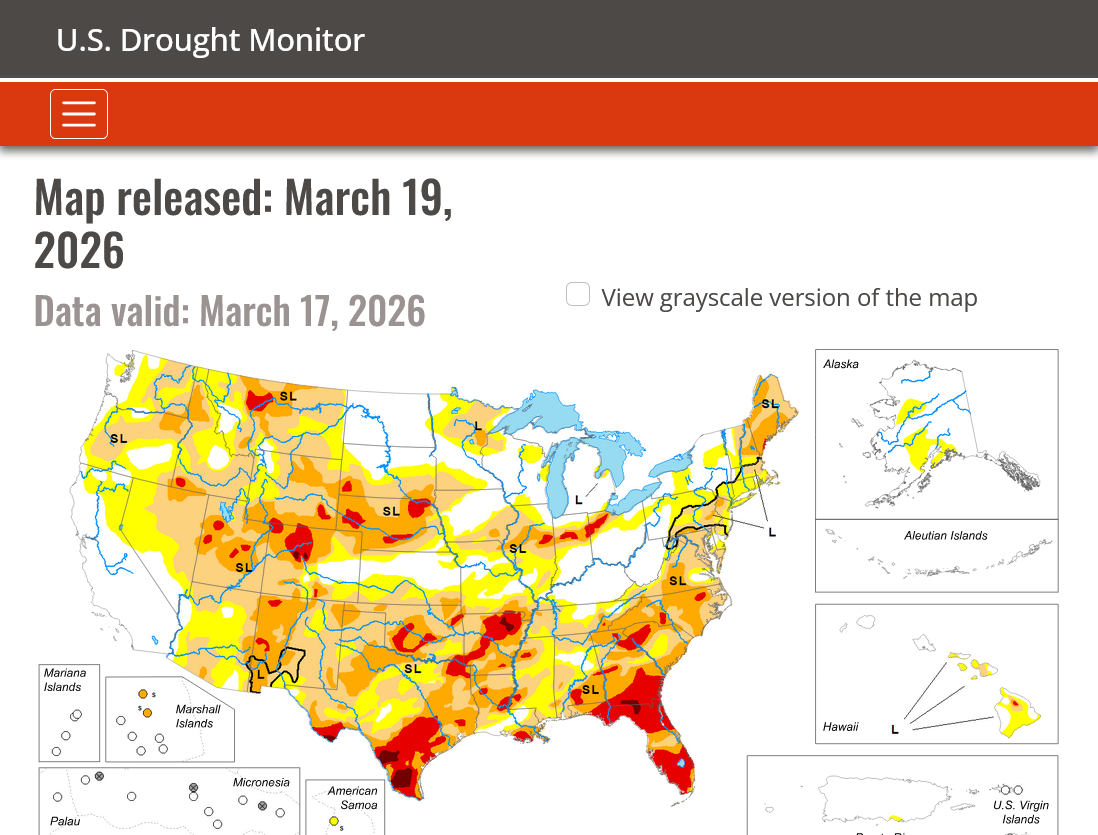
Drought expanding this Winter from Southern Plains, northeastward.
Drought out West has been improving from recent rains:
Drought ended along the Ohio River:
Flash Drought has worsened!
FLASH drought has spread rapidly!
FLASH DROUGHT!!
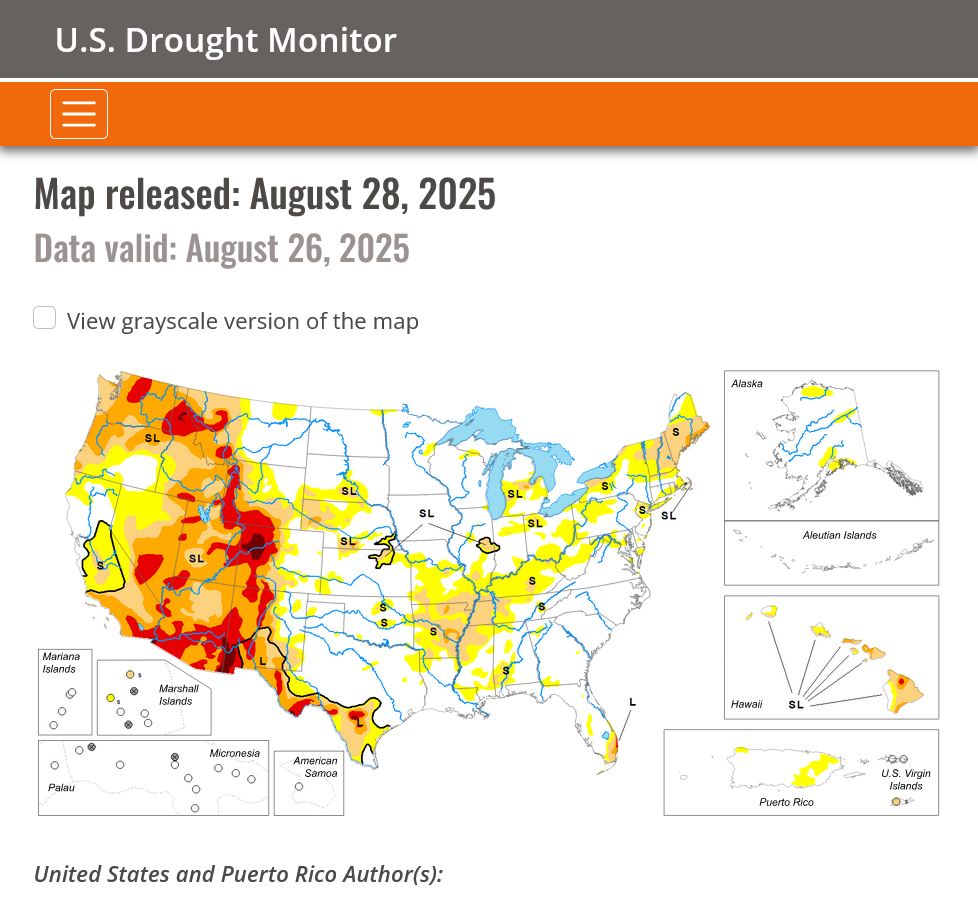
Drought area in the Cornbelt has been almost completely eliminated!!!
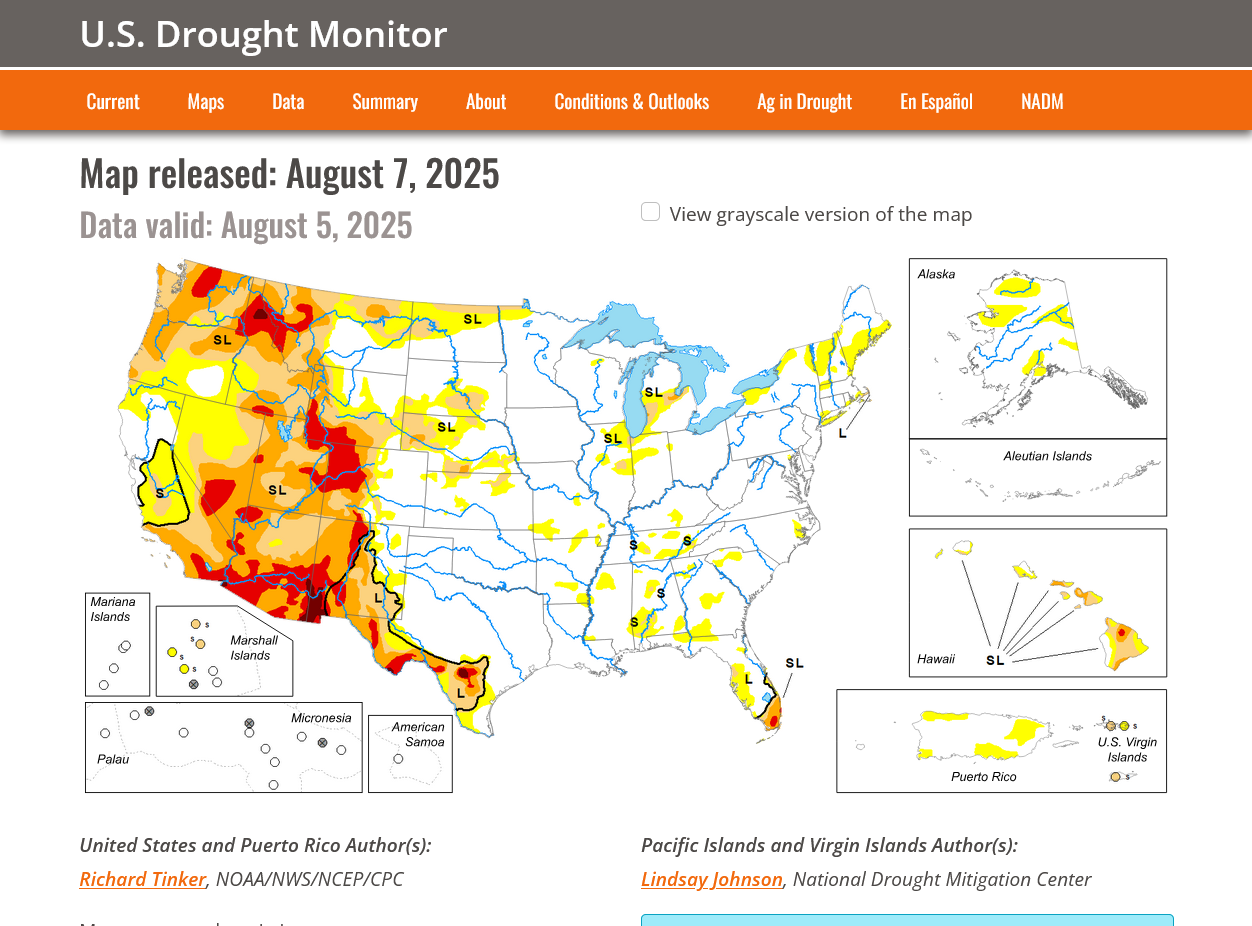
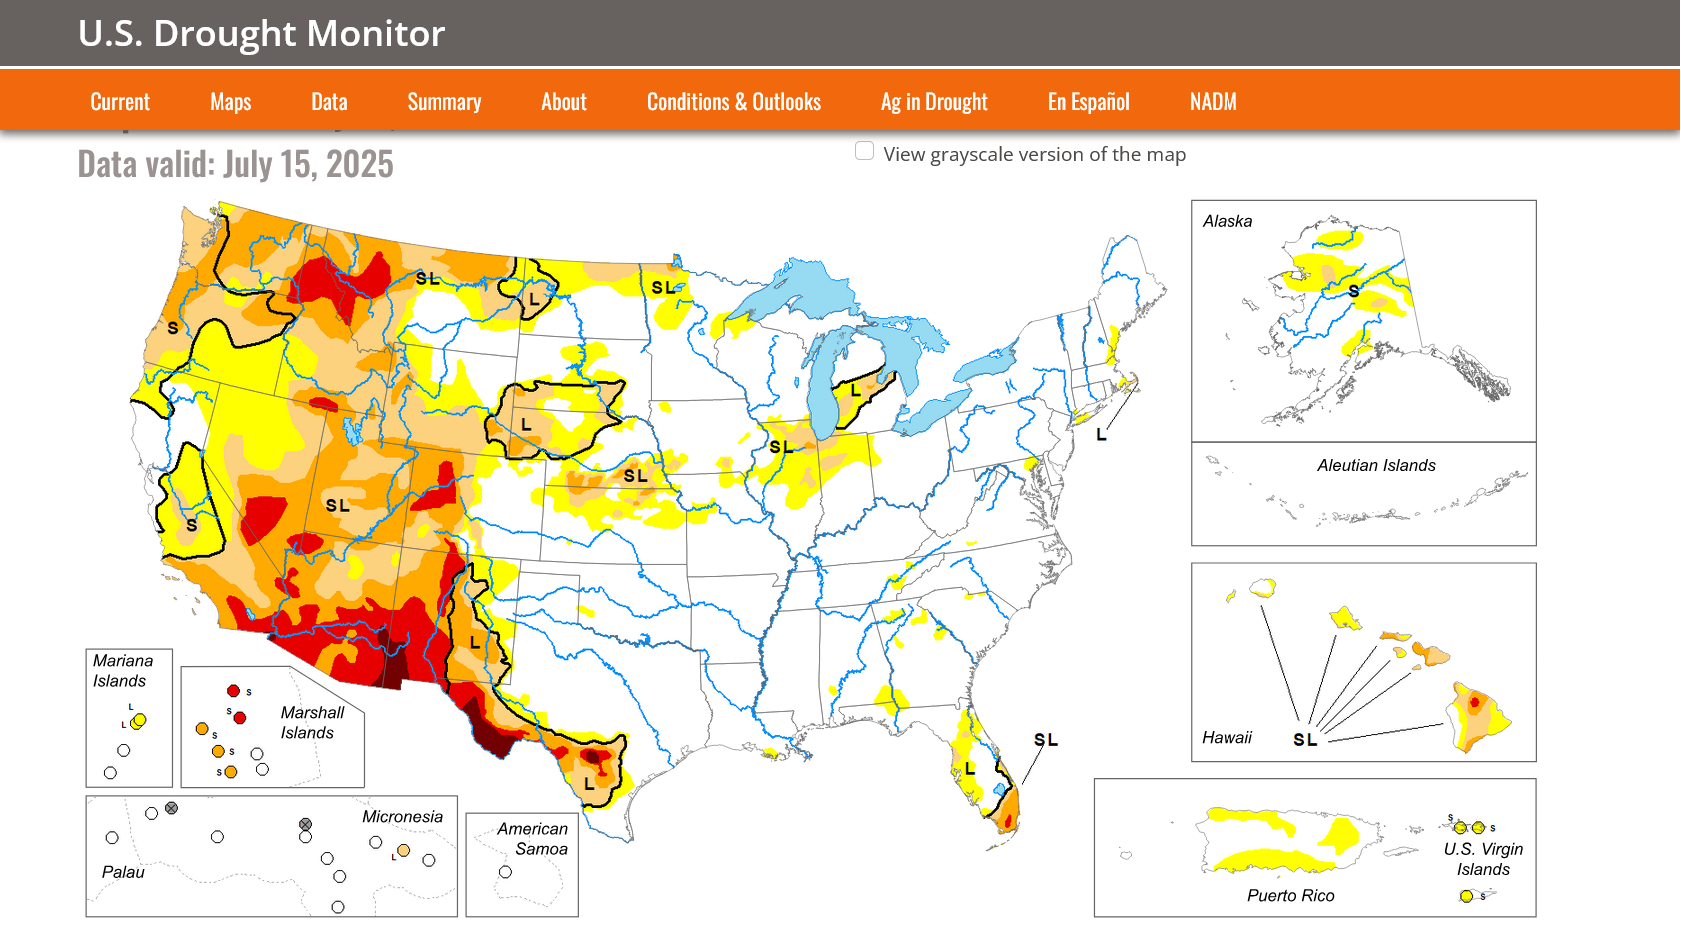
This is not much area in drought compared to many years and compared to earlier this year/last Fall. Scroll down to see the massive improvement! This is much less than predicted earlier this Spring!!!
Go to this link, put in a/your zip code and find out how much rain fell the past 24 hours.
Updated all maps but the extended GEFS that comes out in the late evening.
Re: Rain/Drought thread June 2026
Both the GEFS and EE are on the same bearish page thru 2 weeks.
For the grains in June, a bird in hand is worth 2 in the bush.
In other words, big rains in the 2 week forecast are worth more than Hot/Dry forecasts after that.
I'll be on vacation, starting Thursday afternoon, thru next Tuesday but will post when able.
Currently on vacation along the Destin, FL Gulf Coast
https://www.cpc.ncep.noaa.gov/products/predictions/WK34/


One of the main factors coming up that the NWS dialed into this forecast is the El Nino anolog which adds rain and cools off the actual models that turn hot/dry during this period into July.
Making big update changes to the first 2 weeks now!
Weeks 3-6 on this last EE model are even MORE bullish!
Updated all except the GEFS extended that comes out late in the evening.
https://www.marketforum.com/forum/topic/120593/#120594
Not quite as bullish as yesterday.
Updated drought page 6-11-26:
.34" of rain early this morning. Just enough to get by until the next rain. I'm sure that cutworm and producers have this mentality during the growing season.
When it's been on the dry side, it's not always the amount you NEED( .34 was not nearly enough) but how much to get by until the next BETTER rain.
If there was no more rain coming the next week with heat, .34 is a "better than nothing but oh crap amount".
If there is 2+ inches coming in less than a week(with cooler temps between then and now), .34" is a "just enough to get by (for the crops/plants) to buy time until the optimal amount hits in a few days"
https://www.raindrop.farm/rainfall-totals/zipcode
Here along the Ohio River, in southwest IN, there is another chance in just over a day, then a huge rain towards the end of next week. IF that happens, this rain was able to stop deterioration in the crop while it waits for the BIG rains.
If we get the predicted 3 inches, especially with 2 separate events, along with the cooler temperatures we'll be in great shape in a week. Normal amounts in June are about an inch/week so the map below, with cooler temps is as good as it gets for our neck of the woods.
This is NOT anywhere close to too much rain. We'll take every drop.
The Deep South, on the other hand will see a bit more than they want in some places after already obliterating the severe drought with widespread heavy rains recently.
That's the way it often is with weather. Our weather spends less time at the AVERAGE than it does below or above, which includes extremes of not enough and too much that end up close to the average when you add them up and divide by 2!!!
http://www.wpc.ncep.noaa.govcdx /qpf/p168i.gif?1530796126
updated week 1 which is automatic and the extended European model which is very BULLISH For July.
If that European model is correct, as we get closer the market will leave theses prices in the dust.
If it’s wrong and the bearish El Niño weather analog has the biggest impact, then the crop size will continue to grow in July and we will make new lows Well below this,price.
With natural gas the heat ridge is in the WRONG place to maximize bullishness.
The heat ridge is in a place where a lot of crops are grown And where not as many people that cool their houses live(using natural gas to generate the electricity)
Those high population centers are more numerous in the eastern and southern parts of the US.
The NWS sees the El Nino anolog playing a key role in July, despite the European model building an ANTI El Nino type upper level heat ridge in the Plains to the WCB, along with dry-ish weather.
At the same time, they see ring of fire perturbations tracking around the periphery of the heat ridge farther west that track in northwest flow into the Midwest triggering enough rain chances to elevate the Midwest to equal chances of below and above.
Equal chances does not exactly equate to average rain. It just means around the same chance of below as above.
It could mean 50% chance of below average and 50% of above average for instance (extreme example).
In that extreme example, AVERAGE is probably not going to happen. More likely it will be either above or below with equal probabilities for both and so the "equal chances" category below.
https://www.cpc.ncep.noaa.gov/products/predictions/WK34/
| Week 3-4 Outlooks | |
| Valid: 27 Jun 2026 to 10 Jul 2026 Updated: 12 Jun 2026 | |
| Temperature Probability | Precipitation Probability |
Updated the HOTTER and DRIER July forecastfrom the European Ensemble model at 8am as well as the 7 day rainfall forecast already updated automatically.
https://www.marketforum.com/forum/topic/120593/#120594
June 16: HOTTER AND DRIER in the Cornbelt for July on this model!!!
Finished updating all the maps except the GEFS extended that comes out late in the evening.
Tons of rain the next 2 weeks continues as a heat ridge builds in the Southern Plains in week 2, while the July/early August heat ridge on the European model is EXTREMELY impressive and bullish.
https://www.marketforum.com/forum/topic/120593/#120594
Also updated the drought maps that feature another big REDUCTION in drought. Expectations of that are what put the top in for grains back in May!
The NWS updated their 30 day outlook today. It had average Temps everywhere in the Cornbelt and mostly average rains but above rain in,parts of the EC.
This would be BEARISH for the C and S markets.
It's potentially bullish for natural gas because there's a lot of people living in those hot areas that use AC for residential cooling that is generated by burning natural gas to make the electricity.
https://www.cpc.ncep.noaa.gov/products/predictions/30day/
| OFFICIAL 30-Day Forecasts | |||
| Issued: June 18, 2026 | |||
  | |||
Clearly, UNCERTAINTY reigns supreme in the middle of the country for the first 1/2 of July.
The NWS sees/recognizes the more bullish European model forecast for July in the Midwest but also recognizes other guidance that contradicts that.
Normal weather is BEARISH for grain prices in July. We need major adversity in most years from widespread HOT/DRY to sustain a move up.
Big heat out West and in the Southeast is just slightly bullish for natural gas with above average CDDs. I say slightly because seasonals in late June are negative and the market is already expecting a hot July.
https://www.cpc.ncep.noaa.gov/products/predictions/WK34/
| Week 3-4 Outlooks | |
| Valid: 04 Jul 2026 to 17 Jul 2026 Updated: 19 Jun 2026 | |
| Temperature Probability | Precipitation Probability |
June 21: Added new map below. This is a threat that lasts 1 day from a progressive pattern. The next chance of rain in that area will be at the end of the week.
http://www.wpc.ncep.noaa.govcdx /qpf/p168i.gif?1530796126
Excessive rain threat.
Scattered areas of flash flooding are possible in the red zone. Locally 6 inches of rain can't be ruled out in a few spots. Some of these areas were hit with excessive rains earlier this month as noted by tjc here.
https://www.wpc.ncep.noaa.gov/qpf/excess_rain.shtml
https://www.wpc.ncep.noaa.gov/discussions/hpcdiscussions.php?disc=qpferd
Current Day 1 Forecast