
Perhaps grains put in a daily cycle low around 7 to 730am cst Monday morning.
If so, look for a Tuesday upward continuation, to sell, with a Thursday (prob Wed night/Thur early morn) low to buy.
Yes, prob based upon some revised weather forecast on Tuesday midmorning or thereafter.
Why do I so prolificate? "3 days after a low/high, market will retest"
Two cents.
Anticipated rally prob wont exceed previous high, OR will GREATLY exceed it!!
Re: Re: Re: Re: : : Grains 7-25-26
By metmike - Aug. 3, 2026, 9:20 p.m.
Thanks very much, tjc!
tjc: "ON FRIDAY, just before close, I ignored rain/weather, then capitulated OH SO CLOSE TO THE BOTTOM--should have slept in!"
metmike: You assume that a 1 day bounce means the bottom is in and you missed it. That could be the case but we don't know.
++++++++++++++++++
Previous thread:
Grains 7-25-26
43 responses |
Started by metmike - July 25, 2026, 5:01 p.m.
https://www.marketforum.com/forum/topic/121842/
+++++++++++
Get all the comprehensive weather here:
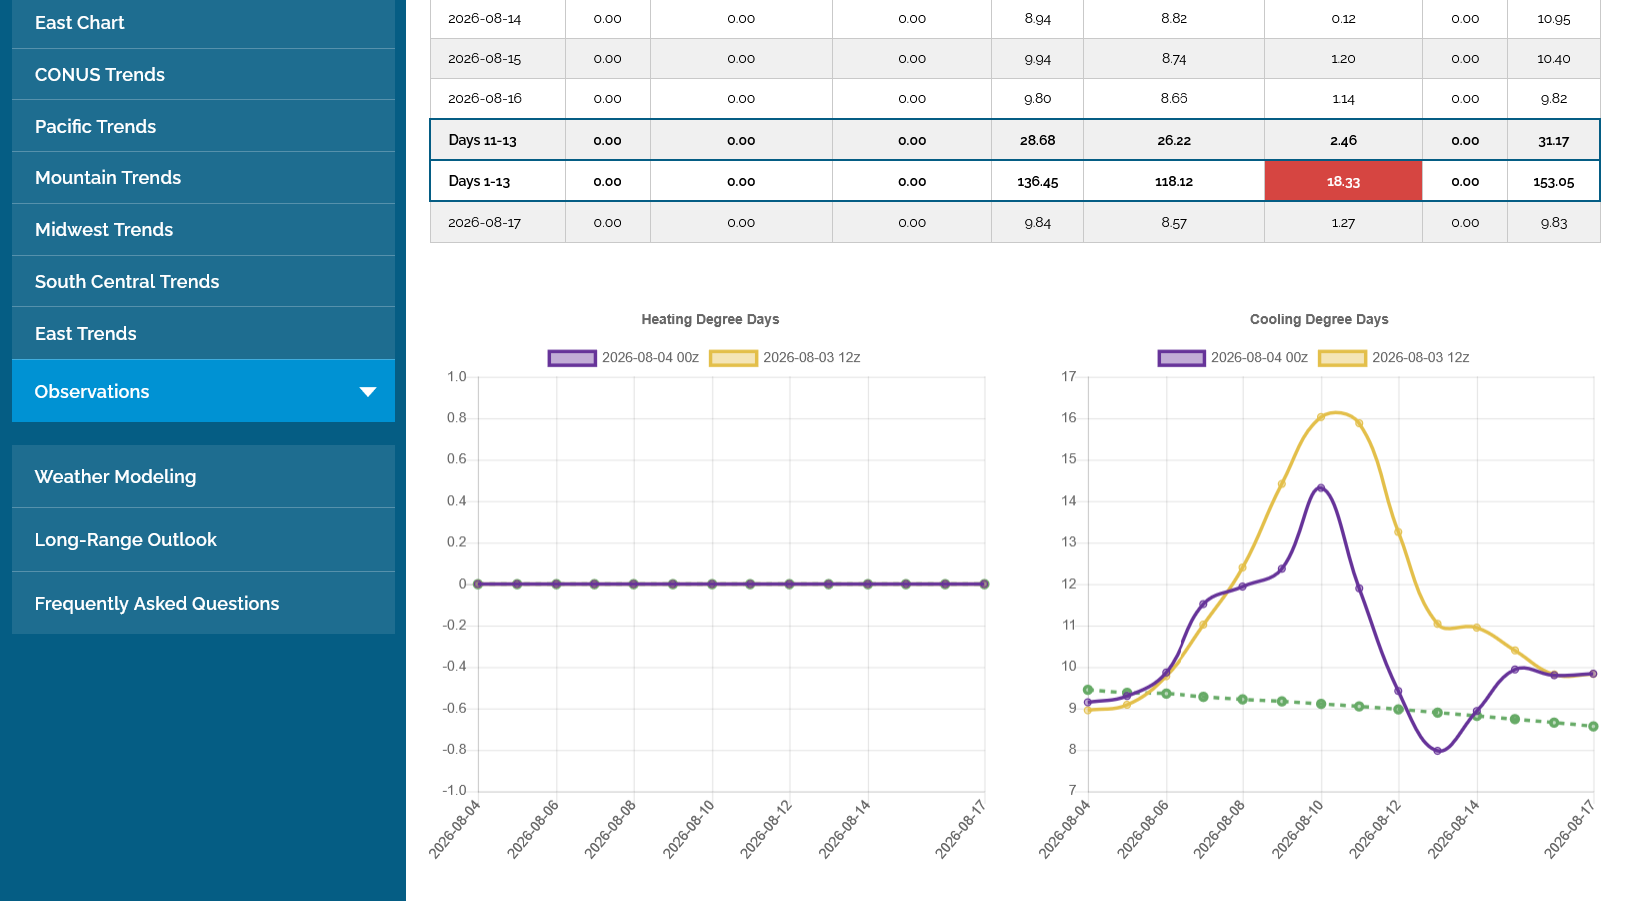
The overnight guidance took out a tremendous amount of heat for the Cornbelt.
This was the last 0z European Ensemble model for just the Midwest(purple line on the right-previous 1 from 12 hours earlier). Holy Cow! -17 CDDs!!!
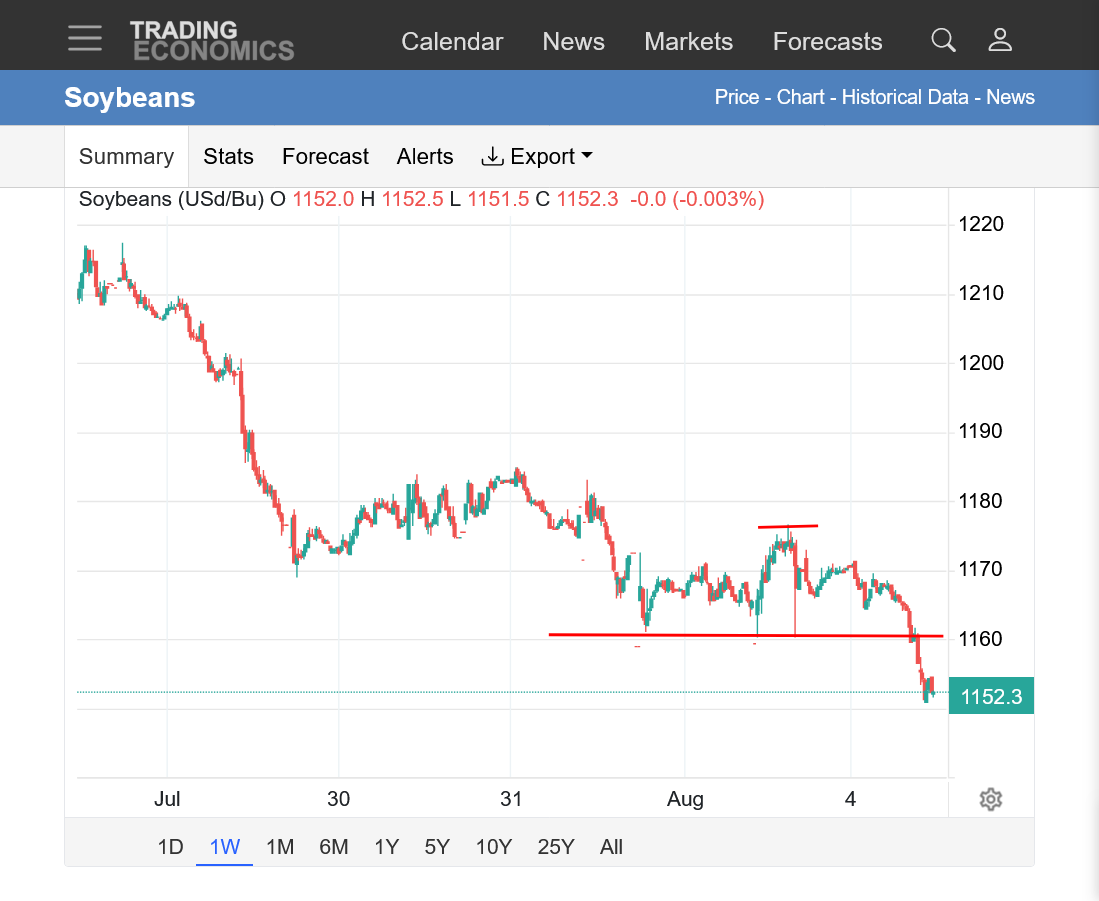
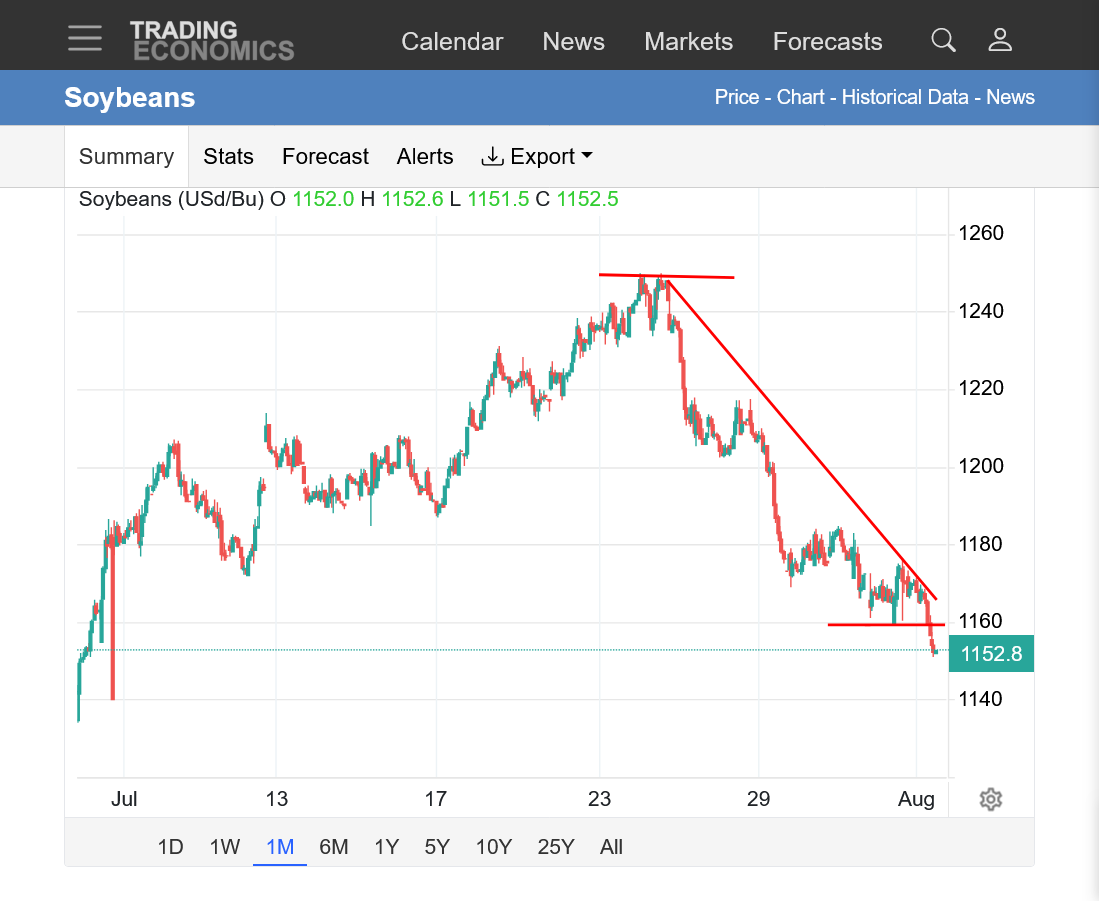
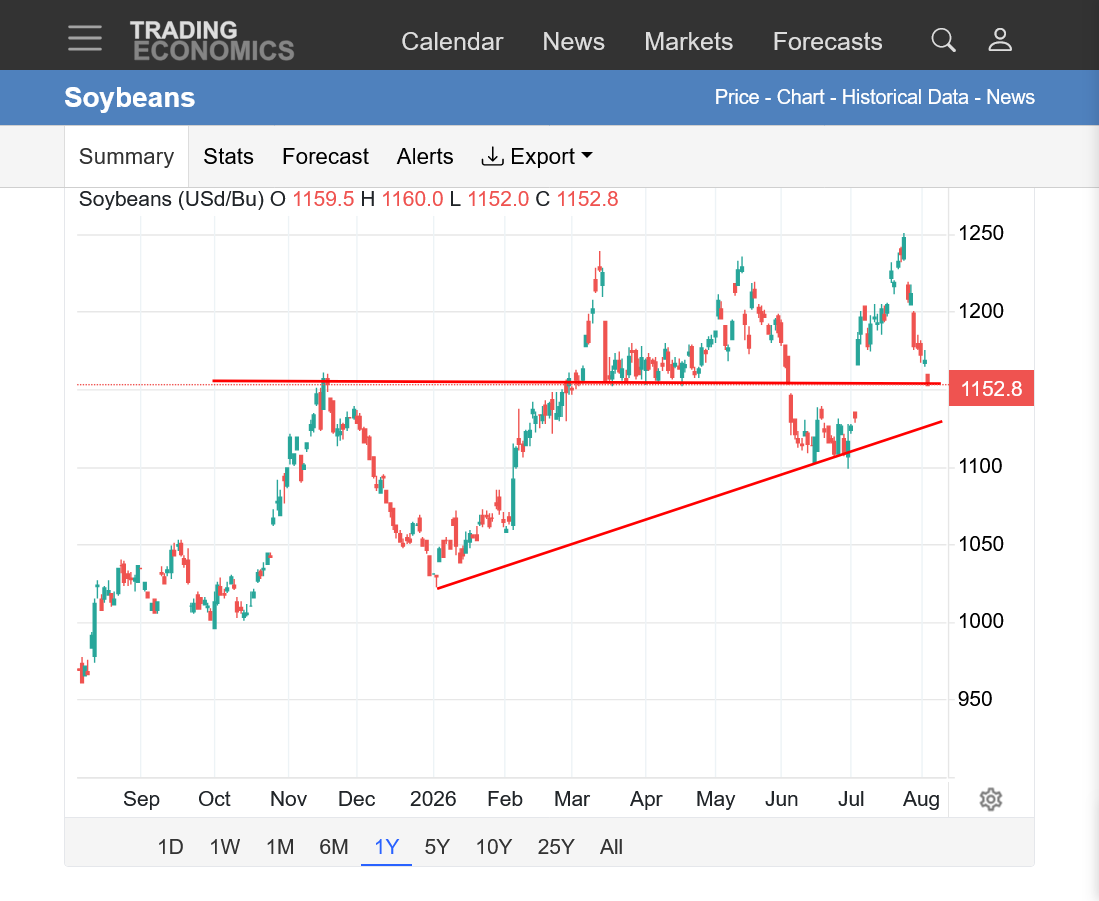
Beans are making new lows for the move after the dead cat bounce on Monday.
https://tradingeconomics.com/commodity/soybeans
1. 1 week: Below the lows Monday. Dead cat bounce shown.
2. 1 month: Downtrend from top. Hot and dry weather forecasts caused the beans to rally well over $1 in 2+ weeks. Increasing rains have pressured prices since then. Successively lower highs. Yesterday's dead cat bounce was another (3rd) bear flag to sell into.
3. 1 year: Uptrend still intact. Potential support in this area.
Re: Re: Re: : : Grains 7-25-26
By tjc - Aug. 3, 2026, 8:12 p.m.
You had a HUGE advantage years ago--now you must anticipate THEIR weather--over sold/bought, cycles, RSI, %R, or AT LEASAT a combination of techs AND then your weather. Did you not 'observe' lack of rain? ON FRIDAY, just before close, I ignored rain/weather, then capitulated OH SO CLOSE TO THE BOTTOM--should have slept in!
You always bought/sold based upon your advantage--must rely on at least something else?
+++++++++++++++++++
tjc,
I don't know how it could be any more clear. In my grains and ng posts how the weather is STILL impacting those markets. I post more about this than anything else. Often the most important item. A weather trader can still make a ton of money using this if they just pay attention with an open mind to understand it.
There have been and will always be plenty of other items and it is MUCH more challenging today compared to the 1990's, when I had a satellite dish on my roof getting weather information 30 minutes faster than the market and it was like taking candy from a baby but weather markets still exist today and readers at MarketForum have been treated to a learning experience this Summer on how that works.
Re: Re: Re: Re: : Grains 7-25-26
By metmike - Aug. 3, 2026, 11:37 a.m.
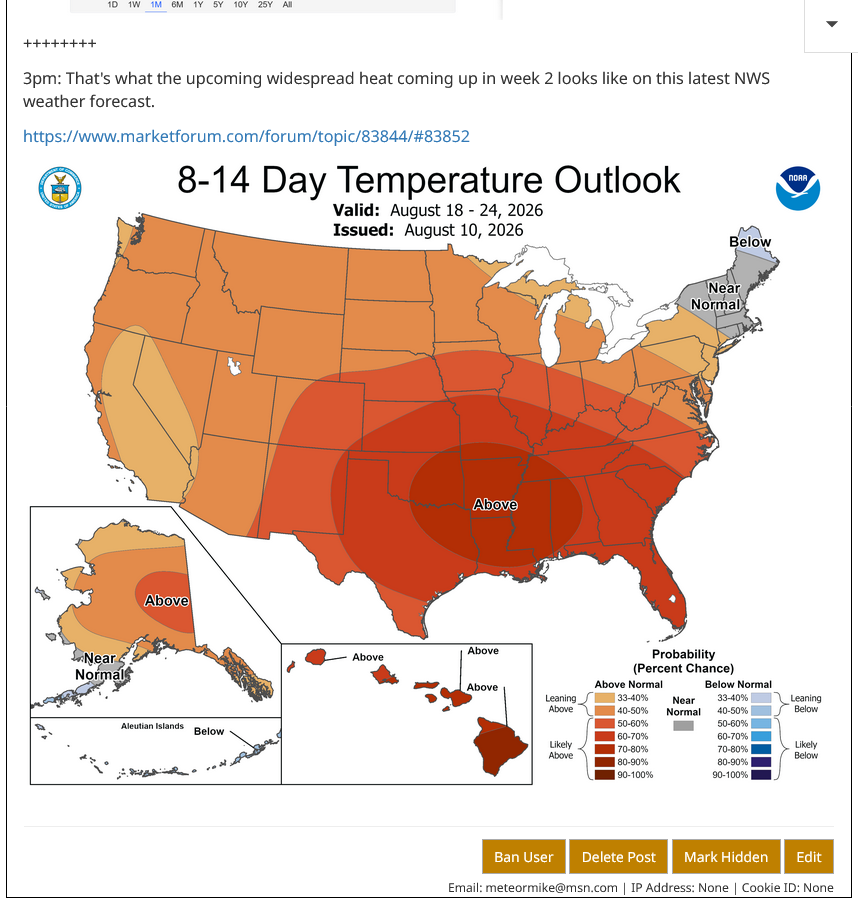
The NWS dialed in that cooler overnight change to the weather models by shifting the heat much farther south in their week 2 forecast on Tuesday as well as keeping the rains in the entire Cornbelt and ADDING rains farther south to it.
https://www.marketforum.com/forum/topic/83844/#83852
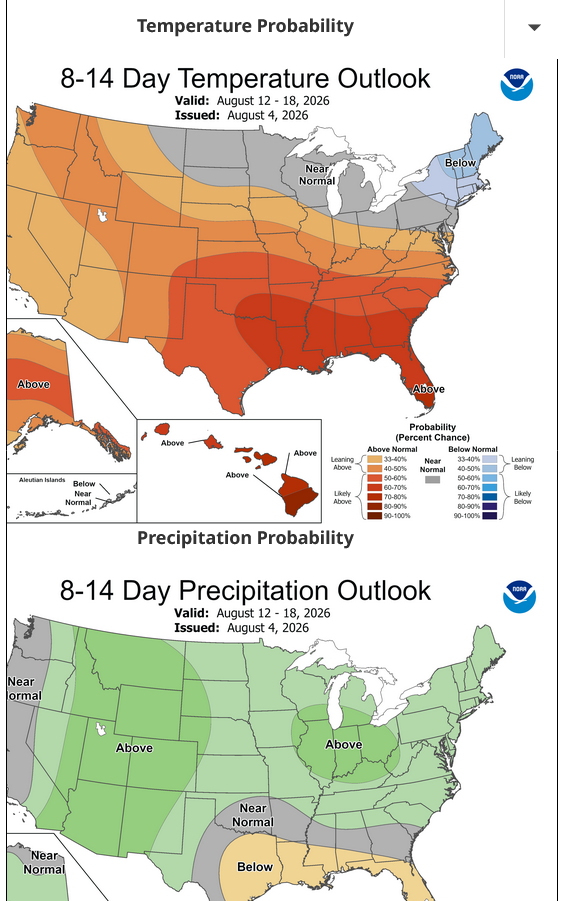
Beans had their lowest close since before the July 4th weekend. After that weekend they started the new week/Monday, July 6th with 40c+ gains because of the weather pattern change that catapulted them higher during July!
Grains/USDA report 6-30-26
31 responses |
Started by metmike - June 30, 2026, 3:39 p.m.
https://www.marketforum.com/forum/topic/121257/
+++++++++
Re: Re: Re: Grains/USDA report 6-30-26
By metmike - July 5, 2026, 8:18 p.m.
++++++++++++
The hot and dry weather in July reduced the crop size too much for us to go back to the price we traded at BEFORE the July 4th weekend!
However, August is the key month for pod fill of soybeans and the market has been responding to expectations for favorable weather, especially abundant rains.
The weather can change quickly. Those statements only apply to Tuesday, August 4, 2026. Historically, the soybeans often put in a significant short term low immediately after the release of the August crop report. Especially if it's a bearish report in a market that thinks the USDA is much too high.......... with a spike low and reversal and the weather forecast is dry.
Then crash lower in September ahead of and during early harvest.
Each year is different but it seems hard to imagine that the lows for Summer and maybe the year are not in for both corn and beans!
https://charts.equityclock.com/soybeans-futures-s-seasonal-chart

Corn seasonals have changed a great deal in recent years. Incredibly they now GO UP during harvest after an early August low!!!! This is based on the most recent 20 years. Before that, corn would usually experience extreme harvest pressure on prices.
I will guess that much of this has been from yield reducing weather in the 2nd half of the growing seasons recently and actual yield reports from the combines being MUCH LESS than expected.
So the August crop report is the biggest crop yield/supply of the year from great weather earlier in the season and it just keeps shrinking after that because the market is usually much smarter than the USDA crop reports which have been extraordinarily too bearish, especially in the Fall/early Winter in 2024.
https://charts.equityclock.com/corn-futures-c-seasonal-chart

By metmike - Jan. 10, 2025, noon
EXTREMELY BULLISH!!!!!!!!
++++++++++++++=
The 12z European model comes out AFTER the grains close.
1. This was the total 15 day rain anomaly map from the overnight oz run. Above average rain almost everywhere in the Cornbelt
2. This was the last 12z run, latest model. Very similar with even heavier rains in the blue shades that represent 2+ inches above average.
3. Total amounts from another provider/source that uses crummy colors for rain.


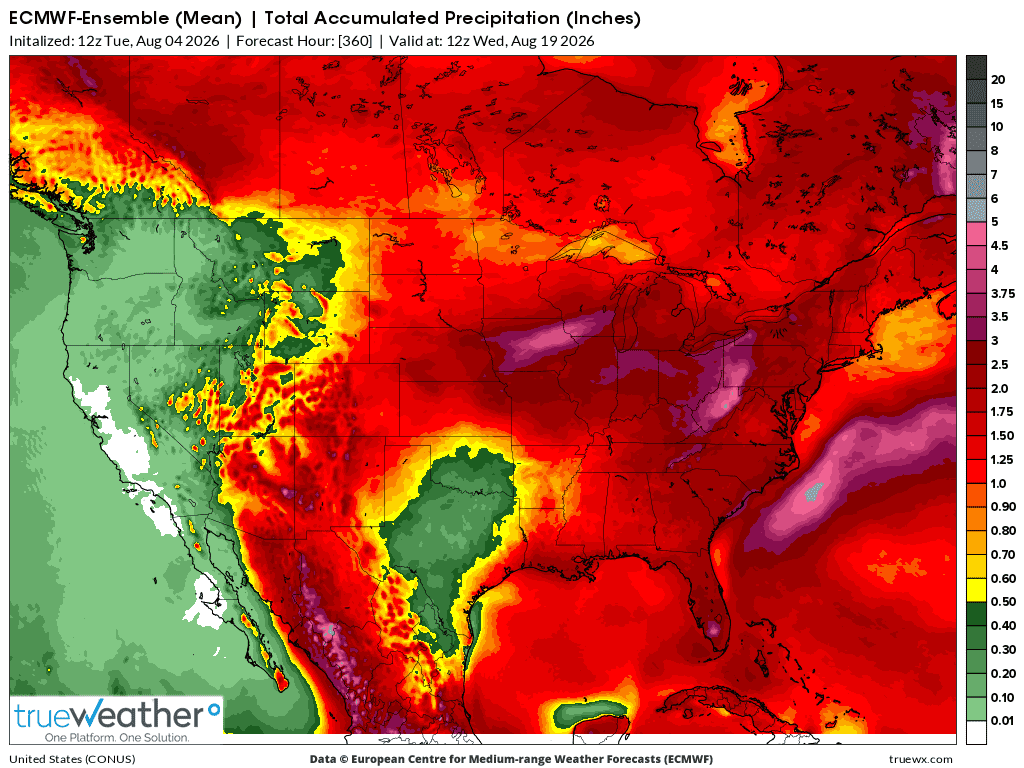
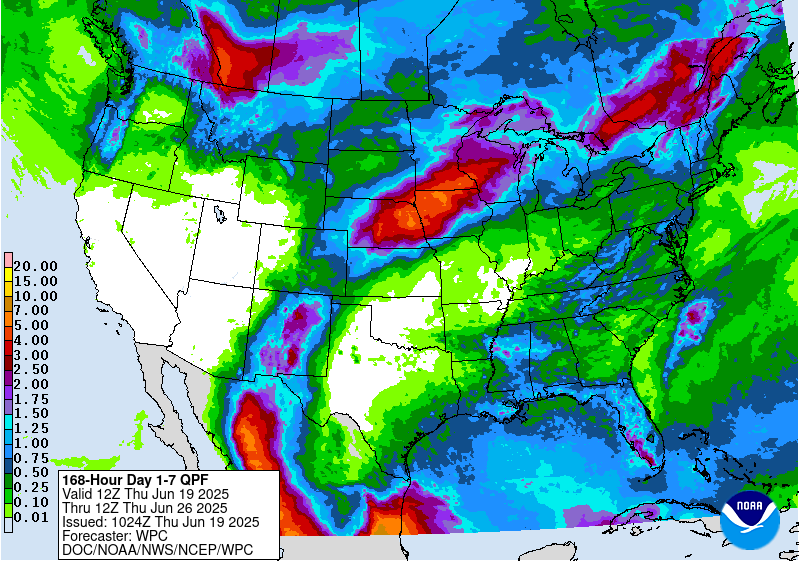
7 Day Total precipitation below:
http://www.wpc.ncep.noaa.govcdx /qpf/p168i.gif?1530796126
Corn is down near the lows from Monday. Beans continue to make new lows every day this week because August is their key developing month and the August weather turning BEARISH is the reason for this move lower, NOT technicals.
Rains increasing in the forecast are increasing the size of the crop and increasing estimates of production for traders that are using price to asses the value of that crop. The bigger it is, the lower the price. The smaller it is, the higher the price. The price soared higher in July, not because of technicals but because of HOT and DRY forecasts reducing the size of the crop.
At some point, everybody that wants to sell on the new BEARISH pattern will be short and the move will be exhausted at an impossible to predict point that could be today or it could be a week from today.........unless the weather forecast changes, then it will be THAT day.
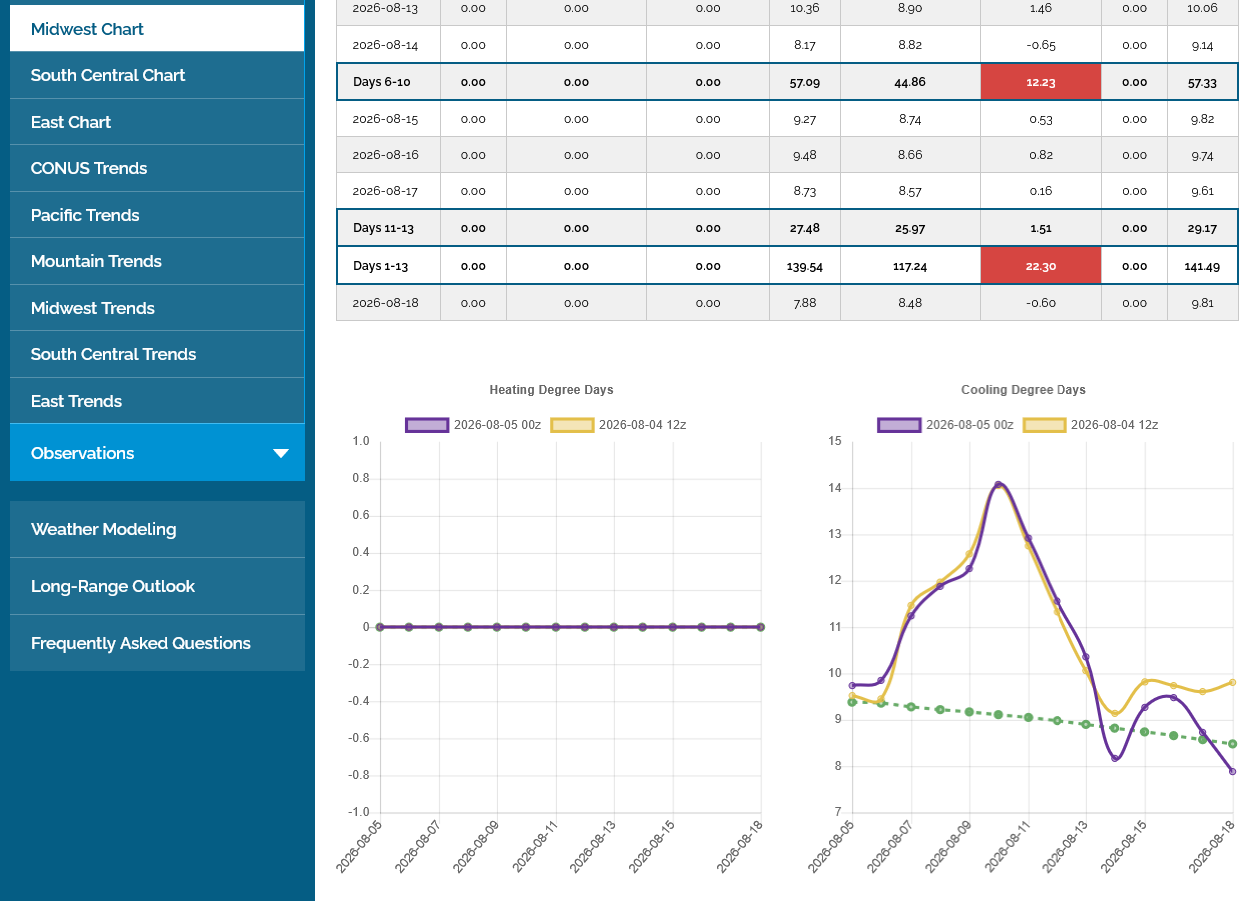
The forecast overnight for the Cornbelt got a little bit cooler yet in week 2(-2 CDDs):
Midwest CDDs below. Purple was the line from the last 0z EE run).
Stone X Estimates corn 184.8 above USDA last report
BIG Corn Yield Estimates! How Could the Balance Sheet Be Impacted? - YouTube
Excellent contribution, cutworm!
Not sure if this is readable.

++++++++++++
The market could decide to start trading next Wednesday's key crop report(August 12, 2026) after dialing in all the bearish weather.
The easy money was already made on the short side from the initial BEARISH weather pattern change and huge price/move down. Probably most of that is dialed in. I have no idea where we go from here but MOST importantly, when I don't know, I don't wild guess using speculative metrics and put on trades based on guessing because I DON'T NEED TO BE IN THE MARKET for the action.
Be selective in your trading.
Use the highest confidence trades and increase size based on confidence. Spend most of your time watching, analyzing and waiting for those times. You will miss tons of trades but the ones you pick will have a much higher % being winners and less account churning, less fees and less emotional draining and less losers.
Patience and confidence, along with analysis of the CORRECT elements that matter to the Composite Man from Richard Wyckoff who determines price.
https://medium.com/@Blocksavant/composite-man-ca18c9d2d5a5
++++++++++
But that's just me. Traders can decide for themselves how to trade!
++++++++++++
8am: Thank you Eric for the awesome weather!
Aug 5, 2026: Cornbelt Rains + Cooler Temps | HOT/DRY Southern Plains | New Western US Fires...
https://www.youtube.com/watch?v=JafcrLNiCnE
Thanks, Eric for Thursday's weather.
Aug 6, 2026: Fall-Winter 2026 Historical Analysis of El Niño’s Influence | Western Wildfires/Smoke
https://www.youtube.com/watch?v=5Uy7YQdfT8Q
+++++++++++
No weather reason to be long.
++++++++
Noon:
1. The 12z Canadian ensemble model has been getting pretty bullish late in week 2 for grains and natural gas but its done this before. This was the just updated 12z-Thursday run.
2. Previous 12z run from 24 hours ago.
https://weather.gc.ca/ensemble/charts_e.html?Hour=384&Day=0&RunTime=12&Type=gz


+++++++++++++++++++
These were the CDDs from the last 4 GEFS solutions, 6 hours apart with the purple line being the last 12z run that just came out. Note the HEAT returning late in the period, similar to the end of the Canadian model.
This heat would be in the last 10 days of August which is getting pretty late in the Summer to be the most powerful factor for grains/natural gas but we are in a buying set up because of long lived bearish weather maps to make it potentially significant when that pattern changes to bullish weather.
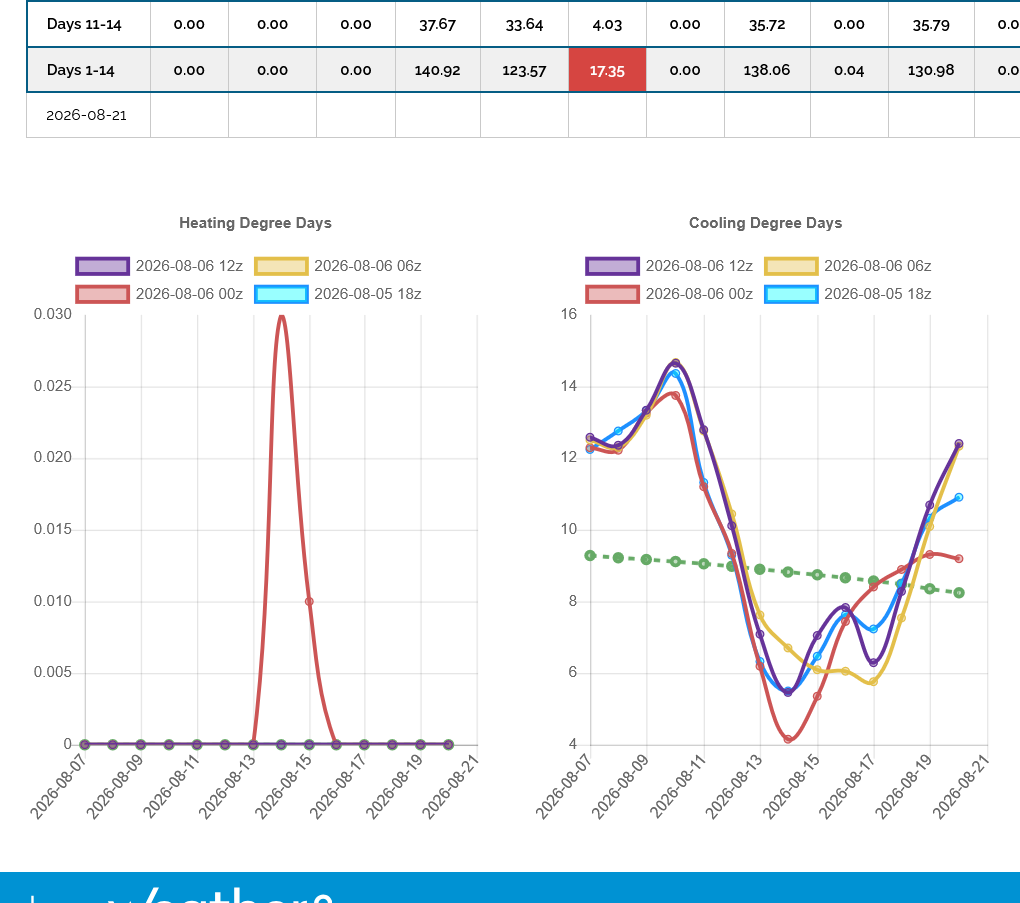
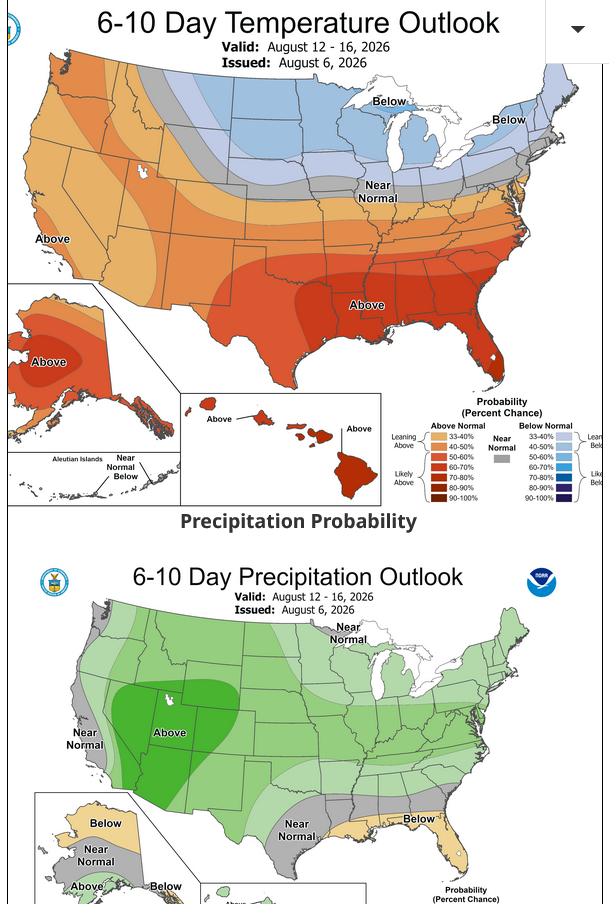
This is what took us to new lows this week......next week's forecast. Doesn't get much more bearish for the price of grains in August IN A WEATHER MARKET.
This has been out there long enough to be mostly dialed in. Huge crop report coming up too. But I don't HAVE to trade for the action without a good reason.
Right now, the WEATHER reason to sell has been exhausted. But the WEATHER reason to buy is not compelling. So having NO POSITION and waiting for a high confidence trade to emerge is what smart traders who do it to make money do.
And when you have high confidence, you don't buy options. Options are for traders that aren't sure and want to give up an advantage(or don't have one-so they should wait until they DO have one) and give up profit potential and give up value to put on a position that they pay out the wazoo for to limit their loss potential.
Options decay in value every day, even if the price is unchanged.
+++++++++++++++++++++
https://insigniafutures.com/futures-options-trading/
One of the key components of a futures option premium value is time to expiration.
Unfortunately for the buyer of an option, time value is always ticking away – decaying away.
Did you Know? – The time value of a futures option will start to drop at a much faster rate as it approaches it’s expiration date.

A bit more heat at the end of week 2 but tons of rain coming up BEFORE THAT to offset it(and the EE model keeps the rains coming in week 2-GEFS turns drier in week 2). Weather that has been dialed in is not powerful enough right now to be the most important driver of price.
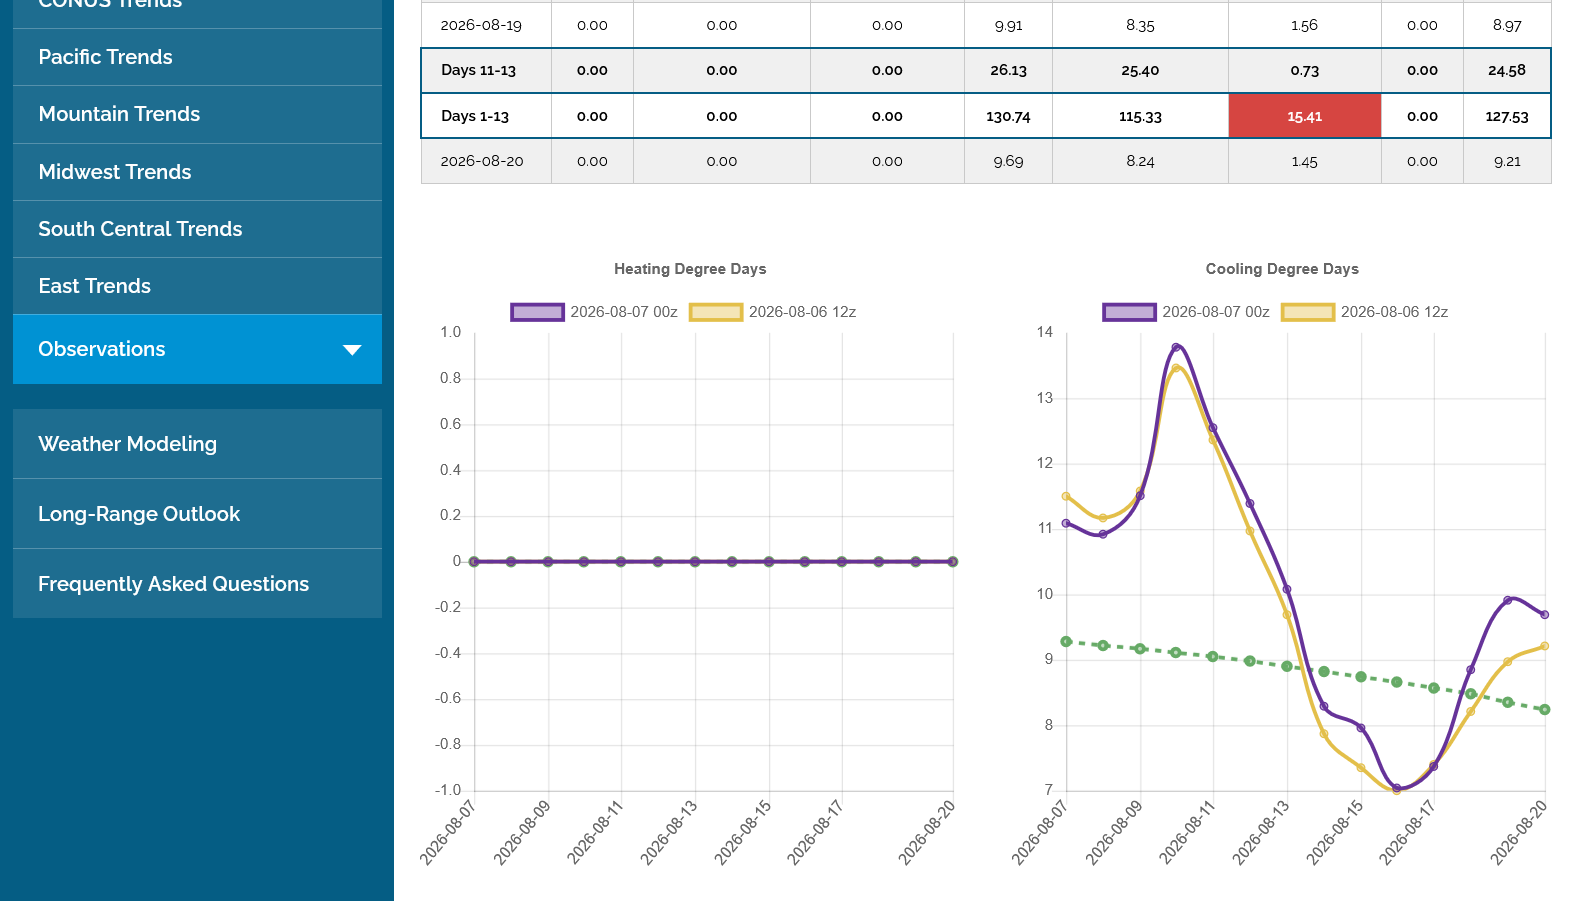
This was the last 0z European Ensemble model in purple for just the MIDWEST. Temperatures are actually BELOW average early in week 2 before they rebound late in the period.
We can see the spike higher in heat near term is crushed with a huge surge of cooler air that the market dialed in on Tuesday(3 days ago) when it showed up in the weather forecast on Monday Night and took beans to new lows on Tuesday.
++++++++++++++++
A bird in hand(huge rains in week 1) is worth more than 2 in the bush(potentially hotter/drier late in week 2) at this stage of the growing season.
There is no reason to even consider a weather trading position, especially on Friday, which means the market will be closed for 2+ days. It seems unlikely that the weather can change enough between now and Sunday, however, we have an unprecedentedly strong El Nino that could SURPRIZE US because the El Nino/tropical Pacific ocean and the atmosphere are coupled at the moment, which is unusual in August. This means that the El Nino signal from record warm August temperatures in the east/central tropical Pacific could teleconnect downstream in a way that models are not able to predict well.
I would say that the most likely unexpected negative impact could be from EXCESSIVE RAINS, especially during harvest. This is NOT a forecast, just something to be alert for in case it does emerge.
There is a huge August USDA report next week that will likely be the center of attention.
7 Day Total precipitation below:
http://www.wpc.ncep.noaa.govcdx /qpf/p168i.gif?1530796126
++++++++Thanks to Eric for his Friday weather discussion!
https://www.youtube.com/watch?v=c2UHtWsB2kI
+++++++++++++++
Weather's importance to the size of the 2026 corn and soybean crop is fading fast. However, beans will be filling the next month where rain=good and corn kernels also still filling with cool=good, hot=bad(too fast-heat fill).
5pm:
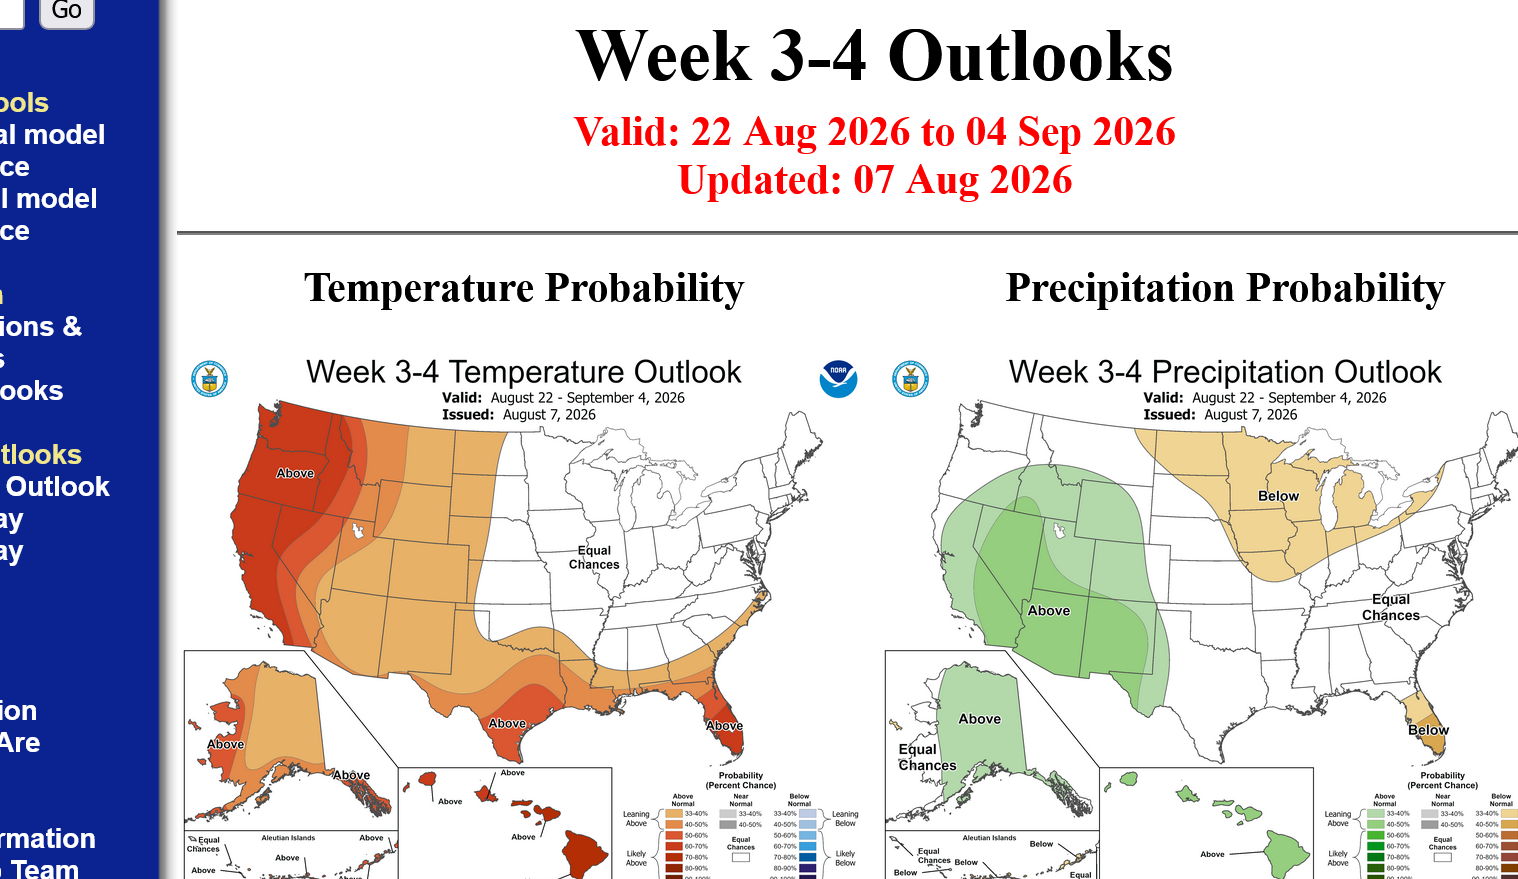
https://www.cpc.ncep.noaa.gov/products/predictions/WK34/
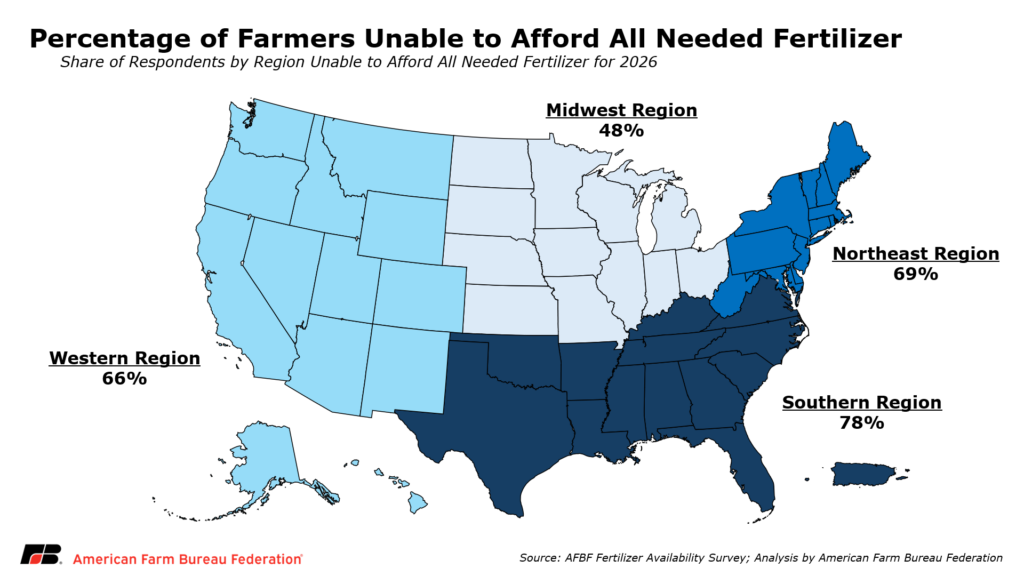
https://www.farmaid.org/issues/challenges-family-farmers-face/tracking-the-farm-economy-in-crisis/
++++++++++
Re: Re: Re: Re: : Soaring fertilizer prices By metmike - Aug. 7, 2026, 11:07 p.m.
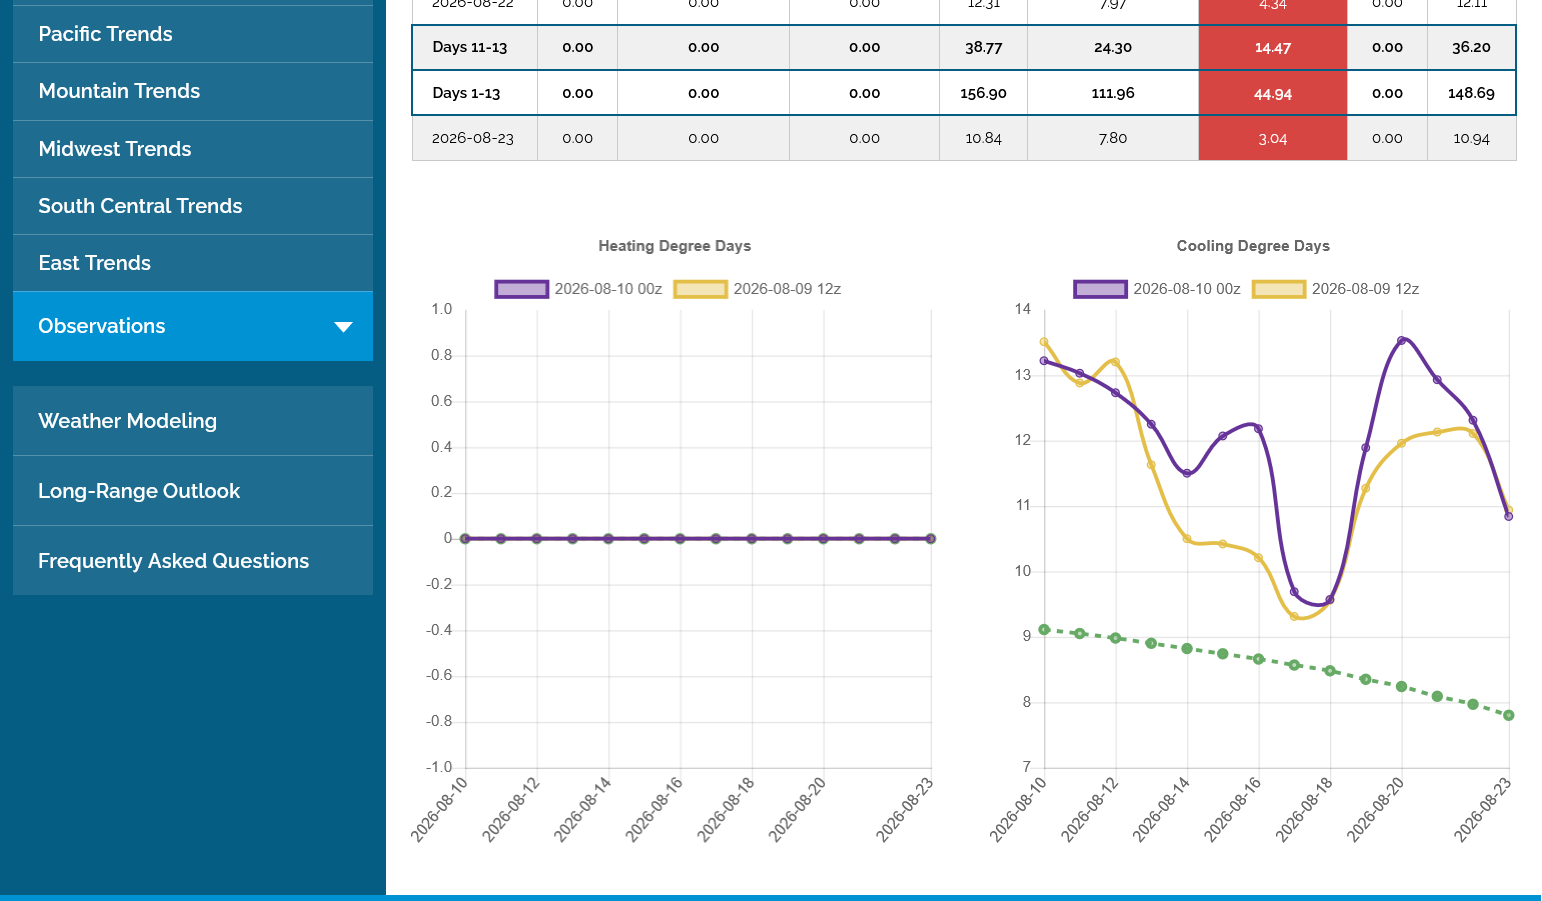
The Midwest CDDs added a whopping +8 CDDs overnight. The purple line on the right was the last 0Z European Ensemble model. The other line was the previous run 12 hours earlier, The dashed green line is the slowly dropping climatological average that our August weather will NOT be following with the upcoming heat........but each year is different. This much heat in the forecast is BULLISH, especially for corn, even with good rains because it results in heat fill(for corn).
Expectations for the USDA crop report on Wednesday matter a great deal here.
++++++++++++++
Re: Re: Re: Re: Grains 7-25-26
By metmike - July 28, 2026, 8:20 a.m.
The heat coming up thru August will take away yield from corn, even in areas with ample rain because of heat fill.
Here's our best thread for explaining and illustrating this principle:
HeatFill for Corn
Started by metmike - July 14, 2023, 2:47 p.m.
https://www.marketforum.com/forum/topic/97257/
+++++++++++++++=
Regardless of this bullish heat and drying trend in week 2, its difficult to get too bullish with this much rain in the week 1 part of the forecast.
7 Day Total precipitation below:
http://www.wpc.ncep.noaa.govcdx /qpf/p168i.gif?1530796126
+++++++++++
This is a ring of fire type pattern with perturbations around the periphery of a heat dome, similar to 2010.
This is in the heat fill thread linked to above but I wanted to stress it even more because of the similarity to 2010.
https://www.marketforum.com/forum/topic/86953/#87109
https://www.pioneer.com/us/agronomy/high-night-temps-yield.html
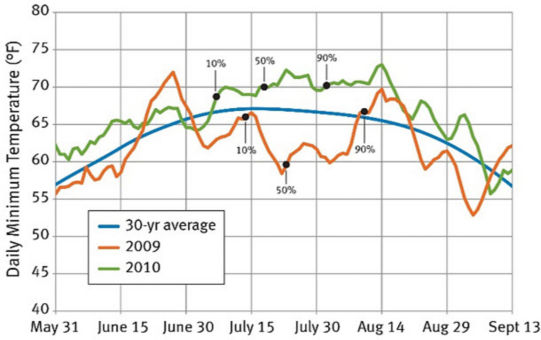
Figure 1. Daily minimum temperatures (7-day moving average) for Des Moines, IA, in 2009 and 2010, and 30-yr average minimum daily temperatures (1981-2010). Approximate dates of 10%, 50%, and 90% silking in Iowa in 2009 and 2010 based on USDA crop progress reports.
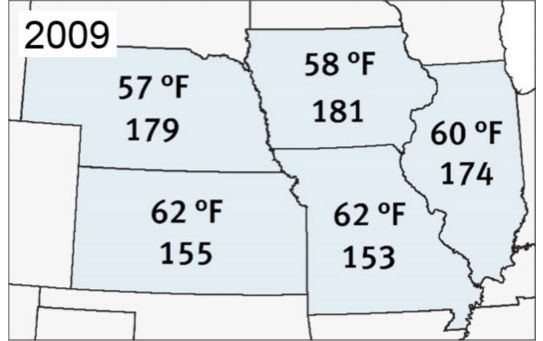
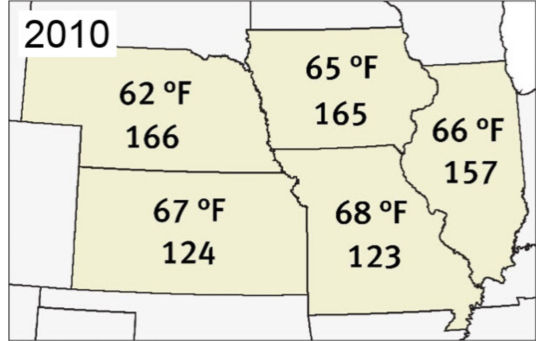
Figure 2. Average minimum temperatures experienced in July-August of 2009 (top) and 2010 (above) and average yields (bu/acre) in Iowa, Illinois, Missouri, Kansas and Nebraska. Data from NCEI NOAA, USDA NASS.
+++++++++++++++++++++++++++++++++++++++++++By metmike - July 14, 2023, 3:01 p.m.
ICM News
by Roger Elmore, Department of Agronomy
"October corn yield forecast for Iowa dropped to 169 bushels per acre, a significant reduction from the August and September forecasts of 179 bushels per acre (see October USDA-NASS forecast). If realized, 2010 yields will rank sixth among the last seven years, higher only than the yields of 2006 (166 bushels per acre). Numerous published and anecdotal yield reports substantiate lower than expected yields this year.
In previous 2010 Integrated Crop Management News articles, we've addressed 2010 conditions and the possibility of reduced yields resulting from rapid crop development following silking (see September 28 article). Statewide Growing Degree Day accumulations were 116 percent of normal during most of the seed fill period — silk to dent — this year."
Table 2. Effect of temperature on grain fill duration, grain weight per plant and kernel number (Badu-Apraku et al., 1983).
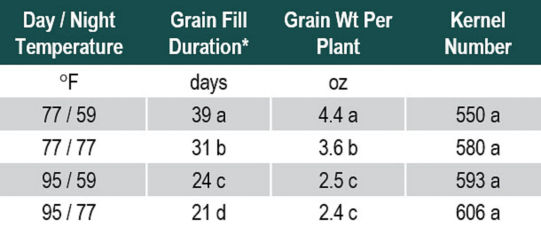
https://agcrops.osu.edu/newsletter/corn-newsletter/warm-nights-may-impact-corn-yield
++++++++++
8:35 am: As we often see on the day session open, the funds had a different idea than the overnight traders that, in this case were pretty bullish. After solid gains, CZ dropped to lower and SX lost all the gains.
Last week's U.S. corn export inspections topped all trade estimates, and the volume was the largest for any August week on record. Spain was the top destination last week, accounting for 21% of total corn inspections.
++++++++++
2025/26 corn inspections continue defying seasonality, while soybeans have maintained a respectable pace for months, hardly slipping below average weekly volumes. Wheat, however, hasn't had the best start to 2026/27. USDA has 2026/27 U.S. wheat exports down ~15% from 2025/26.
+++++++++++++
Corn conditions in France dropped for an 8th consecutive week through early August amid a historically hot and dry summer. The crop was rated just 31% good-to-excellent to start this week. The French farm ministry on Friday forecast the corn crop at 9 mmt, down 35% yr/yr.
The trade sees U.S. corn and soybean yield coming in slightly below USDA's trendlines in Wednesday's report. They would also be lower than 2025's yields. Analysts are NOT predicting acreage drama, which headlined the August 2025 report. Is that a safe bet?
++++++
U.S. corn conditions are unchanged from last week, but soybeans moved down 1 point. Spring wheat conditions unexpectedly dropped 4 points, though last week's spring wheat harvest progress was quicker than analysts thought.
https://www.marketforum.com/forum/topic/83844/#83852
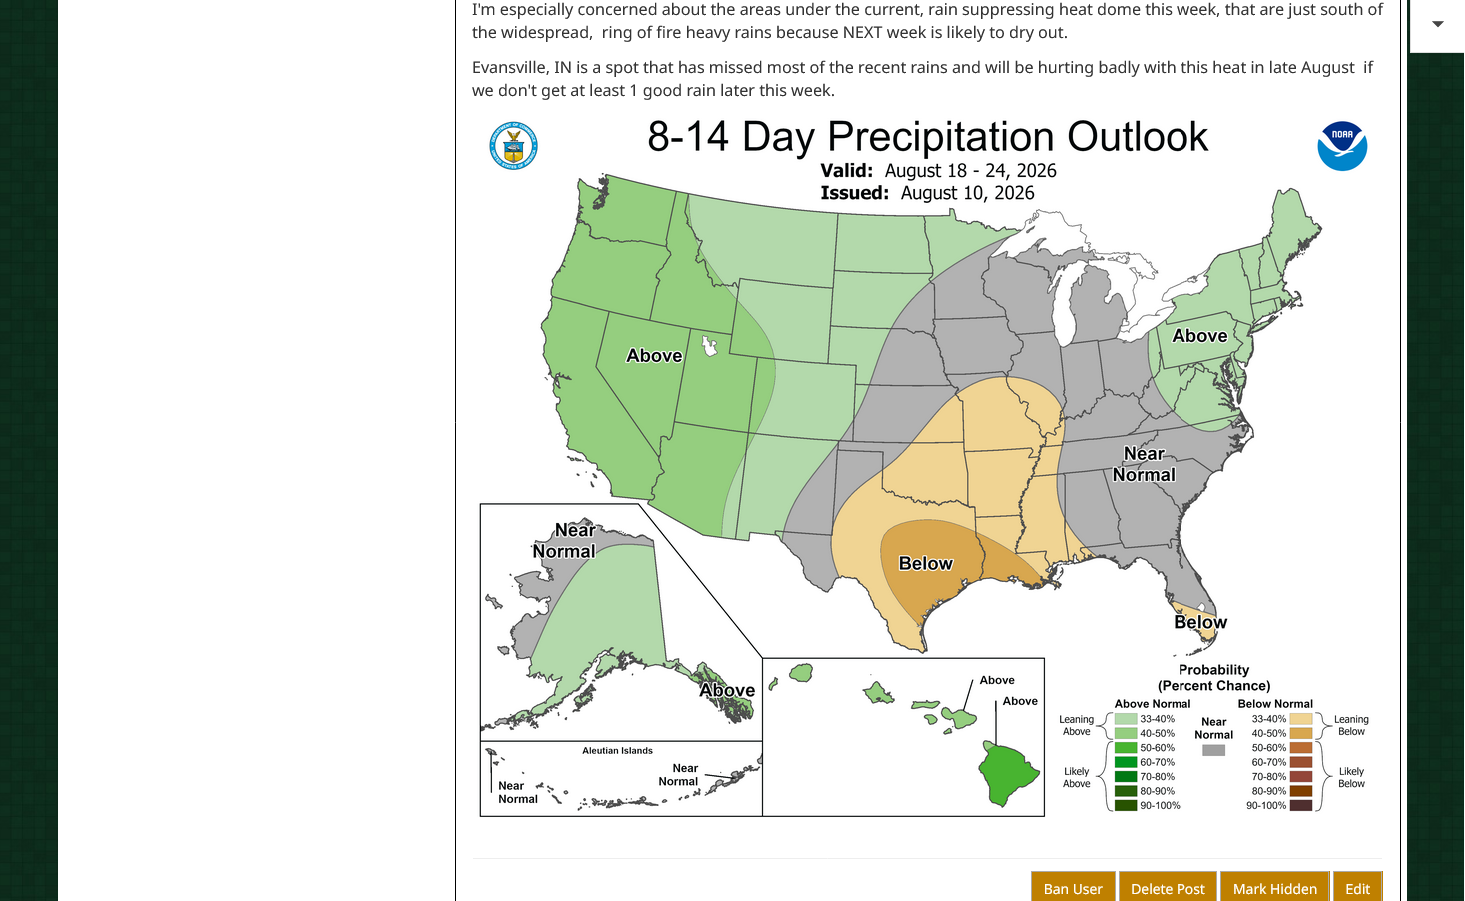
I'm especially concerned about the areas under the current, rain suppressing heat dome this week, that are just south of the widespread, ring of fire heavy rains because NEXT week is likely to dry out.
Evansville, IN is a spot that has missed most of the recent rains and will be hurting badly with this heat in late August if we don't get at least 1 good rain later this week.
Thanks to Matt for Tuesday's internet weather discussion. Who would have thought, 50 years ago that we would have such technology!
Aug 11, 2026: Severe Storm Threat | Flooding | El Niño Enters Forecast | Harvest Forecast
https://www.youtube.com/watch?v=z8gcBjH88qI
++++++++++
Hard to fight this much rain for this much of key Cornbelt terrain in August.
7 Day Total precipitation below:
http://www.wpc.ncep.noaa.govcdx /qpf/p168i.gif?1530796126
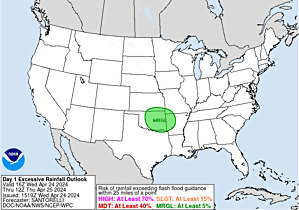
Excessive rains in some places today!
Excessive rain threat.
https://www.wpc.ncep.noaa.gov/qpf/excess_rain.shtml
Current Day 1 Forecast
Get all the comprehensive weather here:
https://www.marketforum.com/forum/topic/83844/
++++++++++++
Positioning ahead of and expectations for the USDA report out tomorrow is big deal today.
DTN yield tour estimates, 178.5 corn, 52.1 beans (starts at 3:43)
Balance sheet example ( at 4:55) Farmers and grain traders should know how this works
Ultra-Processed Foods and Corn Demand (RFK Jr. and Make America Healthy Again)
Thanks very much, cutworm!
Those 2 always have great discussions. I personally think the corn yield at the end of the year will be lower to much lower than expected from too many hot periods(warm/humid nights especially) over too many places. 2010 seems like a decent analog to the current pattern this week.
I'm wrong most off the time but I do not think they will adjust yield down (if at all) much at this report and wait till a later report
cutworm,
You and I agree on most things when it comes to markets but on this one we are almost identical.
I still post our comments from late in the 2024 growing season during the flash drought about the crop being negatively impacted. The USDA didn't catch up to that until the January 2025 report!
By metmike - Jan. 10, 2025, noon
EXTREMELY BULLISH!!!!!!!!
+++++++++
By metmike - Jan. 10, 2025, 12:45 p.m.
+++++++++++++++++
USDA September 12, 2025/Grains
78 responses |
Started by metmike - Sept. 12, 2025, 4:01 p.m.
https://www.marketforum.com/forum/topic/114629/
++++++++++++
With that being the case, it's impossible to expect the USDA to dial in recent changes from changing conditions with accuracy.
They have more information than that rest of us and their weekly crop ratings/conditions seem to do a wonderful job at capturing changes from the previous week.
Extremely BULLISH initial spike higher!
The real bullish numbers were for corn which I strongly agree with from previous comments.
1. A couple of heat waves in the United States with heat fill and untimely hot/dry weather. Lower yields.
2. Europe's corn crop has been decimated by hot/dry weather. Increased corn exports for us!
U.S. corn and soybean yields land below analyst expectations, but harvested area for both crops lands above all pre-report trade estimates.
BELOW: Added to see the trade range for harvested area. The USDA came out 1 million acres ABOVE THE HIGHEST GUESS for Corn. They also came out SIGNIFICANTLY HIGHER THAN THE HIGHEST GUESS for Beans.
Both old- and new-crop U.S. corn ending stock estimates came in below trade expectations, but new-crop soybeans came in heavier than expected on a bigger crop.
The U.S. in 2026/27 is still set to harvest the smallest wheat crop in 56 years, though analysts' predictions ahead of USDA's August report were largely in line with the results.
World wheat supply estimates creep upward from last month on larger crops in Canada & Ukraine. Corn supplies slip with EU's crop down 3.6 mmt, partly offset by Ukraine up 1.8 mmt. The U.S. soybean crop expanded by 1.2 mmt, but global soybean stocks were little changed.
Immediate report reaction: August continues to be the month of surprises, and U.S. harvested acres pull the upset for a second year. At this point, we need to ask why the June survey is suddenly a poor indicator of acres. Corn + soybean plantings at a big record 183.5M acres
metmike: I added the data above with the pre report range for the trades estimate for harvested acres, graphic #2.
Note the HUGE drops in the places that had adversely hot/dry weather this year!
U.S. corn yield is set to fall 3% from last year's record, though it would still be the second 180+ reading in history. The western Corn Belt is doing markedly worse than last year, though top grower Iowa and portions of the east and south are projected to outperform 2025.
U.S. soybean yield is projected to fall shy of last year's record, though it would still be the second best ever. Top producer Illinois is looking for a record 67 bpa, but western states could fall well short of 2025's results.
Heavy rains shift farther west where they are needed more:
7 Day Total precipitation below:
http://www.wpc.ncep.noaa.govcdx /qpf/p168i.gif?1530796126
https://www.cpc.ncep.noaa.gov/products/predictions/threats/threats.php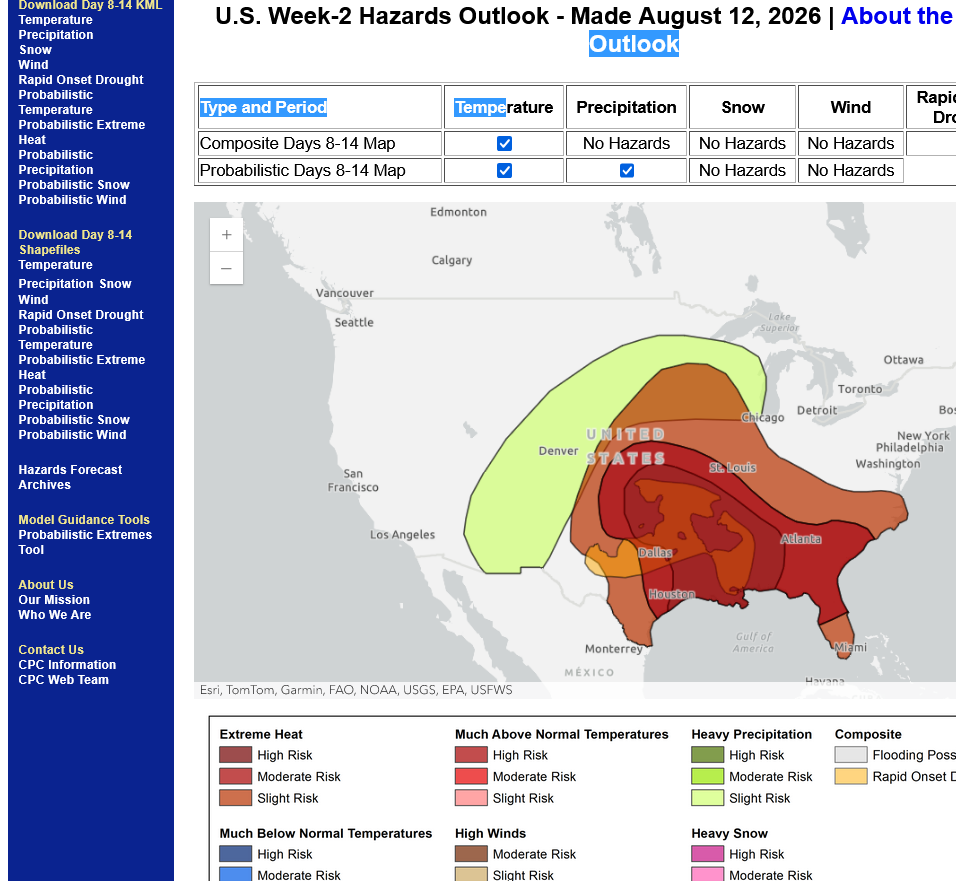
Despite the excessive rains recently in IN that did damage, the market is still in a big picture "rain makes grain" mode with rains increasing farther west where they will be more beneficial. See the previous page.
In addition, especially for corn, the temperature forecast dropped this morning.
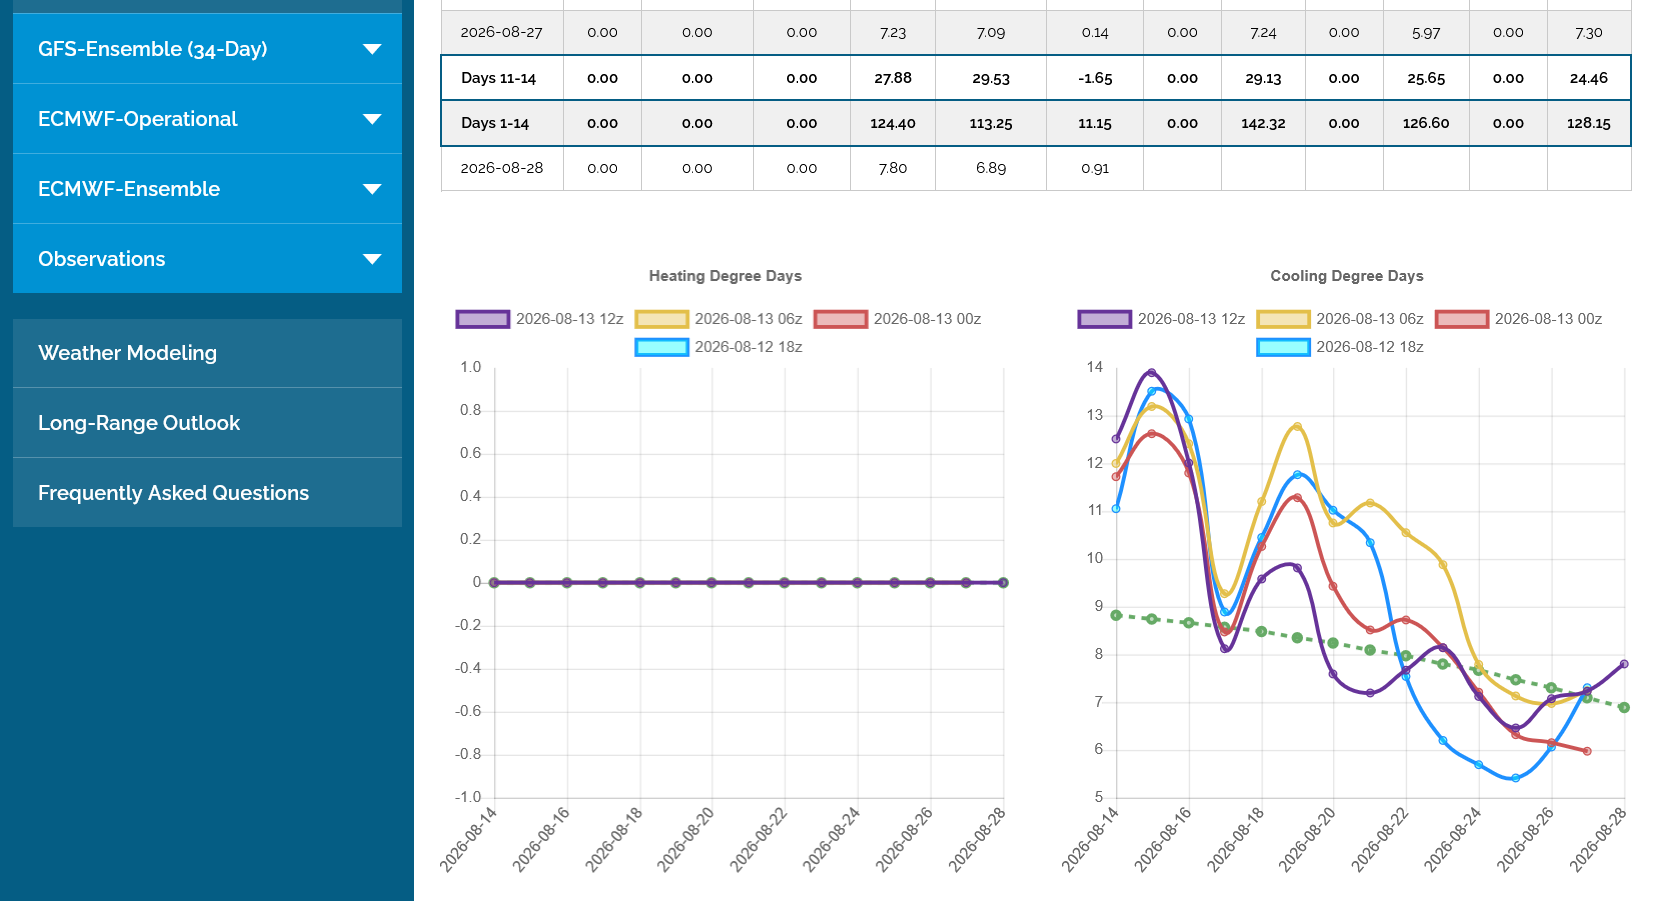
Note the CDDs for just the Midwest below from the last 12z GEFS in purple. The previous 6z run in brown was hotter but this last run was a whopping -18 CDDS compared to that.
This big cooling trend will reduce heat fill for the Cornbelt, with near average temperatures. This likely put pressure on corn prices after yesterday's bullish shock from the USDA!
The huge increase in acres for C and S was a shocker yesterday that offset the yield reduction for corn. I would think that in a year with record acres like this, we are talking about MARGINAL, low production land that reduces the average yield. That probably was part of their lower yield surprise.
+++++++++++++++++
Revisiting the USDA report yesterday!
BELOW: Added to see the trade range for harvested area. The USDA came out 1 million acres ABOVE THE HIGHEST GUESS for Corn. They also came out SIGNIFICANTLY HIGHER THAN THE HIGHEST GUESS for Beans.
++++++++
Thanks to Matt for his meaningful discussion this morning!
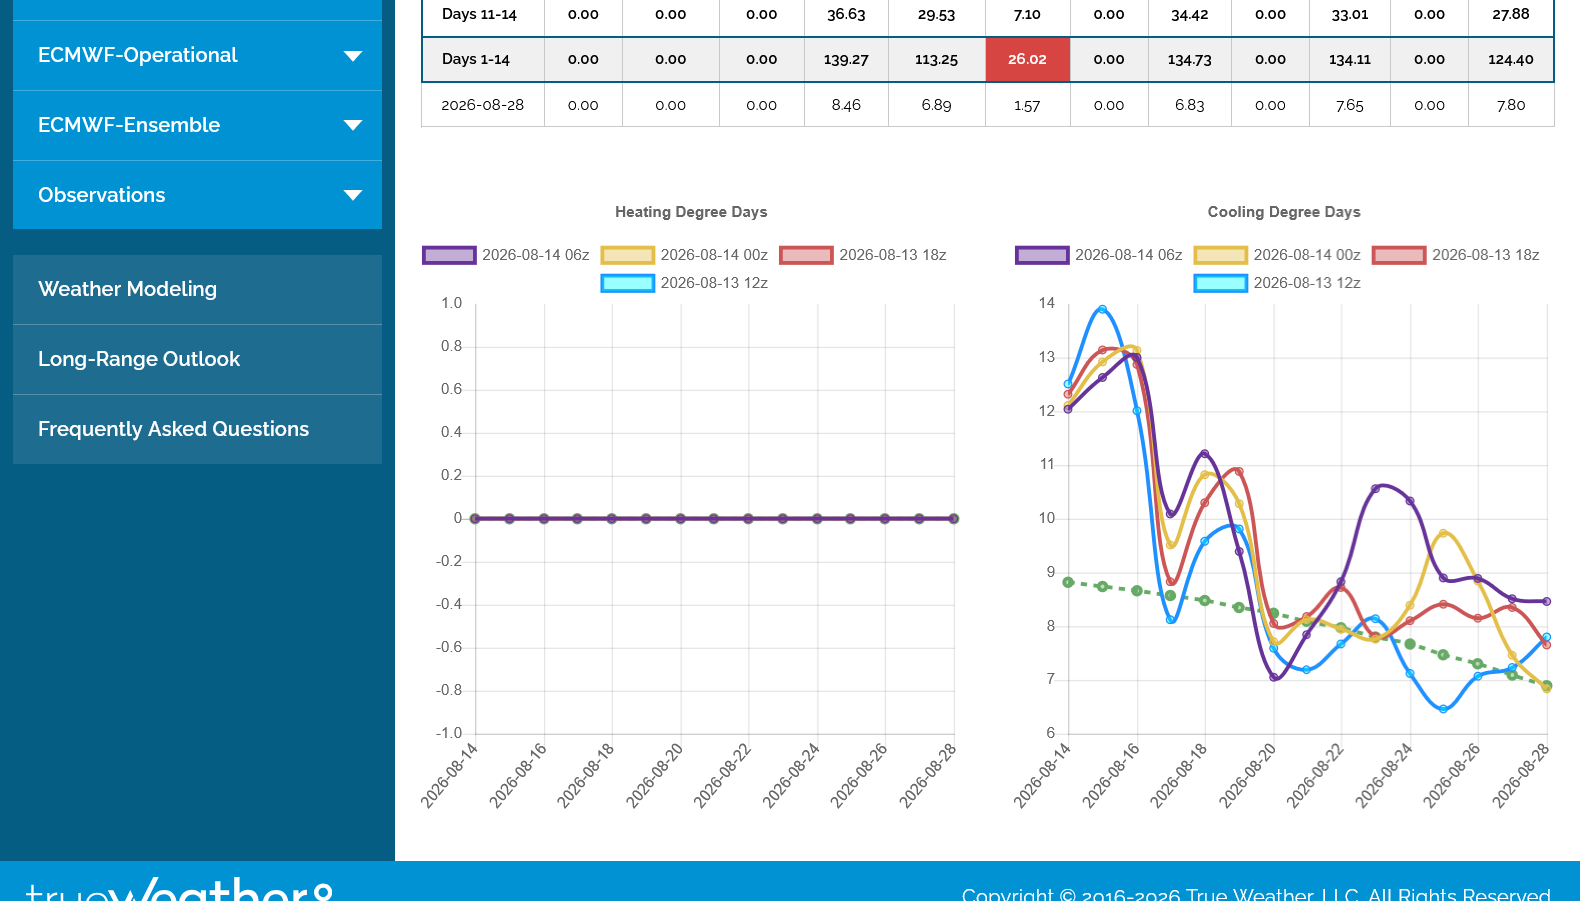
A bunch of heat was added to the forecast since yesterday. The last 6z GEFS for just the Midwest is in purple below. These runs were every 6 hours.
The coolest one in blue was from Thursday morning.
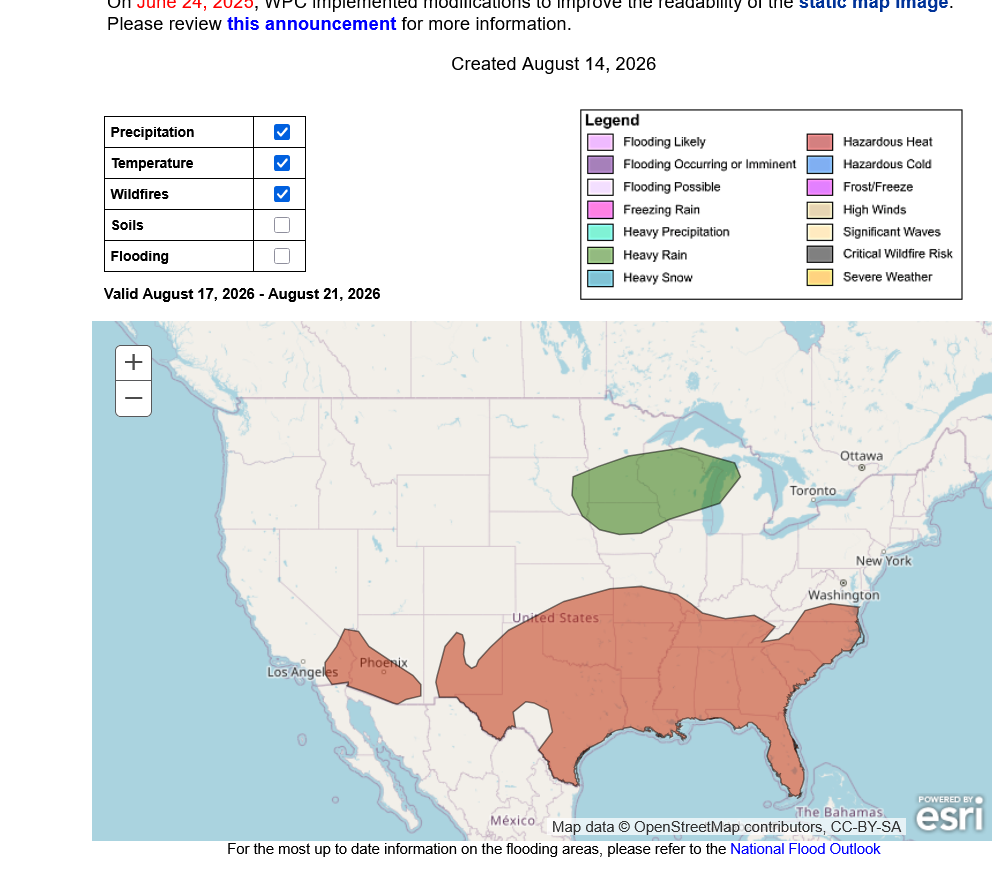
5pm: Extreme weather next week.
https://www.wpc.ncep.noaa.gov/threats/threats.php
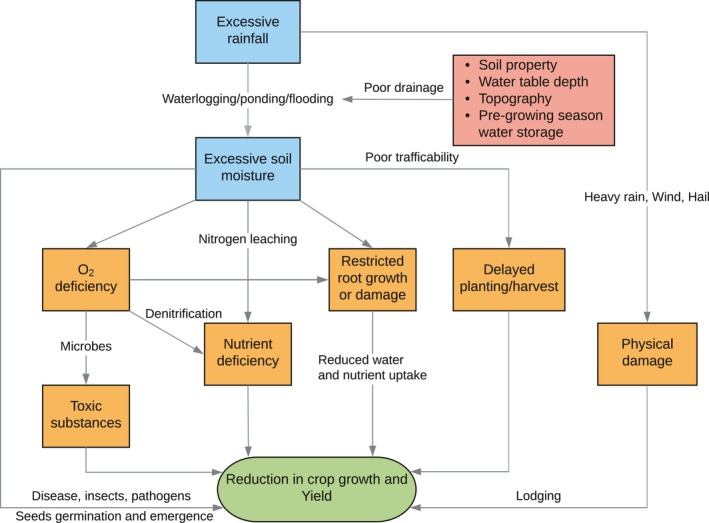
I have been all over the internet looking for the answer, "Does 6-10 inch rainfall in just a few days in August enhance or hurt grain production ?"
Has anyone on this site found agronomy researched response? Univ Purdue, Illinois, wherever?
(FYI, long 10 sept corn exercised corn contracts)
Tenant 'concerned'. I80/Il Rt 71 location---------beautiful corn crop 7 days ago! Sitting in saturated soils, not submerged. Off and on rain events predicted this week with no significant heat spell.
More concerned for my young tenant, my position, based upon my perception of a new daily grain cycle, should/will be profitable.
Any Agronomy answers out there?
https://pmc.ncbi.nlm.nih.gov/articles/PMC6850578/
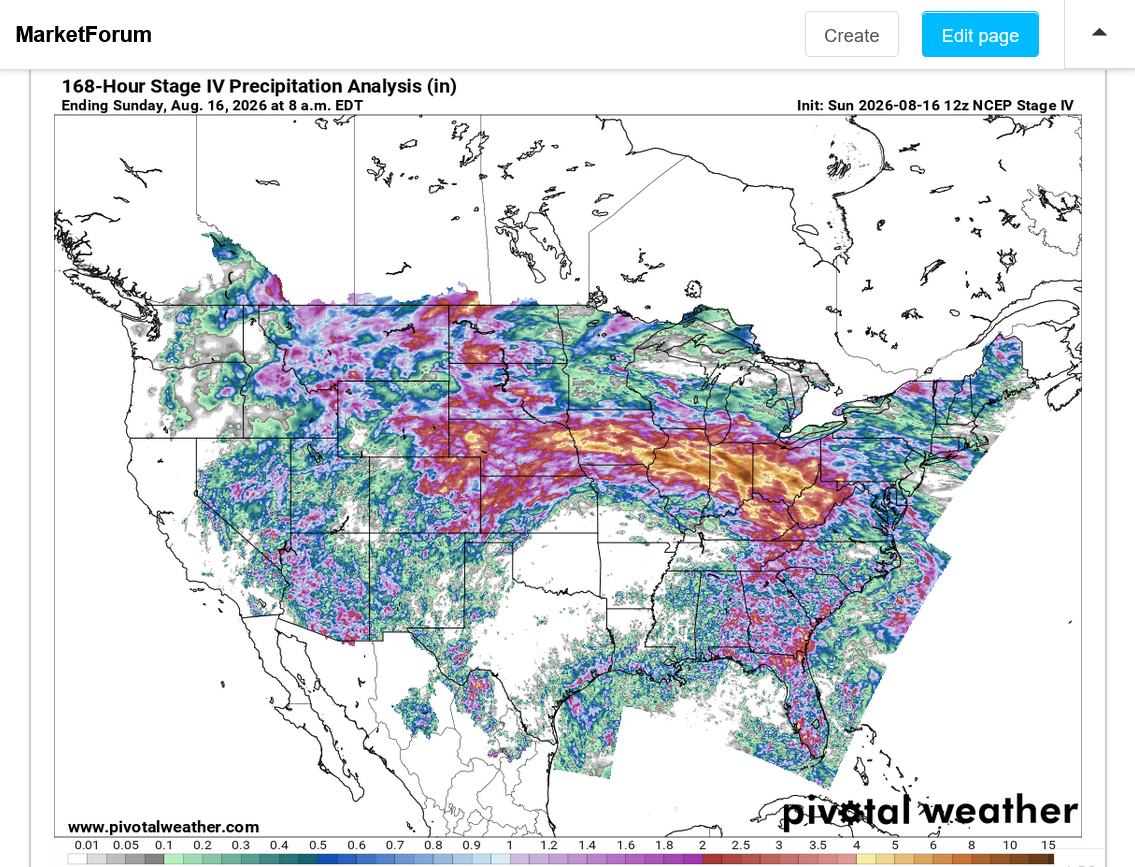
https://www.pivotalweather.com/maps.php?ds=stageiv&p=stageiv_qpe_168h_p&r=conus
1st image is 7 day totals thru Sunday Morning that captures most of the heavy rains.
2nd image is 7 days thru the latest image.
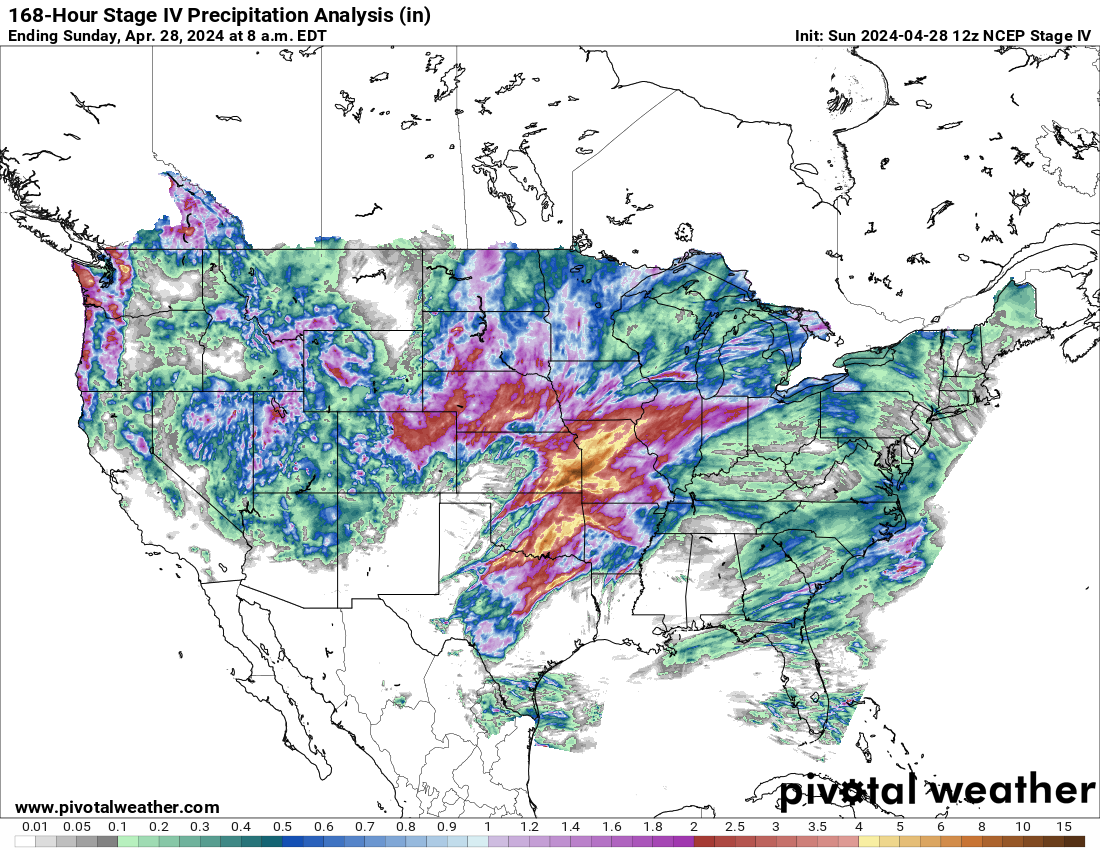
This is where the heaviest rains fell in 2 days last week.
For sure some production loss but how big of an area is this?
Other not AS heavy but heavy rains fell farther west.

The 99% area's in green below have some pretty high production. They are not as widespread as damage from a major drought(which typically spans numerous entire states) but for sure will see some yield loss.
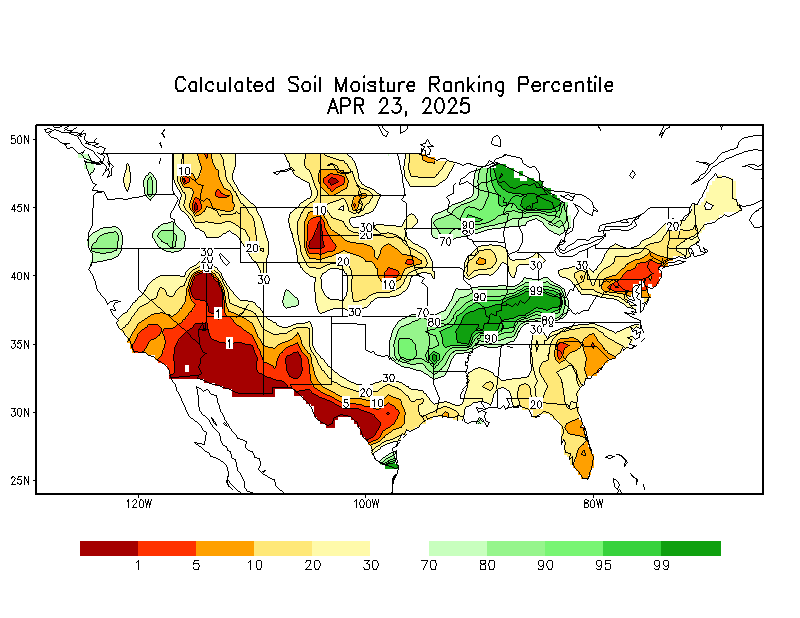
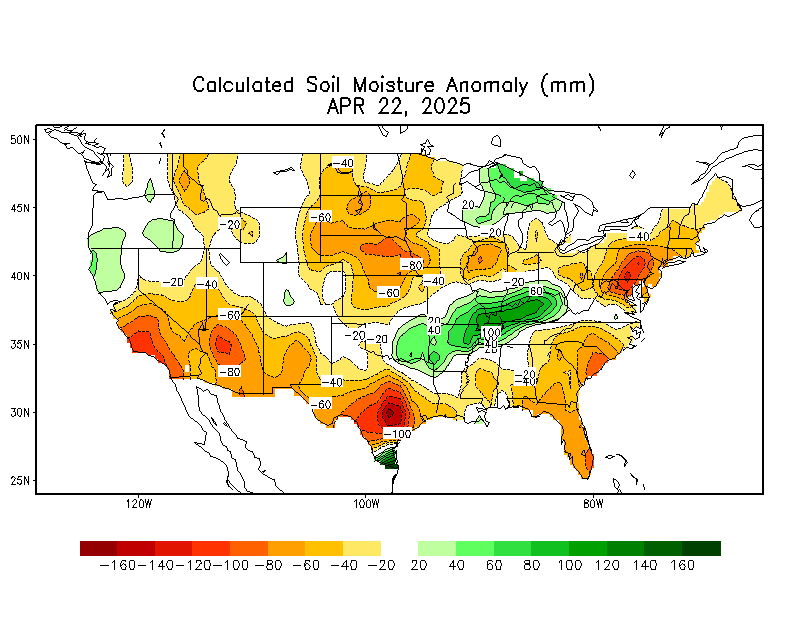
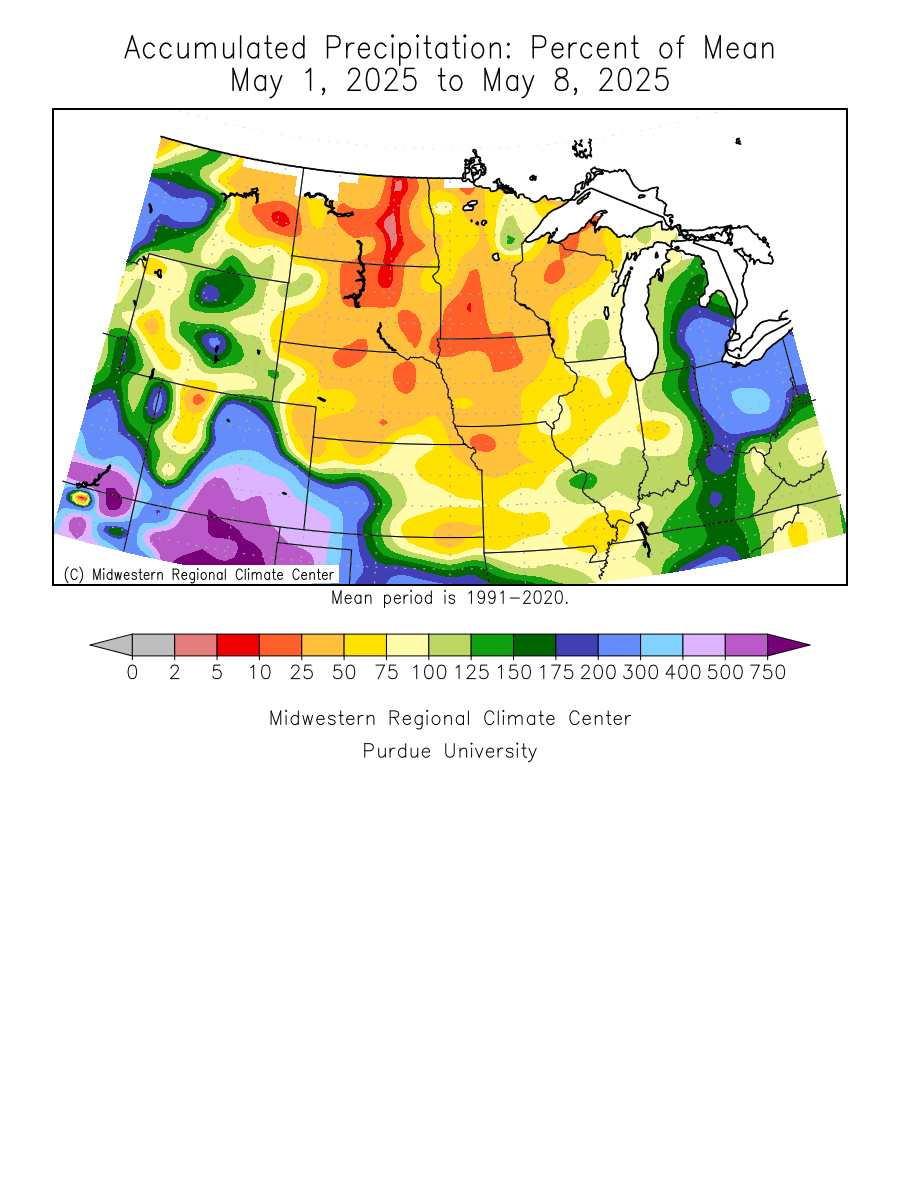
Soilmoisture anomaly:
These maps sometimes take a day to catch up to incorporate the latest data(the bottom map is only updated once a week).
https://www.cpc.ncep.noaa.gov/products/Soilmst_Monitoring/US/Soilmst/Soilmst.shtml#
Monday's crop condition/progress report will give us a better idea.
We can guess that crop ratings will drop in IN and probably a bit in IL/OH from too much rain.
But here's the thing. As I mentioned earlier this month, last week's weather reminded me of the 2010 weather. A heat dome with no rain underneath it but TOO heavy rains around the periphery.
That pattern lasted for many weeks but it was BAD for corn yields.
Look at these temperatures last week! It's doesn't get any worse than that for corn filling in the hot places!!!!
https://www.cpc.ncep.noaa.gov/products/tanal/temp_analyses.php

+++++++++++++++++
HeatFill for Corn
Started by metmike - July 14, 2023, 2:47 p.m.
https://www.marketforum.com/forum/topic/97257/
+++++++++++++++
I would think that damage to the beans would be worse than the corn!
We got another 2.1 inches overnight. Last week's heat accumulated alot of GDD's and caused heat fill for the corn which doesn't need any more rain this year in this neck of the woods.
The beans might benefit slightly from 1 more rain but they are basically made too.
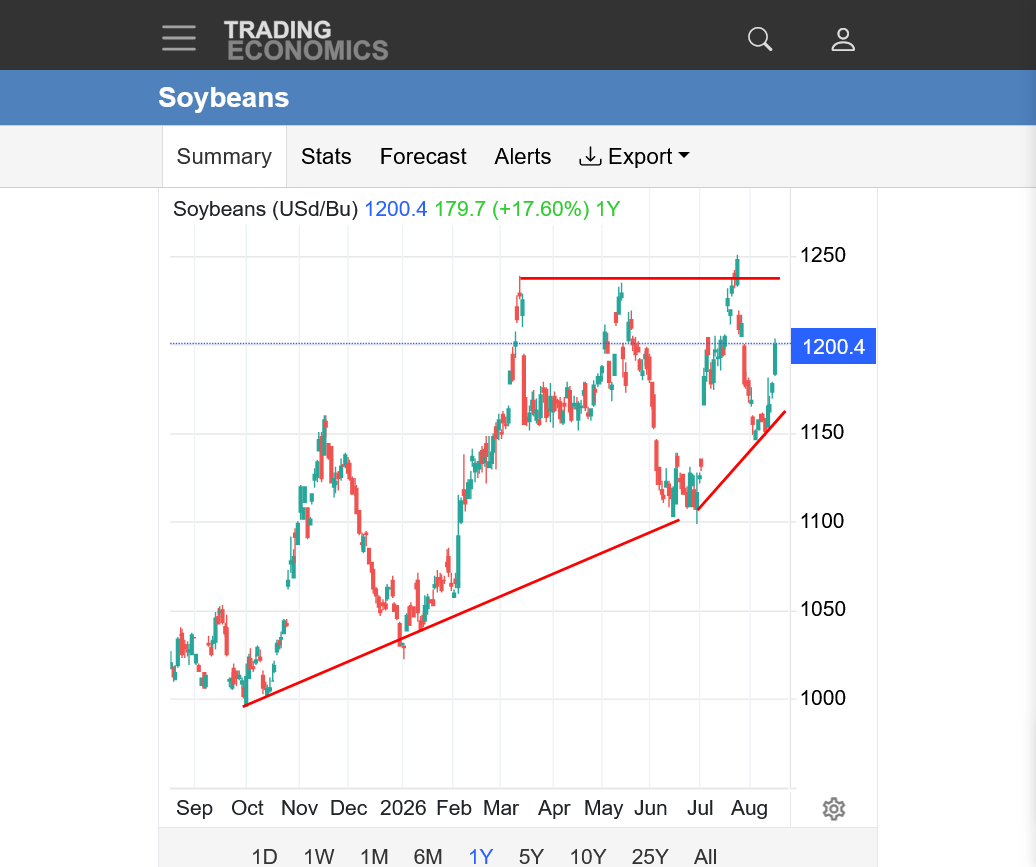
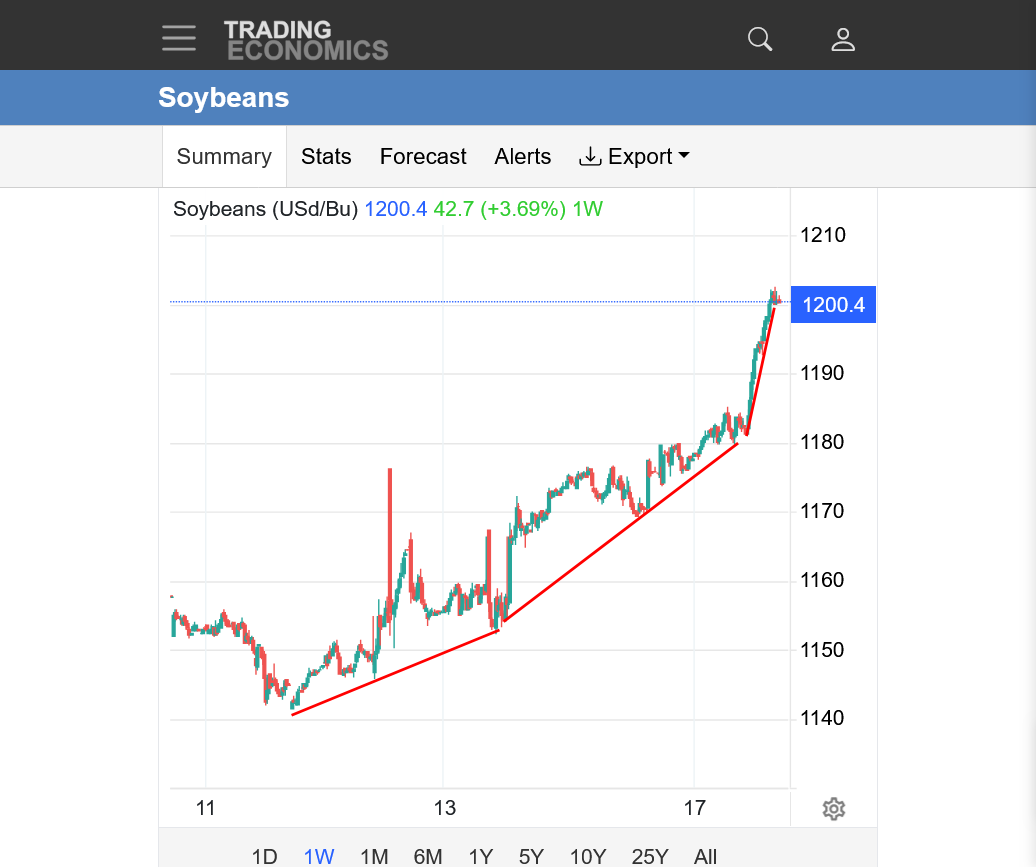
2pm: Beans were the leader today! Positive seasonals, damage from excessive rains, a bullish USDA report last week and a positive technical picture were factors.
1. 1 year. Triple top(looks vulnerable). Accelerating uptrend
2. 1 week: Accelerating uptrend
https://tradingeconomics.com/commodity/soybeans
++++++++++
By metmike - Aug. 4, 2026, 4 p.m.
https://charts.equityclock.com/soybeans-futures-s-seasonal-chart
https://charts.equityclock.com/corn-futures-c-seasonal-chart
+++++++++
·
U.S. corn and soybean conditions slipped 1 point each on the week, and both sit slightly below their five-year averages. Spring wheat harvest is advancing at a faster-than-normal pace, and winter wheat harvest is about wrapped up.
++++++++++
++++++++++++++++++++++++++
2025/26 is going out in style. U.S. corn export inspections hit 1.91 million metric tons (75 million bushels) last week, above all analyst expectations and by far the largest for this week in 44 years of data. That's the third week in a row with huge weekly records.
Eric was in with our detailed weather discussion on Friday morning!
Aug 21, 2026: Will El Niño Erase US Drought?? | New Fall and Winter Outlook | Excessive Heat Pounds
https://www.youtube.com/watch?v=FM-mitdECYA


