Get all the comprehensive weather here:
https://www.marketforum.com/forum/topic/83844/
++++++++++++++
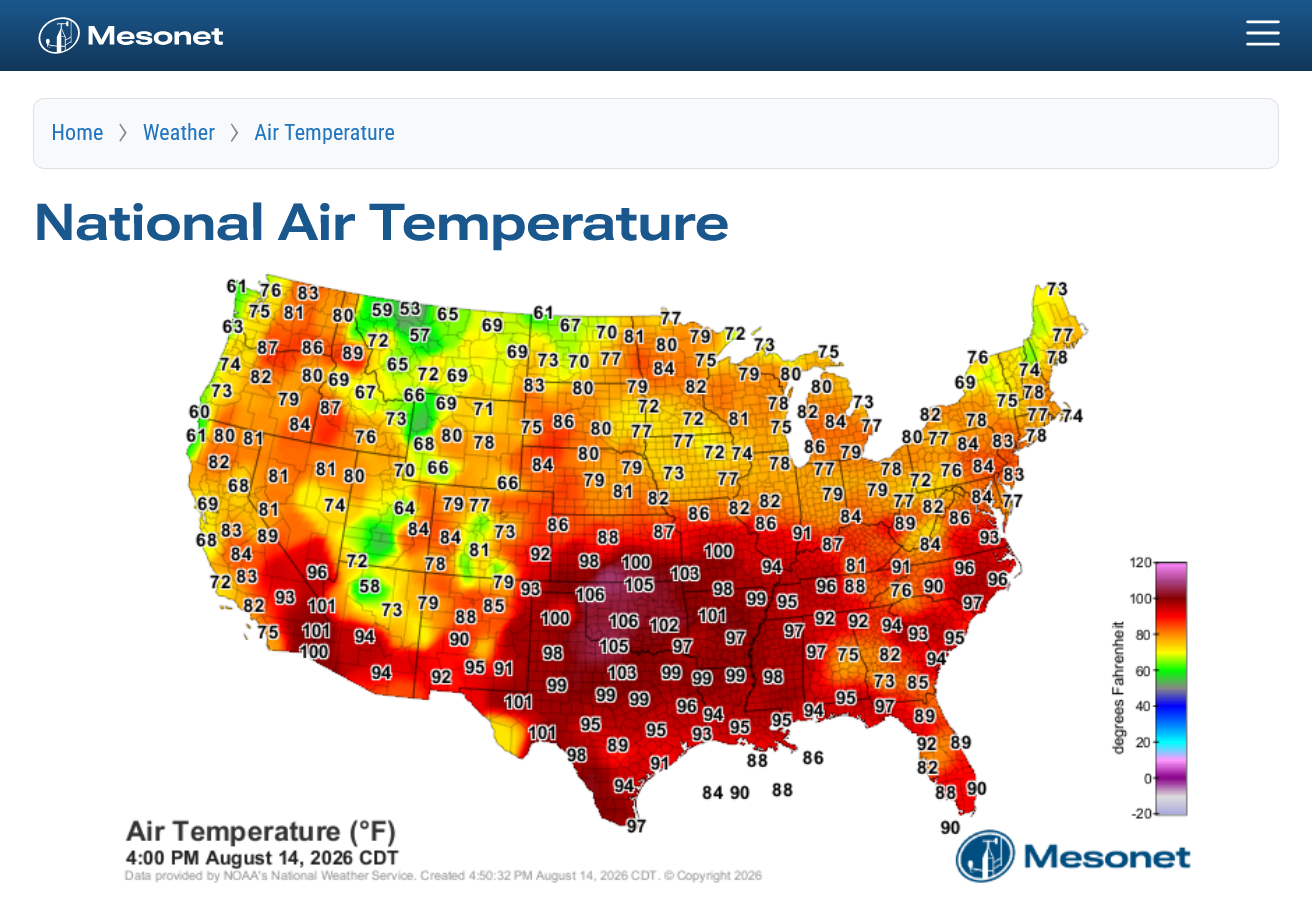
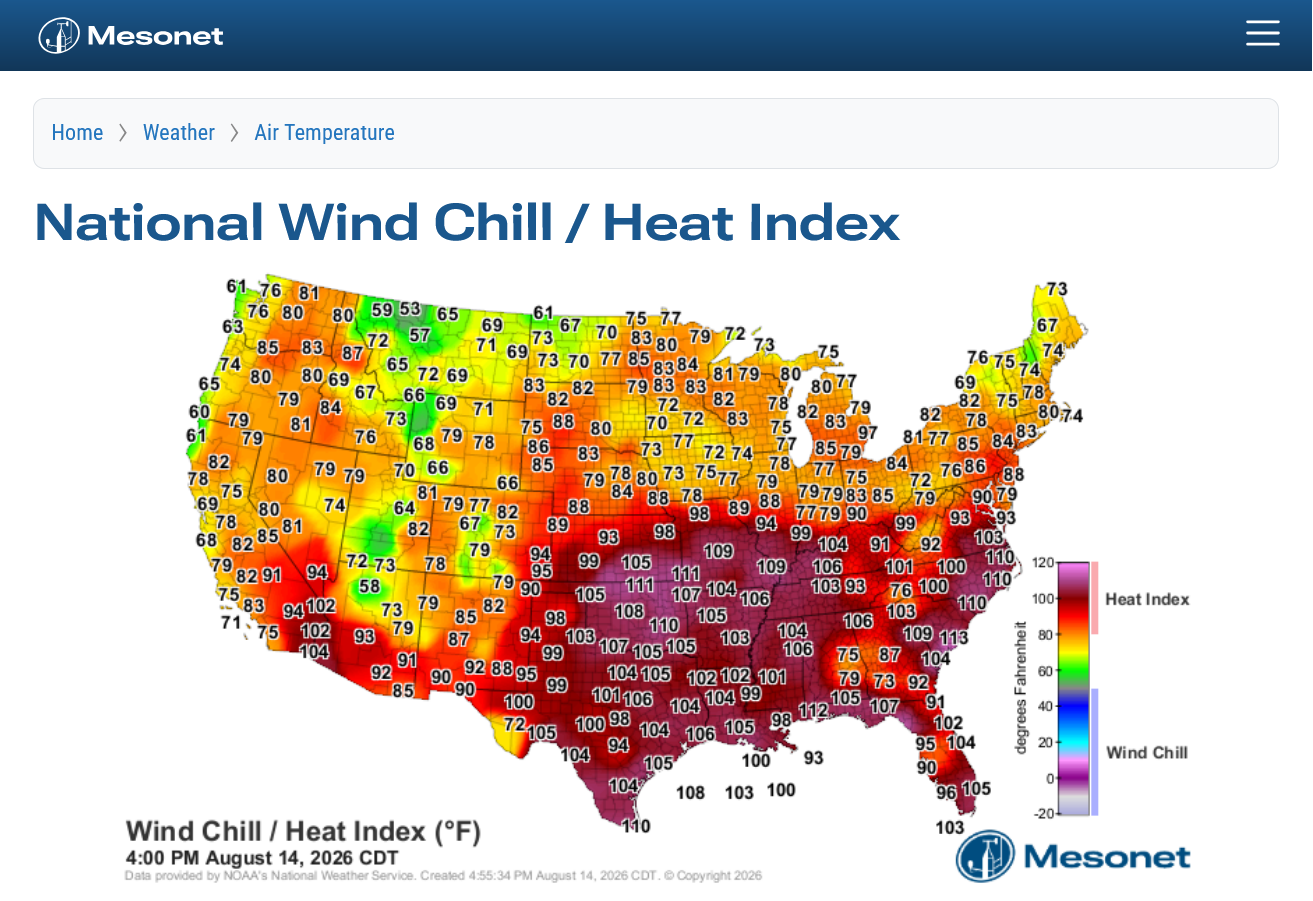
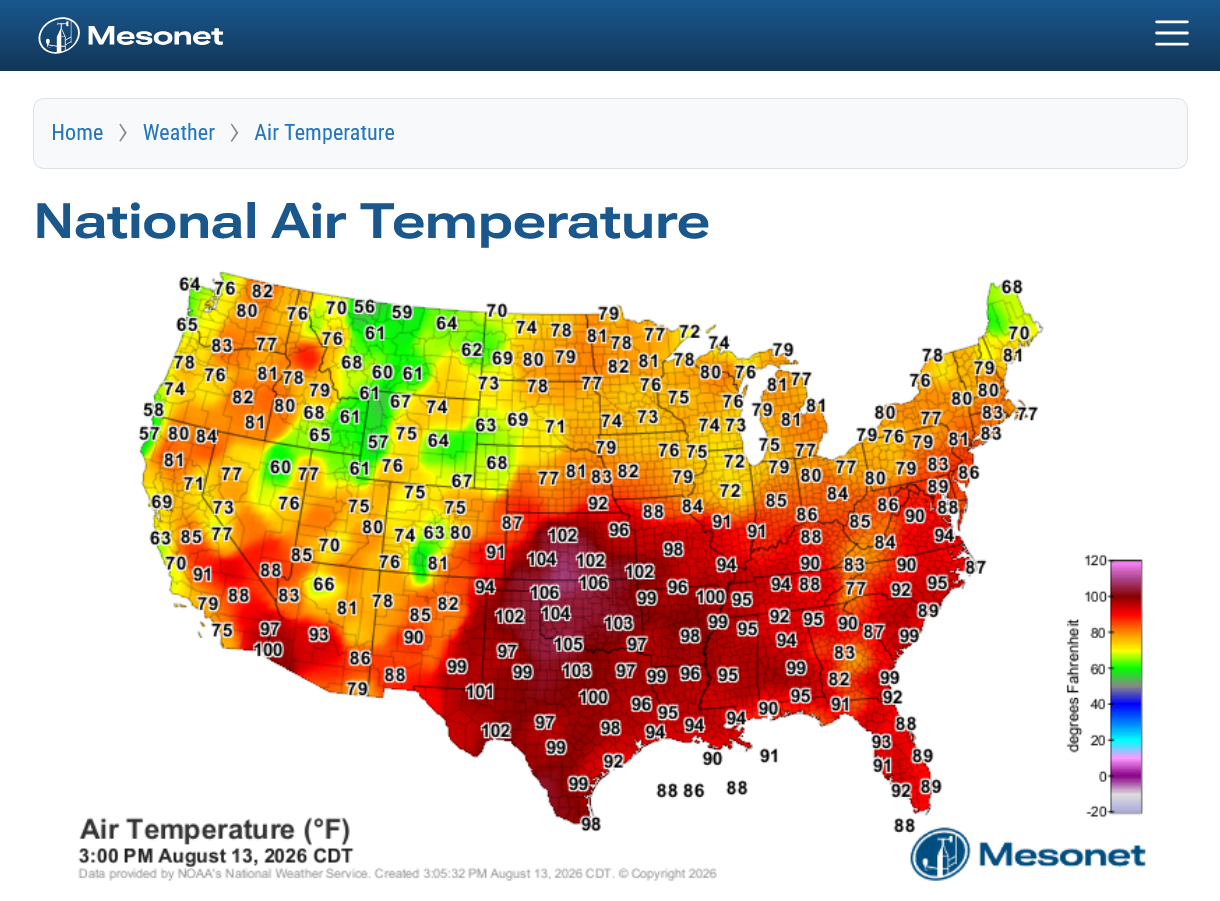
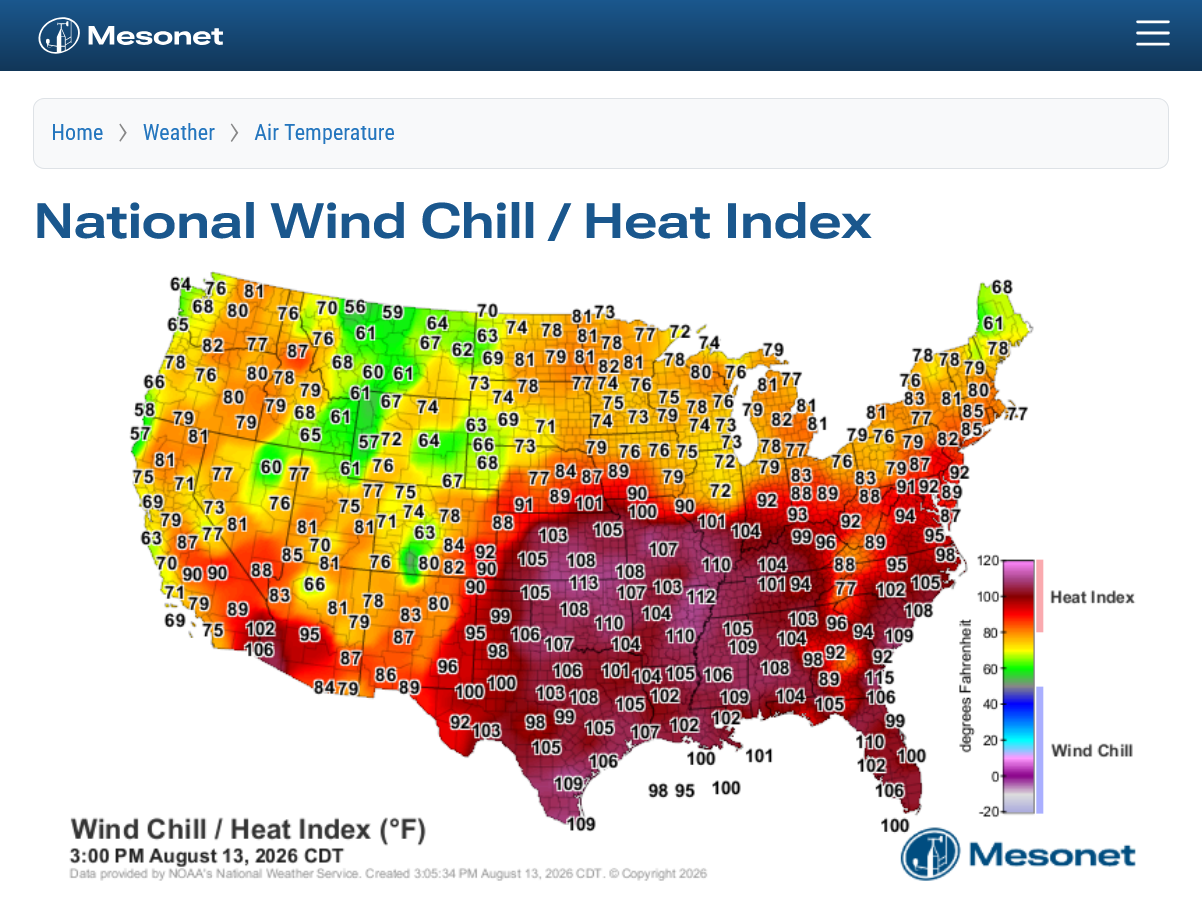
3pm snapshots today:
https://www.mesonet.org/weather/air-temperature/national-air-temperature
https://www.mesonet.org/weather/air-temperature/national-wind-chill-heat-index
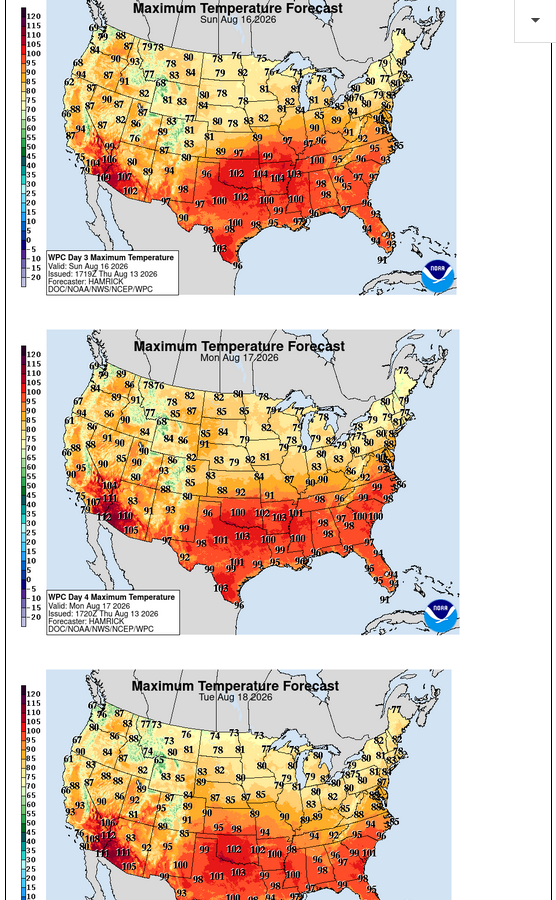
Highs for upcoming week: Days 3-7.
https://www.wpc.ncep.noaa.gov/medr/medr_max.shtml
++++++++
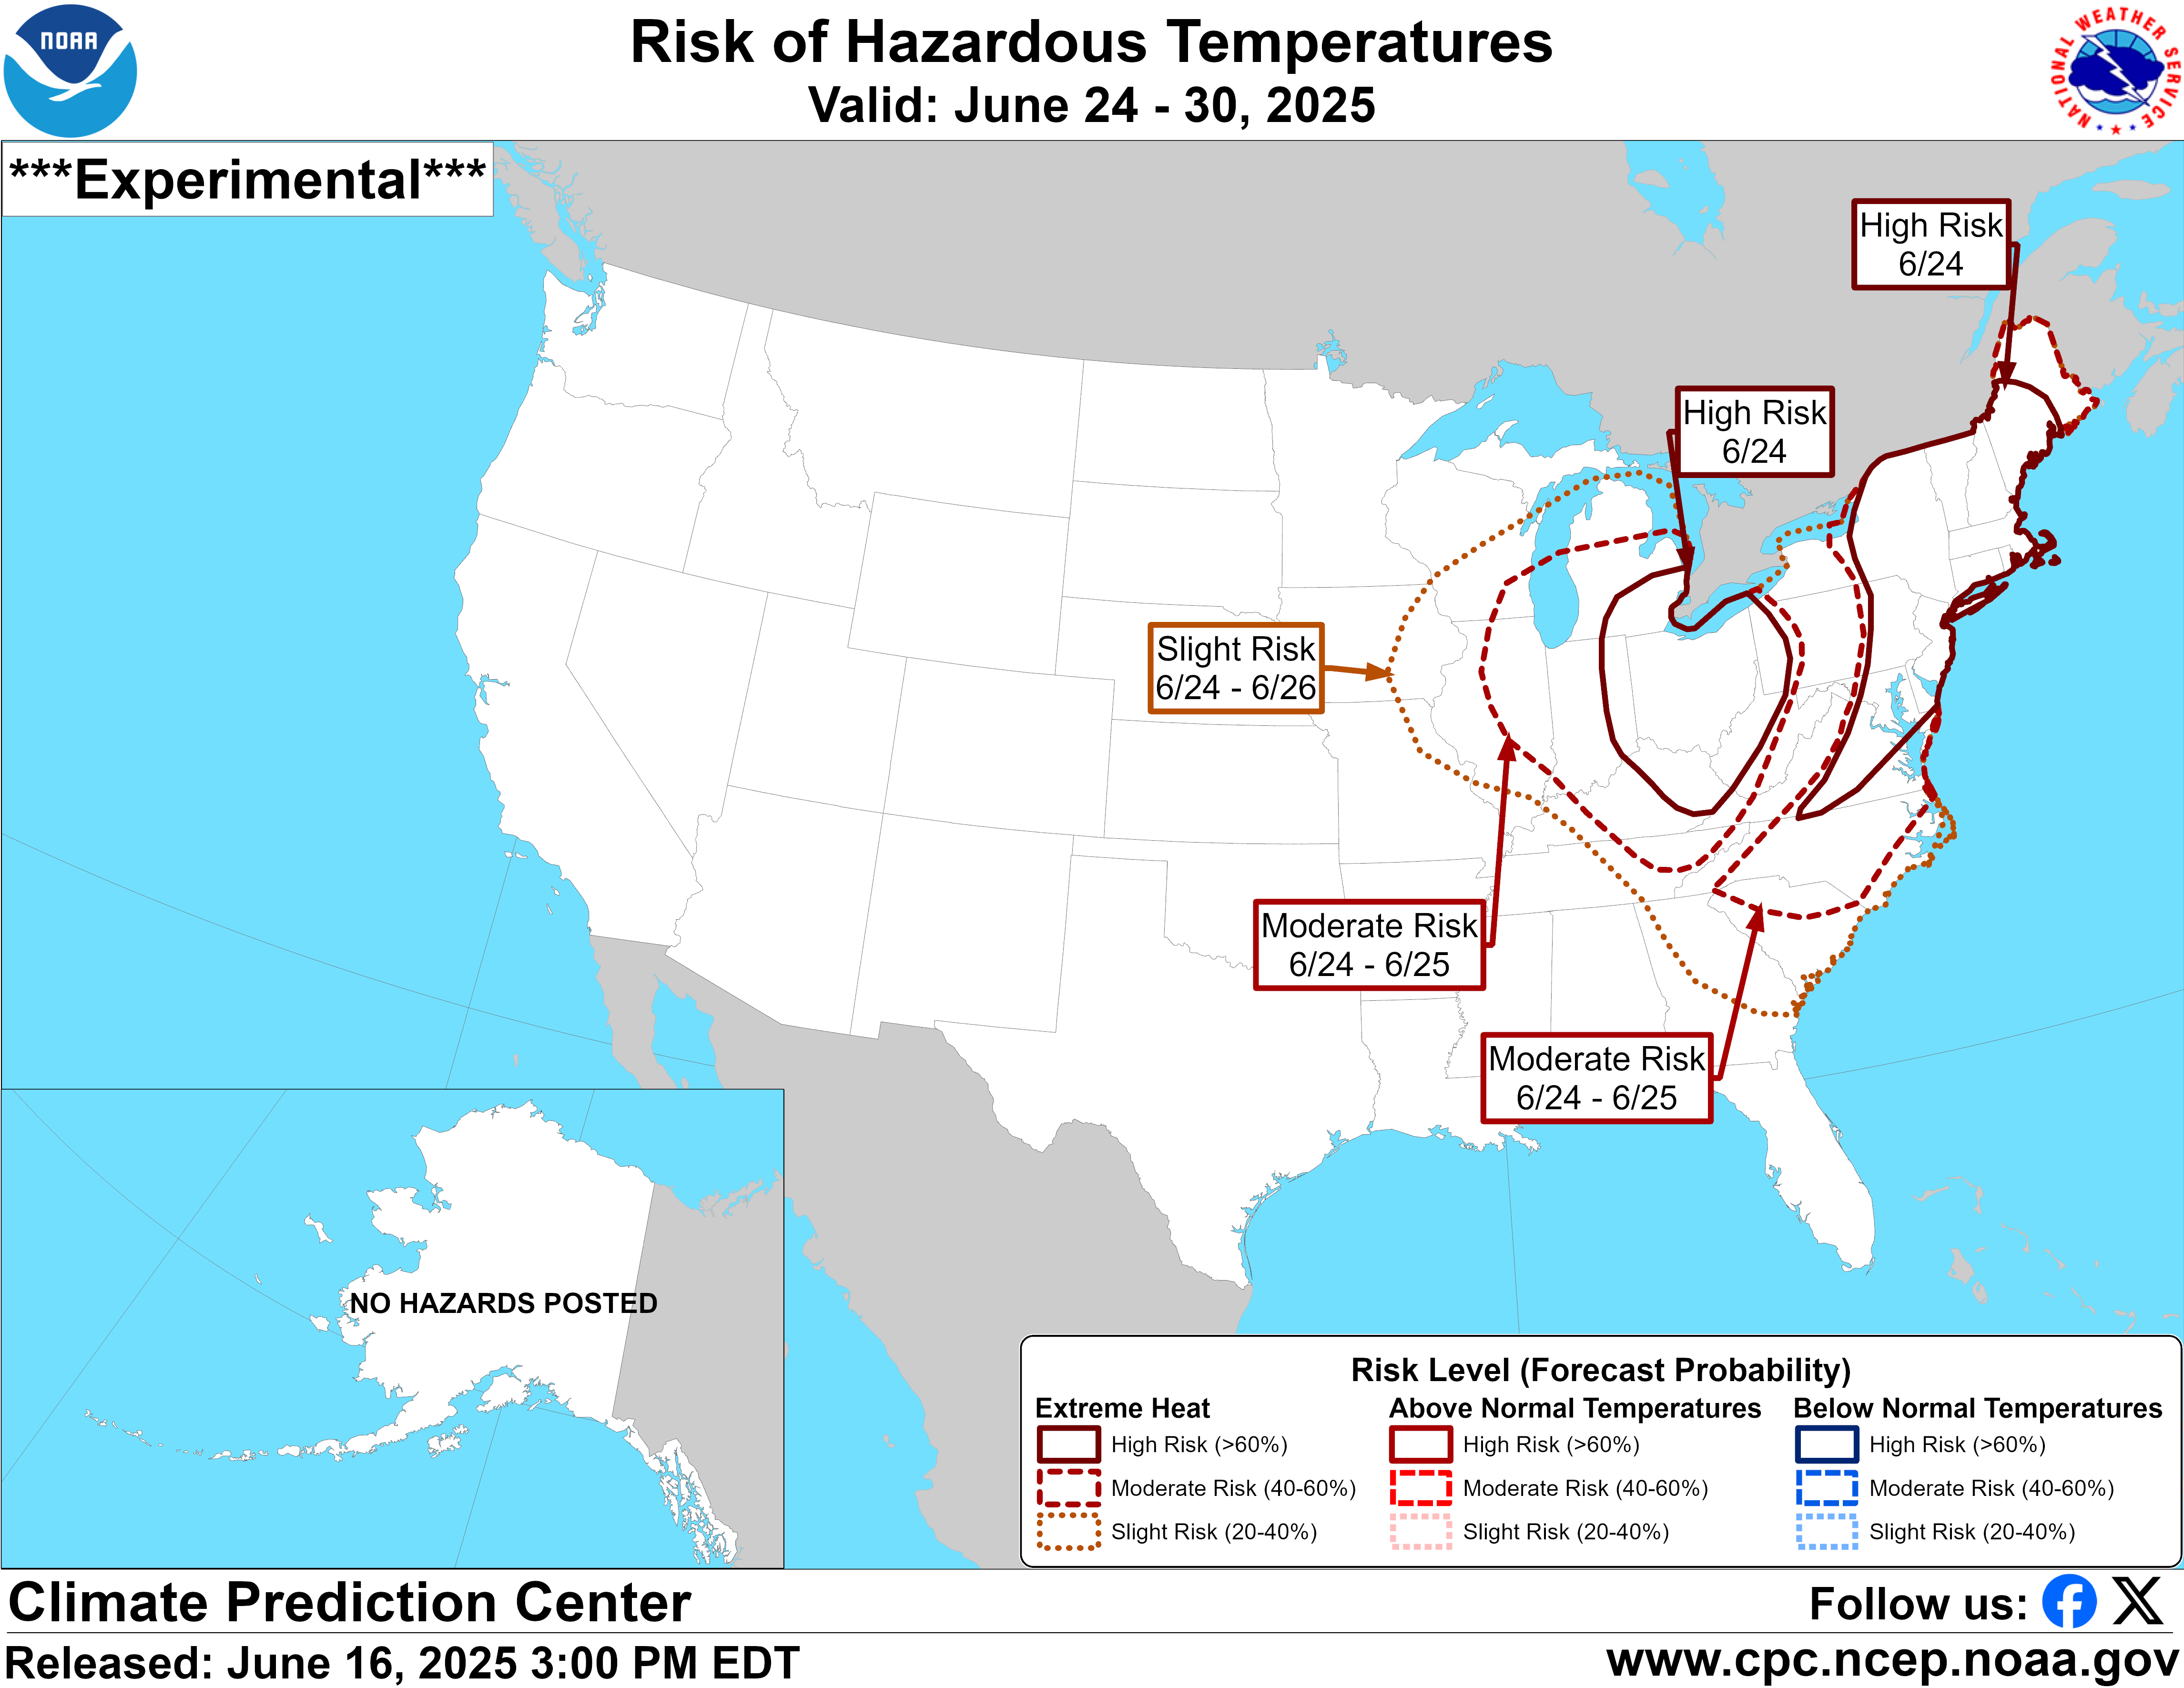
Highs next Sun-Mon-Tue below:
Week 2 will still feature the weakening heat DOME:
https://www.cpc.ncep.noaa.gov/products/predictions/threats/temp_probhazards_d8_14_contours.png
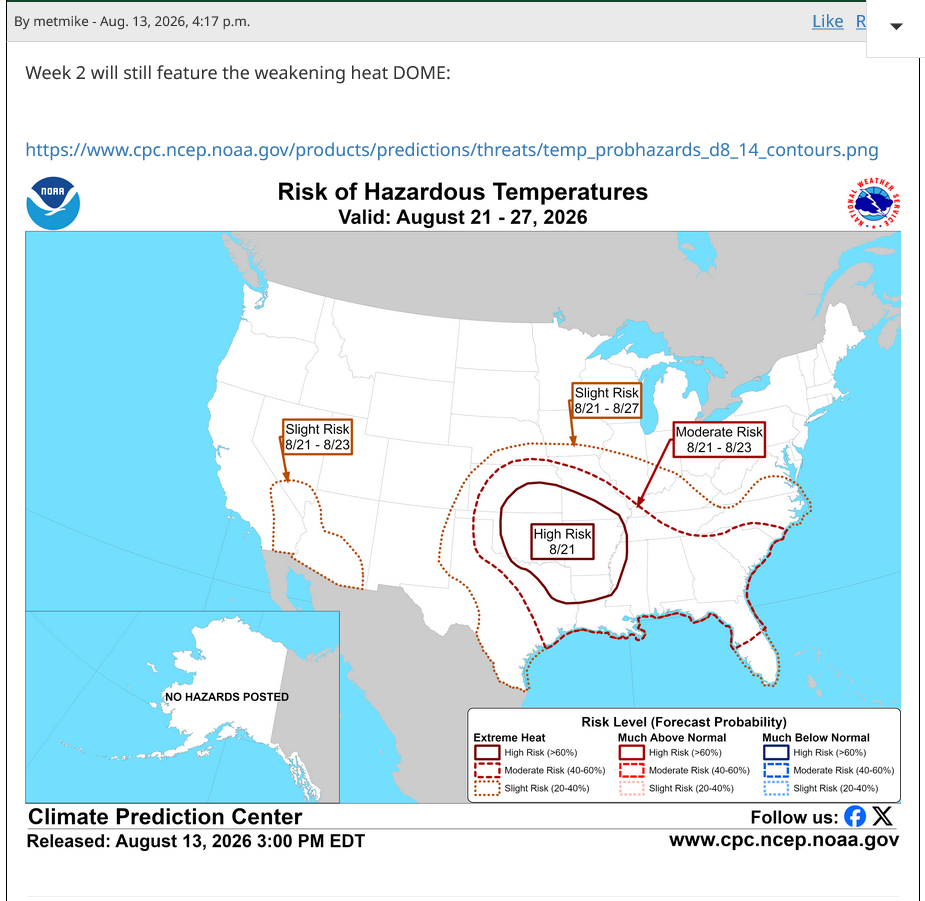
I am thinking this risk will only linger for that zone at the very start of that period and already be shifting west quickly at the beginning of that period.
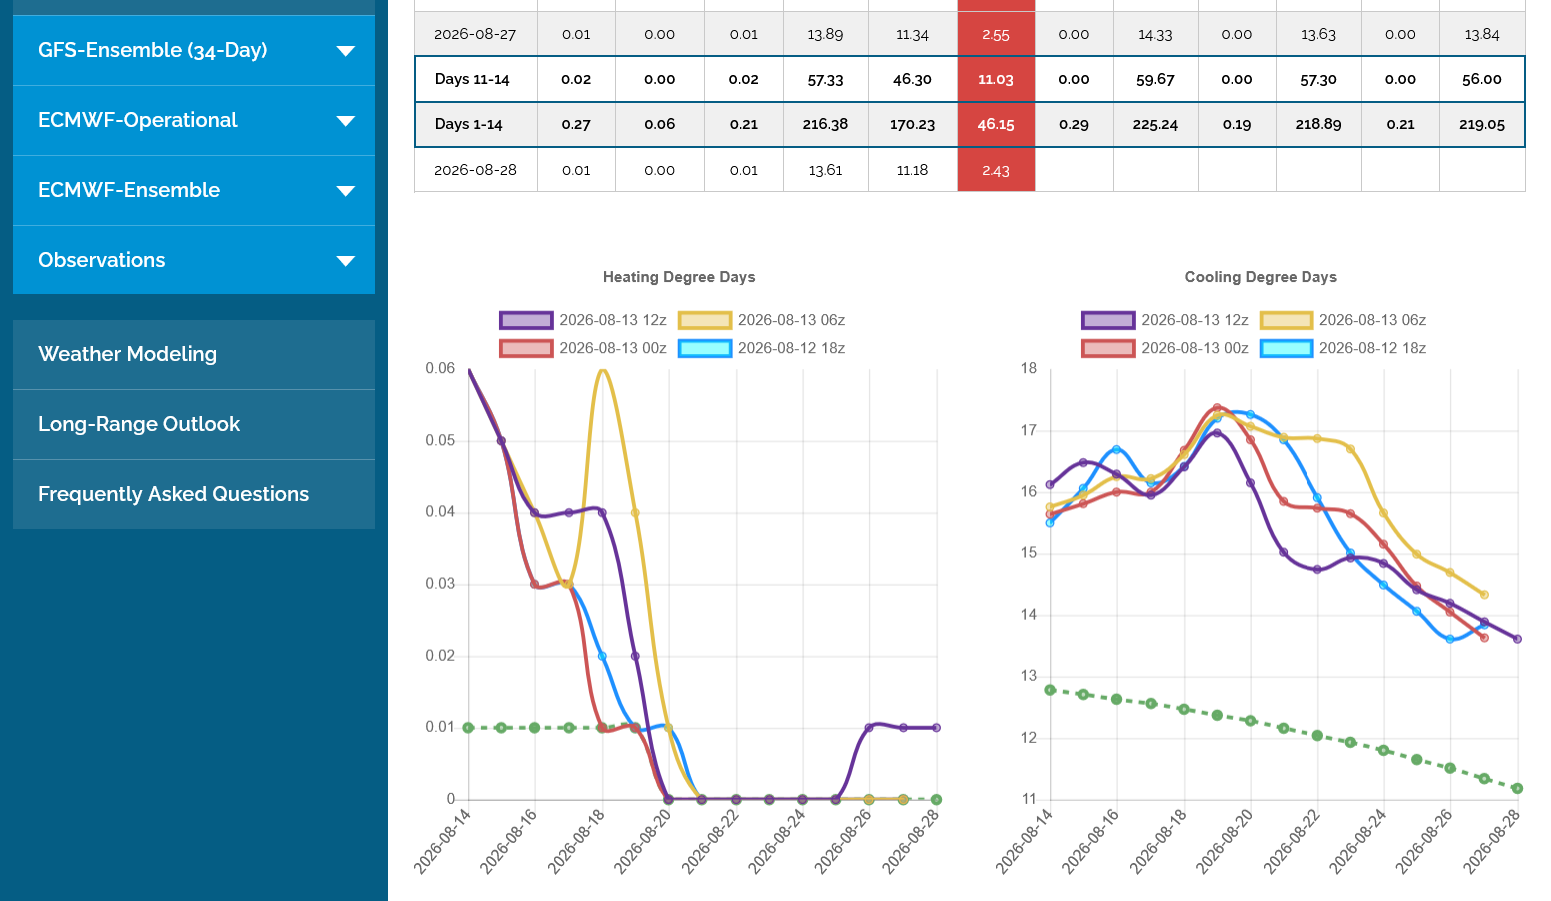
Note the CDDs from the last 4 runs of the GEFS, the last 12z run in purple showing cooling vs the previous one IN ADDITION to the cooling trend in week 2. .
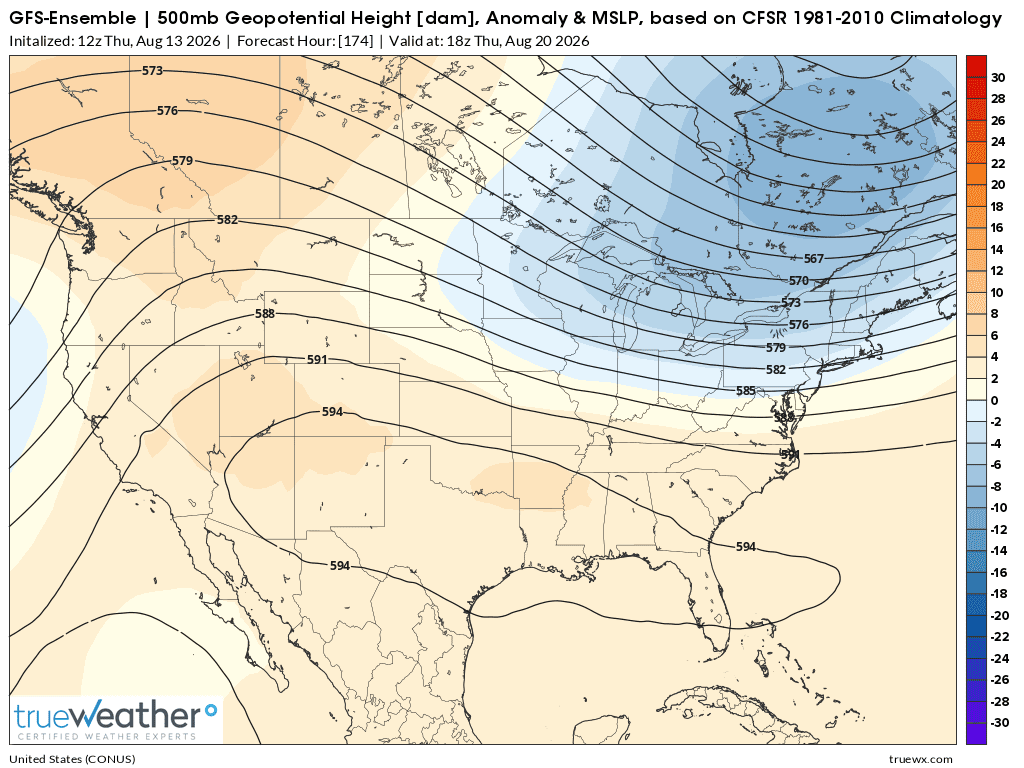
This is the 500 mb pattern associated with the heat DOME!
It peaks late Saturday, 8-15-26: A huge 597 dm high. I would not be surprised to see a small 600 dm center.
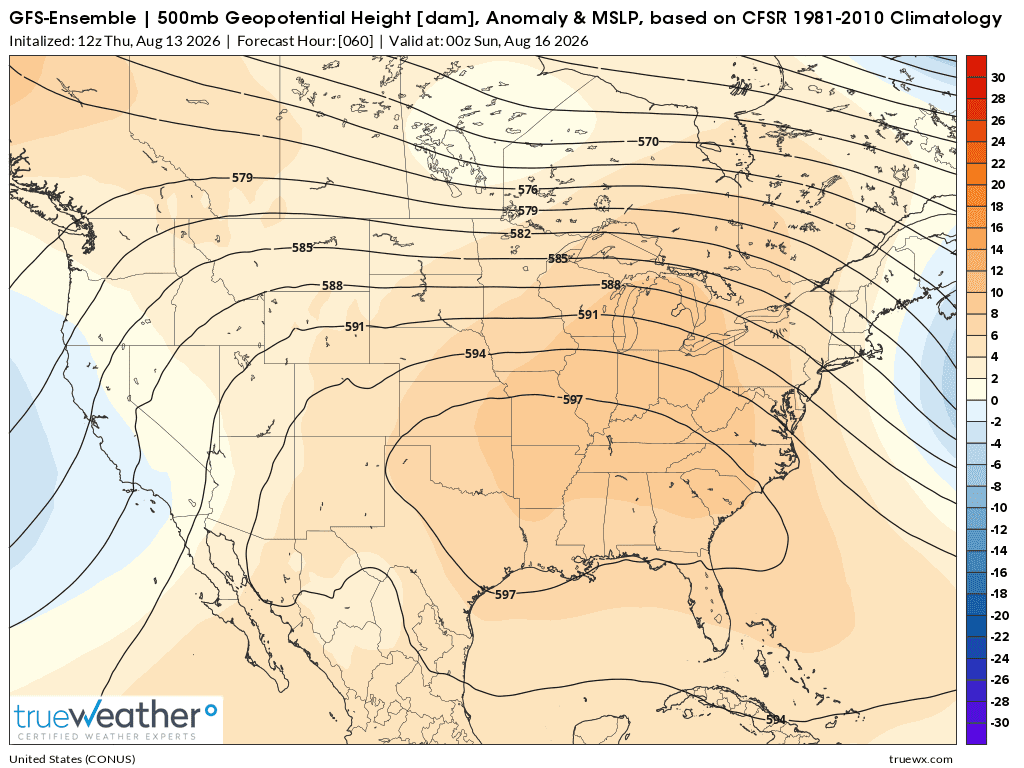
Here it is in 1 week on 8-20-26 from the latest guidance. Note the northern stream carving out a deep trough in Southeast Canada. This will SQUASH the heat dome and push it farther south and west in a slightly weaker state(but with the intense heat continuing underneath the dome.
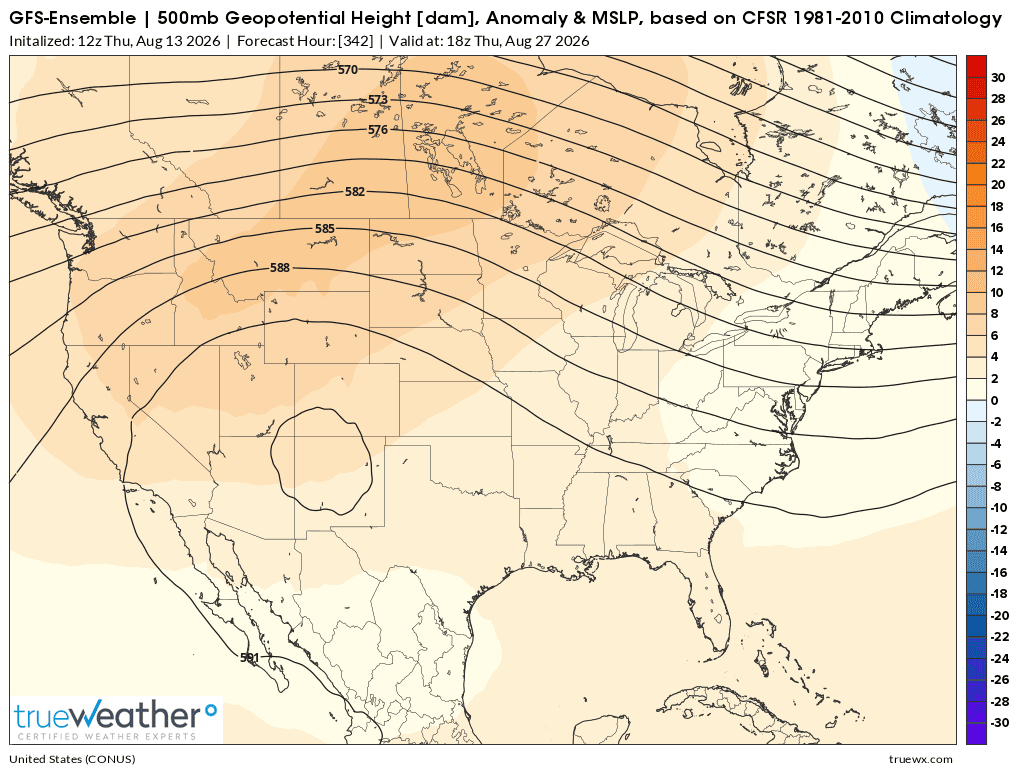
Below is day 14, 8-27-26. Note the heat dome rebuilds much farther west, extending north into the Rockies/Plains again. The East and Southeast should have temperatures returning closer to average then.
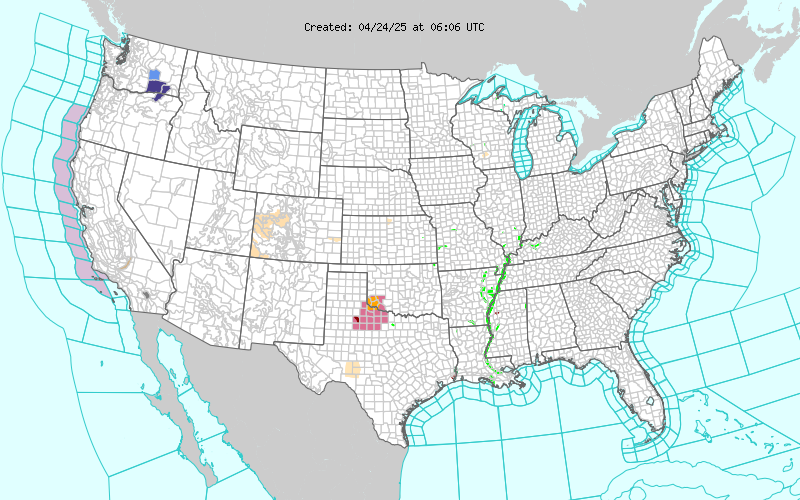
Current Hazards at the link below.
For your NWS and county, go to the link below.
Then you can hit any spot on the map, including where you live and it will go to that NWS with all the comprehensive local weather information for that/your county.
We'll be into the intense heat here in Evansville, IN for the next 3 days. Should be the hottest temperatures so far this Summer(96 Deg. F. was the hottest so far in 2026-despite both July heat domes impacting us).
https://forecast.weather.gov/MapClick.php?x=284&y=88&site=pah&zmx=&zmy=&map_x=284&map_y=88
Friday
Sunny, with a high near 96. Heat index values as high as 112. West southwest wind 5 to 7 mph.
Friday Night
Mostly clear, with a low around 76. Light south southwest wind.
Saturday
Sunny and hot, with a high near 97. Heat index values as high as 111. Southwest wind 3 to 7 mph.
Saturday Night
Mostly clear, with a low around 76. South southwest wind 3 to 6 mph.
Sunday
Sunny and hot, with a high near 97. West southwest wind 6 to 8 mph.
+++++++++++++++++
How many record highs will we break?
NONE!
https://www.weather.gov/pah/EvansvilleDailyNormalsAndRecords
Record August highs for Evansville, IN:
Date/High/Year
14-99/2010
15-104/2007
16-100/1988
17-102/1936
18-102/1936
19-104/1936
20-102/1983
21-101/1983
22-101/1983
23-100/2007
24-101/1943
25-102/1943
26-102/1943
27-102/1936
28-102/1936
29-101/1924
30-99/1951
31-100-1953
How many of those daily high temperature records have been set in the past 30 years? 30 years is usually the minimum period considered as climate. 1990's/2000's/2010's combined records?? 3
How many in just 1936? 5
How many in just 1943? 3
How many in just 1983? 3 1980's? 4
+++++++++++++
The point is that this is HOT but it doesn't hold a candle to historic heat in this area regardless of the latest headline news suggesting otherwise from a climate crisis!
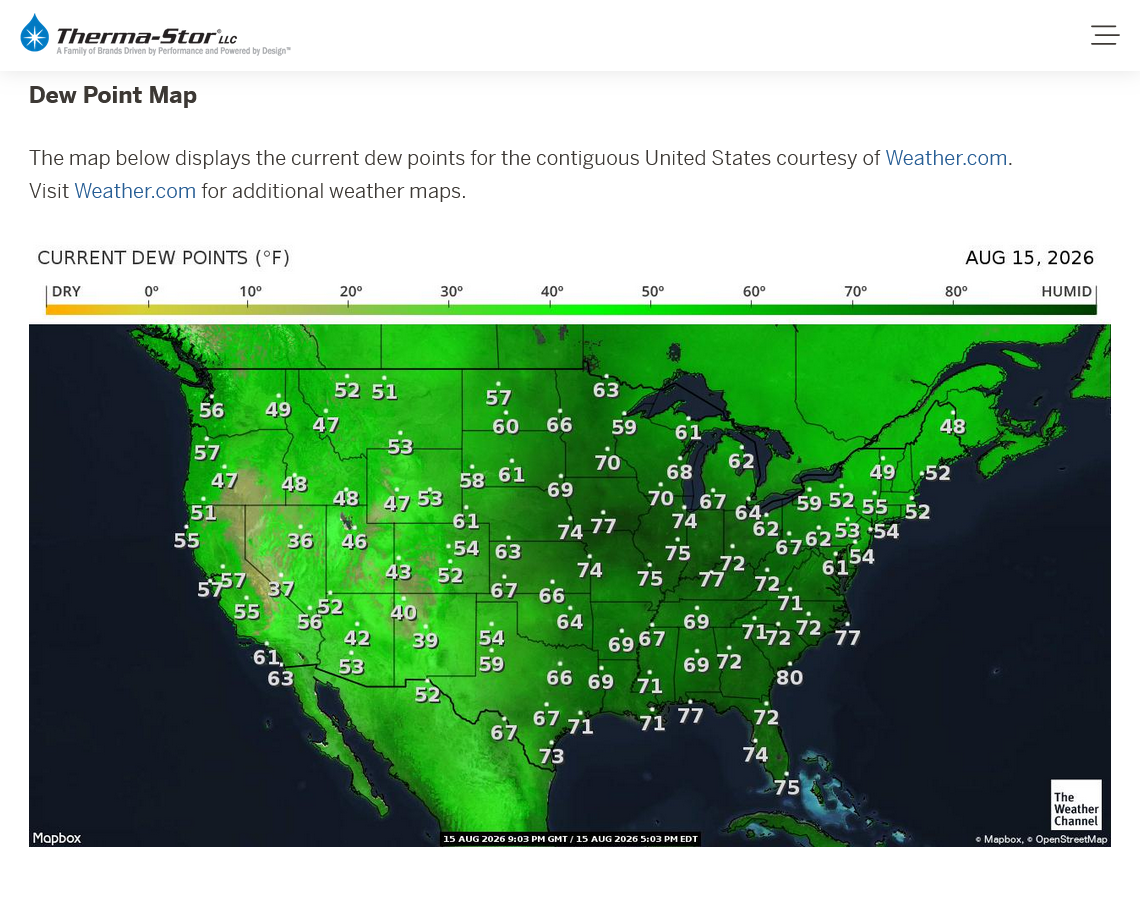
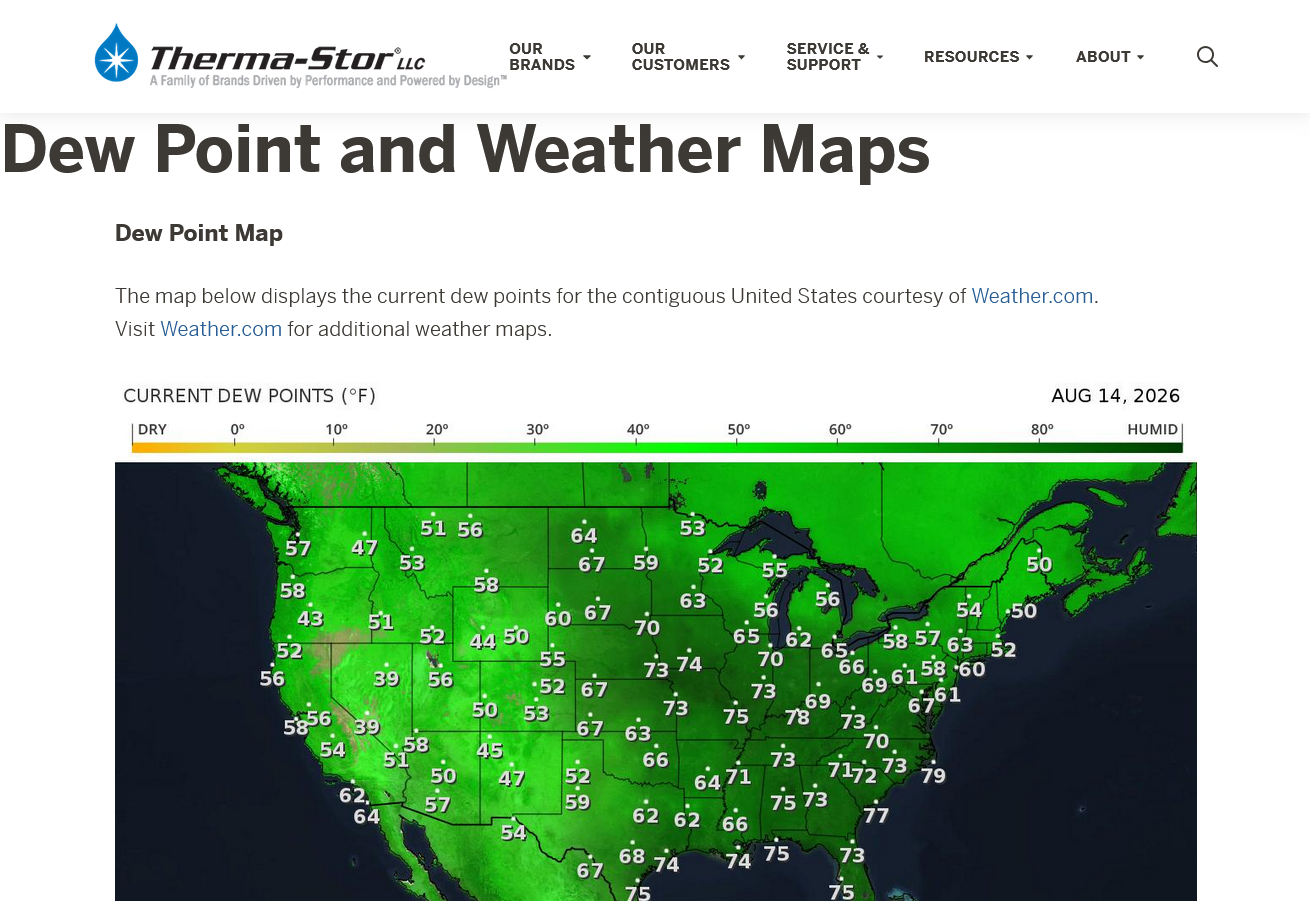
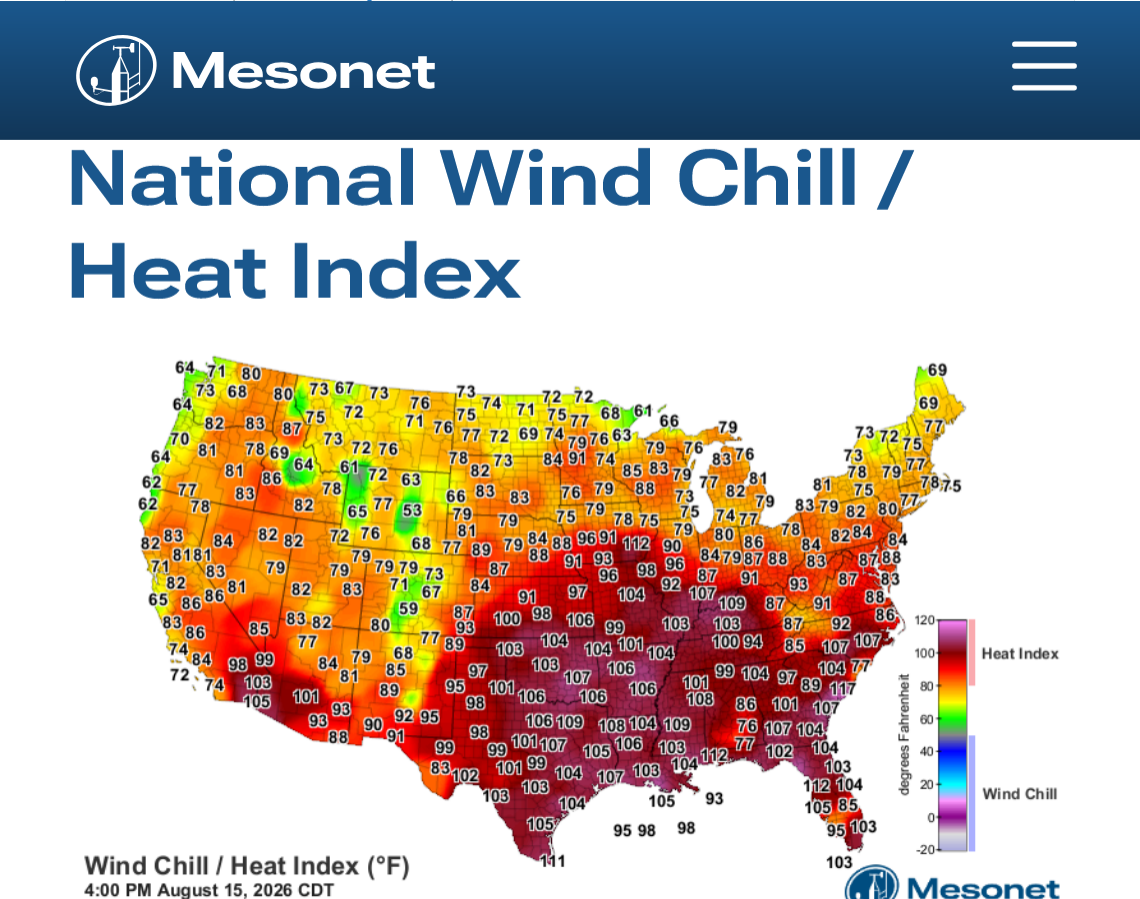
4pm snapshot, Saturday, August 15, 2026 of the heat and humidity:
https://www.mesonet.org/weather/air-temperature/national-air-temperature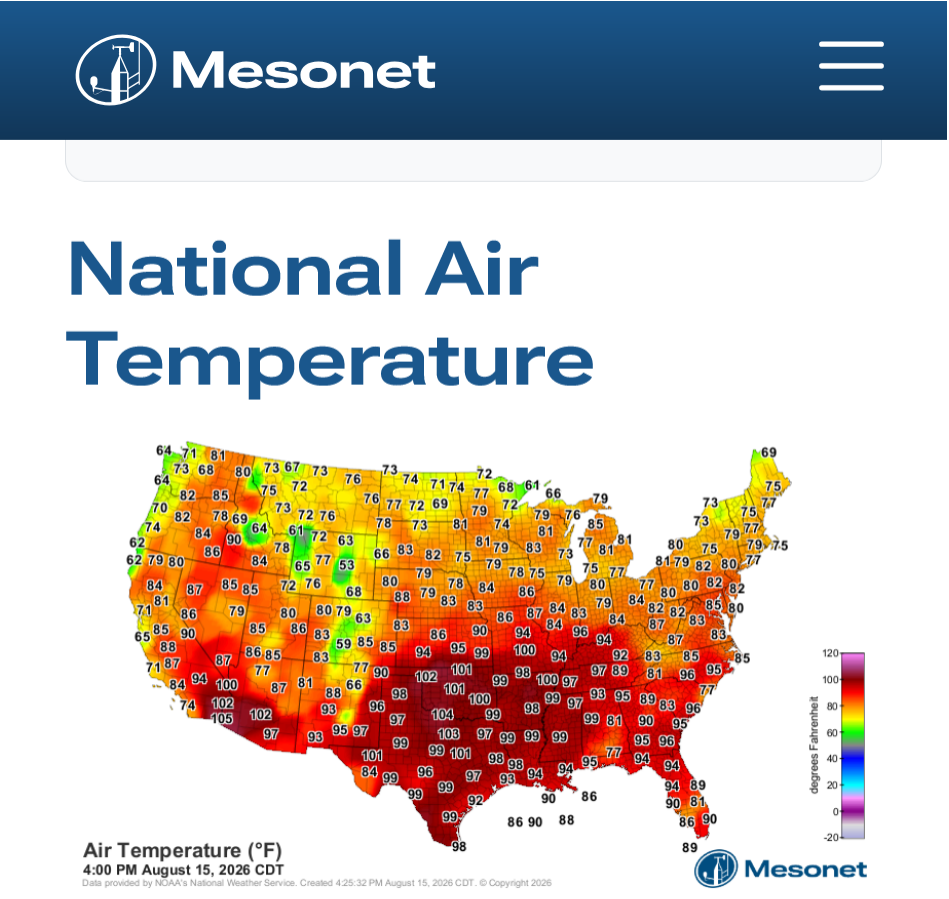
https://www.mesonet.org/weather/air-temperature/national-wind-chill-heat-index
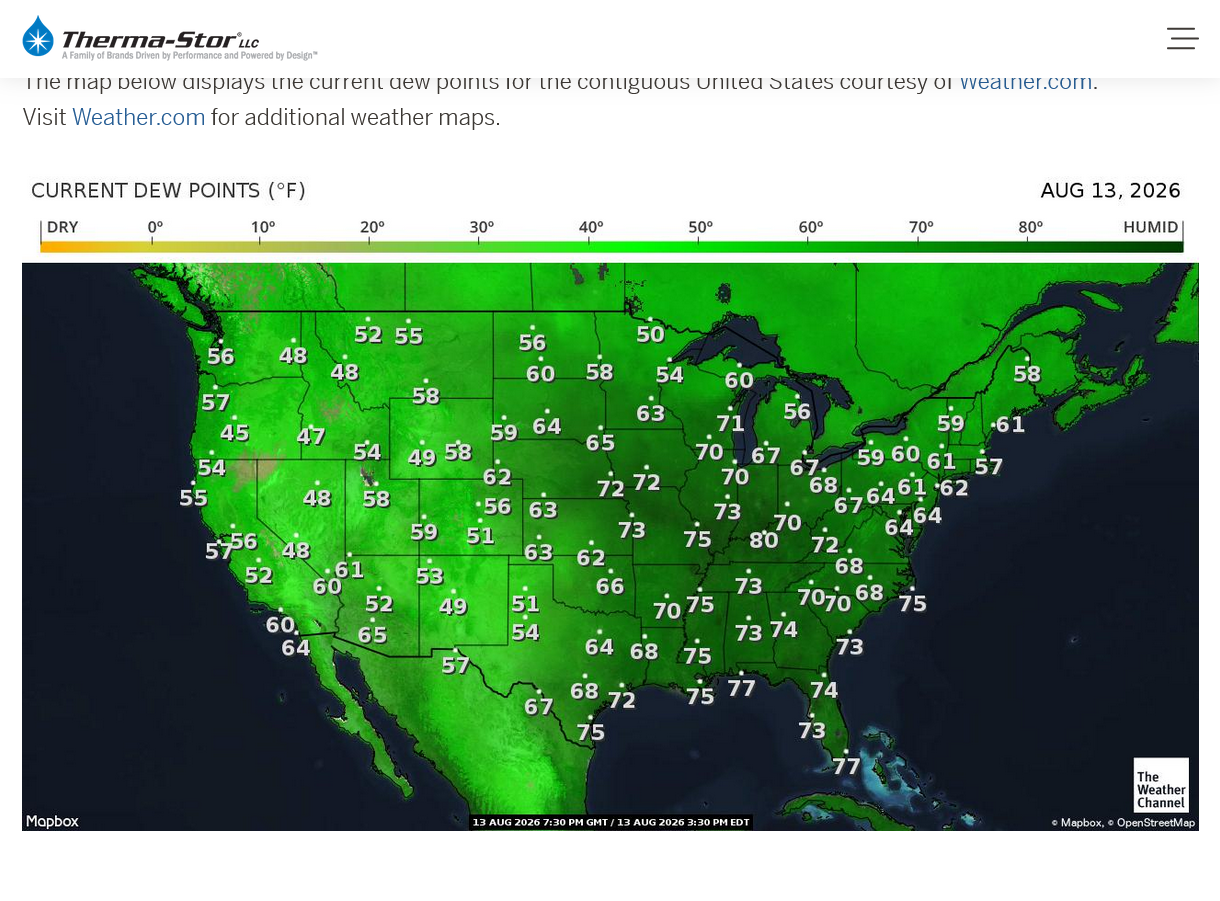
https://thermastor.com/dew-point-and-weather-maps/