
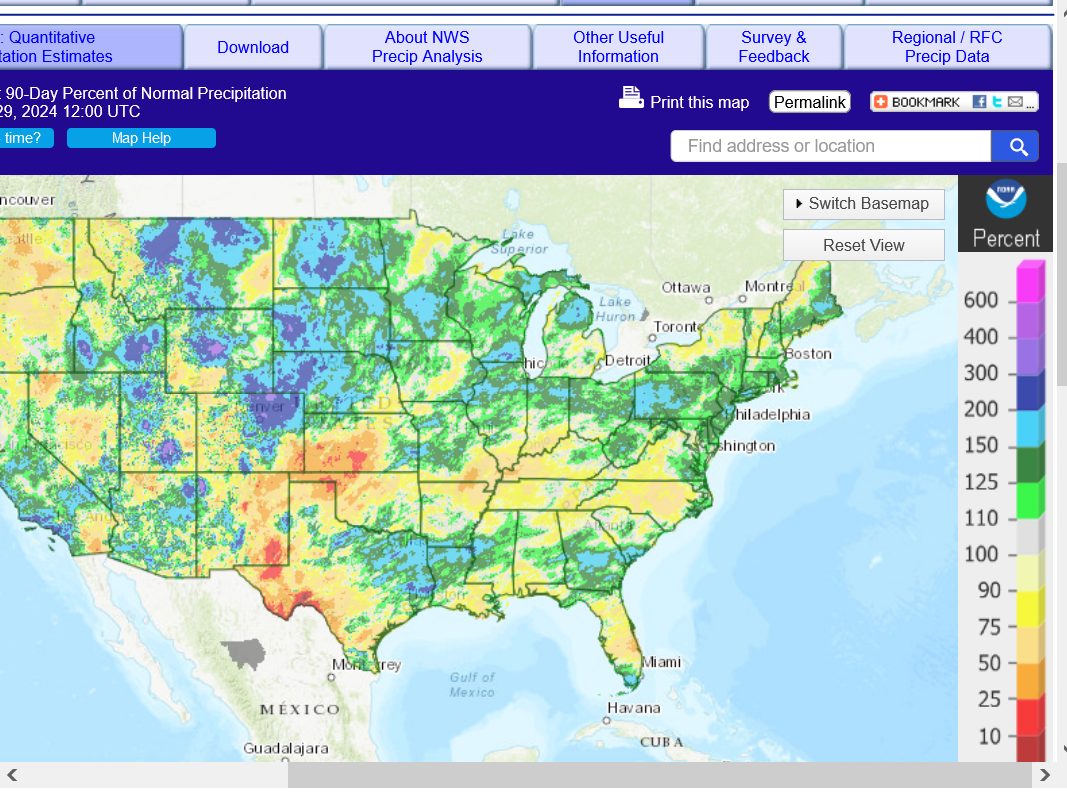
Update 4-29-24
1. The last 30 days of precip % of average
2. 90 days total % precip
https://water.weather.gov/precip/

Recent El Nino driven storms have been a blessing for the West which relies on melting snow later this year for their water supply.
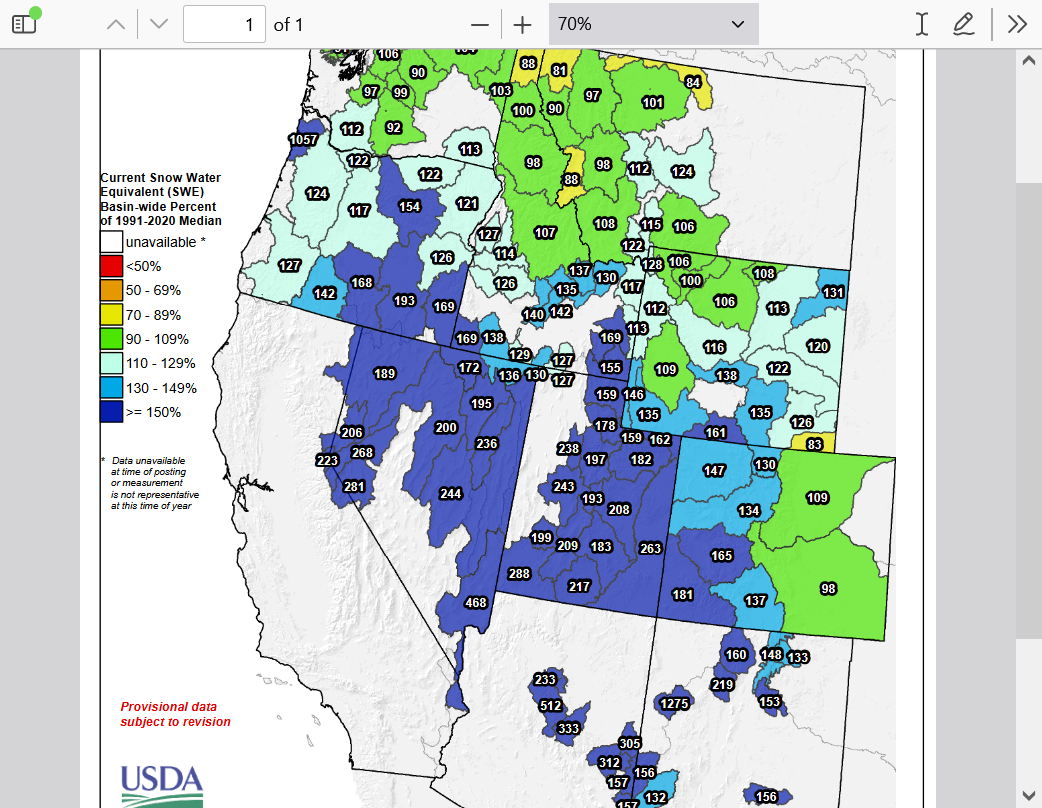
https://www.wcc.nrcs.usda.gov/ftpref/data/water/wcs/gis/maps/west_swepctnormal_update.pdf
Total snow for the season:
blob:https://nwcc-apps.sc.egov.usda.gov/c06abe2d-f5f3-416c-bf9b-55d0177bbc7d

weathernet.com/total-rainfall-map-24-hours-to-72-hours
You can scroll down and get almost the entire comprehensive weather picture updated constantly here.
Current Hazards at the link below.
Go to the link below, hit hazards box in the top right hand corner(it will also define all the color codes), if its not already in the hazards mode when you load the link.
Then you can hit any spot on the map, including where you live and it will go to that NWS with all the comprehensive local weather information for that/your county.

New radar product below
Go to: "Select View" then "Local Radar"
Hit the purple circle to see that local radar site
+++++++++++++++++++++++
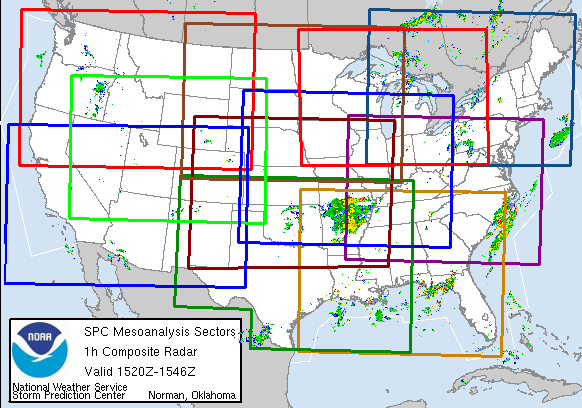
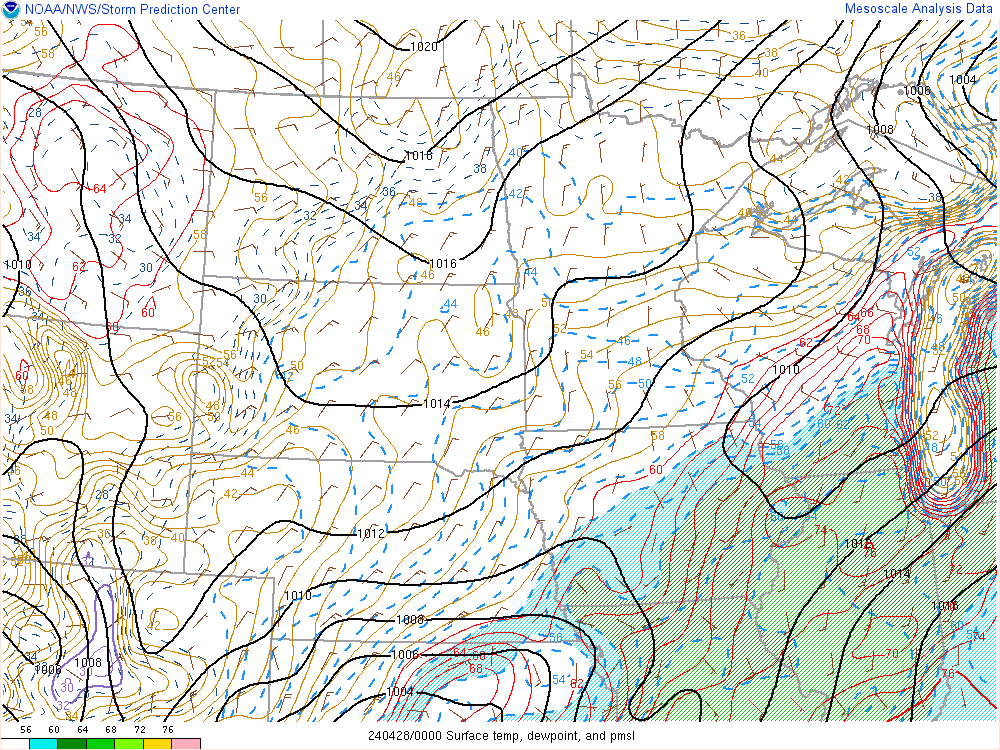
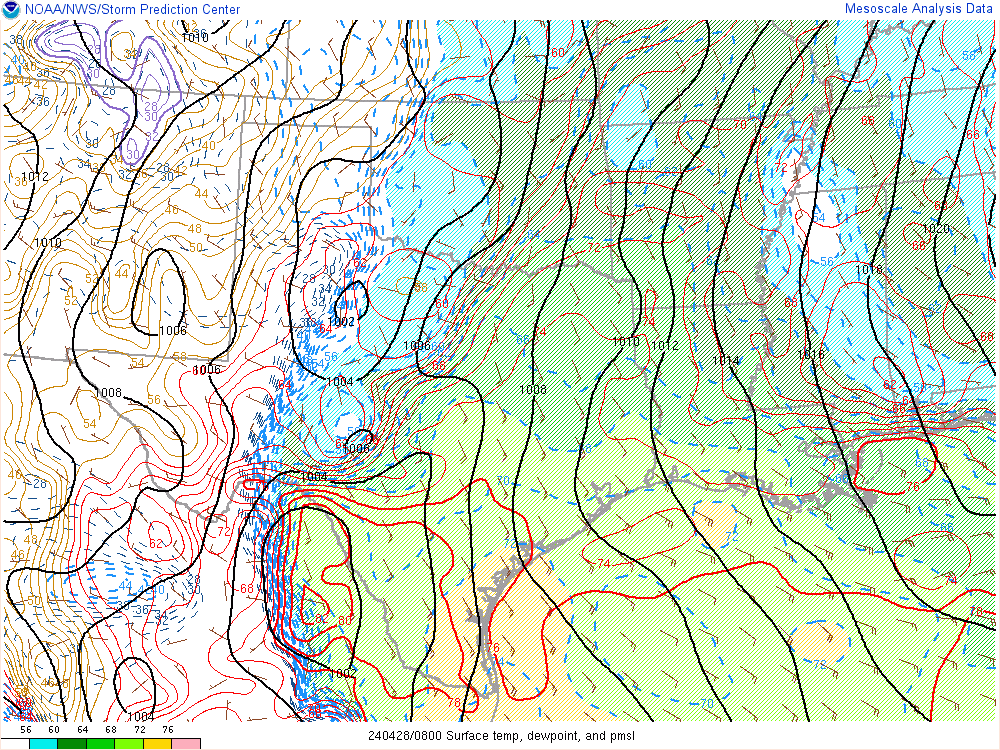
This link below provides some great data. After going to the link, hit "Mesoanalysis" then, the center of any box for the area that you want, then go to observation on the far left, then surface observations to get constantly updated surface observations or hit another of the dozens of choices.
 Found a great new link/site that shows us how much precip fell(from 1 hr to 72 hours) for different periods to share with you. https://www.iweathernet.com/total-rainfall-map-24-hours-to-72-hours Data Update Cycle: The 1-hr mosaic is updated every 5 min (approx). All other mosaics are now updated hourly, including the 48h and 72h maps. The site does not allow me to copy the actual images/data here, as we do with all the other links above..........so just go to the link! |
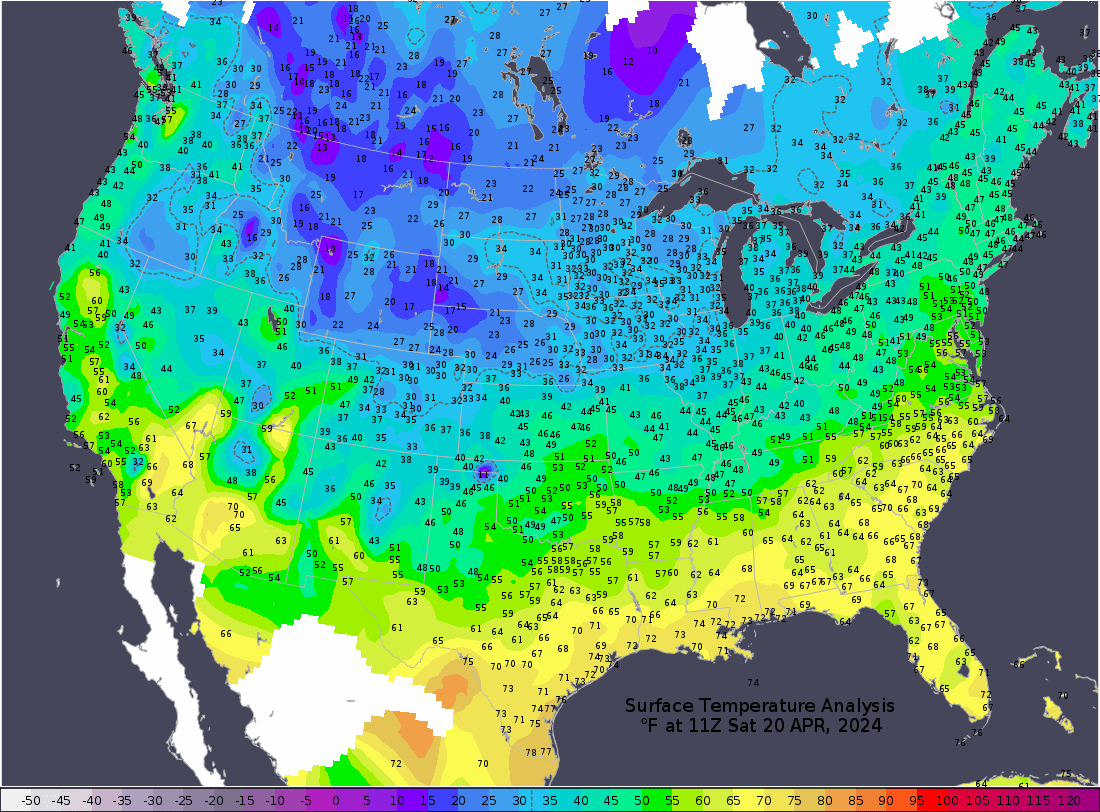
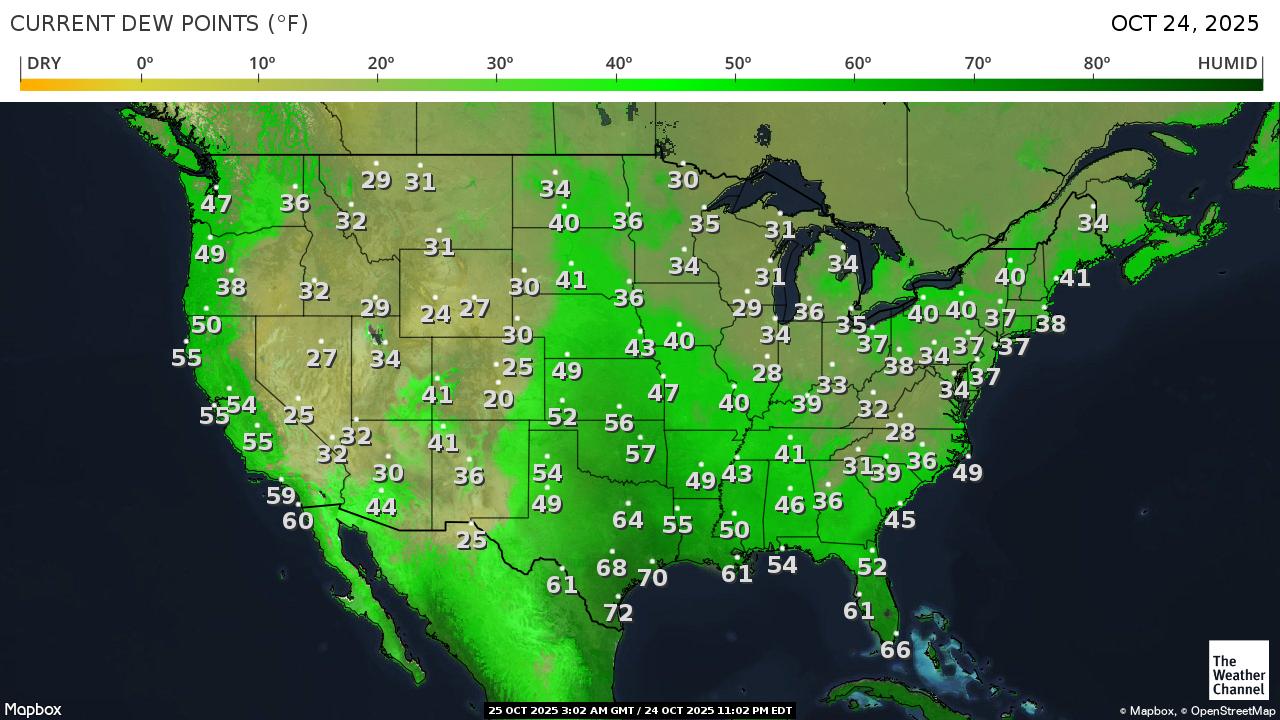
Current temperatures:
https://thermastor.com/dew-point-and-weather-maps/
Current Conditions below updated every few minutes.
UPPER MIDWEST
https://www.spc.noaa.gov/exper/mesoanalysis/new/viewsector.php?sector=13#


https://www.spc.noaa.gov/exper/mesoanalysis/new/viewsector.php?sector=13#
LOWER MIDWEST
https://www.spc.noaa.gov/exper/mesoanalysis/new/viewsector.php?sector=20

https://www.spc.noaa.gov/exper/mesoanalysis/new/viewsector.php?sector=20#

https://www.spc.noaa.gov/exper/mesoanalysis/new/viewsector.php?sector=20# 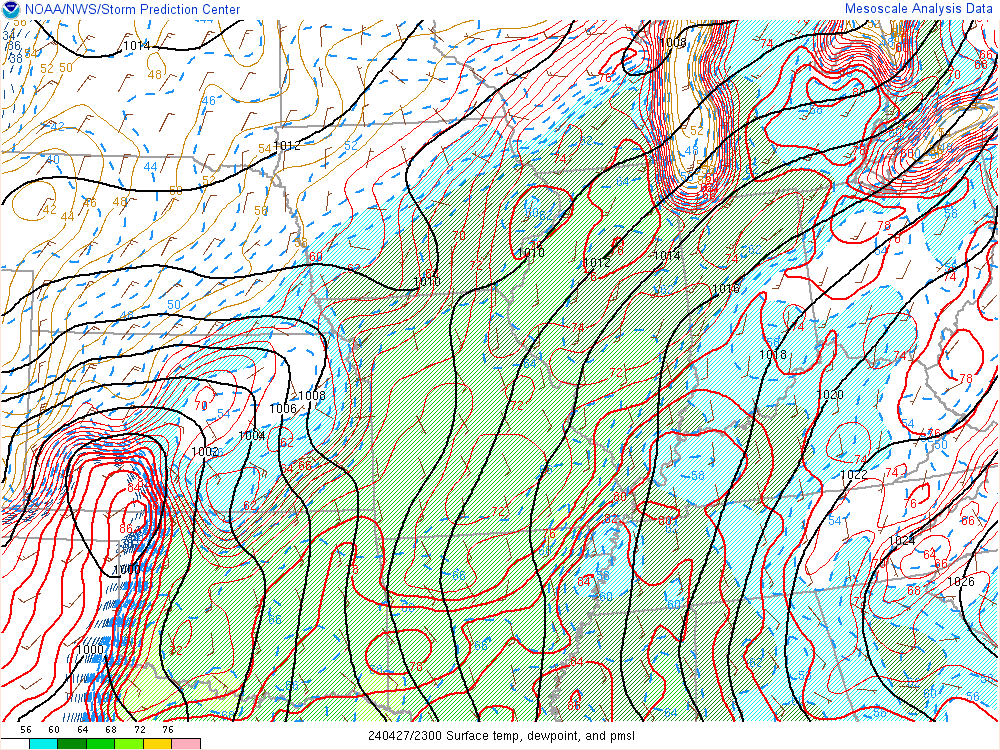
SOUTHCENTRAL
https://www.spc.noaa.gov/exper/mesoanalysis/new/viewsector.php?sector=15#
SOUTHEAST
https://www.spc.noaa.gov/exper/mesoanalysis/new/viewsector.php?sector=18#

1. Weather map now.
2. In 24 hours and
3. In 48 hours.
https://www.wpc.ncep.noaa.gov/#

+++++++++++++++++++++++++++++++++++++++++++++++++
Surface Weather maps for days 3-7 below:
https://www.wpc.ncep.noaa.gov/medr/medr.shtml

+++++++++++++++++++++++++++++++++++++++++++
The latest 7 day precip forecasts are below.
Day 1 below:
http://www.wpc.ncep.noaa.gov/qpf/fill_94qwbg.gif?1526306199054

Day 2 below:
http://www.wpc.ncep.noaa.gov/qpf/fill_98qwbg.gif?1528293750112

Day 3 below:
http://www.wpc.ncep.noaa.gov/qpf/fill_99qwbg.gif?1528293842764

Days 4-5 below:
http://www.wpc.ncep.noaa.gov/qpf/95ep48iwbg_fill.gif?1526306162

Days 6-7 below:
http://www.wpc.ncep.noaa.gov/qpf/97ep48iwbg_fill.gif?1526306162

7 Day Total precipitation below:
http://www.wpc.ncep.noaa.govcdx /qpf/p168i.gif?1530796126

Excessive rain threat.
https://www.wpc.ncep.noaa.gov/qpf/excess_rain.shtml
Current Day 1 Forecast
Day 1 Threat Area in Text Format
Current Day 2 Forecast |
Day 3 outlook

Severe Storm Risk......updated daily(days 1 and 2 twice daily).
https://www.spc.noaa.gov/products/outlook/
Current Day 1 Outlook | |
Current Day 2 Outlook | |
Current Day 3 Outlook | |
Current Day 4-8 Outlook |
Highs for days 3-7:
https://www.wpc.ncep.noaa.gov/medr/medr_max.shtml


+++++++++++++++++++++++++++++++++++++++++++++++
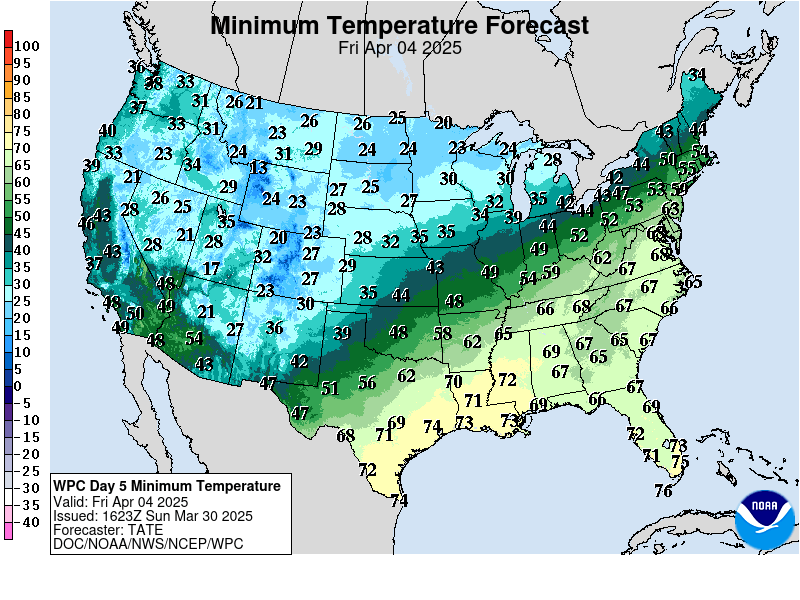
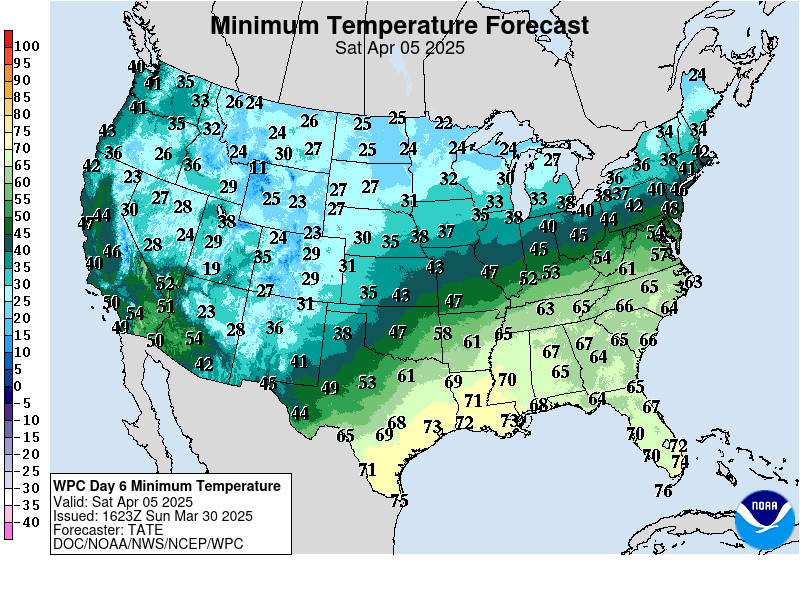
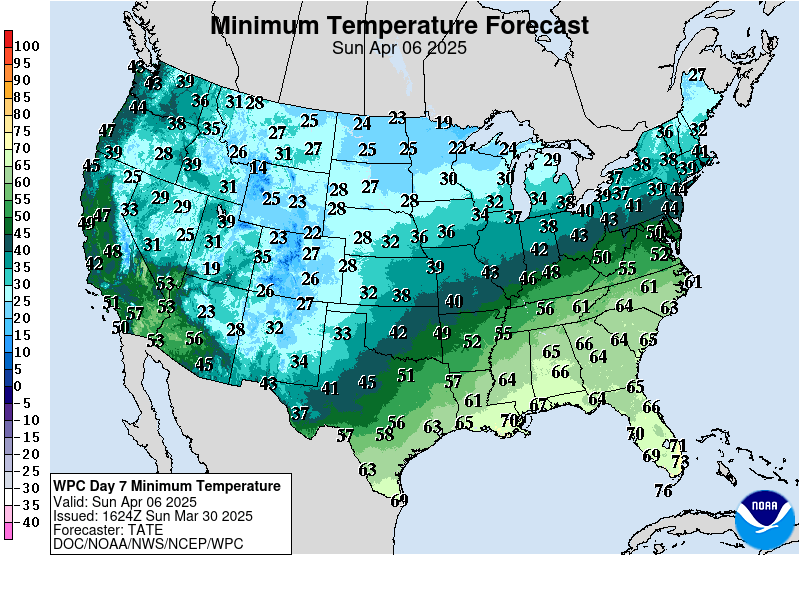
Lows days 3-7 below:
https://www.wpc.ncep.noaa.gov/medr/medr_min.shtml
Extended weather.
https://www.cpc.ncep.noaa.gov/products/predictions/610day/ | |||||||||
| 6 to 10 day outlooks | |||||||||
| Click below for information about how to read 6-10 day outlook maps Temperature Precipitation | |||||||||
| Click below for archives of past outlooks (data & graphics), historical analogs to todays forecast, and other formats of the 6-10 day outlooks ArchivesAnalogsLines-Only FormatGIS Data | |||||||||
Temperature Probability | |||||||||
Precipitation Probability | |||||||||
Soilmoisture anomaly:
These maps sometimes take a day to catch up to incorporate the latest data(the bottom map is only updated once a week).
https://www.cpc.ncep.noaa.gov/products/Soilmst_Monitoring/US/Soilmst/Soilmst.shtml#
![]()


++++++++++++++++++++++++++++
Updated daily below:
https://mrcc.purdue.edu/cliwatch/watch.htm#curMonths

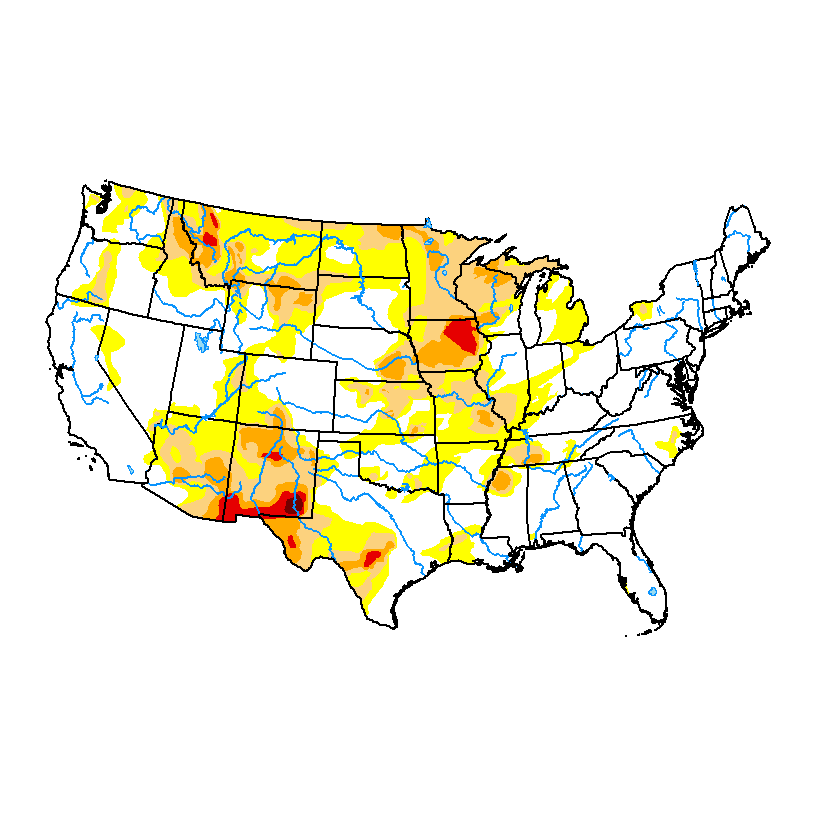
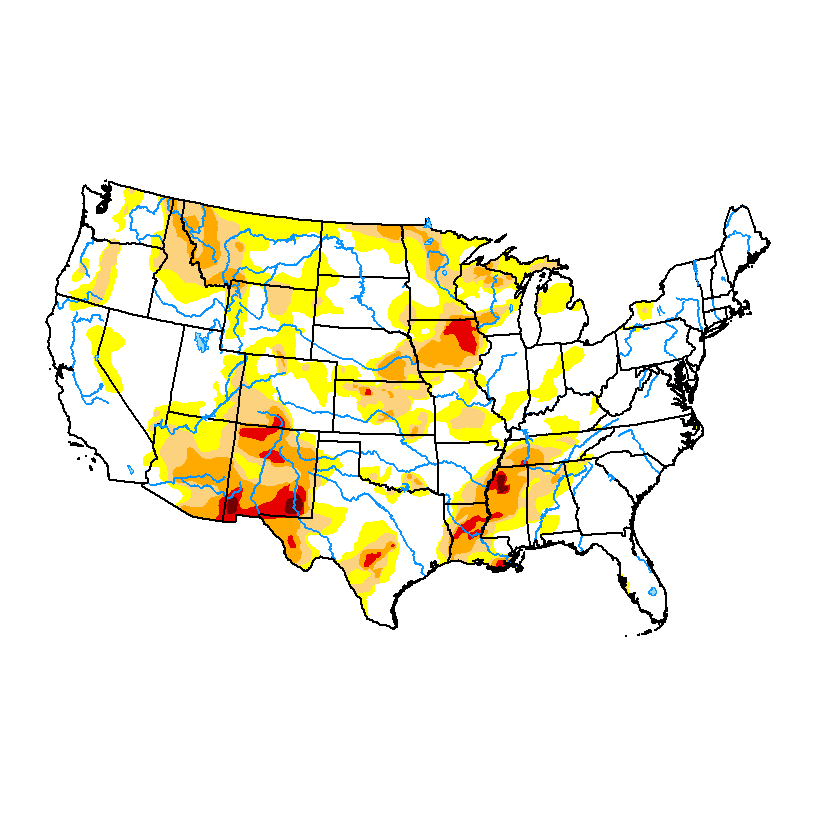
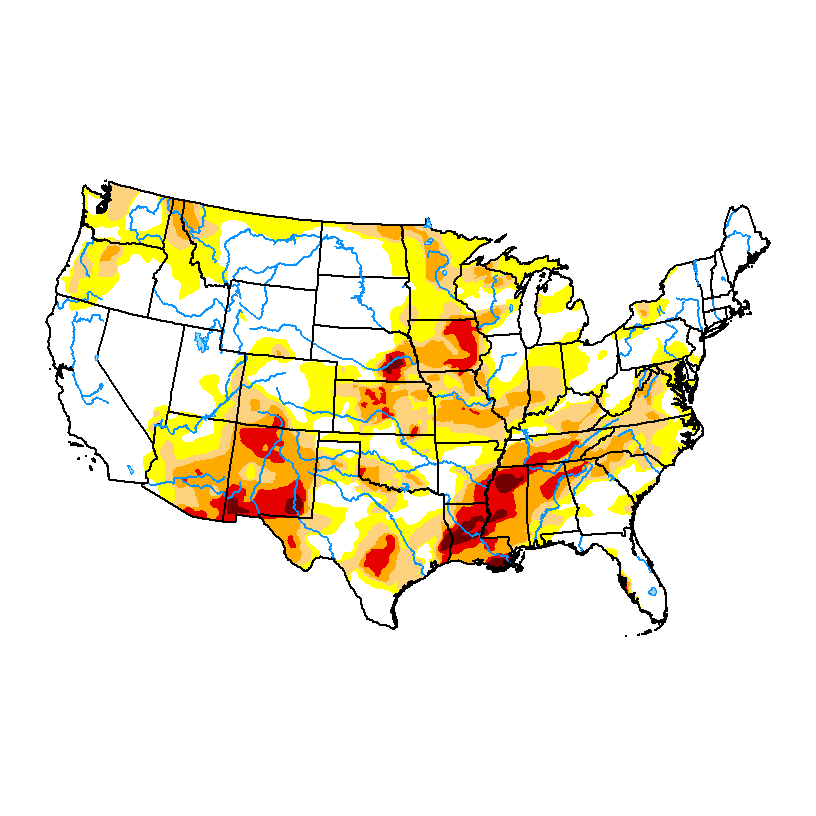
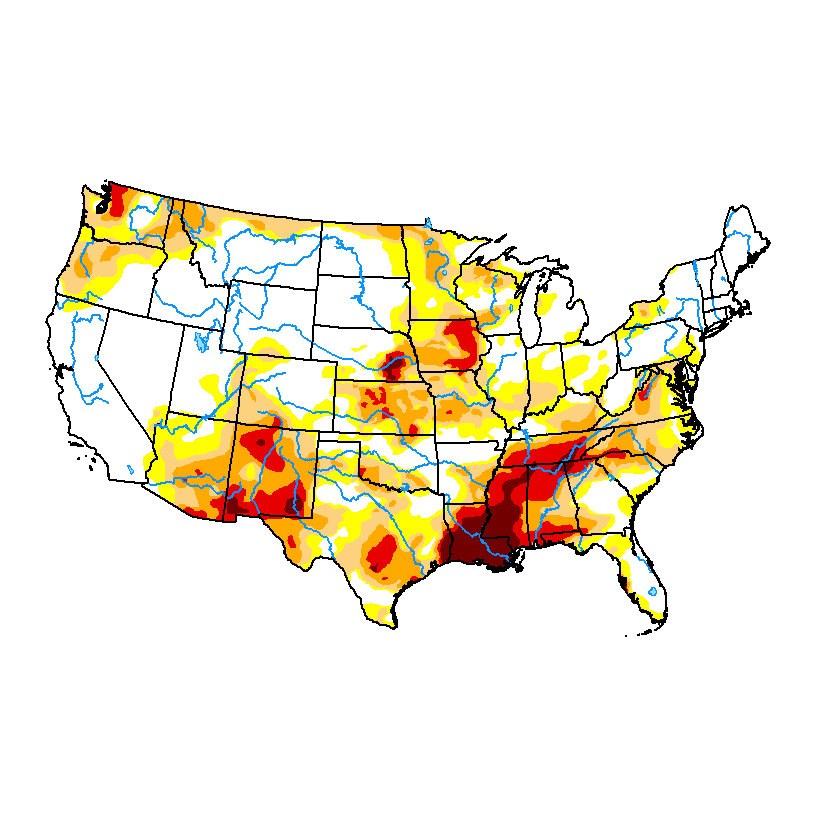
DROUGHT MONITOR
https://droughtmonitor.unl.edu/
Last week as of April 23, 2024-no drought in California from the El Nino
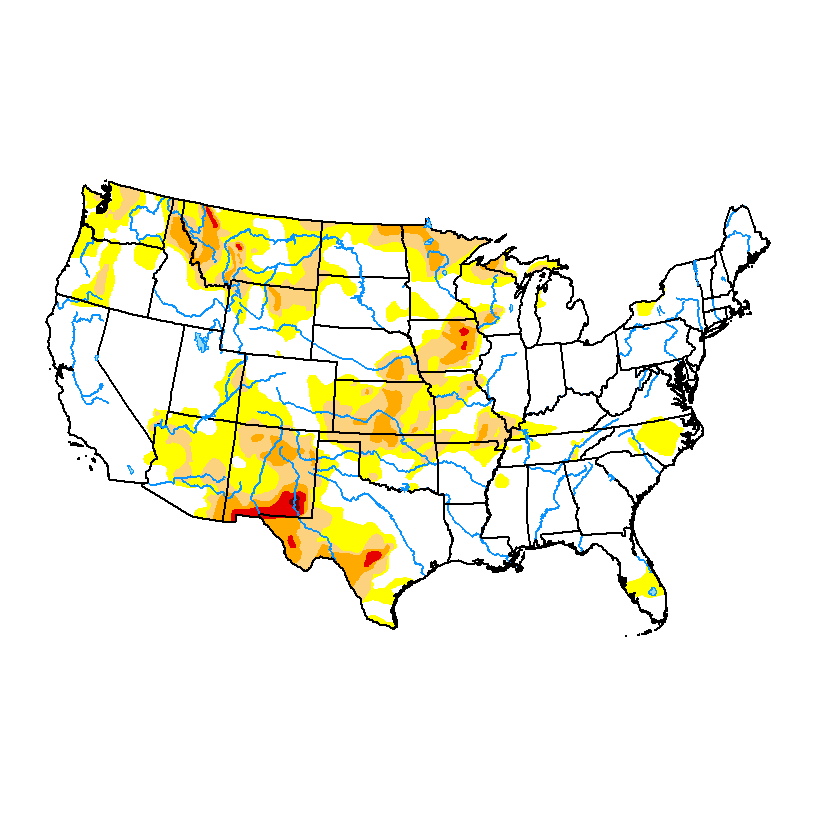
As of March 12, 2024
January 30, 2024 below
DECEMBER 12, 2023 below
NOVEMBER 14, 2023
October 17, 2023

August, 2023, BELOW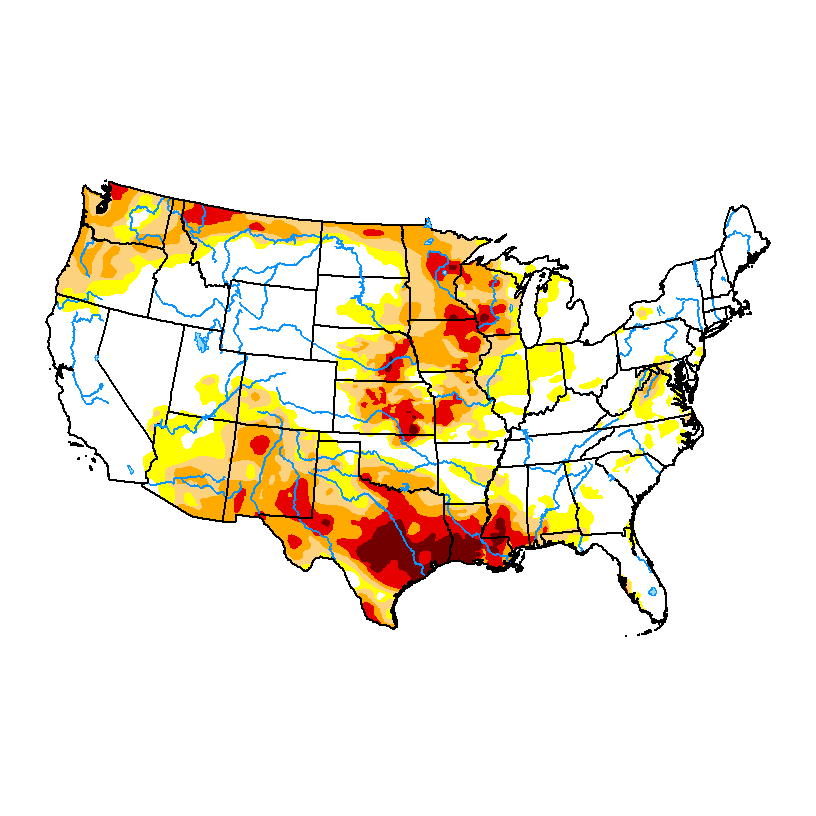
April 18, 2023-1 year ago:

DROUGHT MONITOR NOVEMBER 1, 2022-After a long lived La Nina-BEFORE EL NINO wiped out much of the drought OUT WEST the Winter of 2022/23!
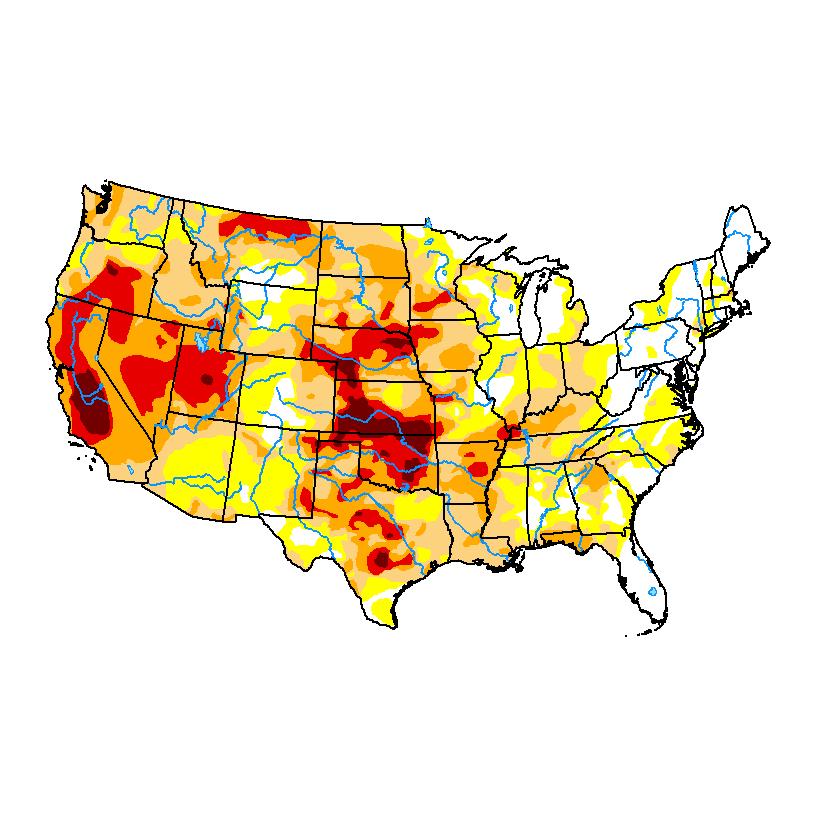
Drought monitor previous years: You can see the natural La Niña, (cold water-in the tropical Pacific)causing the drought! Starting in 2020, then worsening for 2+ years!
Summer Forecast..........HOT and DRY except for Eastern Cornbelt:
https://www.marketforum.com/forum/topic/83698/
NEW: La Nina/-PDO with latest Summer Forecast 4-26-22
23 responses |
Started by metmike - April 26, 2022, 6:59 p.m
EXTENDED MAPS BELOW UPDATE CONSTANTLY!
https://www.cpc.ncep.noaa.gov/products/predictions/long_range/
https://www.cpc.ncep.noaa.gov/products/predictions/long_range/seasonal.php?lead=2
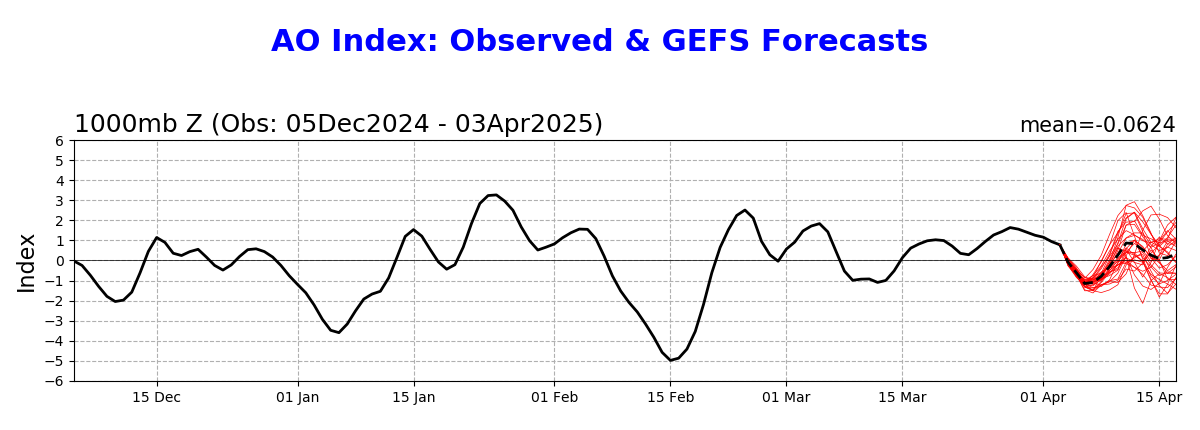
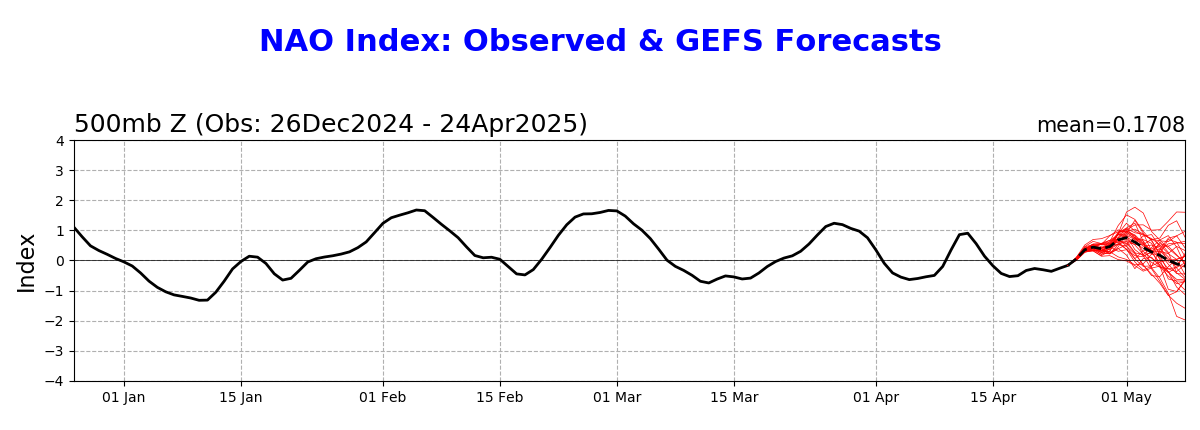
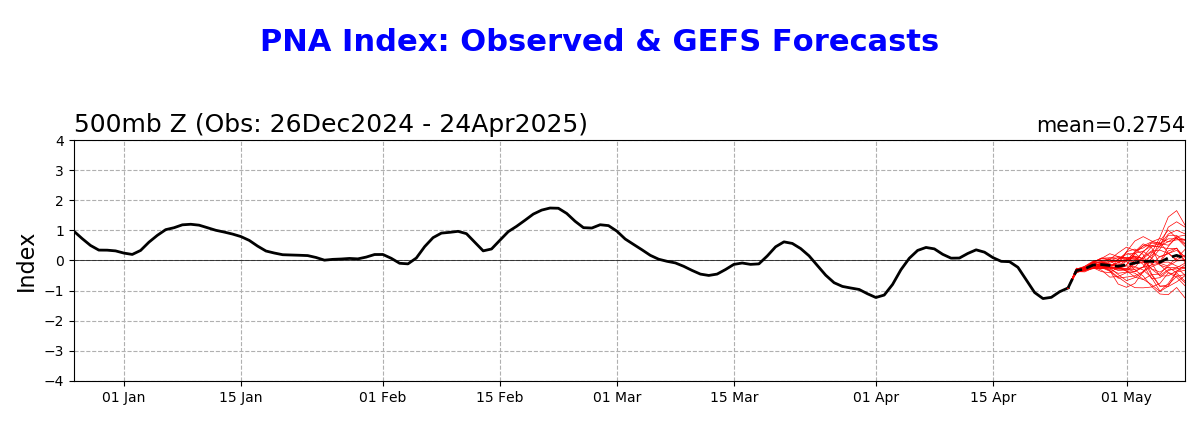
Arctic Oscillation Index, North Atlantic Oscillation Index, Pacific North American Index.
https://www.cpc.ncep.noaa.gov/products/precip/CWlink/daily_ao_index/ao.shtml
https://www.cpc.ncep.noaa.gov/products/precip/CWlink/pna/nao.shtml
https://www.cpc.ncep.noaa.gov/products/precip/CWlink/pna/pna.shtml
++++++++++++++++++++++++++++++++++++++++++++
GFS ensemble mean anomalies at 2 weeks.
https://www.psl.noaa.gov/map/images/ens/z500anom_nh_alltimes.html 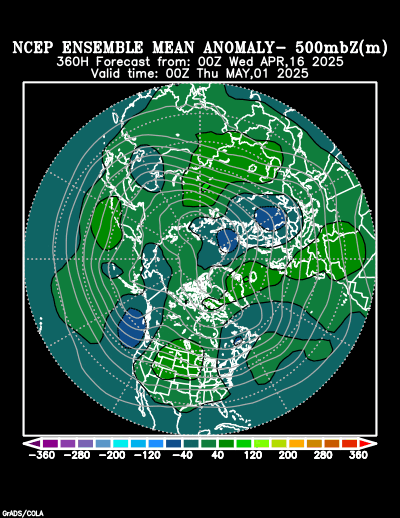
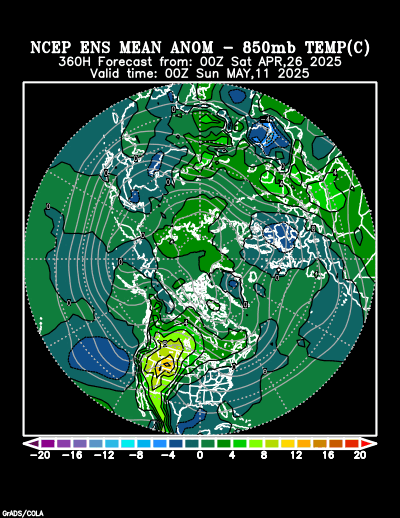
2 week 850 temp for ensemble mean anomaly
https://www.psl.noaa.gov/map/images/ens/t850anom_nh_alltimes.html
Corn seed likes temperatures above 50 degrees for germination.
This map is updated daily(with previous days data).
https://mesonet.agron.iastate.edu/agclimate/soilt.php

TOO COLD to plant the rest of April.
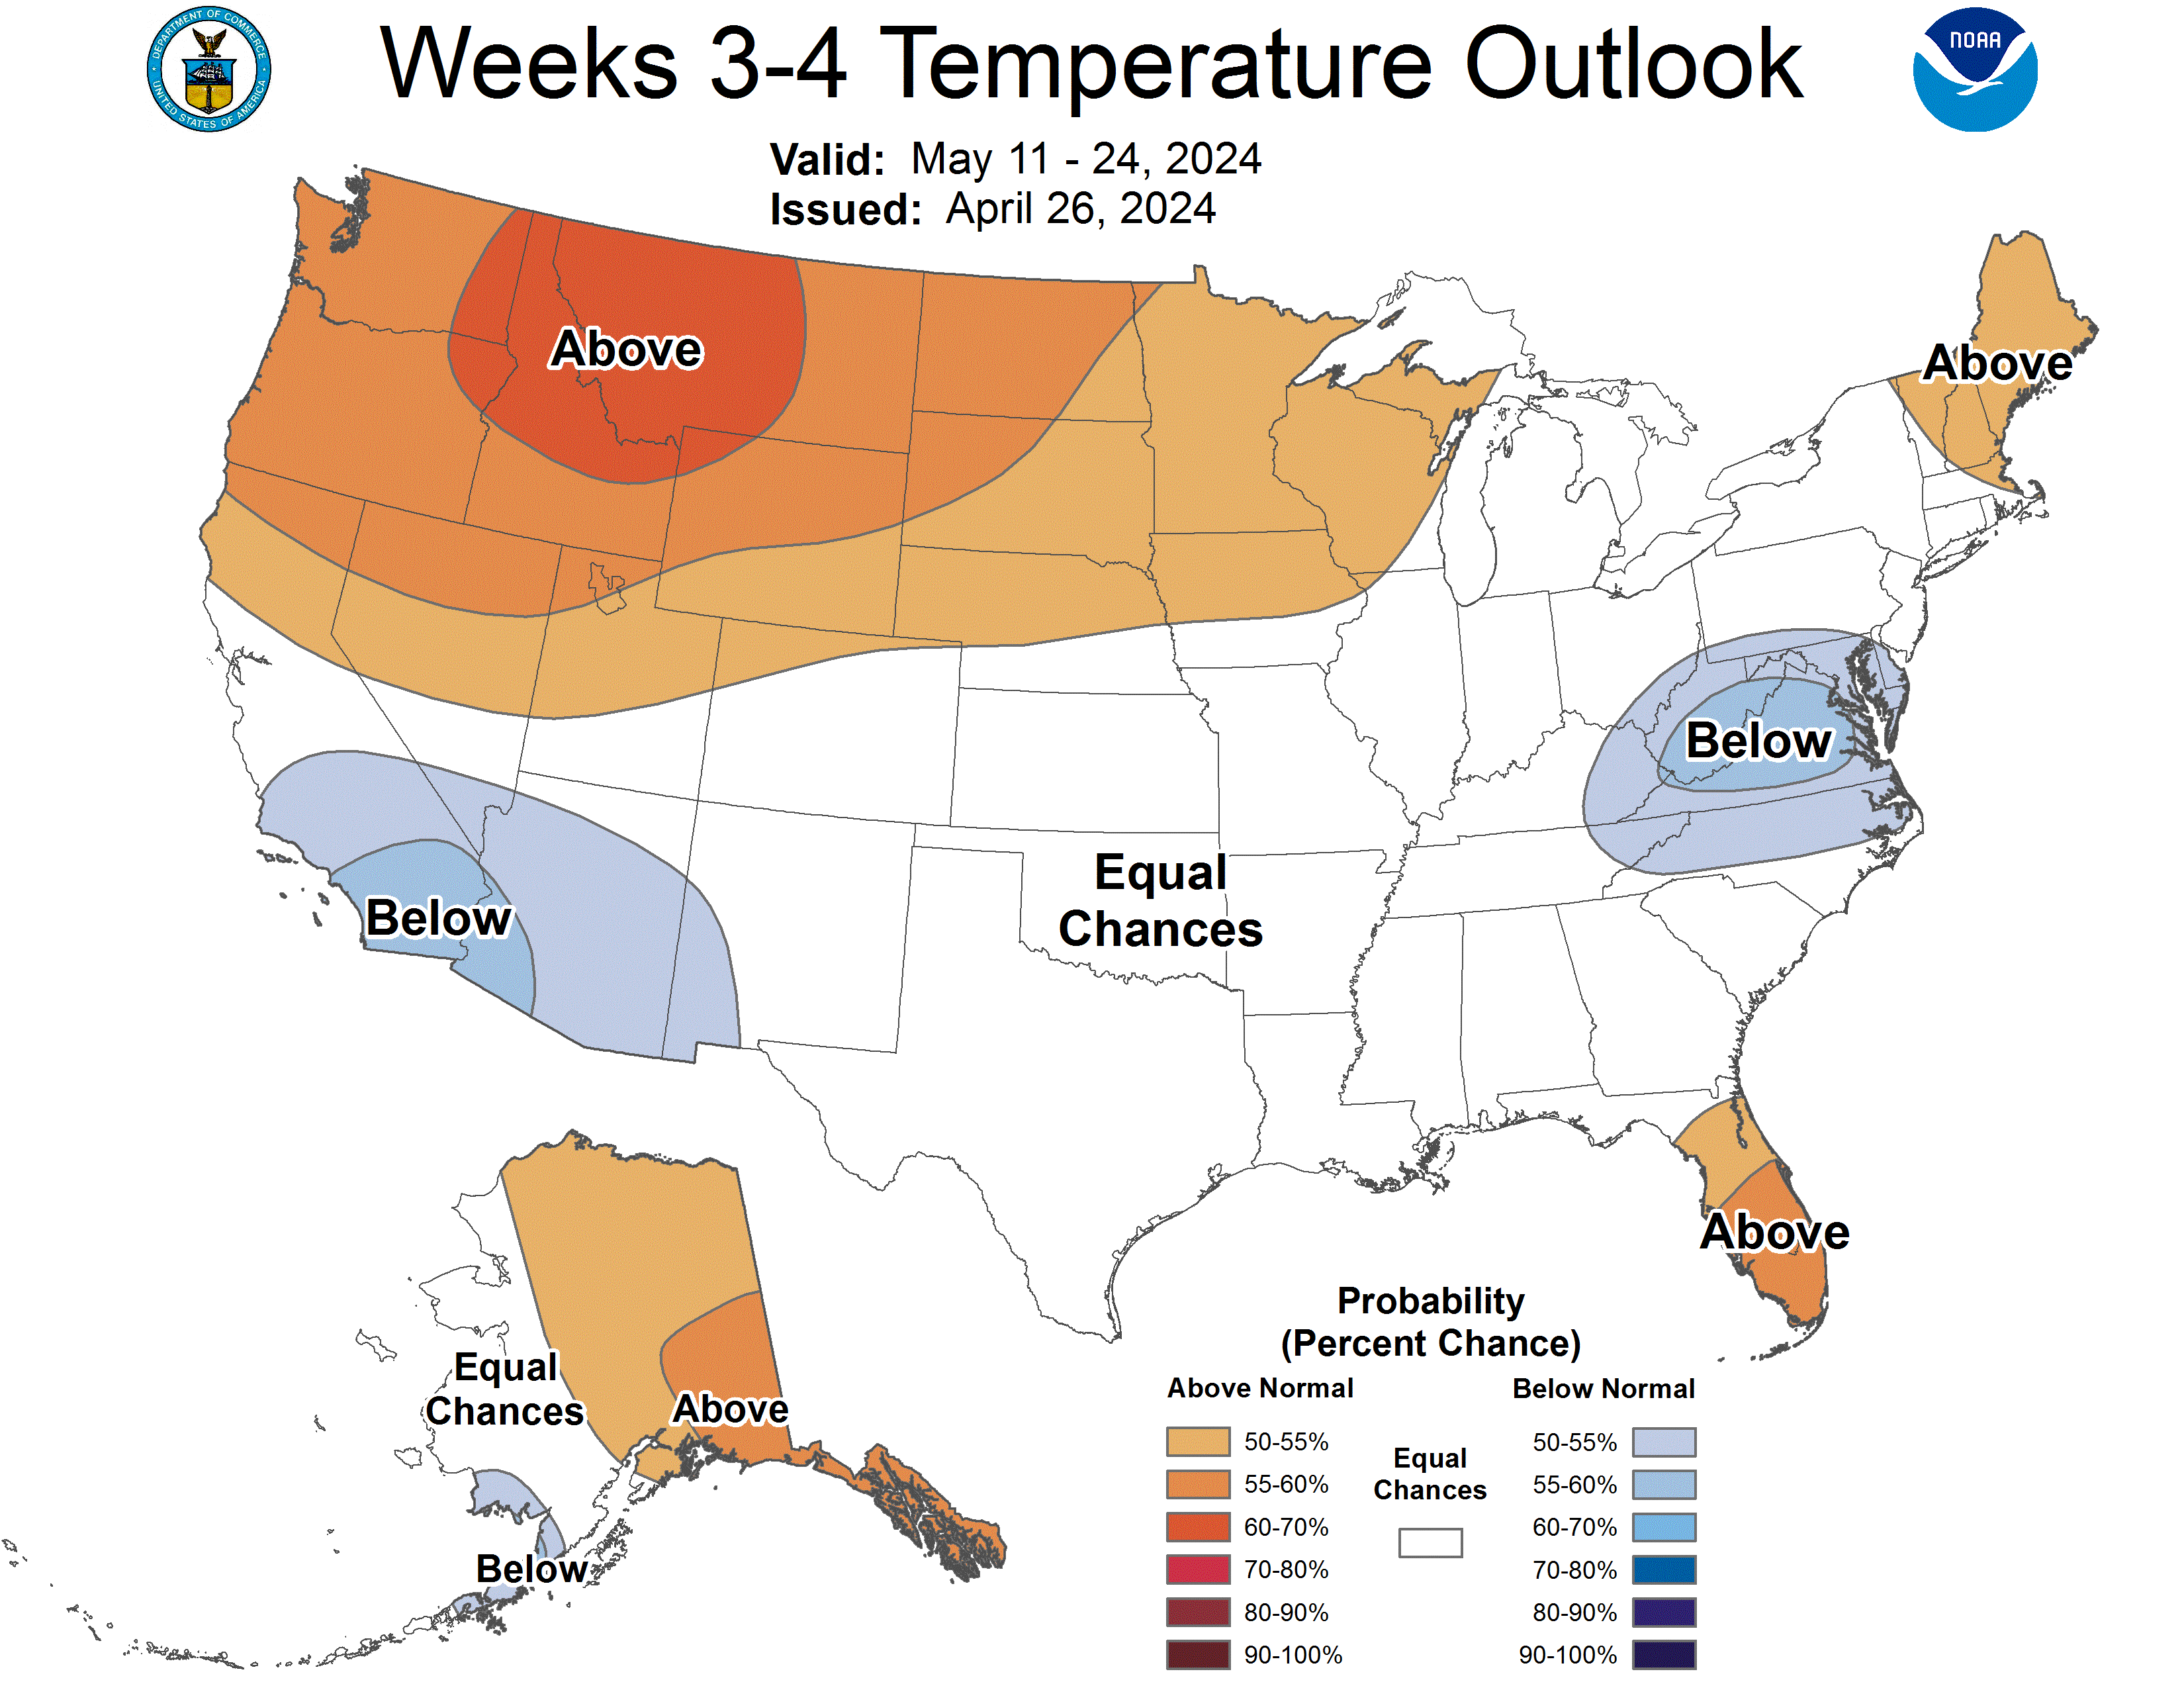
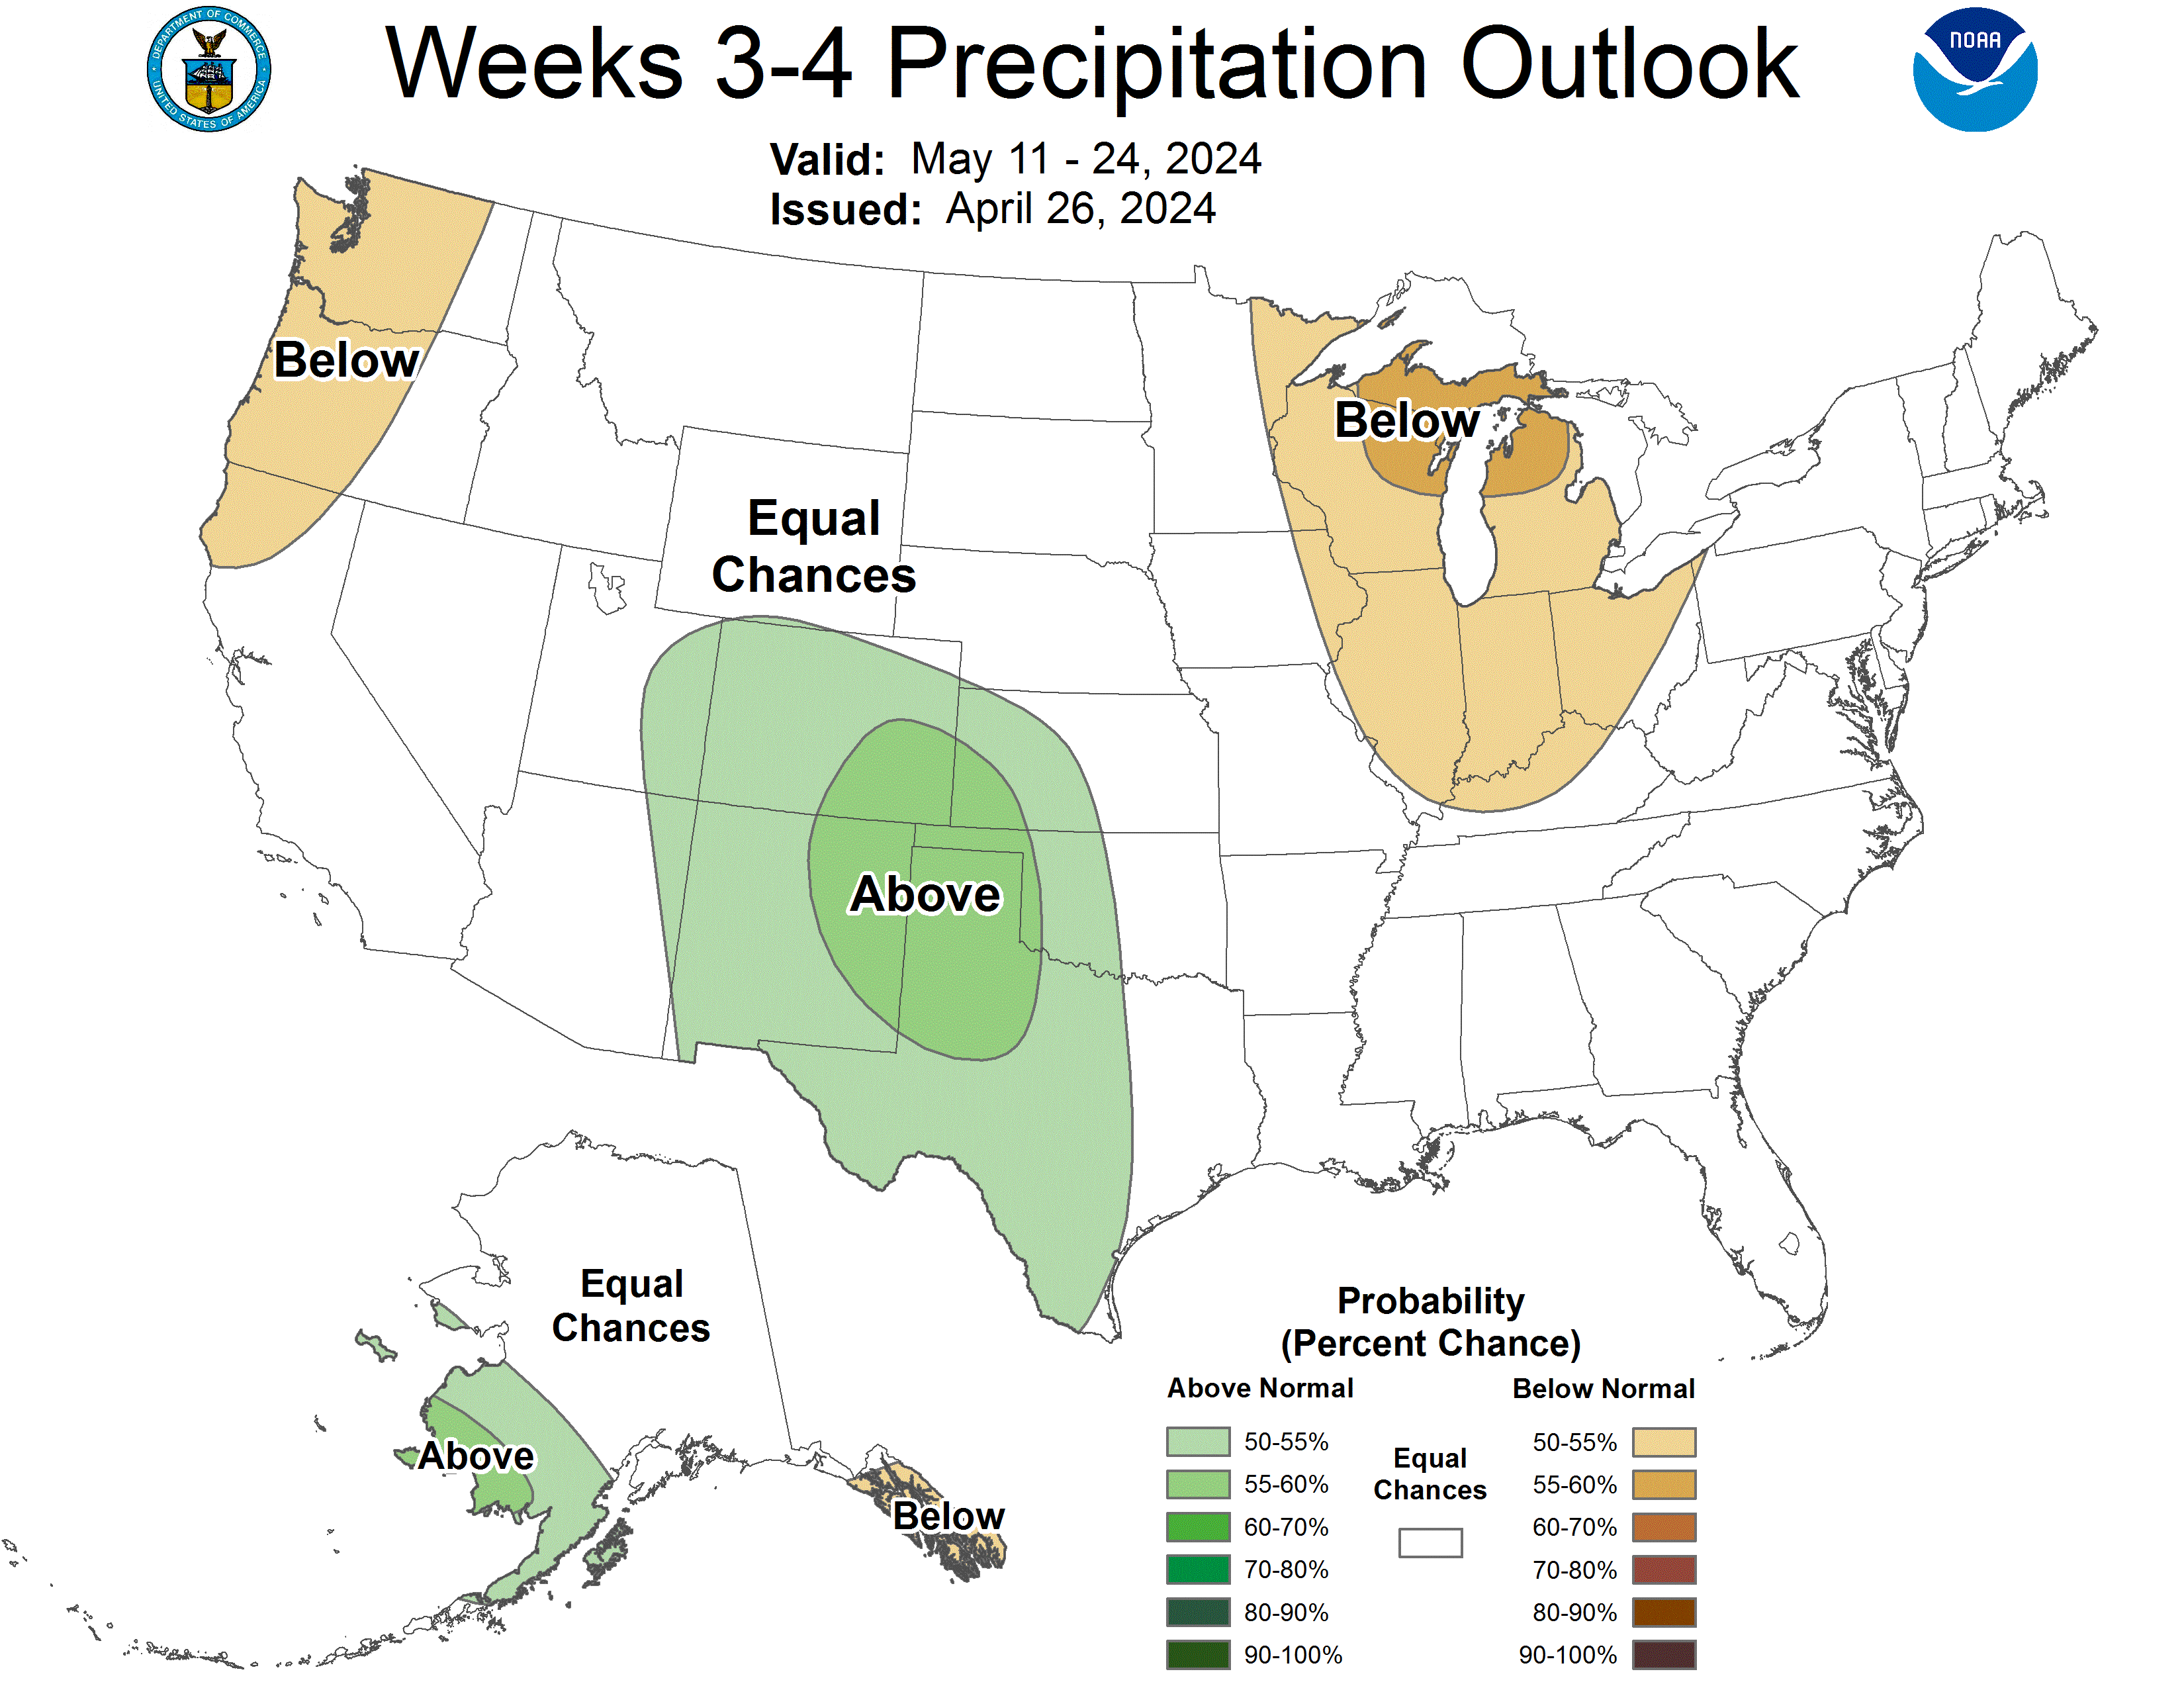
Week 3-4 forecasts don't have a great deal of skill.
https://www.cpc.ncep.noaa.gov/products/people/mchen/CFSv2FCST/weekly/
Temperatures below. These maps are 1 day old.
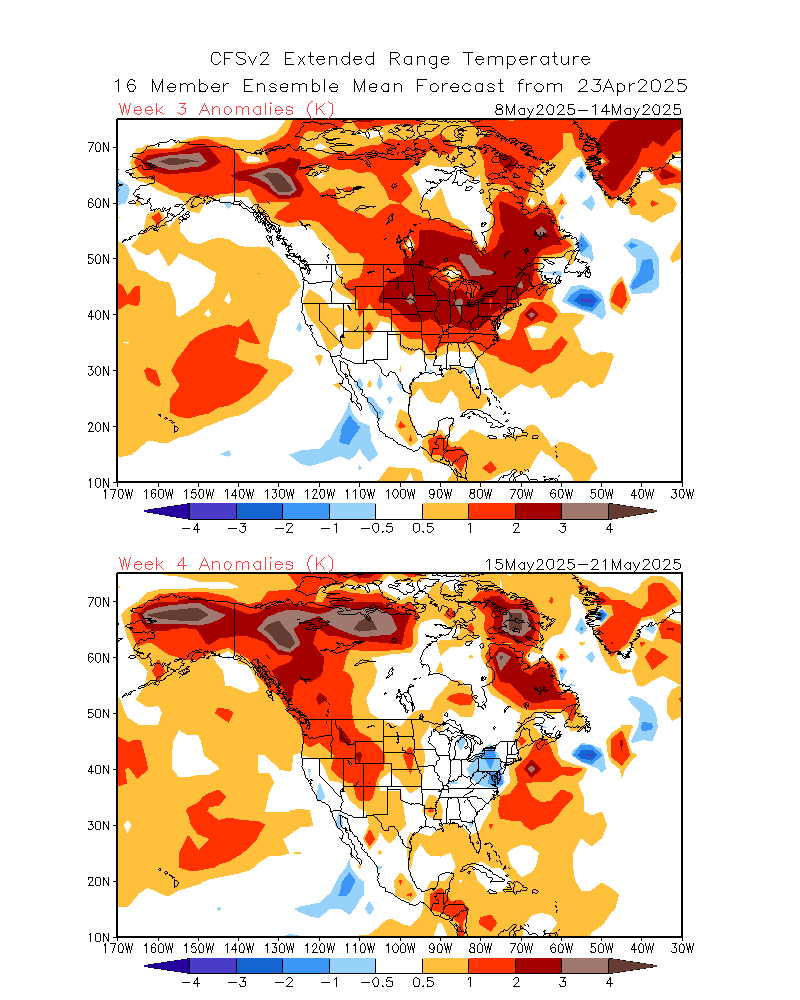
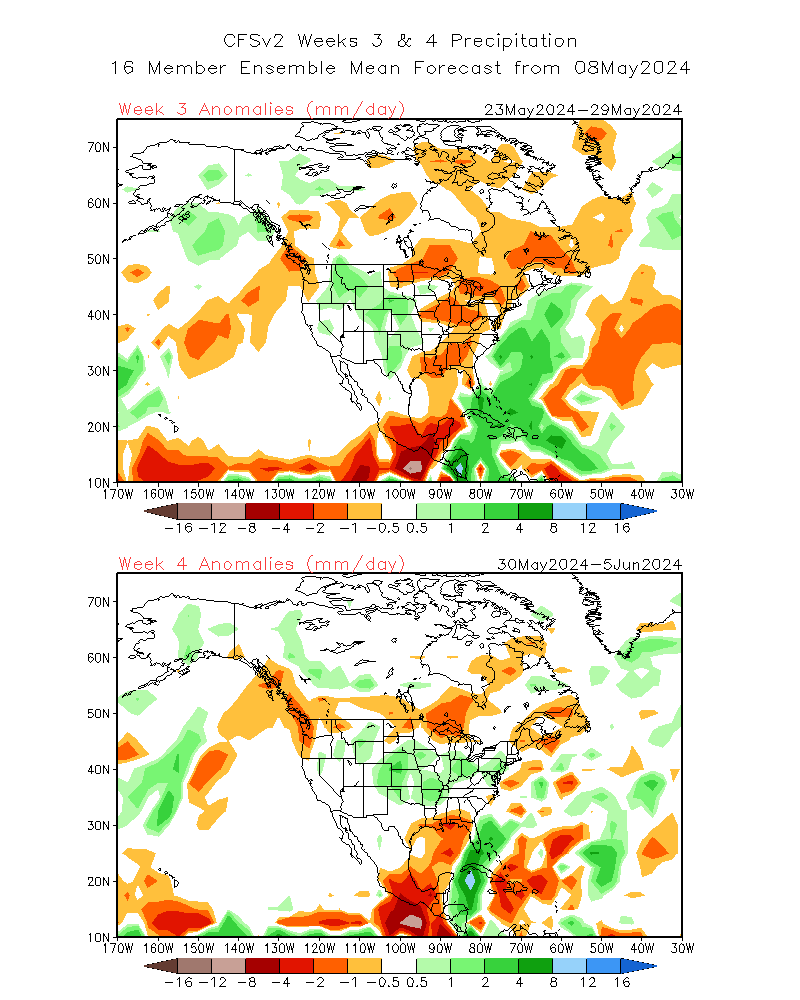
Precip below..
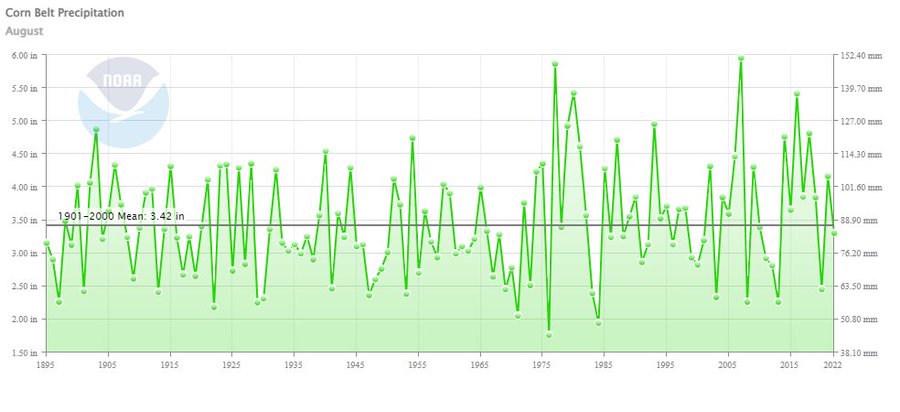
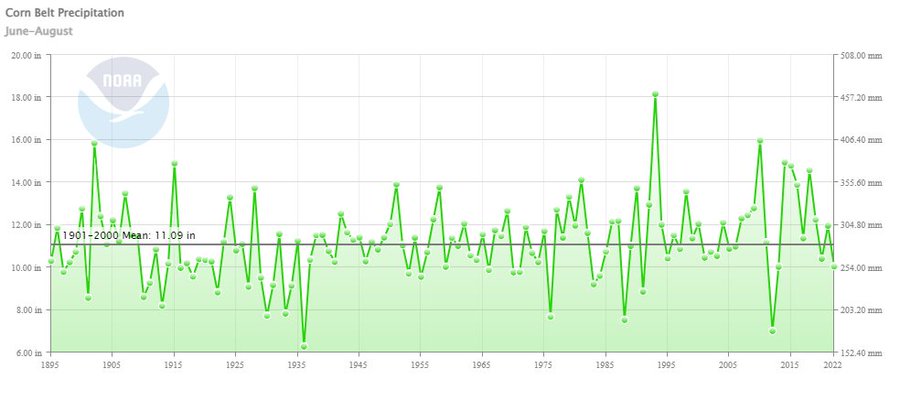
Corn Belt (productivity weighted) rainfall rain 0.11" below normal in August and 1.03" below normal for the summer (driest summer since 2013)
More welcome rain/snow to help completely eradicate the drought in some places out West.
https://www.marketforum.com/forum/topic/83844/
Funny how NO news/media are describing it that way.
https://droughtmonitor.unl.edu/Maps/CompareTwoWeeks.aspx

On the other side, that contradicts the truth, those sensationalizing to generate ratings and sell newspapers know that good news doesn't sell.
Officials warned of inundated streets, overflowing rivers and more snow in the mountains. The National Weather Service issued a rare “high risk” warning for the Central Coast.
https://www.nytimes.com/2023/03/09/us/california-weather-rain-storm-flood.html
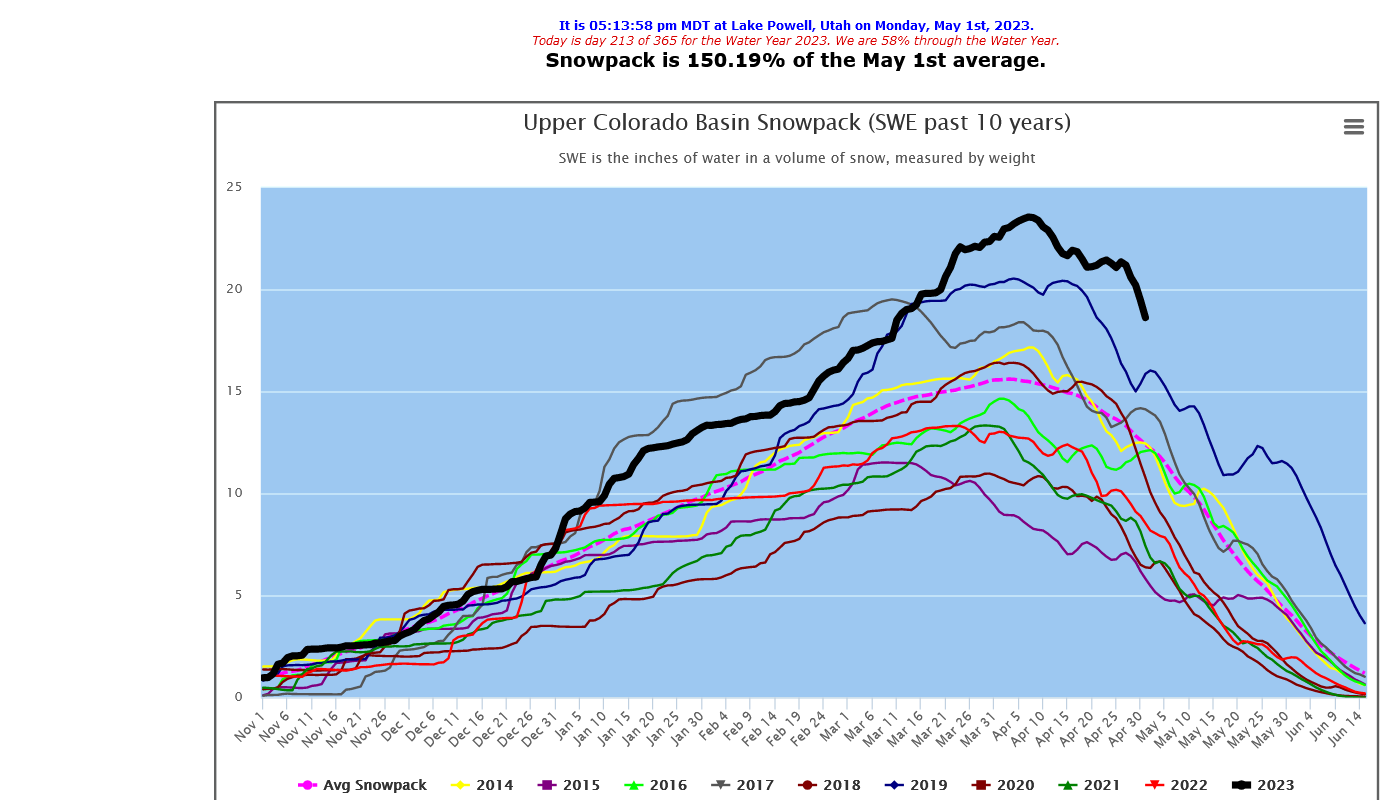
Highest snow pack in the last 10 years for the Southwest with more on the way.
This is astounding and just what the drought doctor ordered!
Why only reporting on how extreme and bad this is by media?
That doesn't sell!
This is mainly thanks to the global warming pattern/El Nino kicking in again in the Pacific after the pause caused by the La Nina(cold water in the tropical Pacific) which caused the drought....is over!
Climate change INCREASES precip!
https://www.wcc.nrcs.usda.gov/ftpref/data/water/wcs/gis/maps/west_swepctnormal_update.pdf
Thanks, Jean!
I remember talking with Jim Roemer a few times back in the early/mid 90's when he was part of the Freese-Notis, Trade-Winds commodity weather advising service. Craig Solberg too. I was mega impressed with their knowledge of how the weather impacted ag and energy markets, which was what I was making a killing doing in the 1990's from the get go.
This was before the internet and I had a satellite dish on the roof getting the weather information the same time the NWS did. Big funds used meteorologists that would take some time to update forecasts, then pass it on and I was already in before the market dialed in the updated forecast.
There were no algorithms jerking the markets around and they reacted much more predictably.
Today, they have in house models that are sometimes a few minutes faster than anything that I get.
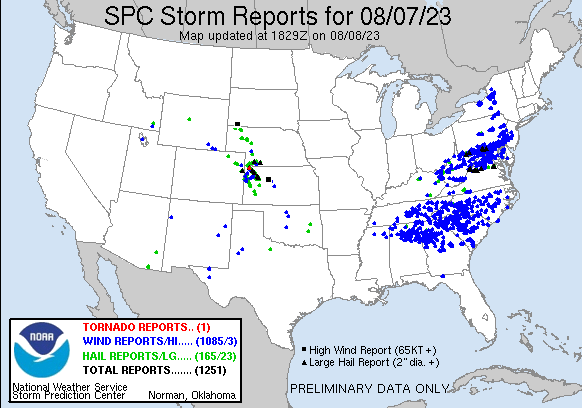
Over 1,000 severe storm reports yesterday/8-7-23
https://www.marketforum.com/forum/topic/98002/#98044
This is incredible for August which is NOT severe weather season!!! Just 1 weak tornado in KS.
Yesterday's Storm Reports (20230807 1200 UTC - 20230808 1159 UTC) (Print Version)
| < 230806 Reports 230808 Reports > |
| Note: All Reports Are Considered Preliminary |
https://www.spc.noaa.gov/climo/reports/yesterday.html
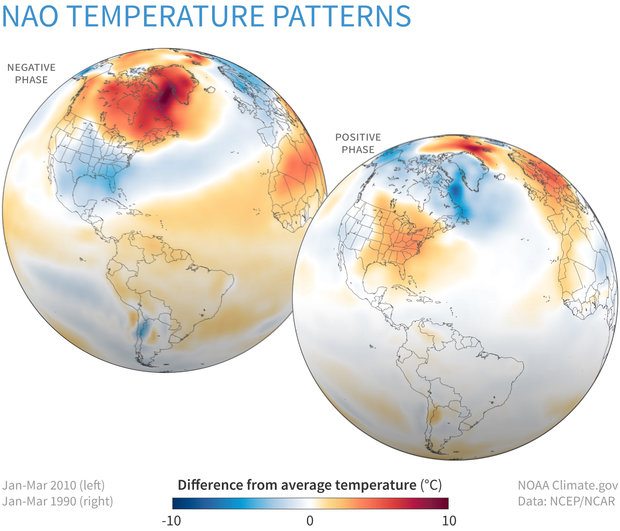
As long as the NAO stays this positive, cold air will find it very difficult to penetrate very far south and to stay very long!
https://www.cpc.ncep.noaa.gov/products/precip/CWlink/pna/nao.shtml
++++++++++++++++++
Major Sudden Strat. Warming: chance increasing in early Jan
Started by WxFollower - Dec. 20, 2023, 9:19 p.m.
https://www.marketforum.com/forum/topic/101402/
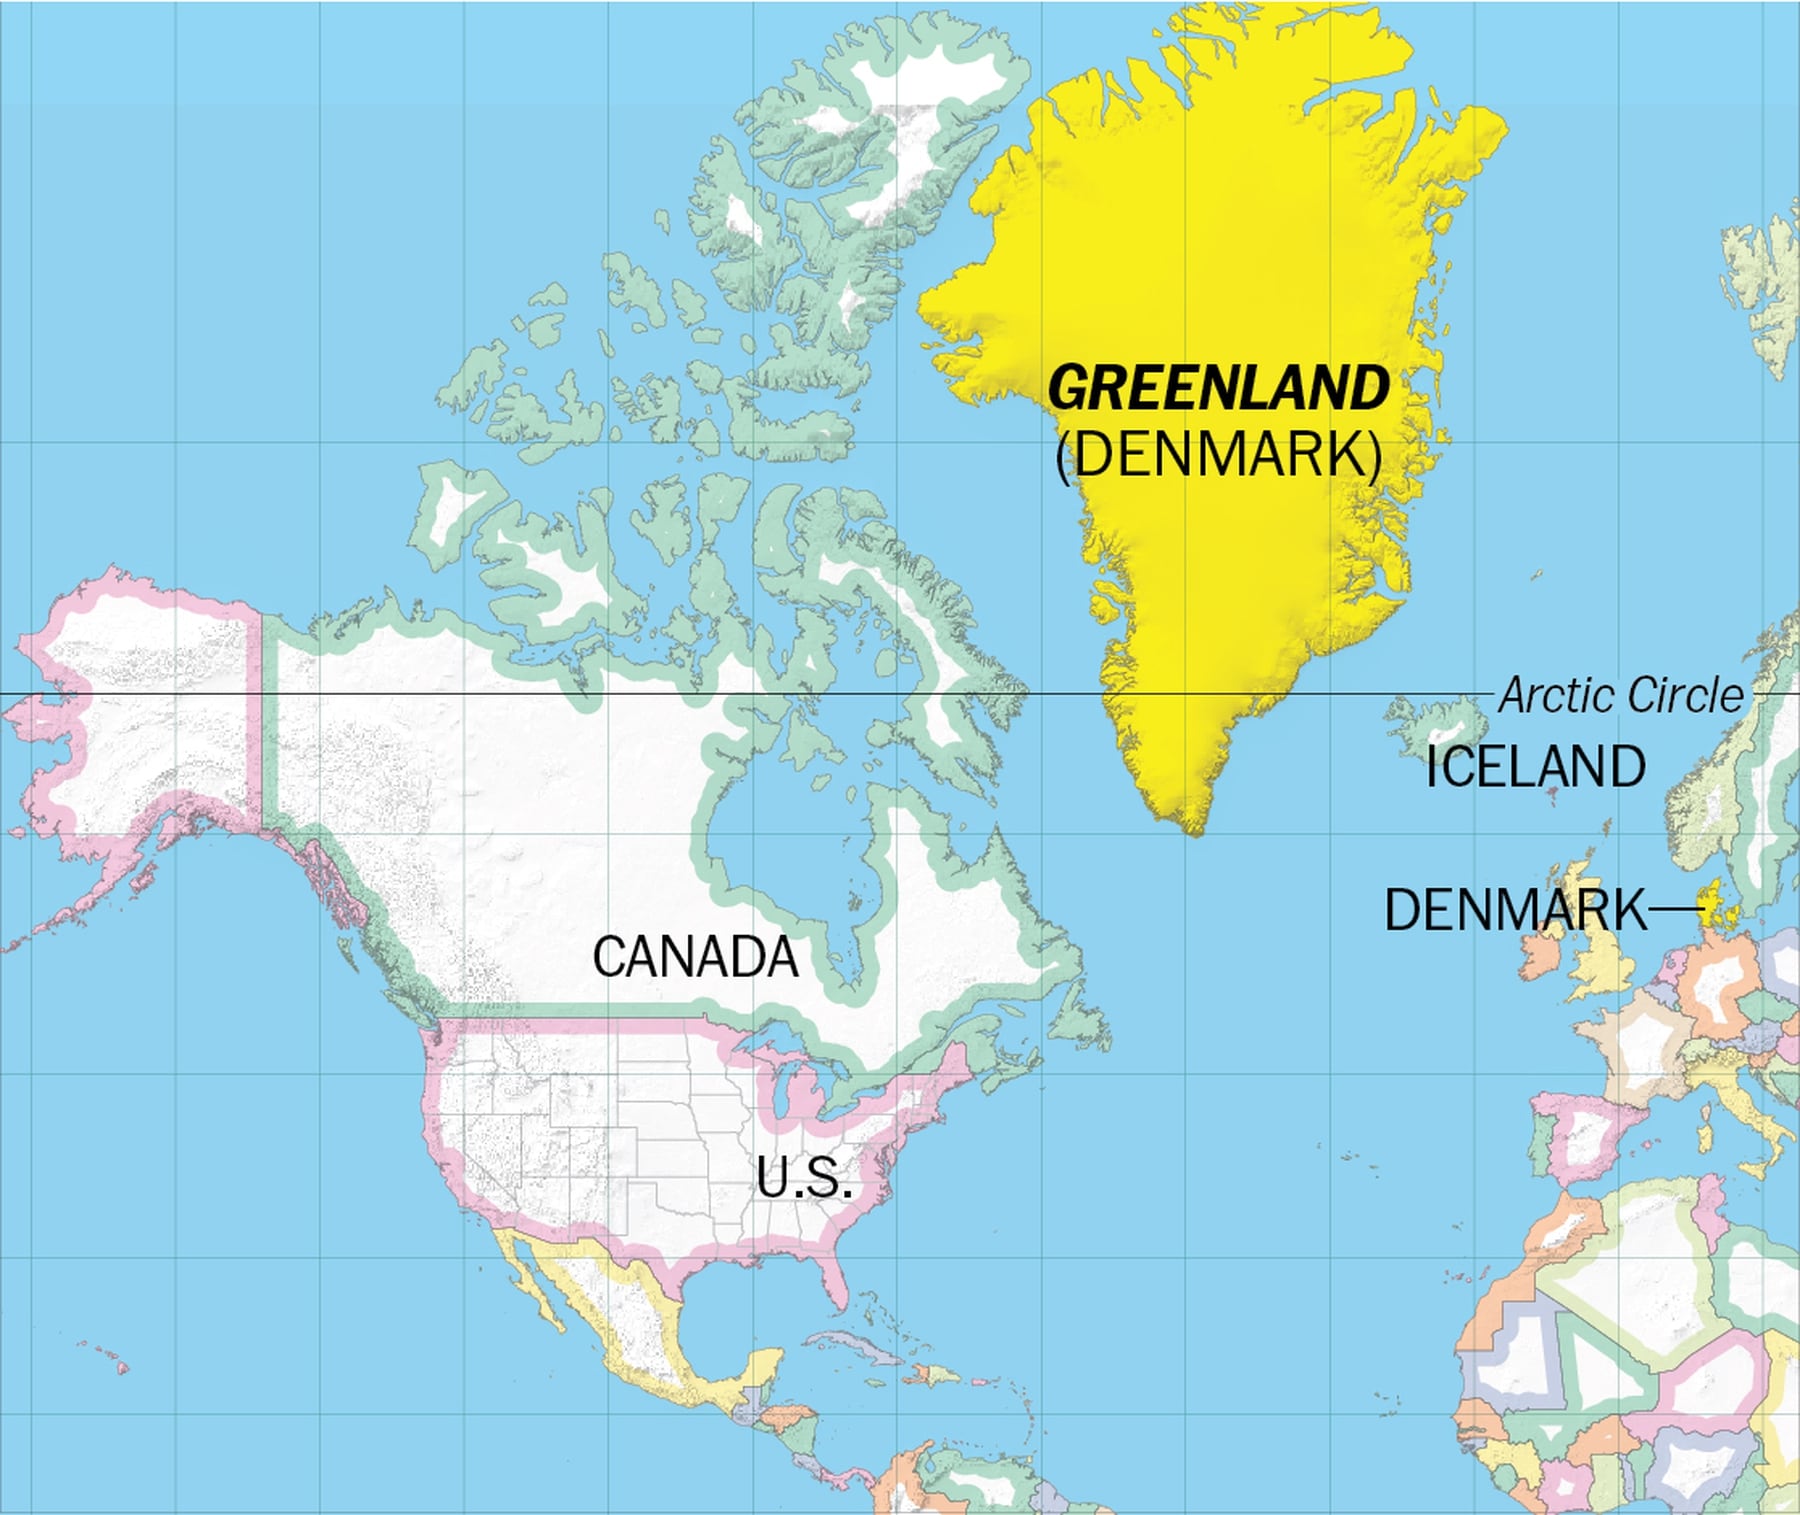
Although the models were milder overnight, the Greenland block type anomaly in 2 weeks suggests a very solid cold air connection by mid January.
https://www.marketforum.com/forum/topic/101402/#101515
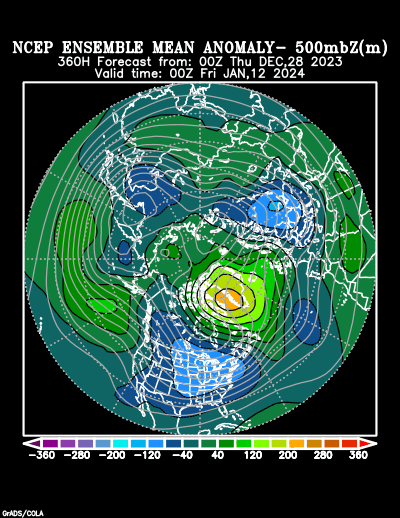
Supporting that is the NEGATIVE AO and NAO.
The much colder outlook described in late December continues to play out in the forecast:
https://www.marketforum.com/forum/topic/100525/#101558
Snow event 1-6-2024
Started by metmike - Jan. 2, 2024, 1:21 p.m.
We're focusing on the specific metrics of the extreme weather in this pattern here:
Winter Storms/COLD week of 1-7-24+
Started by metmike - Jan. 7, 2024, 9:57 p.m.
https://www.marketforum.com/forum/topic/101628/
Millions in California face historic rain
Started by metmike - Feb. 5, 2024, 5:04 p.m.
https://www.marketforum.com/forum/topic/102099/
https://www.marketforum.com/forum/topic/102099/#102176
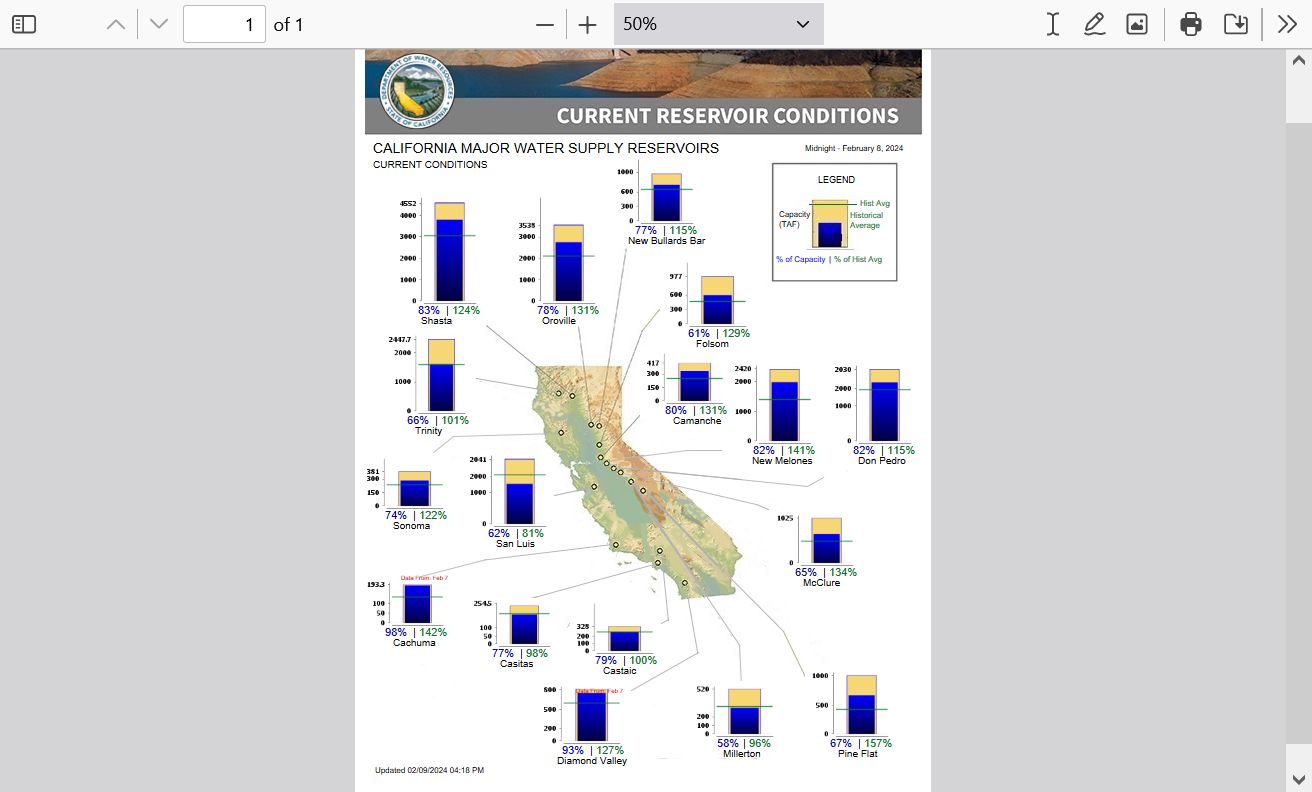
Outside of the fairly localized extreme event in the high population, Los Angeles area almost a week ago, these atmospheric river events from the Natural El Nino have blessed California with wonderful beneficial rains.
Most places will gladly take a bit more of the exact same events(absent the tiny % of area with the extreme rains) with only a very tiny reservoir close to capacity.
https://cdec.water.ca.gov/resapp/RescondMain
+++++++++++++
Early planting issues 3-20-24
12 responses |
Started by metmike - March 20, 2024, 12:22 p.m.
·
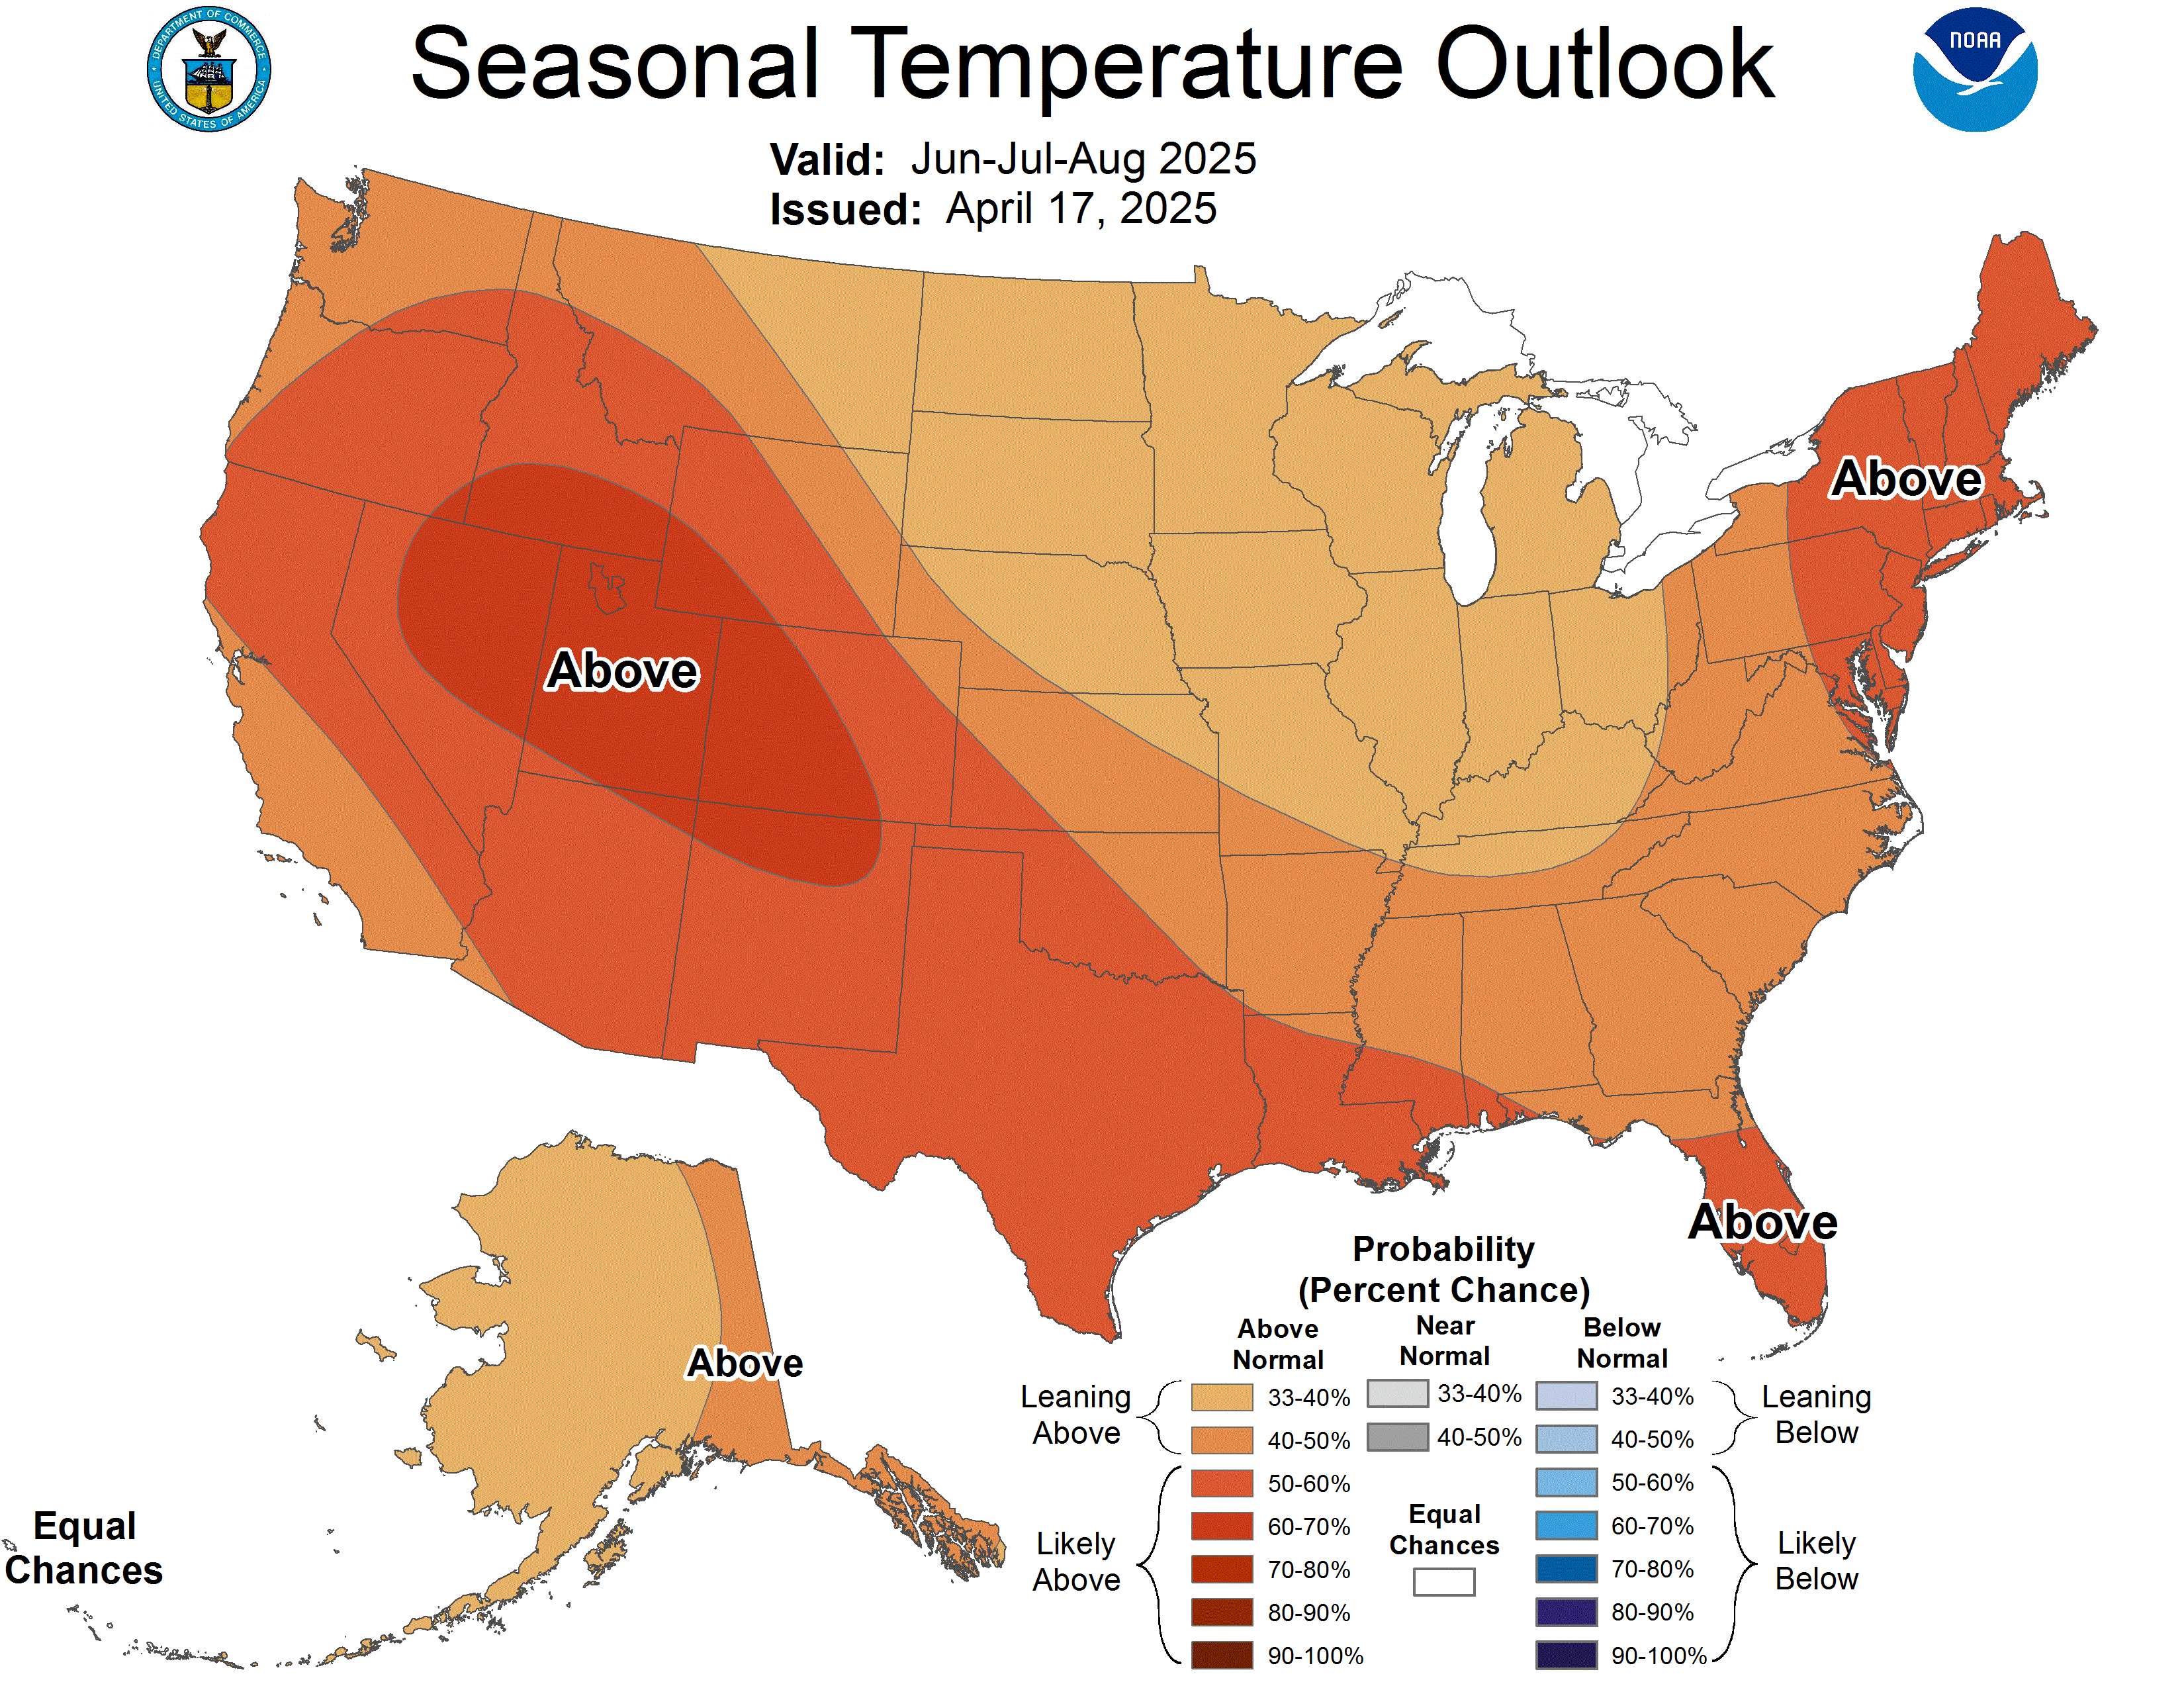
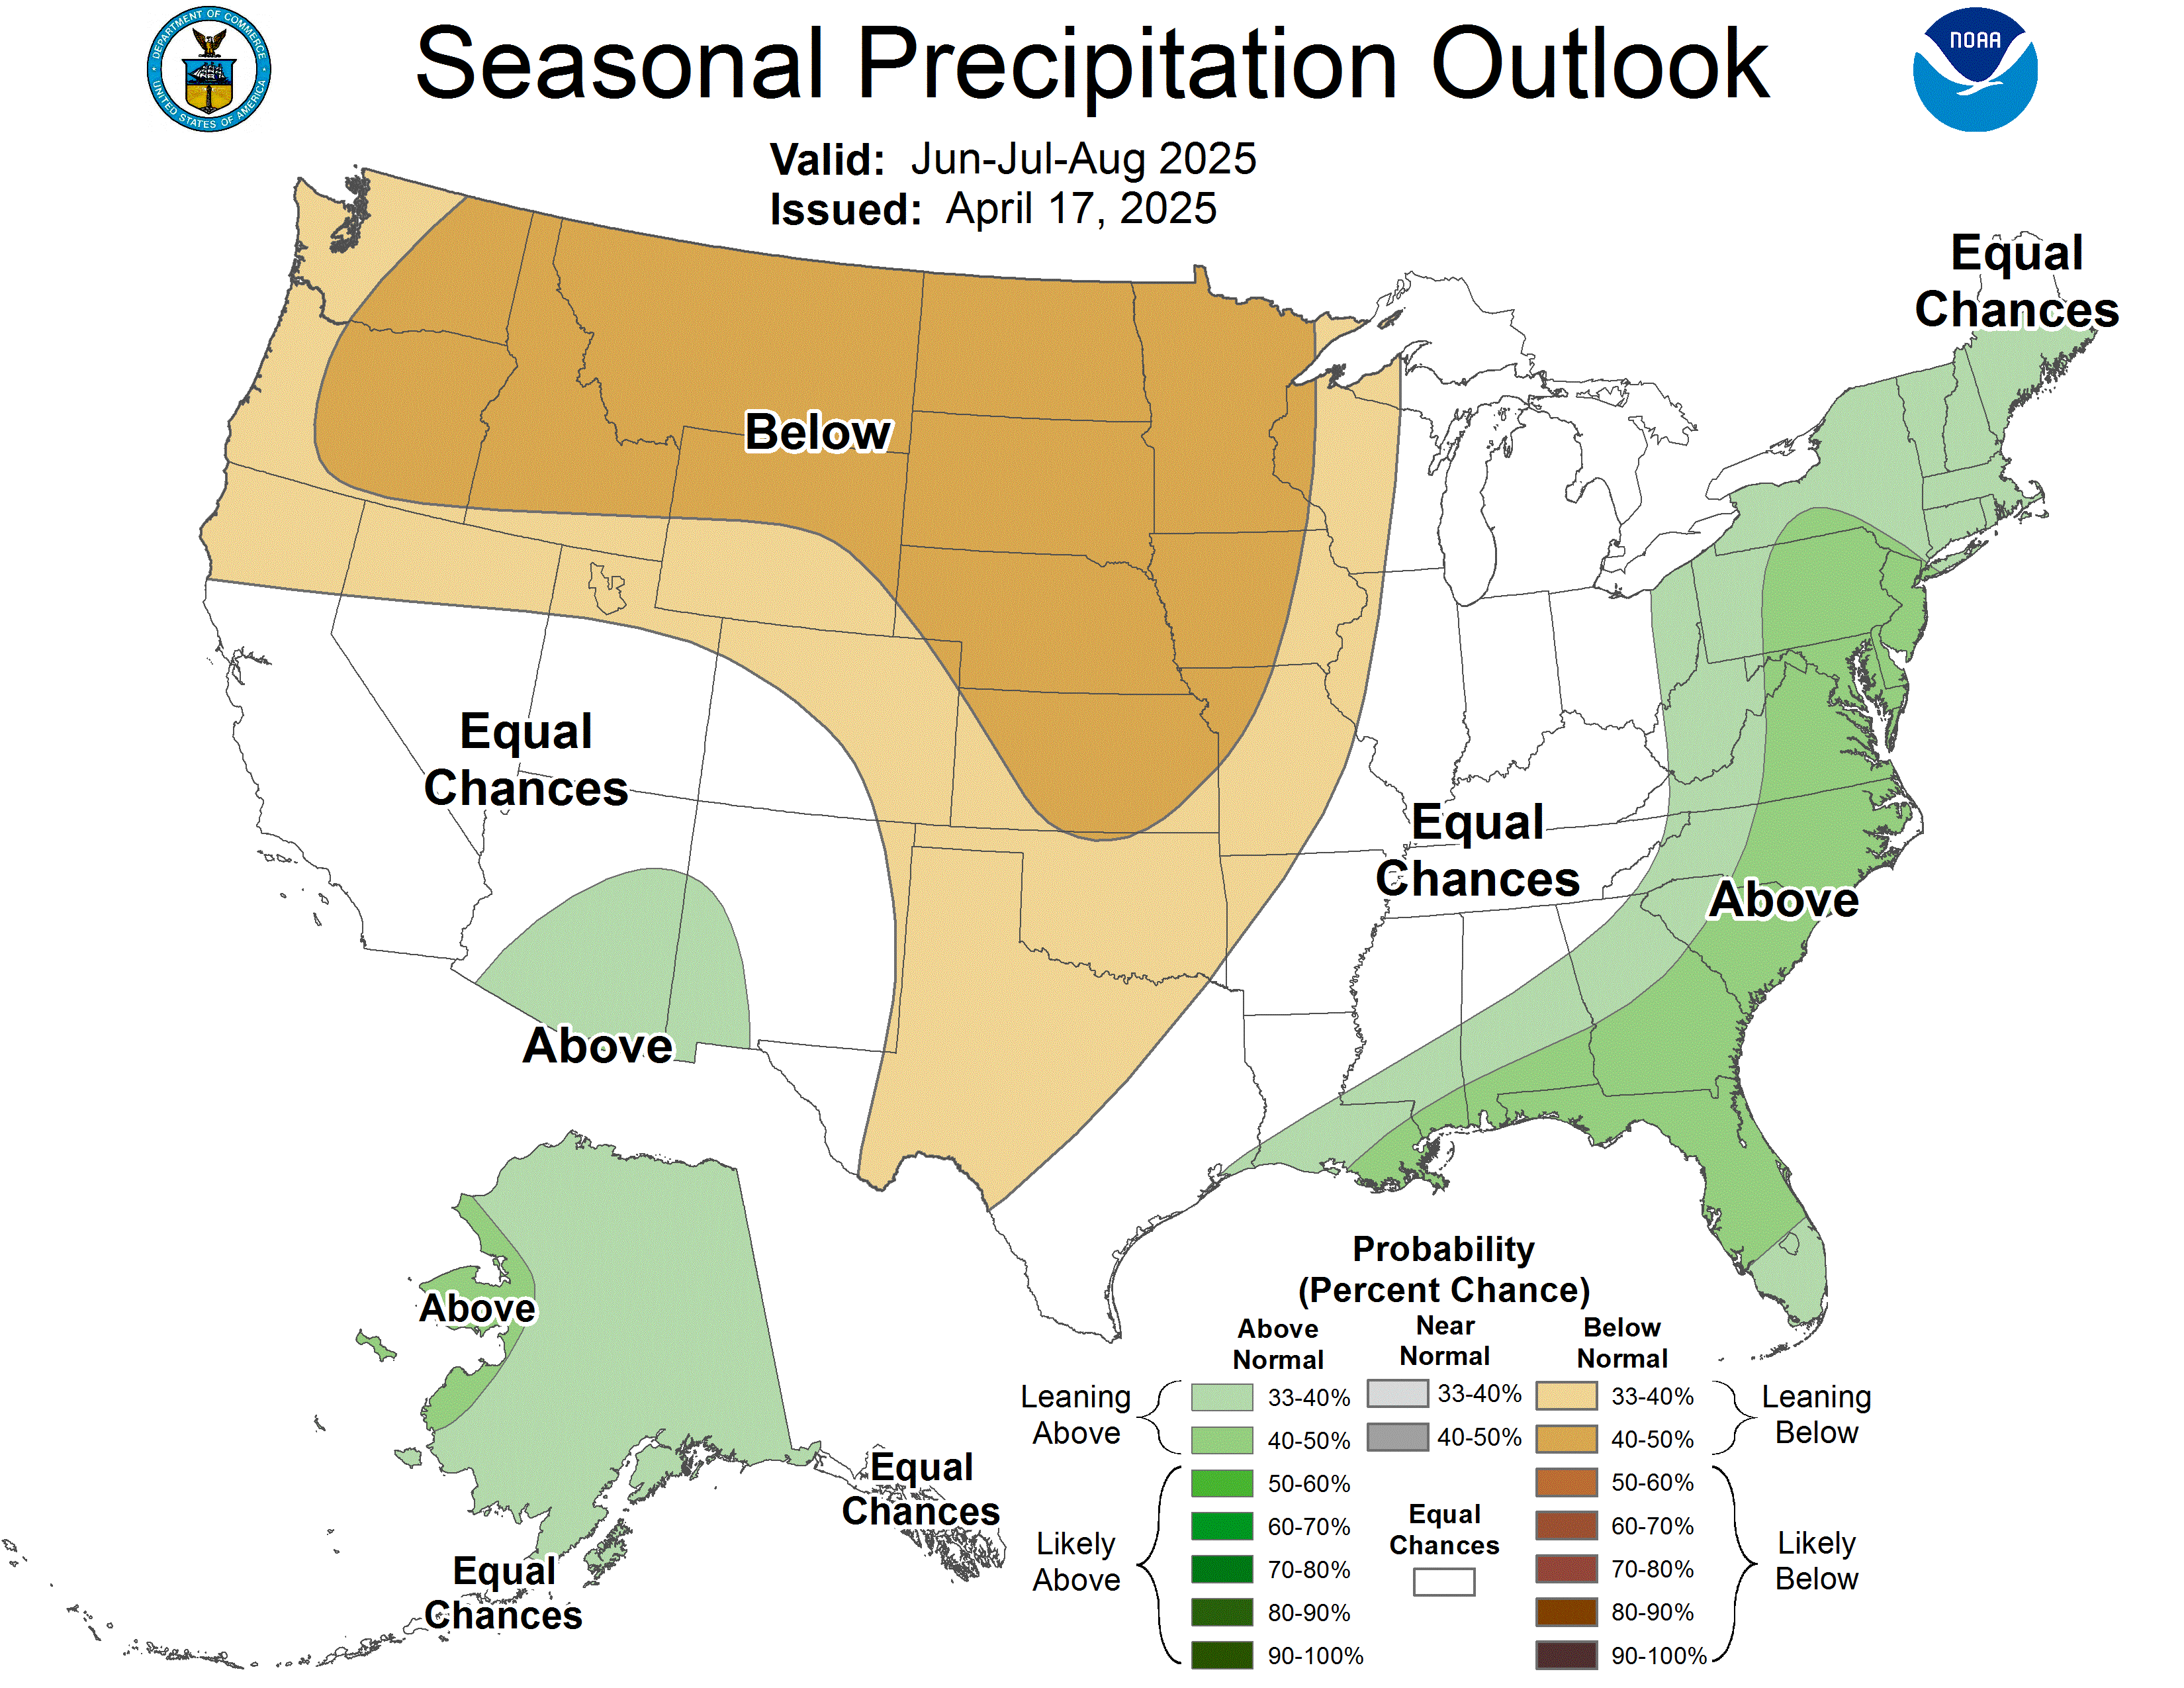
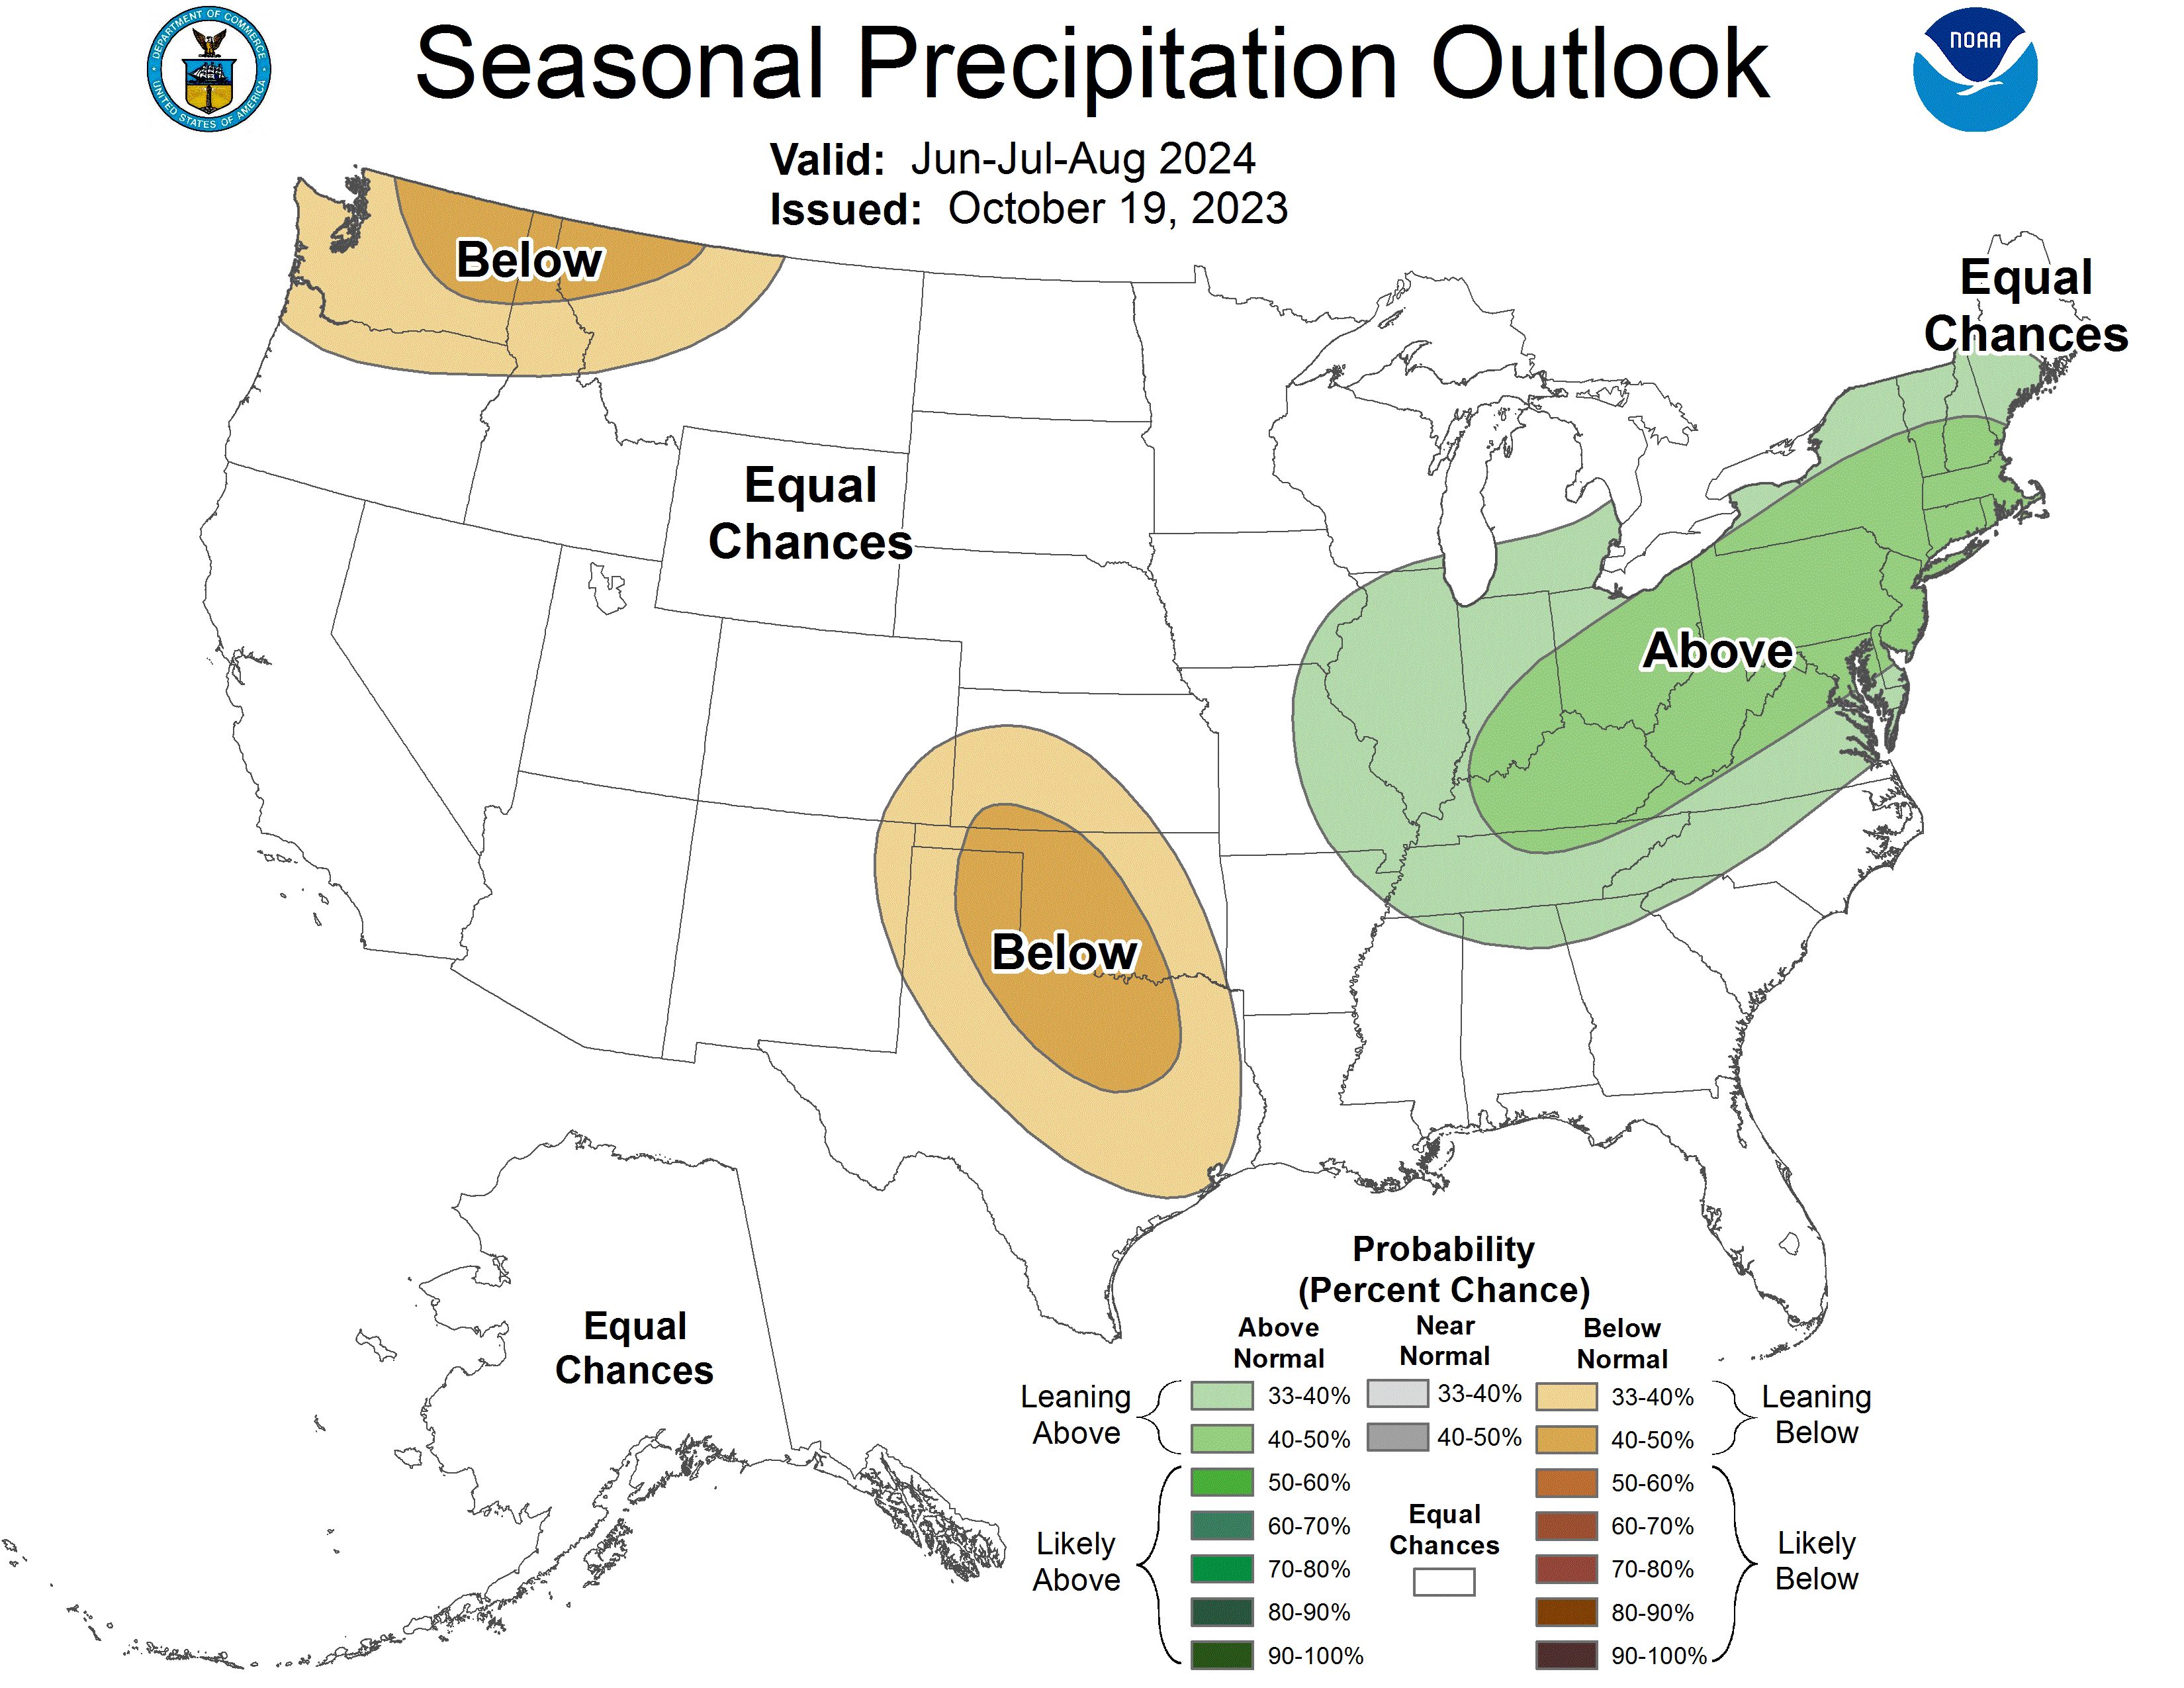
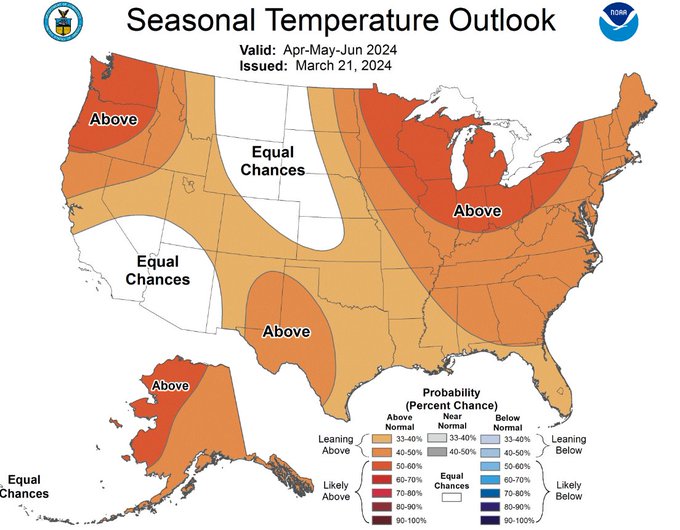
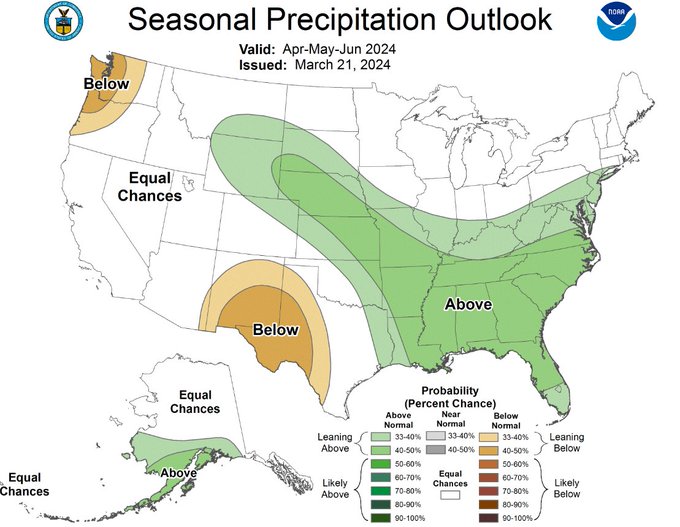
CPC predicts spring/early summer (April-June) in the U.S. Corn Belt is likely to be warmer than normal with normal to above-normal precipitation chances. This forecast covers planting through early development of the U.S. summer crops.
Tracking an early April snowstorm in the Northeast:
Historic -NAO intensity coming Mar 31 through early April
Started by WxFollower - March 29, 2024, 4:41 p.m.
Stormy weather April 1-5, 2024
14 responses |
Started by metmike - April 1, 2024, 6:34 p.m.
Total Solar Eclipse Day-April 8, 2024!!
16 responses |
Started by metmike - April 5, 2024, 3:38 p.m.
Severe wx week of 4-14-24
Started by metmike - April 13, 2024, 1:26 p.m.
Very heavy rains coming up in the SouthCentral US!
https://www.marketforum.com/forum/topic/83844/#83848
In places that have drought:
https://www.marketforum.com/forum/topic/83844/#83853
Grains
https://www.marketforum.com/forum/topic/103397/
Wheat
Bumping to the top. MarketForum now has lighting loading time speeds!
Re: Re: UAH March-global temperature
By metmike - April 14, 2024, 3:01 p.m.
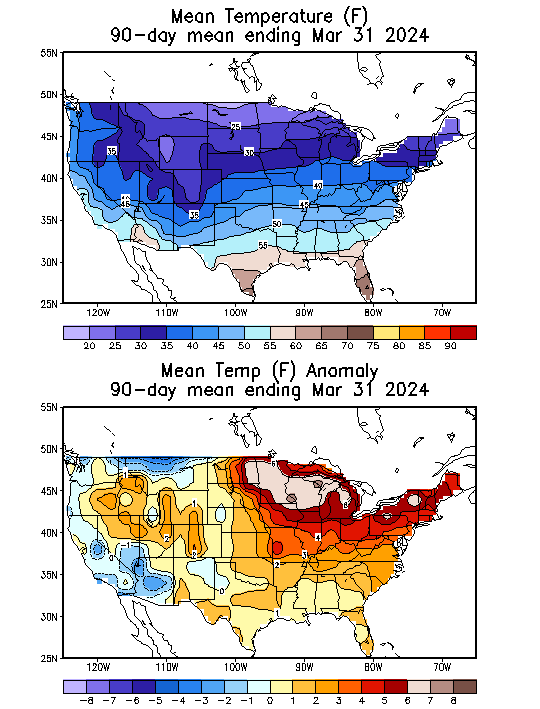
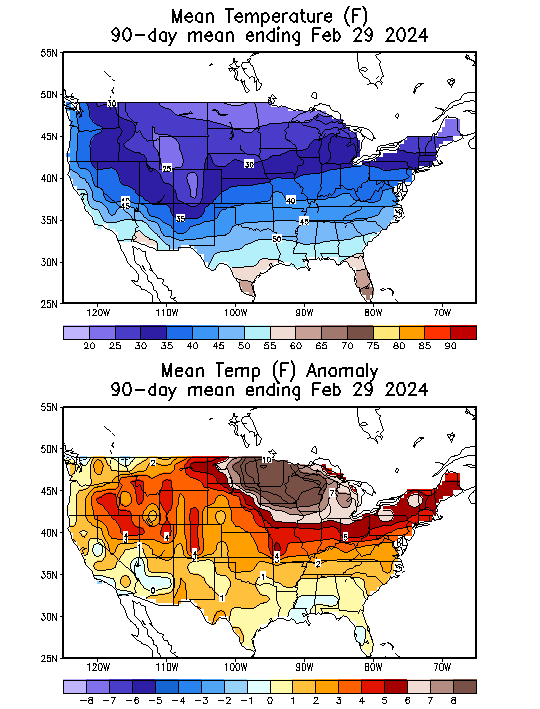
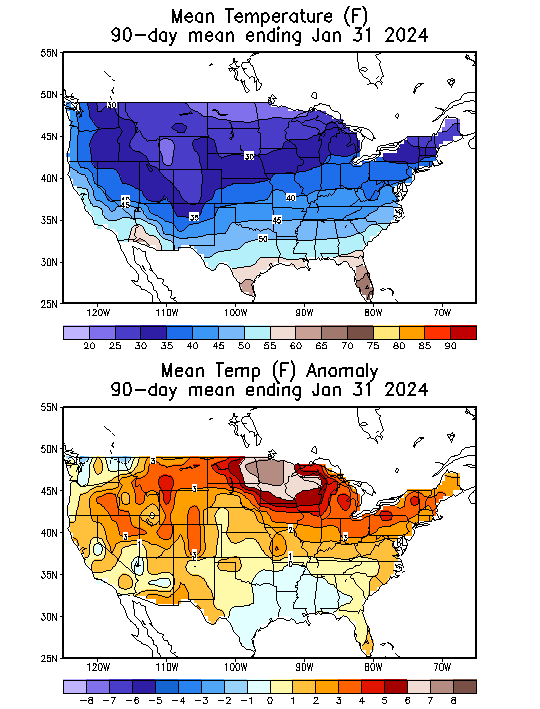
Temperatures this past Winter:
90 day periods-going backward
1. Jan-Feb-Mar
2. Dec-Jan-Feb
3. Nov-Dec-Jan
++++++++++
30 day periods-going forward
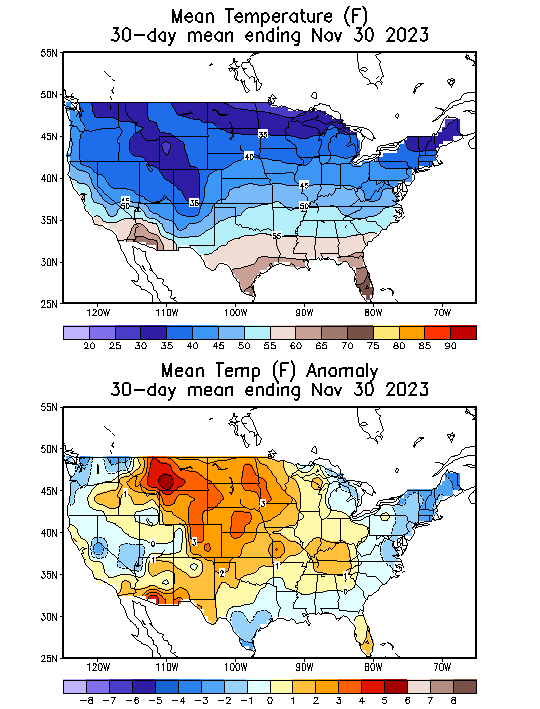
4. Nov 2023
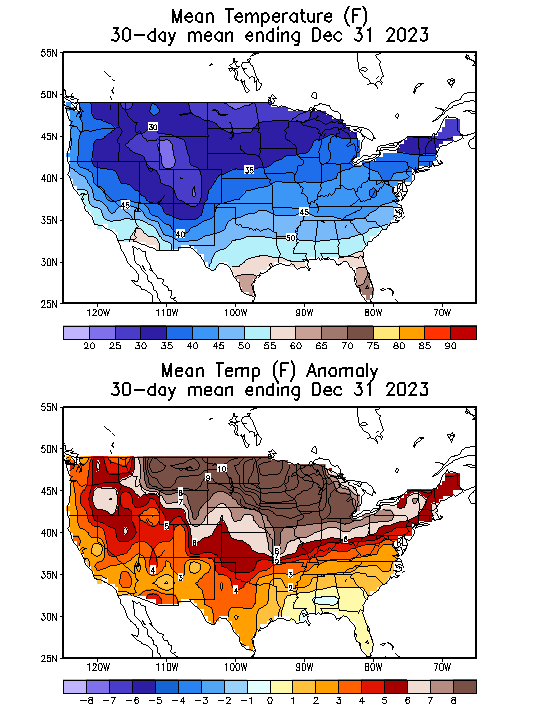
5. Dec 2023
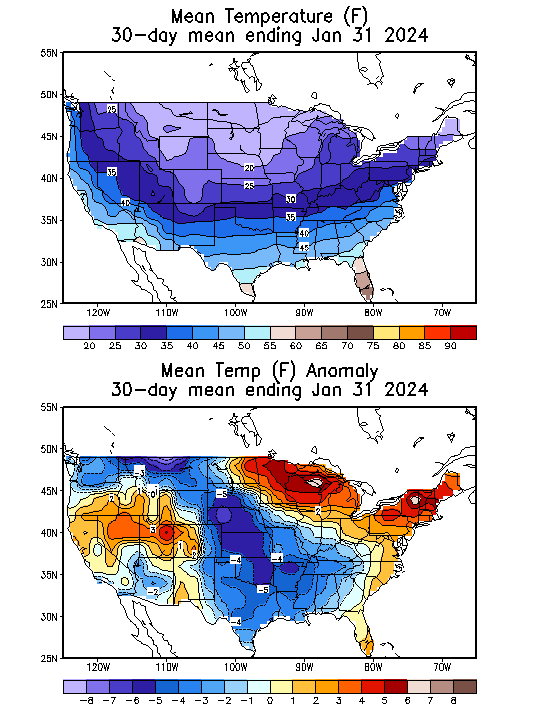
6. Jan 2024-only month to feature major cold
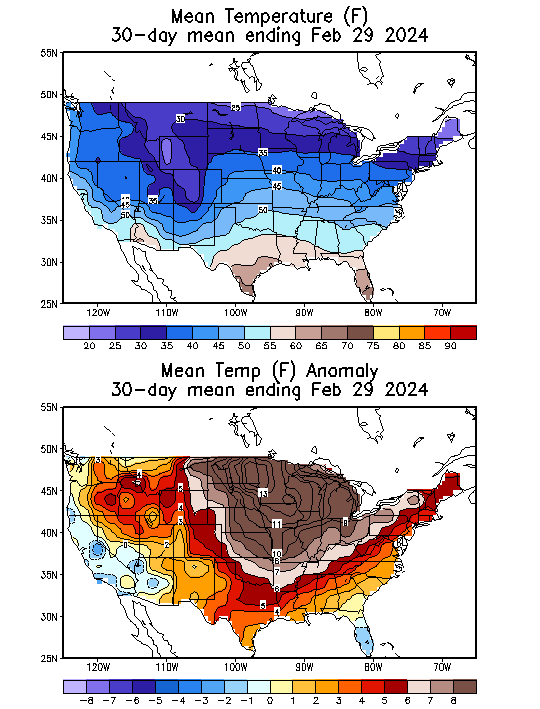
7. Feb 2024
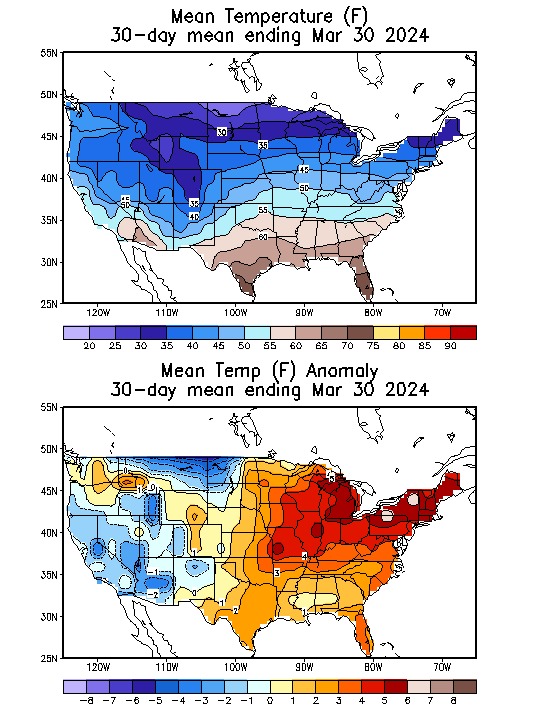
8. March 2024
https://www.cpc.ncep.noaa.gov/products/tanal/temp_analyses.php
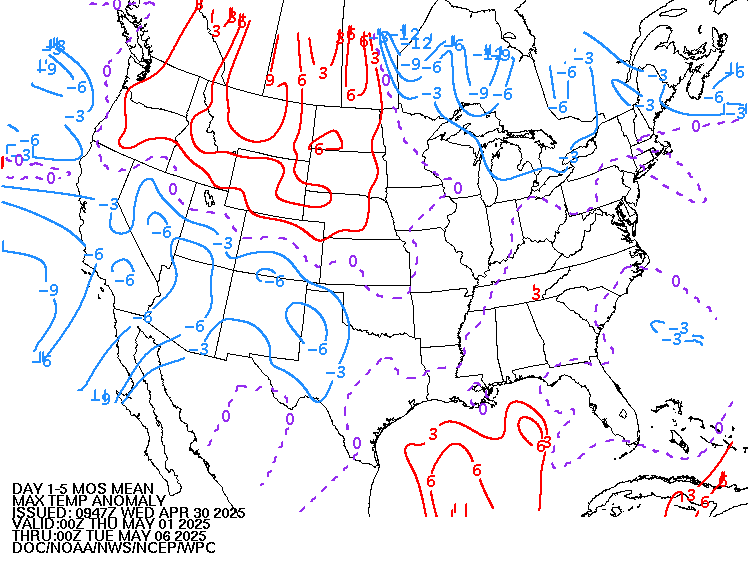
90 day periods
+++++++++++++++++++++++++++++++++++++++++++++++++++++++
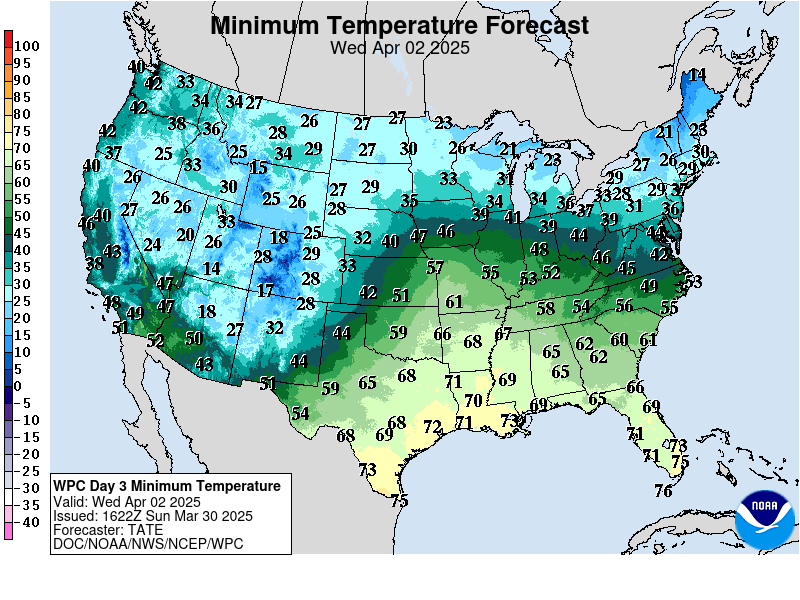
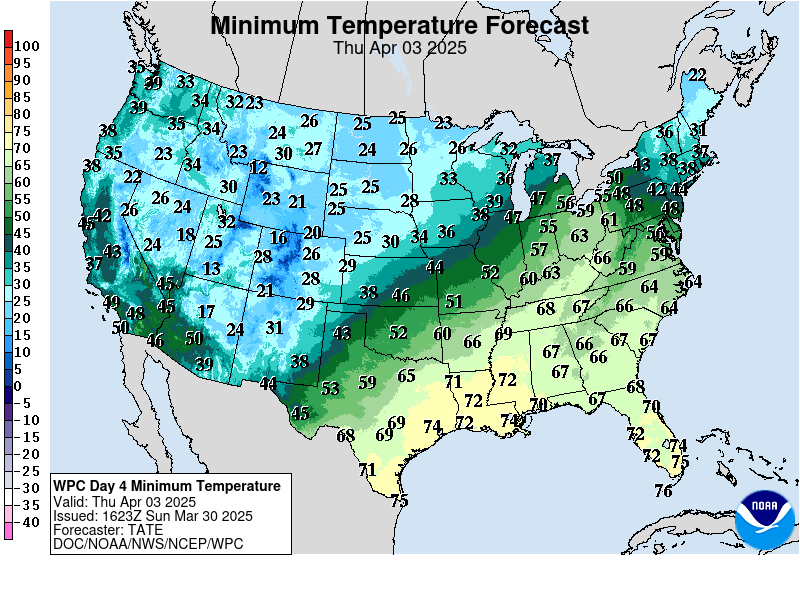
30 day periods
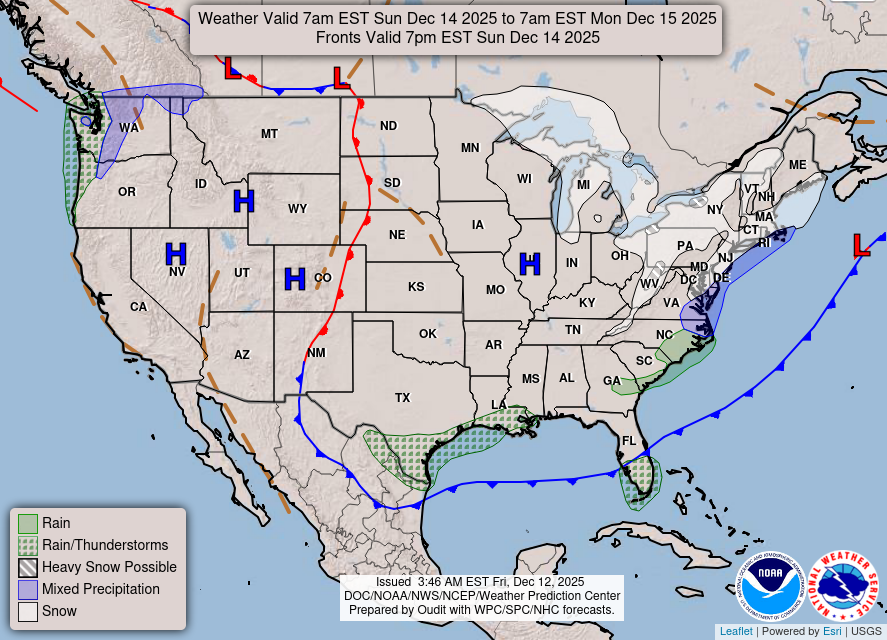
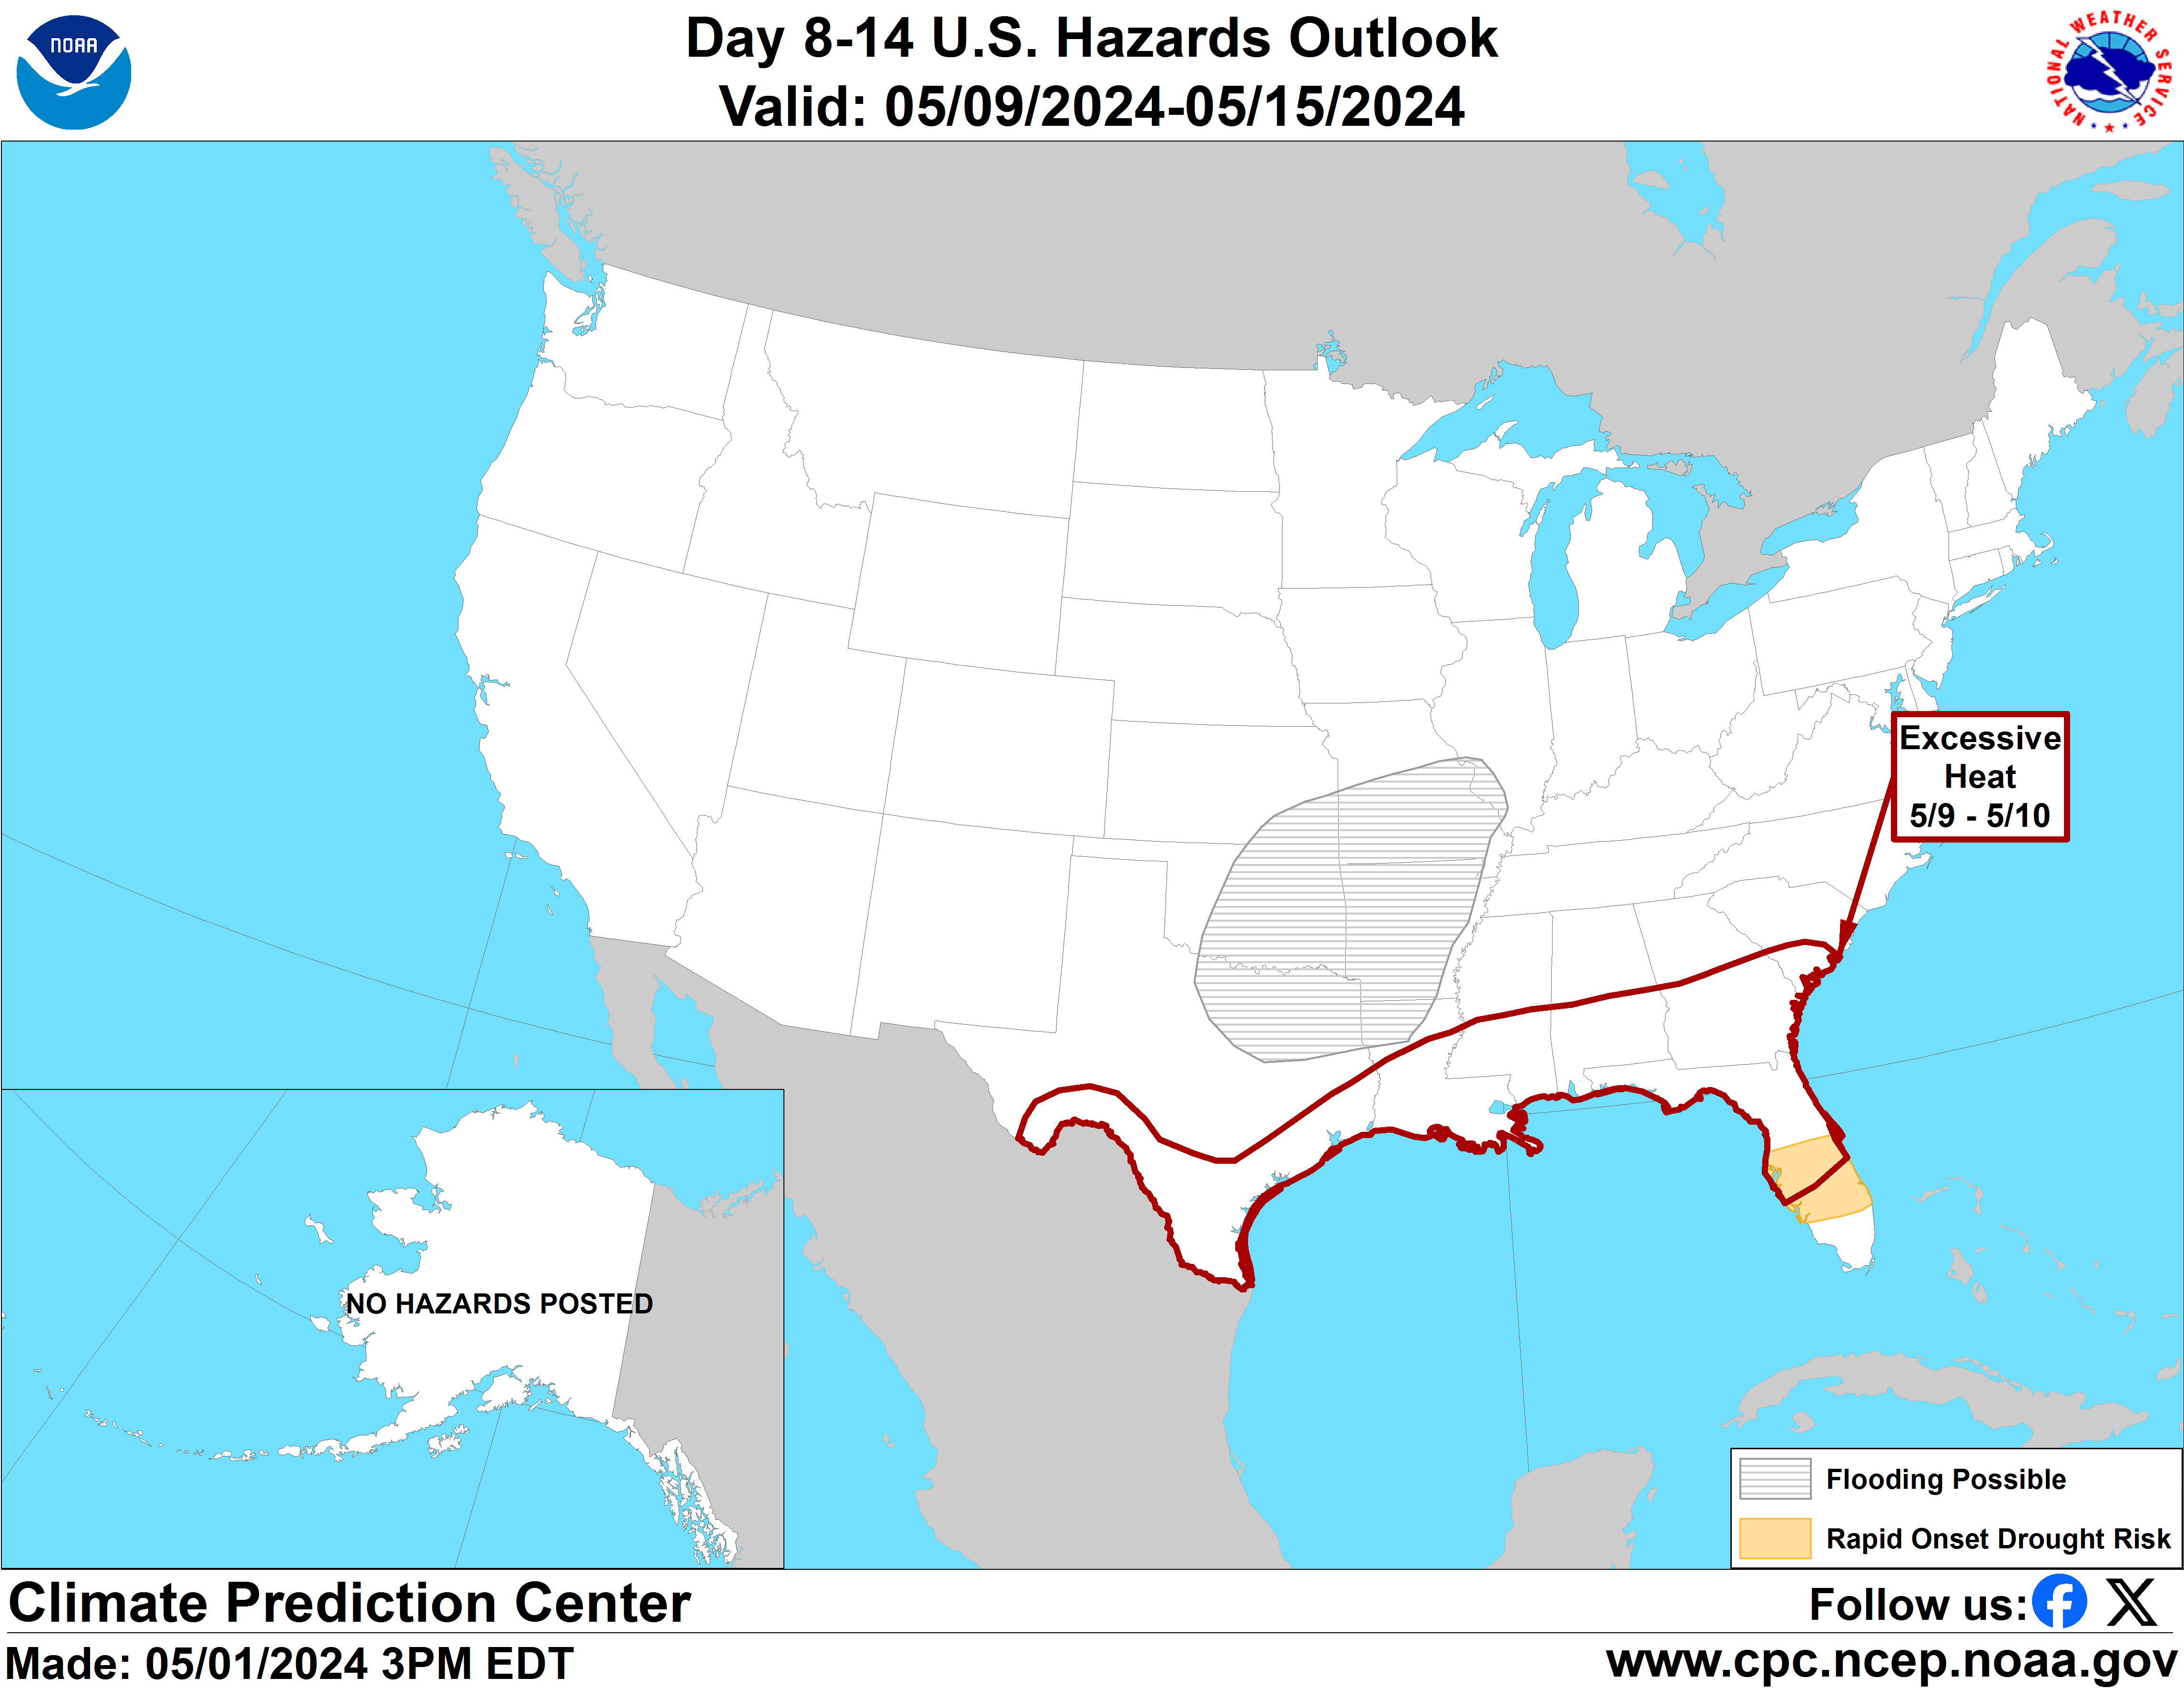
Wet in the Midwest but not excessive the next week.
VERY warm in the southeastern 1/3rd........but much cooler later in week 2(back to average).
Scroll down from the top to see the latest updates on every forecast weather map.


