Please scroll down for additional information/updates
ENSO: Recent Evolution,
Current Status and Predictions
Summary
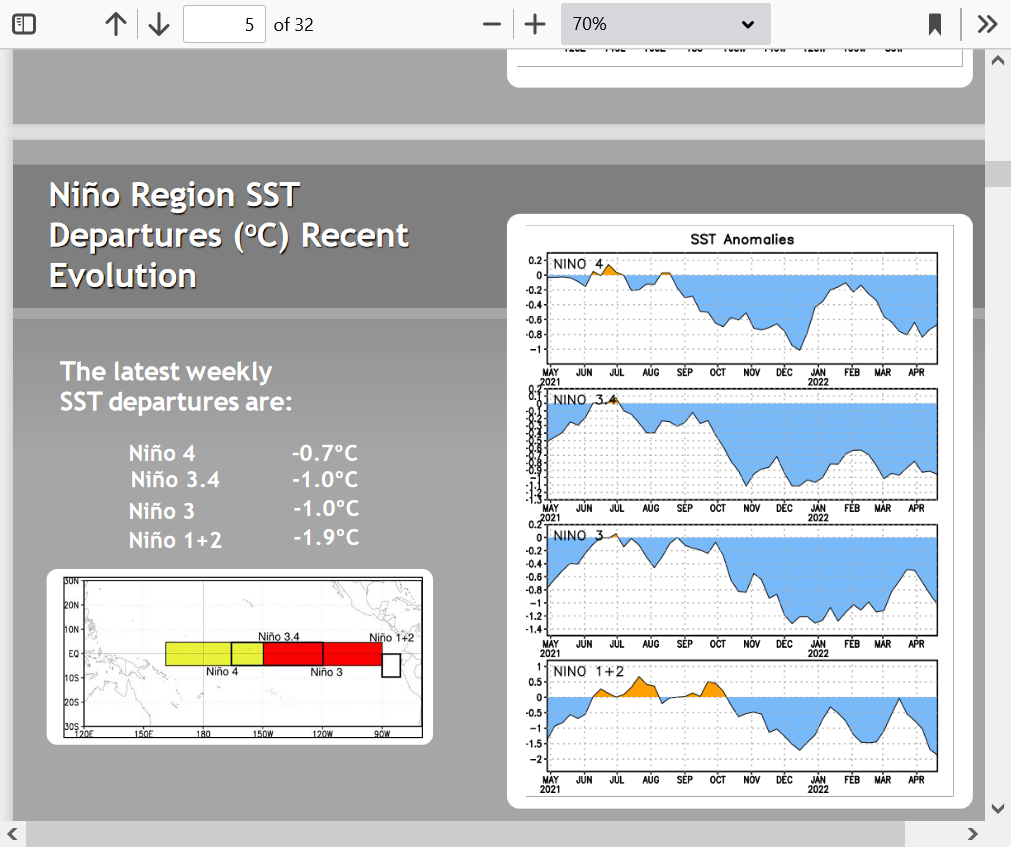
La Niña is present.*
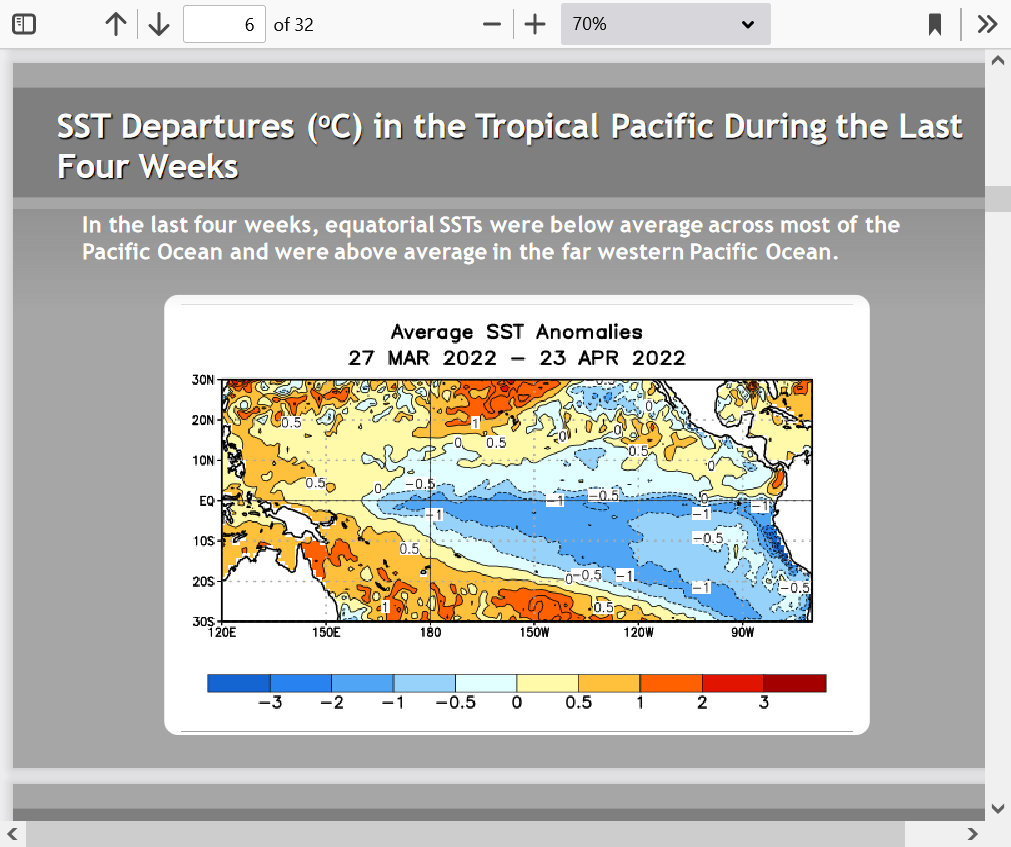
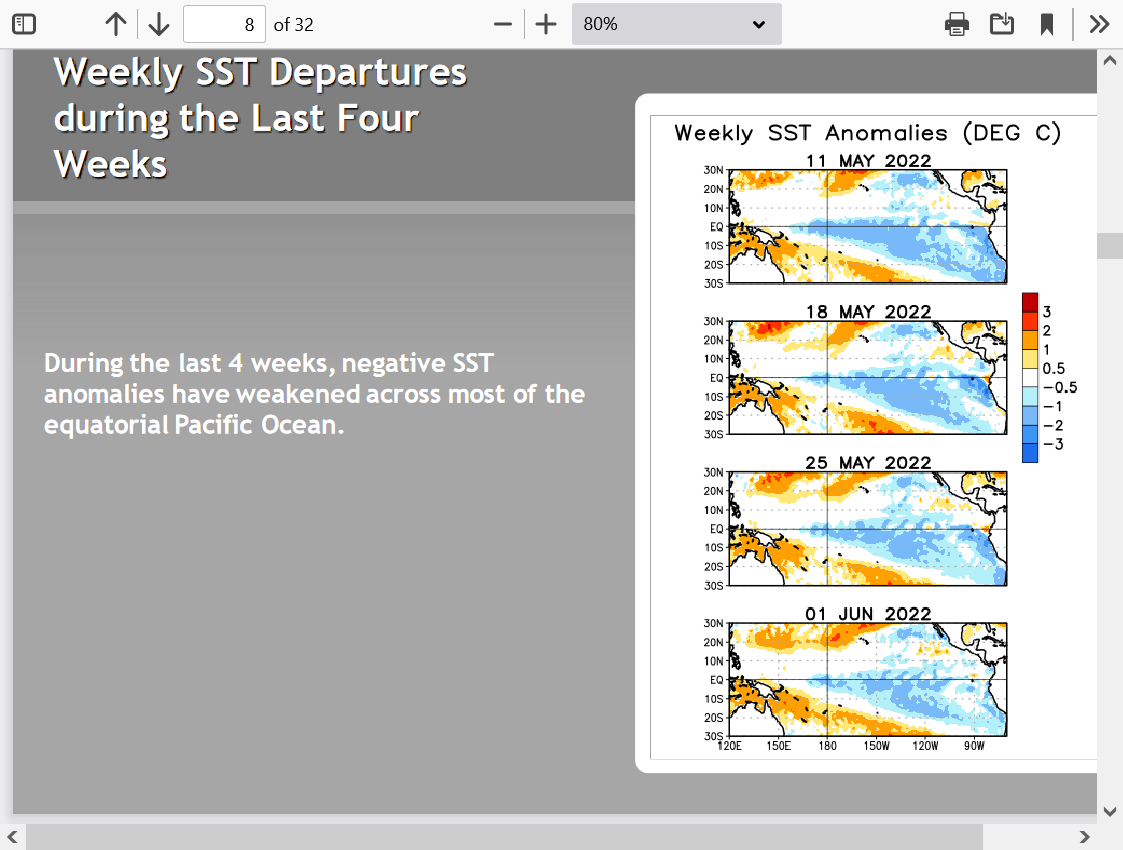
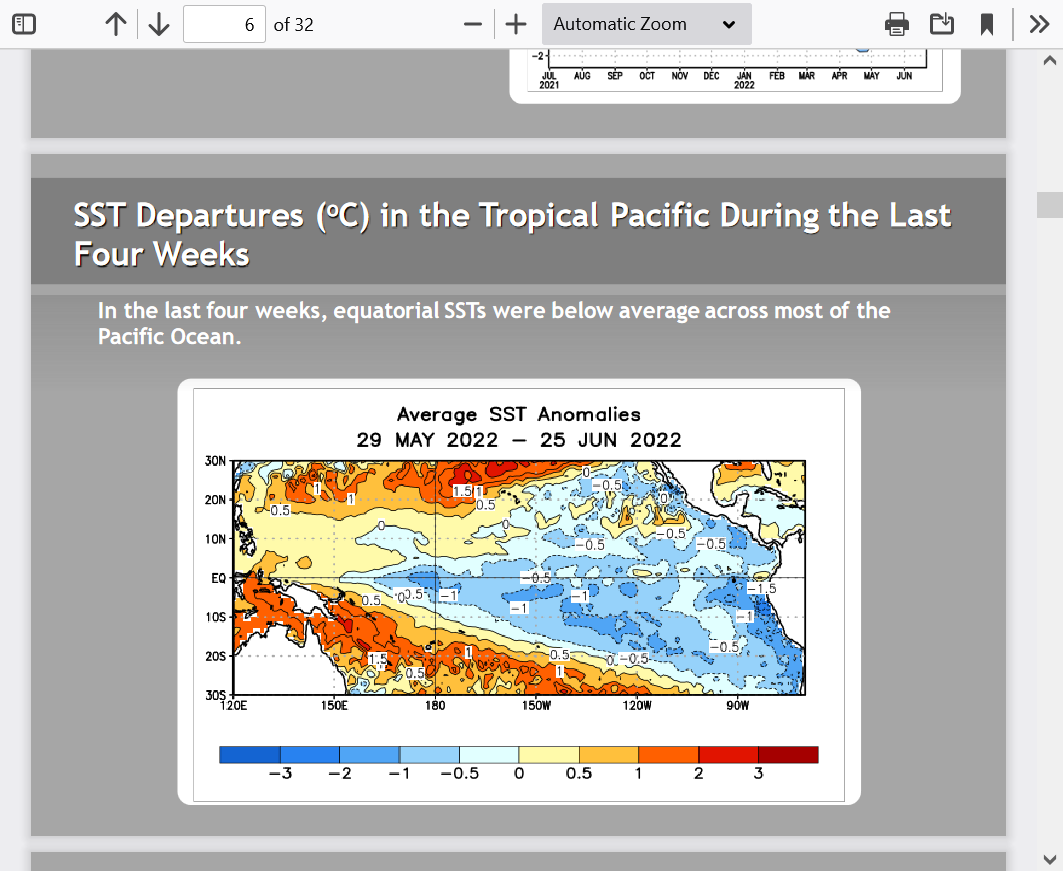
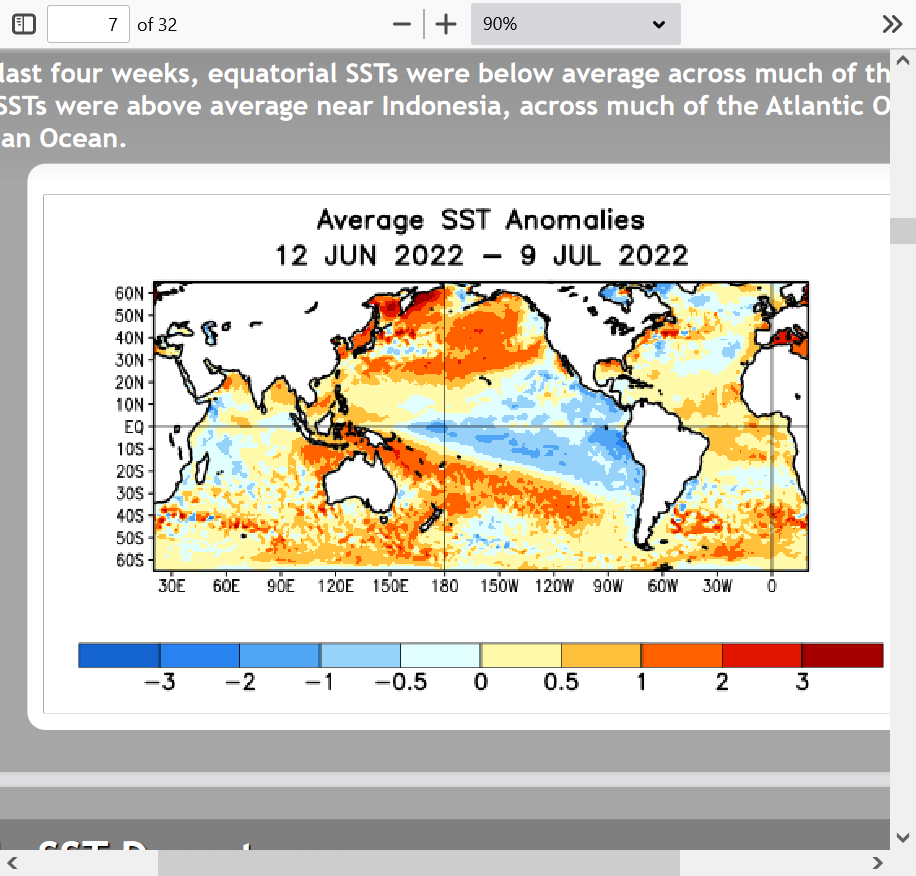
Equatorial sea surface temperatures (SSTs) are below average across most of
the Pacific Ocean.
The tropical Pacific atmosphere is consistent with La Niña.
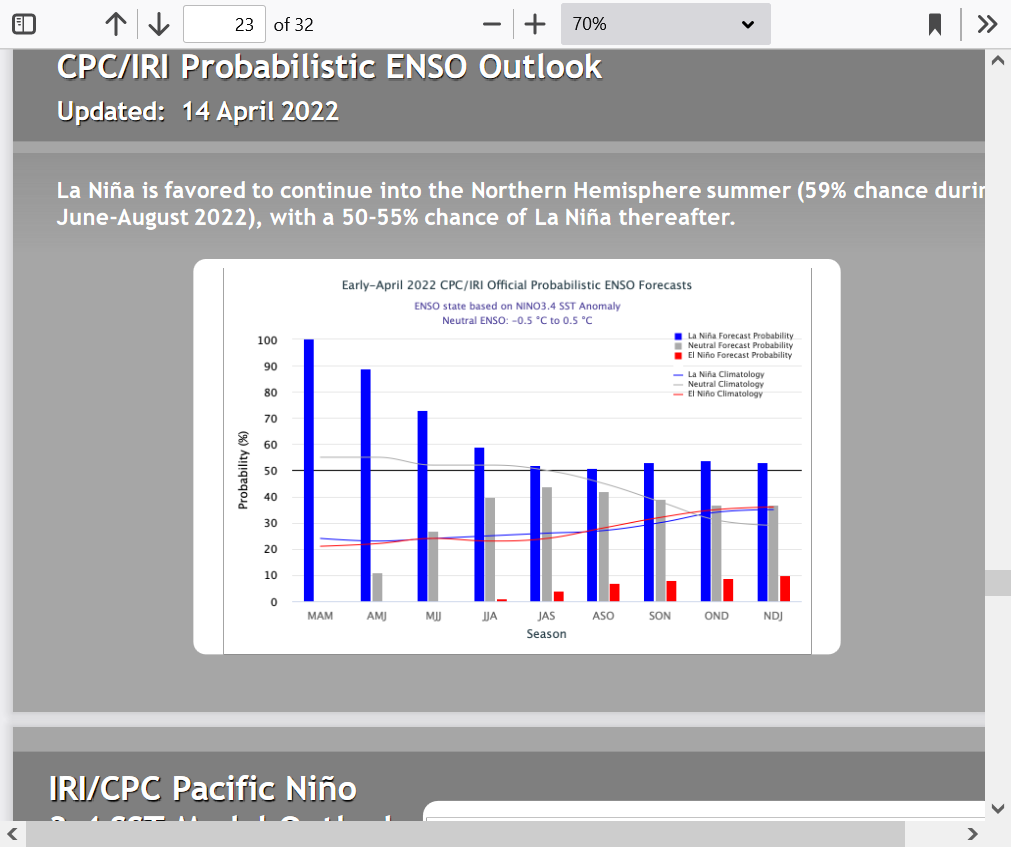
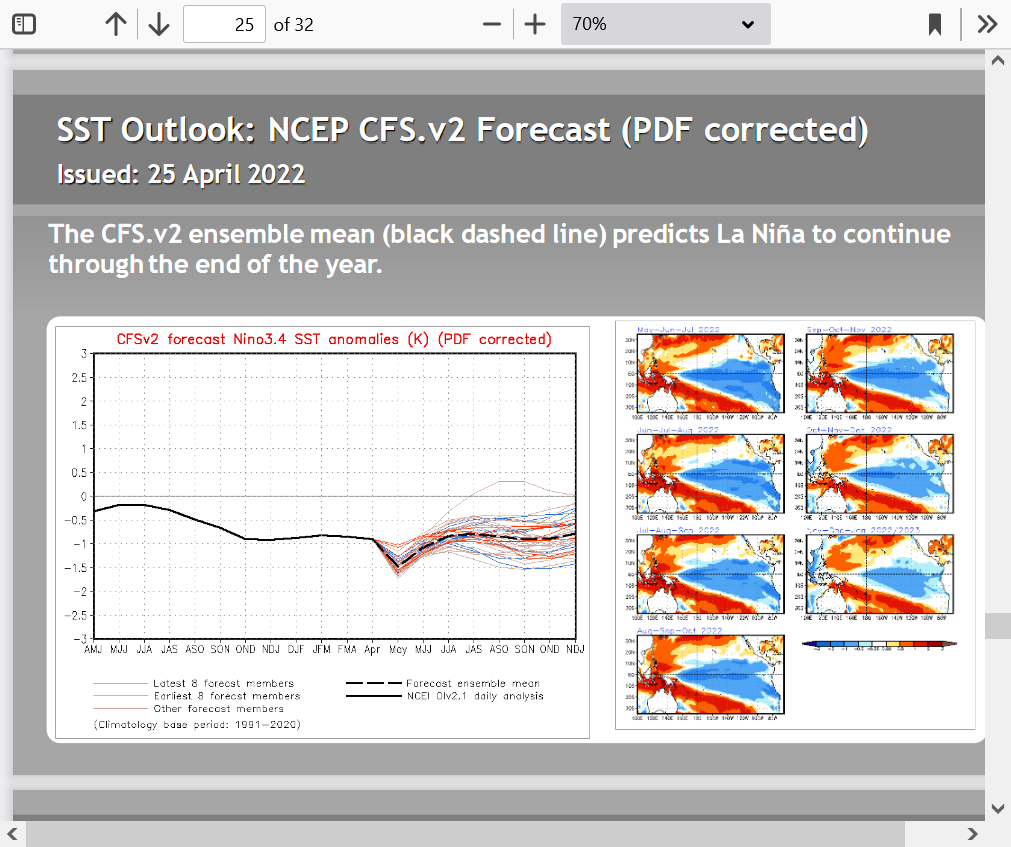
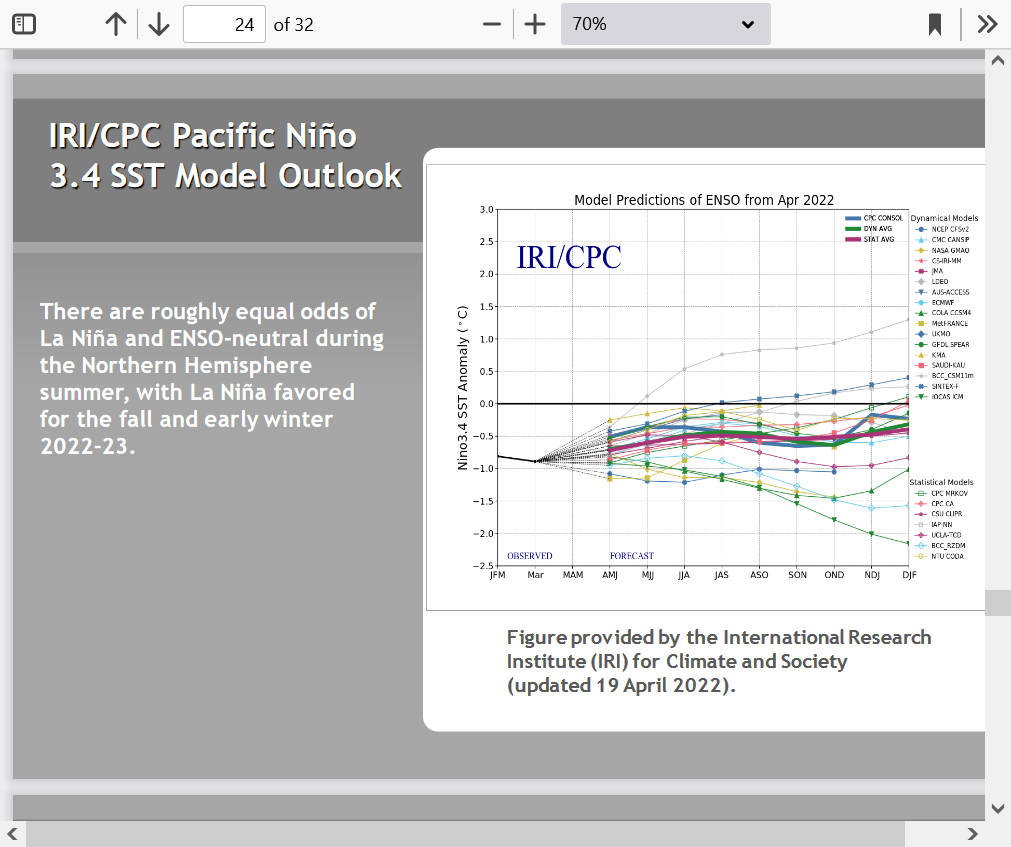
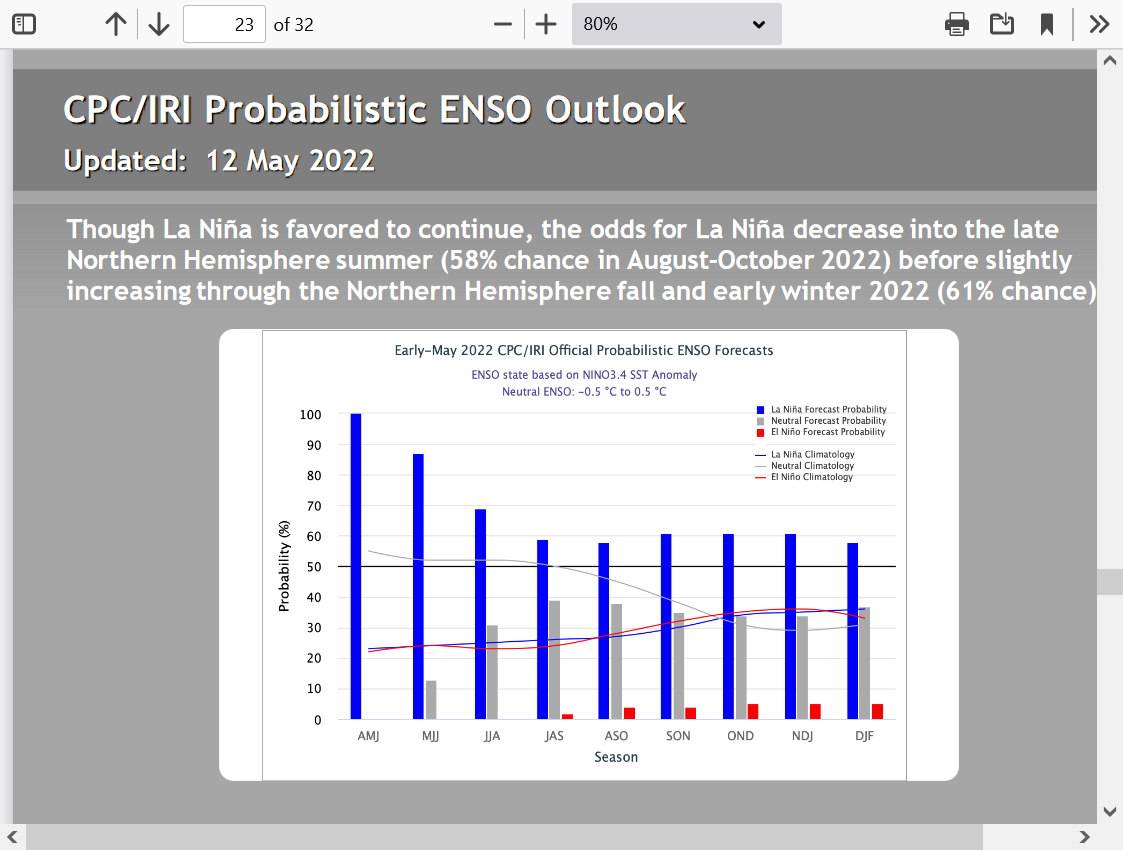
La Niña is favored to continue through the Northern Hemisphere summer (59%
chance during June-August 2022), with a 50-55% chance through the fall.*
metmike: Global warming CAN'T cause below average sea surface temperatures in the Pacific Ocean(the world's biggest ocean by far)!
This long lived La Nina is what caused the long lived drought in the West to the Plains the last 2 years........absolute meteorology based on the physical laws in the oceanic, atmospheric relationship.
A resumption of global warming would help to end the drought! This will likely happen the next time we have an El Nino. However, La Nina's and El Nino's are completely natural.
People are completely fixated on the dishonest, DISinformation from the MSM and biased scientists controlling the false narratives to attach the cause of every unusual weather event as being climate change. Even things that have happened many times before and for thousands of years.
We're still having the same weather/climate systems as before. All we did, in reality was just superimpose 1 deg. C of mostly beneficial warming on the system(much of it in the coldest places) during the last 100 years on this massively greening planet.
Let's try to focus on authentic meteorology now and apply it to the upcoming Summer's weather forecast.
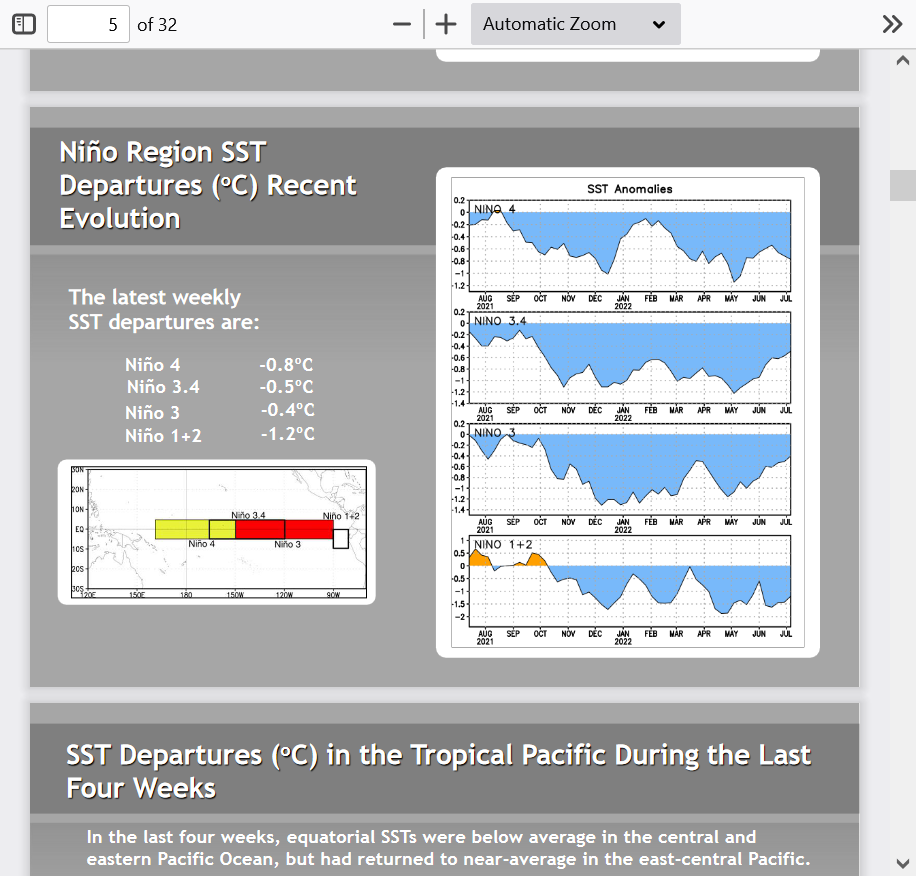
SST's have been solidly cold since late last year in all the regions below.
This is what the cold anomalies/La Nina looks like close up.
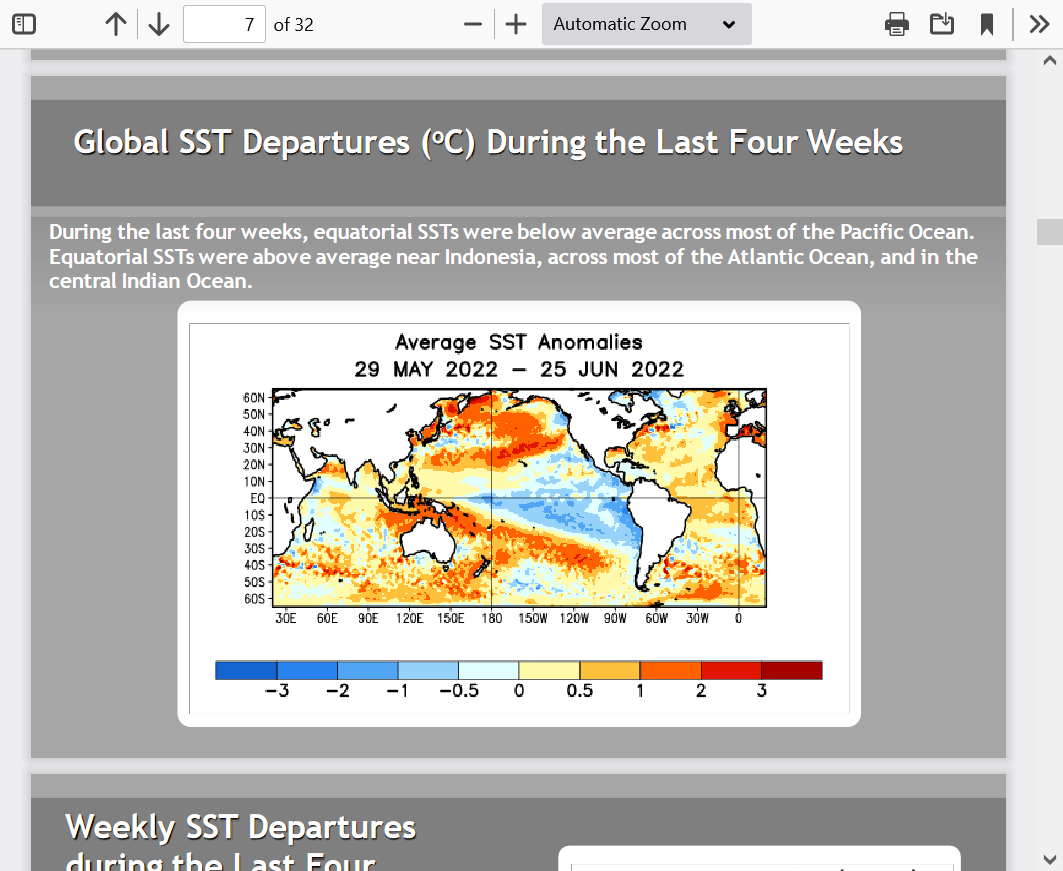
This is what the La Nina looks like on a global scale.
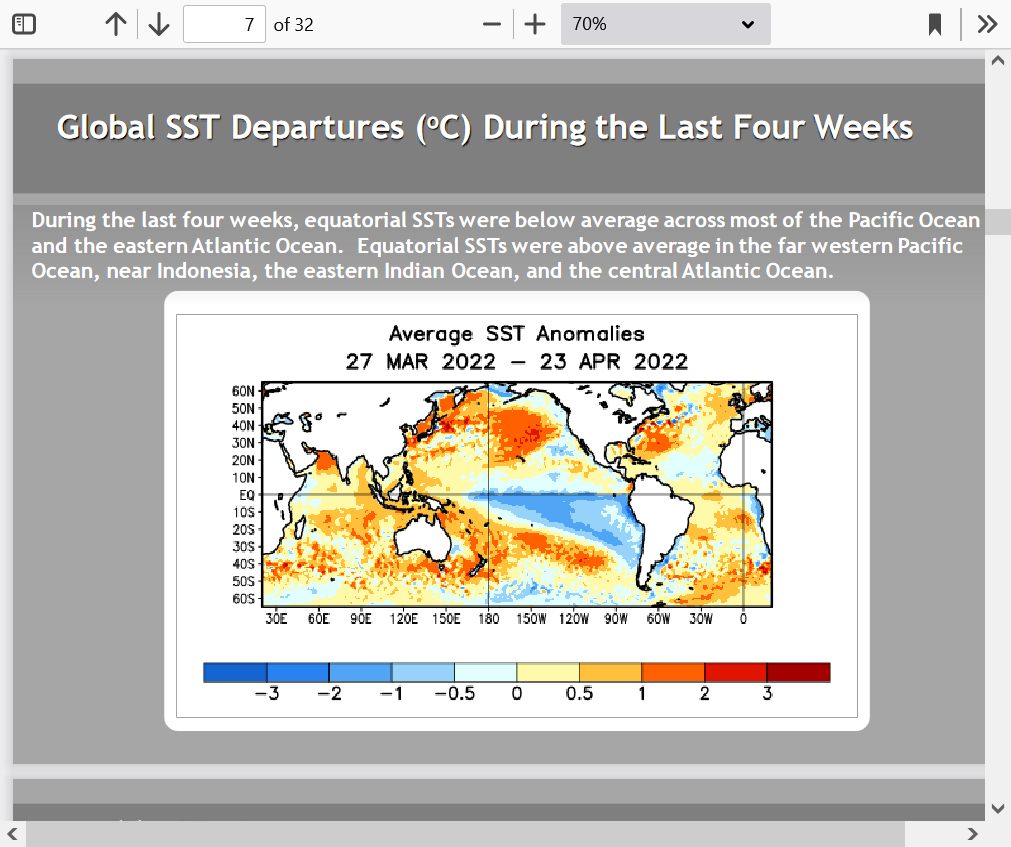
This current temperature profile in the Pacific is also the signature of a strong --PDO!!!
https://www.marketforum.com/forum/topic/82479/#82658
The typical -PDO phase illustration below is very close to what we've had in the recent, long lived La Nina.
Sea Surface Temperature Anomalies During a Cold PDO Phase
https://legacy.climate.ncsu.edu/climate/patterns/pdo
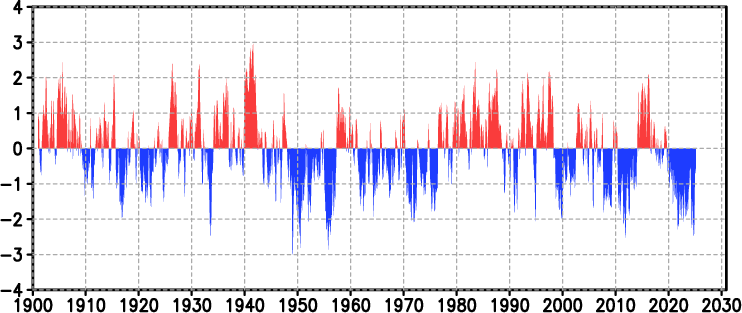
Latest PDO, at the far right of the graph below is pretty negative/blue.........in tandem with the current La Nina.
During the previous long lived -PDO in the 50s-60s-70's, we had modest global cooling. I'm NOT predicting global cooling now. Increasing CO2 does warm the earth slightly based on the physics of CO2. We will Just continue to see a SLOW DOWN in the warming rate because a -PDO and more La Nina's are natural ANTI global warming patterns that can last for decades and as seen below, actually caused modest global cooling for 3 decades.
We hit a +PDO regime in the 1980s-90's, which temporarily accelerated/enhanced the warming from this natural cause and led to equations in climate models that greatly exaggerate the REAL warming from CO2.
The busted climate models, instead of getting adjusted lower to the slow down of the real observed/measured warming after the acceleration in temps stopped.....became a wonderful political tool and the adjustments went in the exact WRONG direction to create extreme/ planet destroying, scientifically fraudulent and almost impossible outcomes to scare the crap out of people for self serving and political objectives.
Sorry to include the politics but thats what defines current climate science today.
Again, global warming accelerated in the 1980's/90's because of the +PDO(seen in red). The PDO is an entirely natural, 60 year oceanic index based on the temperature profile in the Pacific Ocean. PDO=Pacific Decadal Oscillation.
https://www.daculaweather.com/4_pdo_index.php
PDO values
Back to the current Pacific Ocean........and where are we headed?
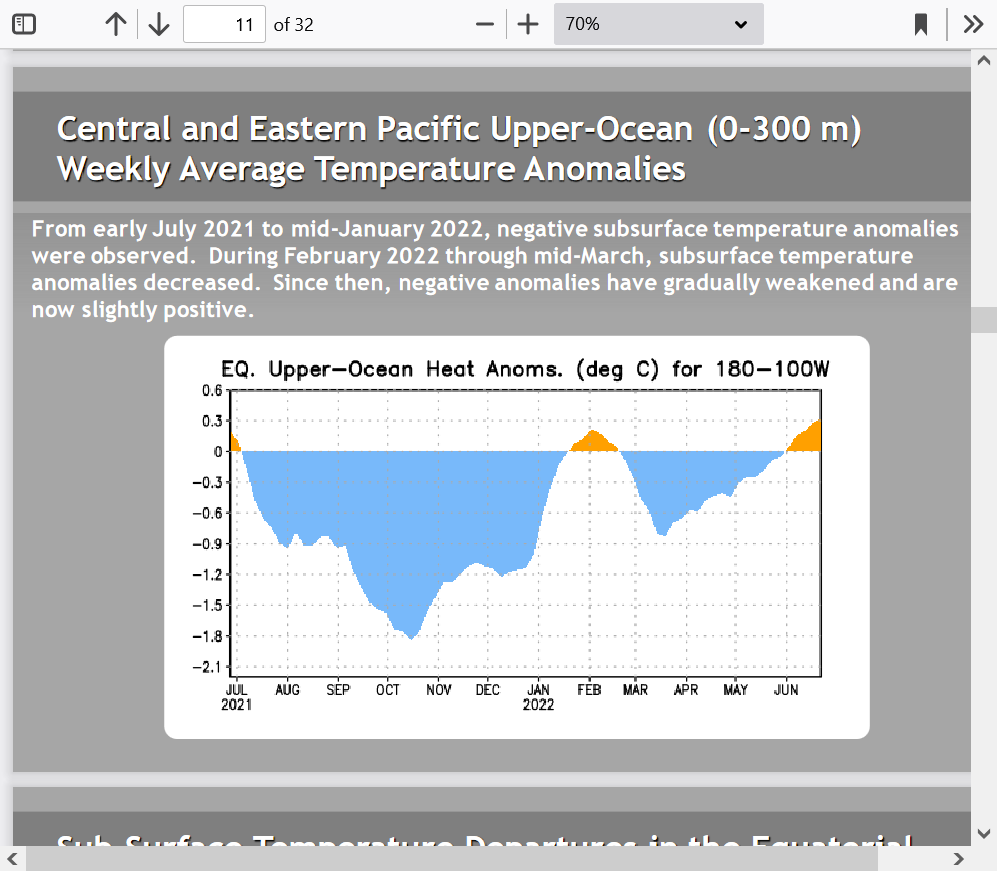
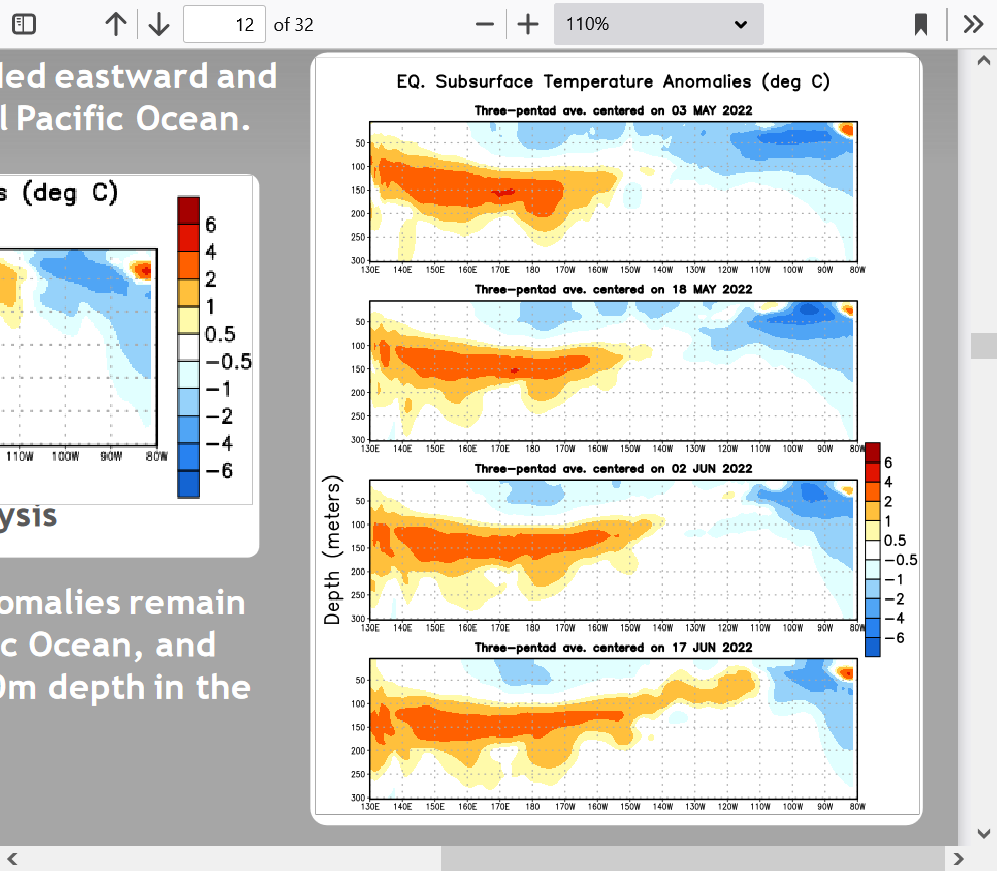
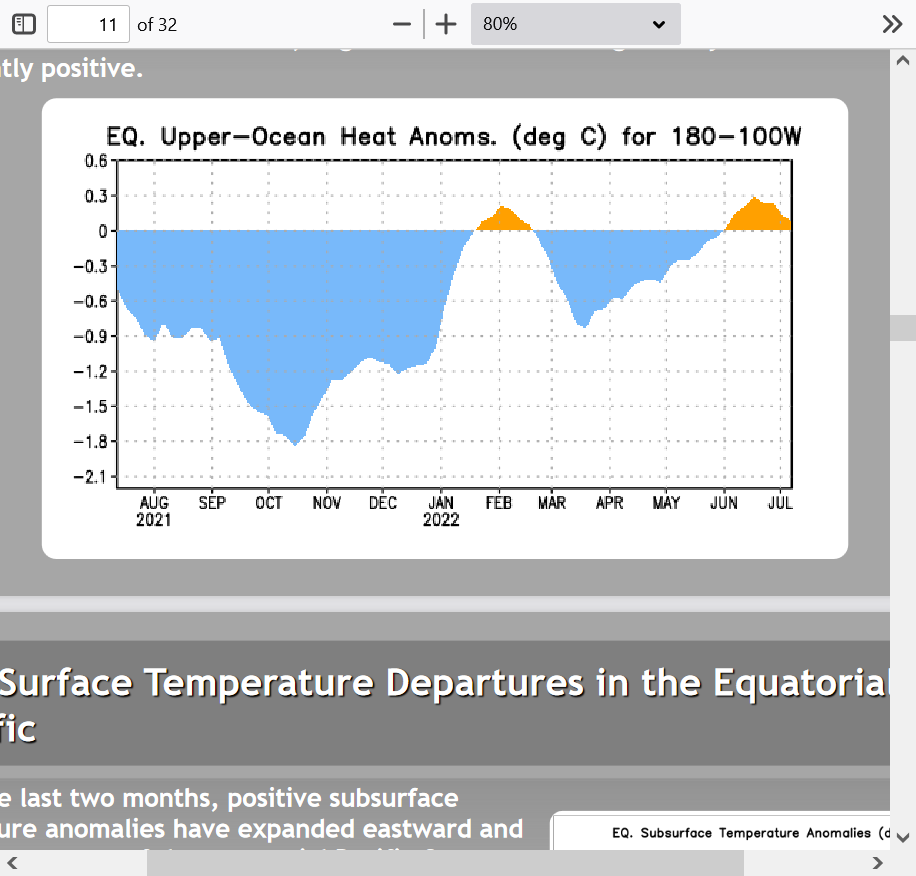
The upper ocean heat anomaly is shrinking Compared to late last year.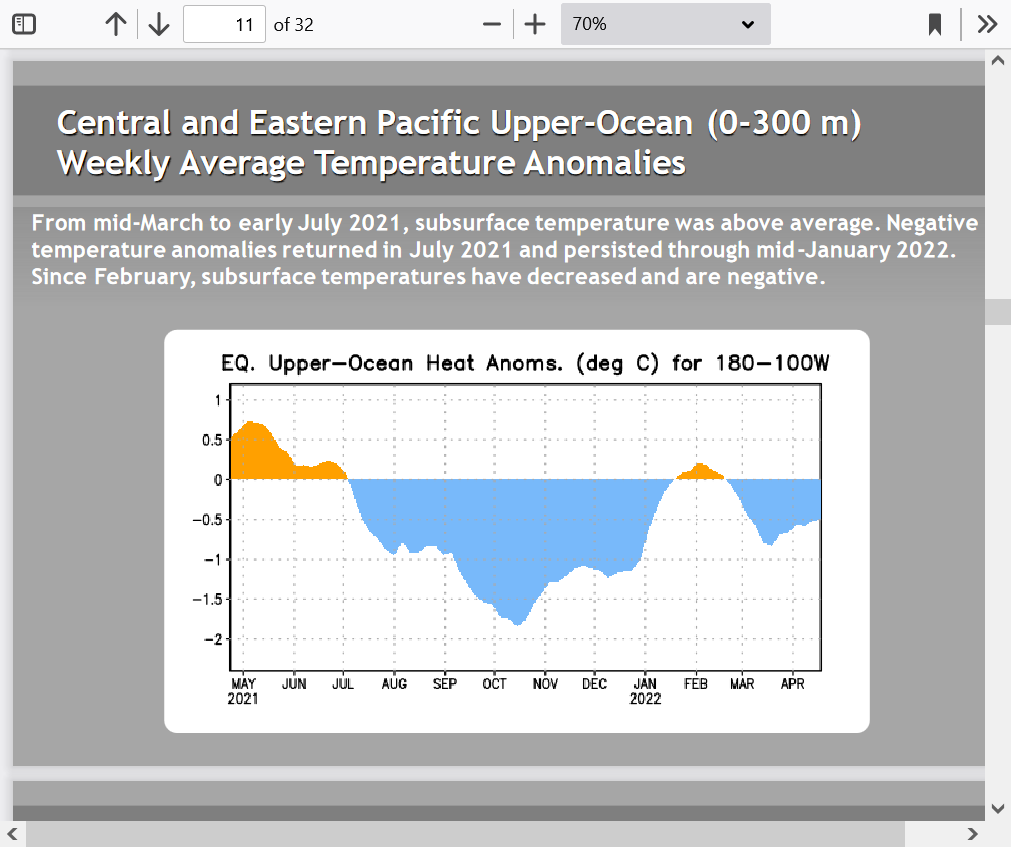
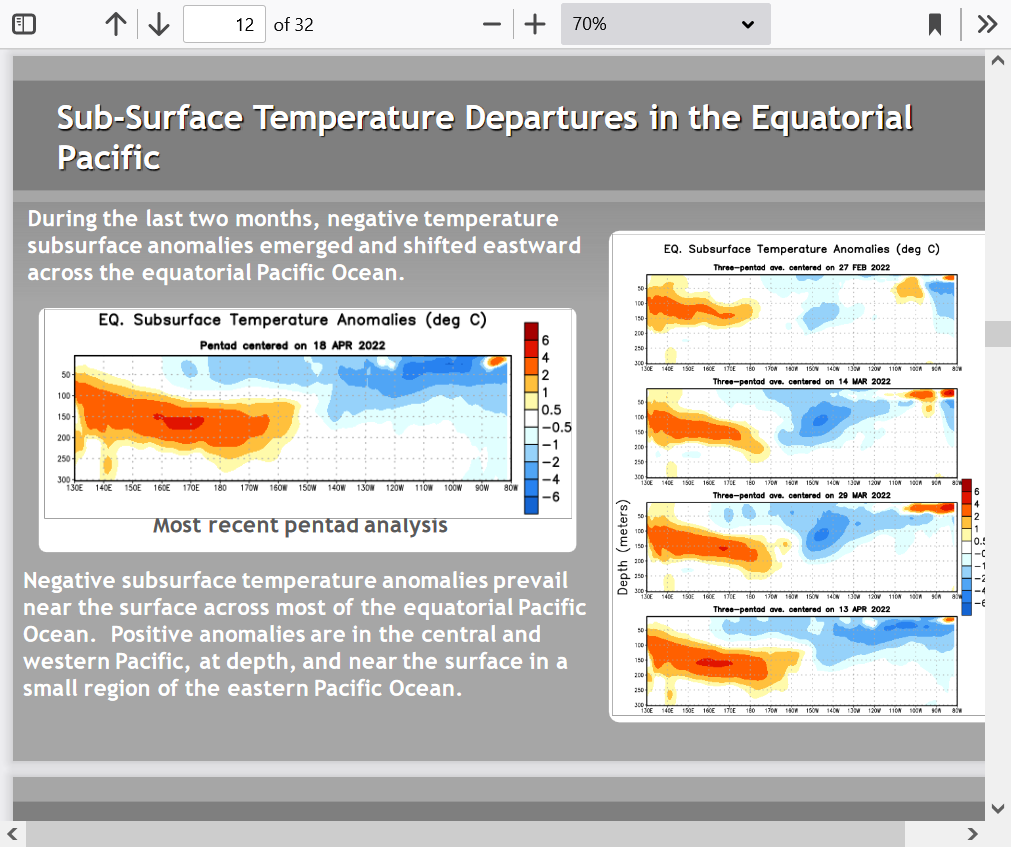
But there's still plenty of subsurface cooler water, stretched out over a larger surface area which might cause it to impact the atmosphere more.
In fact, the last observation actually shows an increase.
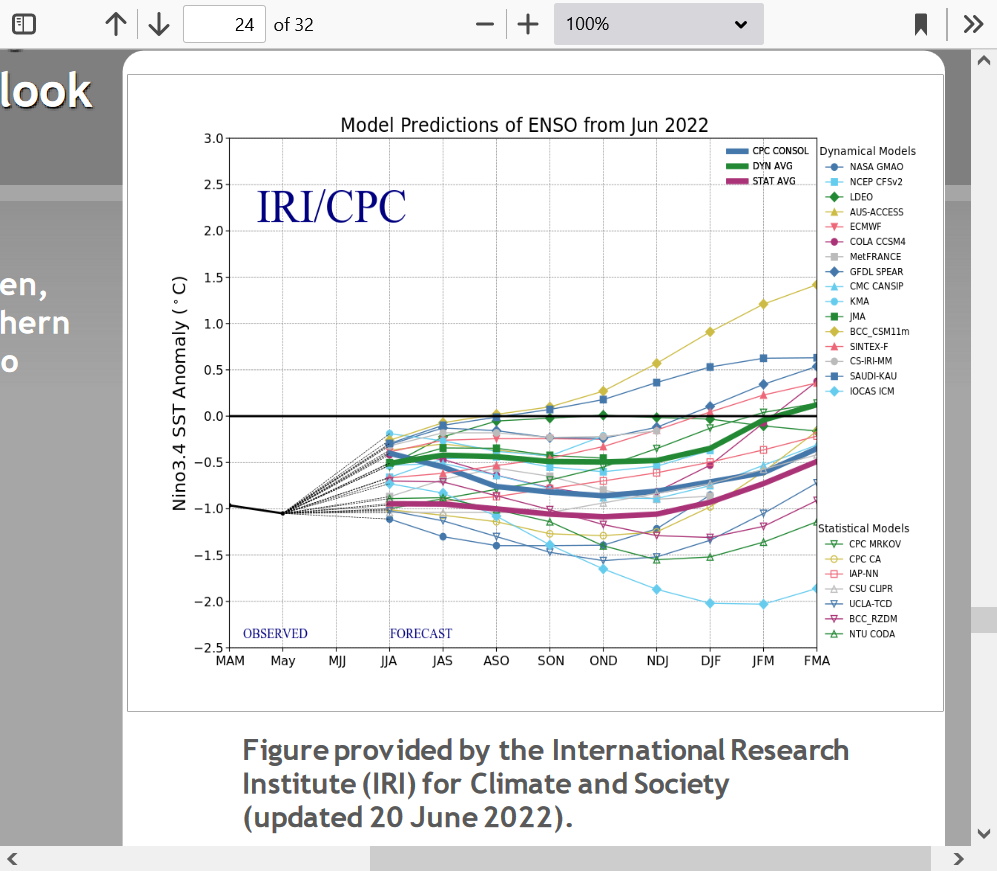
The models have consistently UNDER predicted the length of this La Nina. The last updates, once again, increased the longevity and/or maintained more strength for longer Than the previous forecasts that killed the La Niña too soon.
Instead of ENSO neutral later this year, the models have La Nina continuing.
Chances of El Nino in the next 9 months are extremely low.
This decreases the chance for new record global temperatures in 2022 but people don't realize that El Nino's and global warming increase the chances for FAVORABLE growing season weather in the US and especially the Cornbelt.
Because of global warming/climate change, the past 3+ decades have featured the best growing conditions in the US by far compared to any other 3 decade period.
Historically, we've averaged at least a major drought every 10 years(with lots of natural variation). Instead, we've only had 1 widespread, severe drought in the Midwest since 1988 (the 1988 drought was caused by a La Nina). That 1 drought in 34 years was the major drought in 2012 also caused by a La Nina.
Here are some different model solutions:
This model has a few more members that like temps getting close to neutral.
With the current -2 PDO and the ENSO models track record of not going cold enough recently.......I'm in the continued La Nina camp.
What does that mean for the growing season weather this year?
Keep in mind that seasonal/long range forecasts do not display great skill.
Even though this seasonal forecast is getting a stronger than usual signal from the current long lived La Nina and the very dry soils/drought it's caused.
Let's get the first month out of the way. We already know what the start is going to be like because shorter range, 2 week models are looking into the first 10 days of the month. See those for MUCH better insight into May.
https://www.marketforum.com/forum/topic/78385/
https://www.marketforum.com/forum/topic/78385/#78395
+++++++++++++++++++++++
https://www.cpc.ncep.noaa.gov/products/predictions/long_range/lead14/
| OFFICIAL 30-Day Forecasts | |||
| Issued: April 21, 2022 | |||
  | |||
Now, for the Summer.
Again, seasonal forecasts don't always have great skill. This horrible growing season forecast is based, mainly on 2 things.
1. La Nina(which is pretty much a sure thing) having control of the weather pattern most of the time. There are other unpredictable things that can end up being more powerful than La Nina/El Nino, so let's hope that will surprise us this Summer.
2. Already extraordinarily dry soil conditions in the West to the C/S.Plains. It's very difficult but NOT impossible to make up soil moisture deficits in the next few months in those particular regions. As long as the soil moisture remains very low, those areas, and those nearby will have elevated odds of hot/dry weather during this warm season.
++++++++++++++++++++++++++++++++++++++
3. Soils are pretty wet, east of the Mississippi and that decreases the odds of drought for those locations.
https://www.cpc.ncep.noaa.gov/products/predictions/long_range/
https://www.cpc.ncep.noaa.gov/products/predictions/long_range/seasonal.php?lead=2
Soilmoisture anomaly:
These maps sometimes take a day to catch up to incorporate the latest data(the bottom map is only updated once a week).
https://www.cpc.ncep.noaa.gov/products/Soilmst_Monitoring/US/Soilmst/Soilmst.shtml#
![]()


U.S. #drought conditions this week versus the previous 3 years. Dryness expanded considerably in Nebraska this past week, but other Corn Belt areas are slightly improving. More than half of North Dakota is now drought-free for the first time since Aug. 4, 2020.
metmike: The La Nina/cold temperatures in the tropical Pacific caused this drop in soil moisture below. The current pattern in the Pacific is the 100% polar opposite of what global warming(climate change from increasing CO2) causes.
Why does everybody think that this and almost all other types of extreme weather caused by natural variation is caused by climate change? (a +1 Deg. C warmer atmosphere does have 7% more moisture, so there HAS BEEN an uptick in high end rain events). But this one is absolutely NOT from climate change AKA global warming.
Because of meteorology/climate DISinformation articles and videos like this one below. They completely dominate the topic.
The expert's statement below, tells me that he either doesn't understand meteorology or his cognitive bias about the fake climate crisis is blocking his ability to see authentic meteorology.
Anybody that isn't a meteorologist or extremely weather savvy, which is almost everybody..... along with having extremely developed skills at searching out and analyzing empirical data and applying objective critical thinking using the physical laws of the atmosphere/oceans has almost no chance to learn the truth when almost all the experts are regurgitating the same fake climate crisis rhetoric with similar convincing sounding false narratives.
How can the average person have any chance to know the climate truths?
https://worldwarzero.com/magazine/2021/10/another-year-of-la-nina-may-extend-the-western-drought/
Another year of La Niña could exacerbate the western drought, which has engulfed 93% of the West, with close to 60% of the region in extreme or exceptional drought. These conditions have an even more disastrous effect coupled with climate change, which has left western regions mired in drought conditions and fire vulnerability.
Park Williams, a climate scientist and professor at UCLA told theGuardian: "As long as greenhouse gases continue to accumulate in the atmosphere, the dice are loaded toward increasingly warmer temperatures, meaning less mountain snowpack, greater spring evaporation, and more intense summer heatwaves and wildfire activity."
I just found the best ENSO discussion ever on the internet!
ENSO Weather: La Nina has strangely reversed its collapse, but how will it now impact the weather as we head towards the Summer and into the late year?
By: Author Andrej Flis
Posted on Published:
Categories Long range / seasonal forecast
https://www.severe-weather.eu/long-range-2/la-nina-update-cooling-warm-cold-season-forecast-fa/
Here are some additional maps and points made by this gifted meteorologist. It's in complete agreement with my previous posts but adds much, much more:
https://www.severe-weather.eu/long-range-2/la-nina-update-cooling-warm-cold-season-forecast-fa/
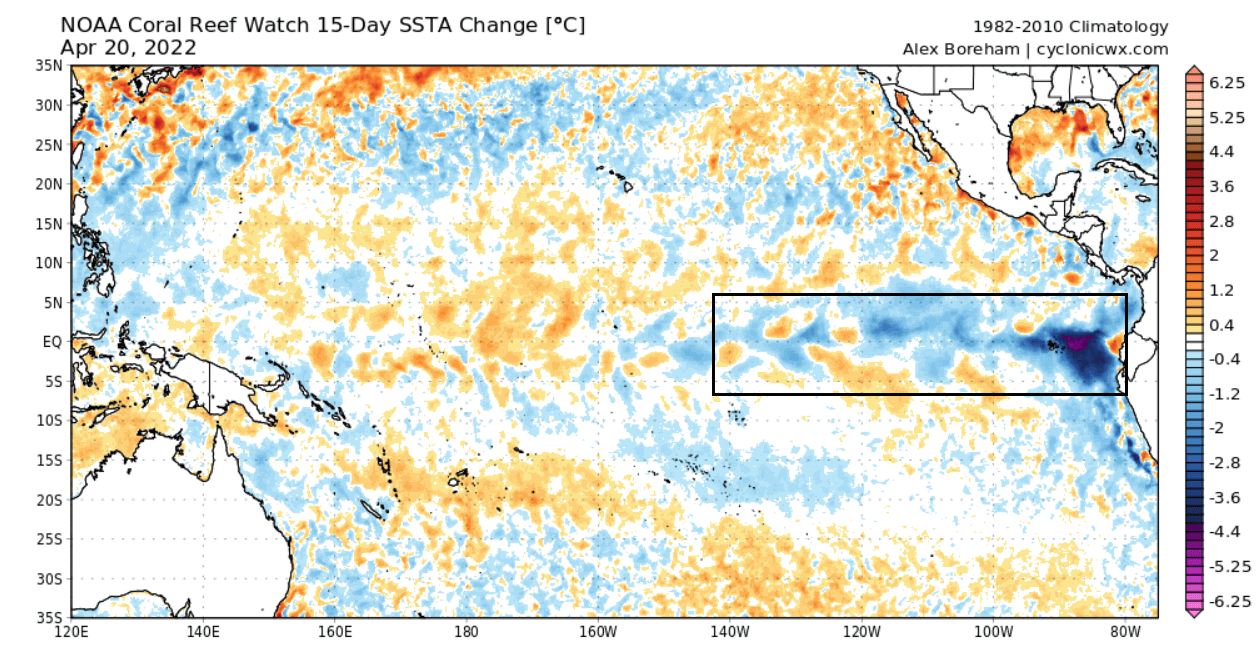
Below we have a 15-day ocean temperature anomaly change. We can see the cooling effect in the easterly ENSO regions. Also in the central area, we have more cooling than warming ongoing. This was certainly unexpected, given the forecasts just a few weeks-months ago.
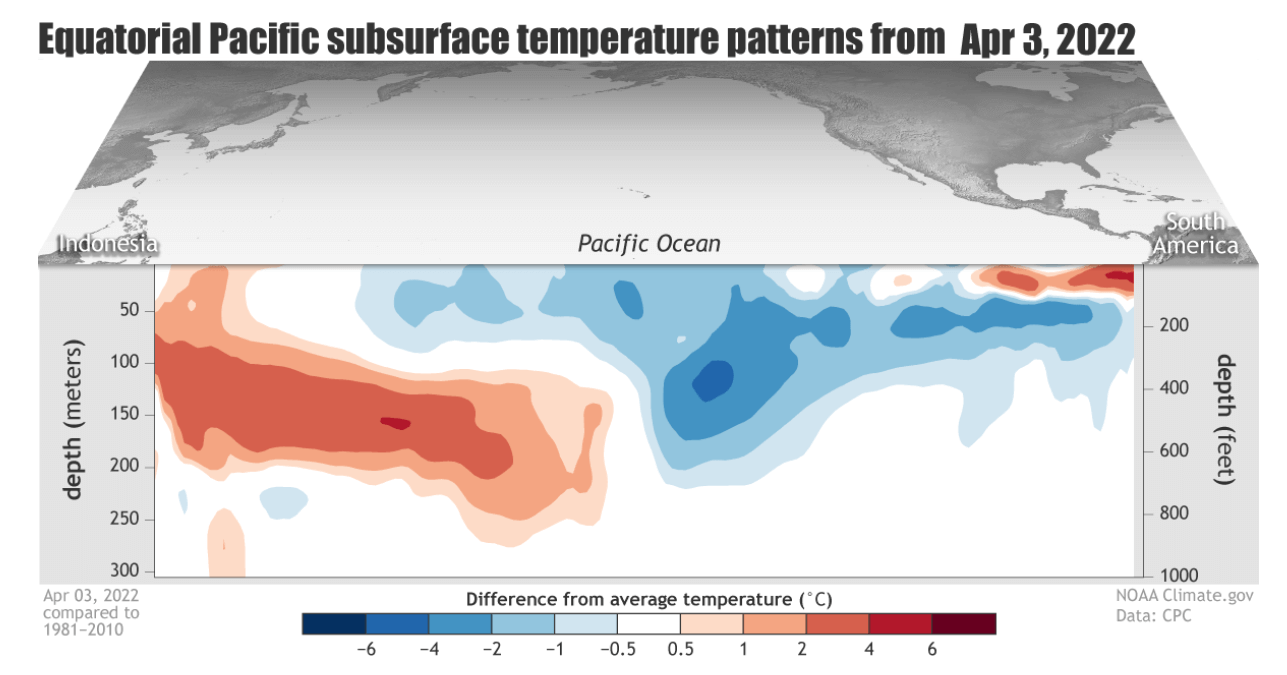
But perhaps a stronger (invisible) process is developing below the ocean surface. In the image below you can see the early February temperature anomalies by depth across the tropical Pacific Ocean. There was a warm Kelvin Wave spreading below the ocean surface, eradicating the La Nina.

The Kelvin Wave was present at around 80-200m depth. It was pushed in by the westerly currents. It caused the weakening and breakdown of cold anomalies in the central and western ENSO regions.
But looking now at the latest high-resolution depth analysis under the ENSO regions, we see colder than normal temperatures below the surface returning. This was enabled by the weakening of the westerly currents, and the strengthening of the easterly Trade Winds.
One way to look at the whole ENSO region temperature strength is by looking at the ocean heat content. This also takes the water temperatures at depth into consideration, not just at the surface.
And below we can see the cold anomalies developing in late Summer, and peaking in mid-October. The subsurface cold anomalies have weakened intermittently, with the Kelvin Wave below the surface. But a new cold wave is taking over, as seen in the images of depth above.
https://www.severe-weather.eu/long-range-2/la-nina-update-cooling-warm-cold-season-forecast-fa/
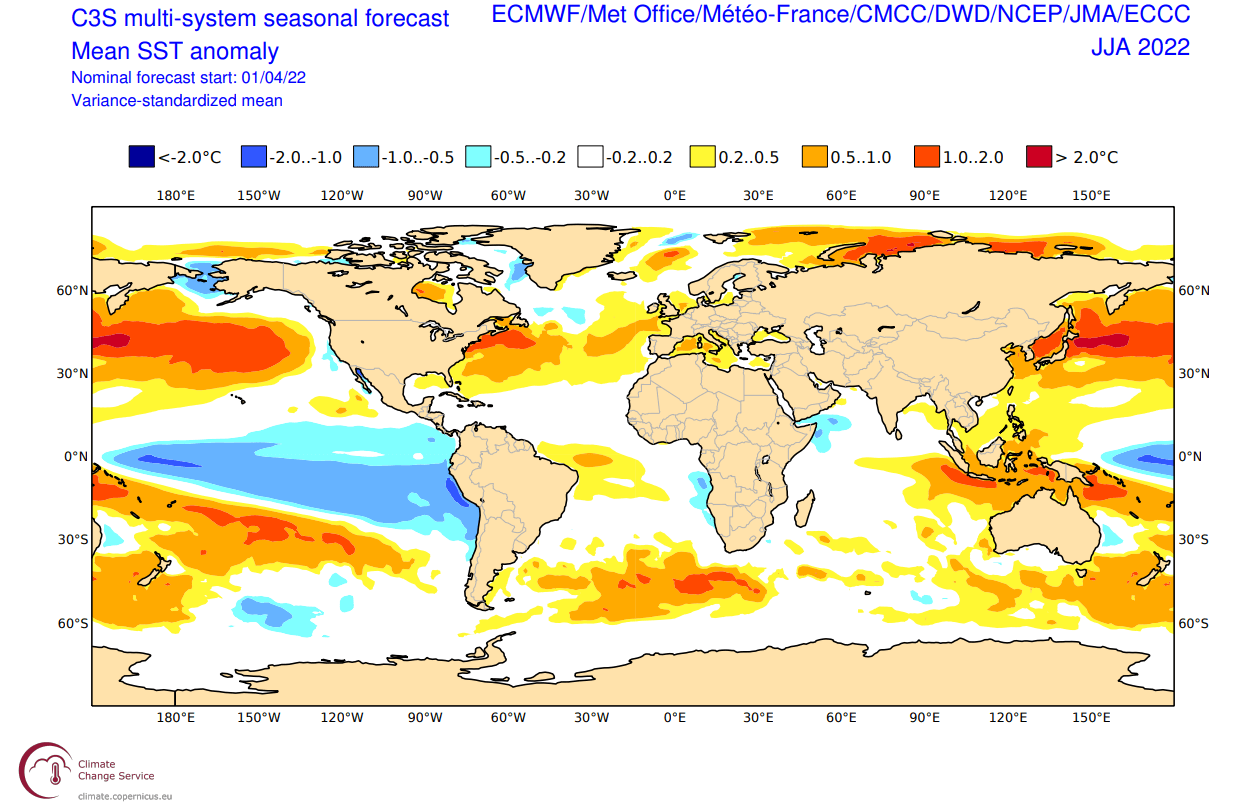
Below we have the ocean temperature forecast for Summer 2022, from the ECMWF. It now shows a continuing cold anomaly across the equatorial Pacific Ocean. Some cold anomalies can be seen south of the equator and towards the west, but keeping this an overall compact cold event.
But what can we expect from the La Nina influence during the warm season?
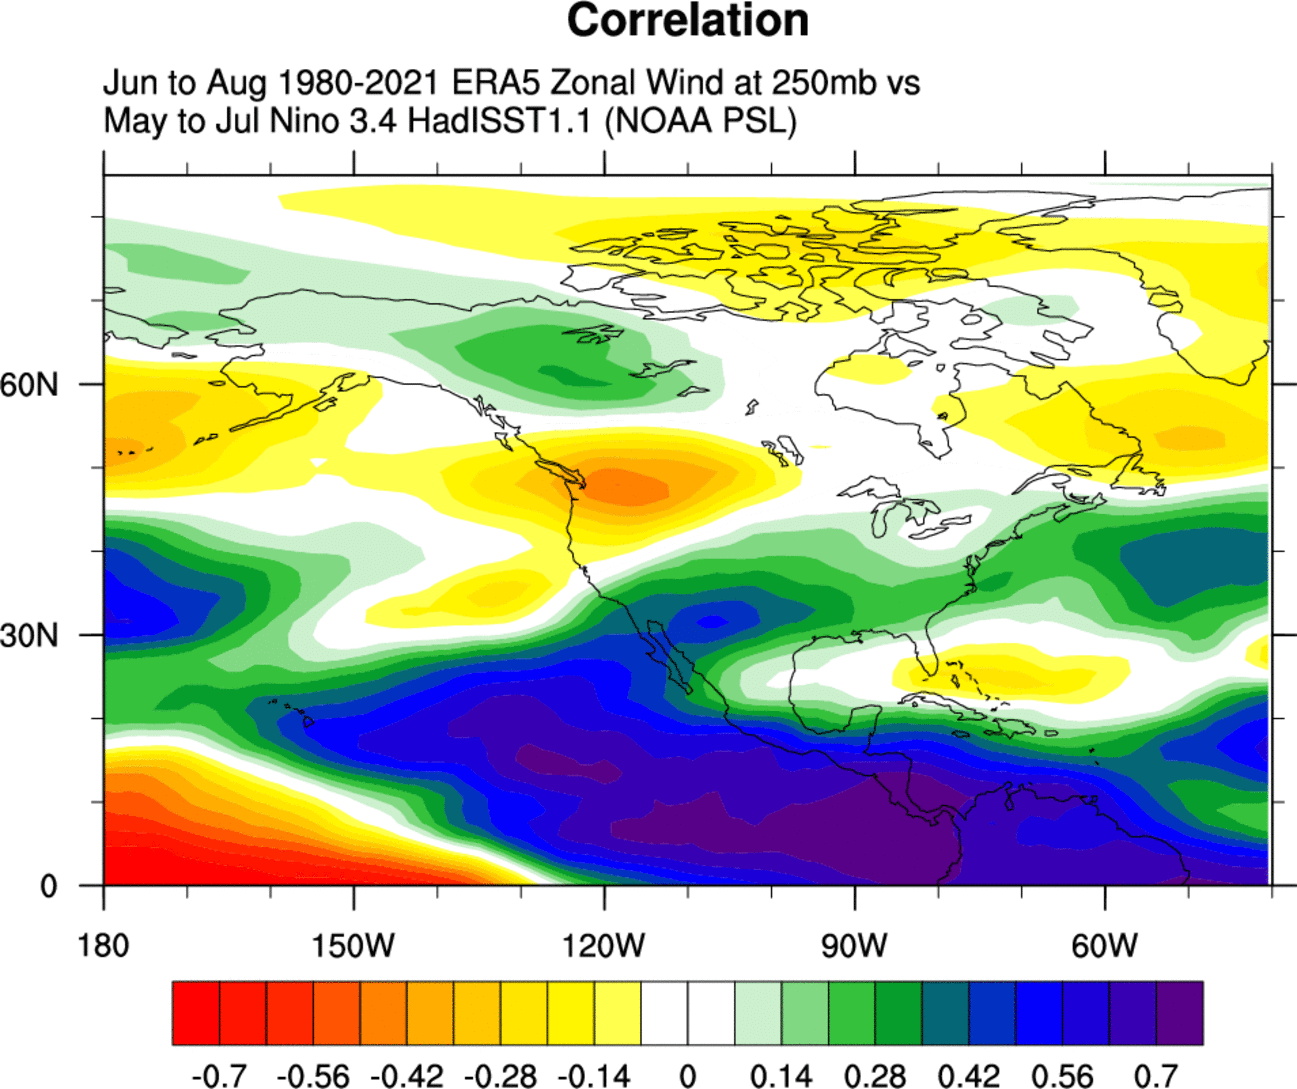
In the image below we have the correlation between the cold ENSO phase and the summer jet stream. We can see a stronger jet stream over the northwestern United States, and a weaker subtropical jet stream over the southern United States in a La Nina Summer.
metmike: Greens and blues below are WEAKER jet stream winds.
Historically, the most typical effect of a cold ENSO phase is a blocking high-pressure system in the North Pacific. We can see below, that the North Pacific high-pressure tendency during a La Nina also exists during Summer. The high-pressure pattern extends from the North Pacific into the west/central United States.
metmike: Yellows and brownish colors below are positive UPPER LEVEL high pressure anomalies.
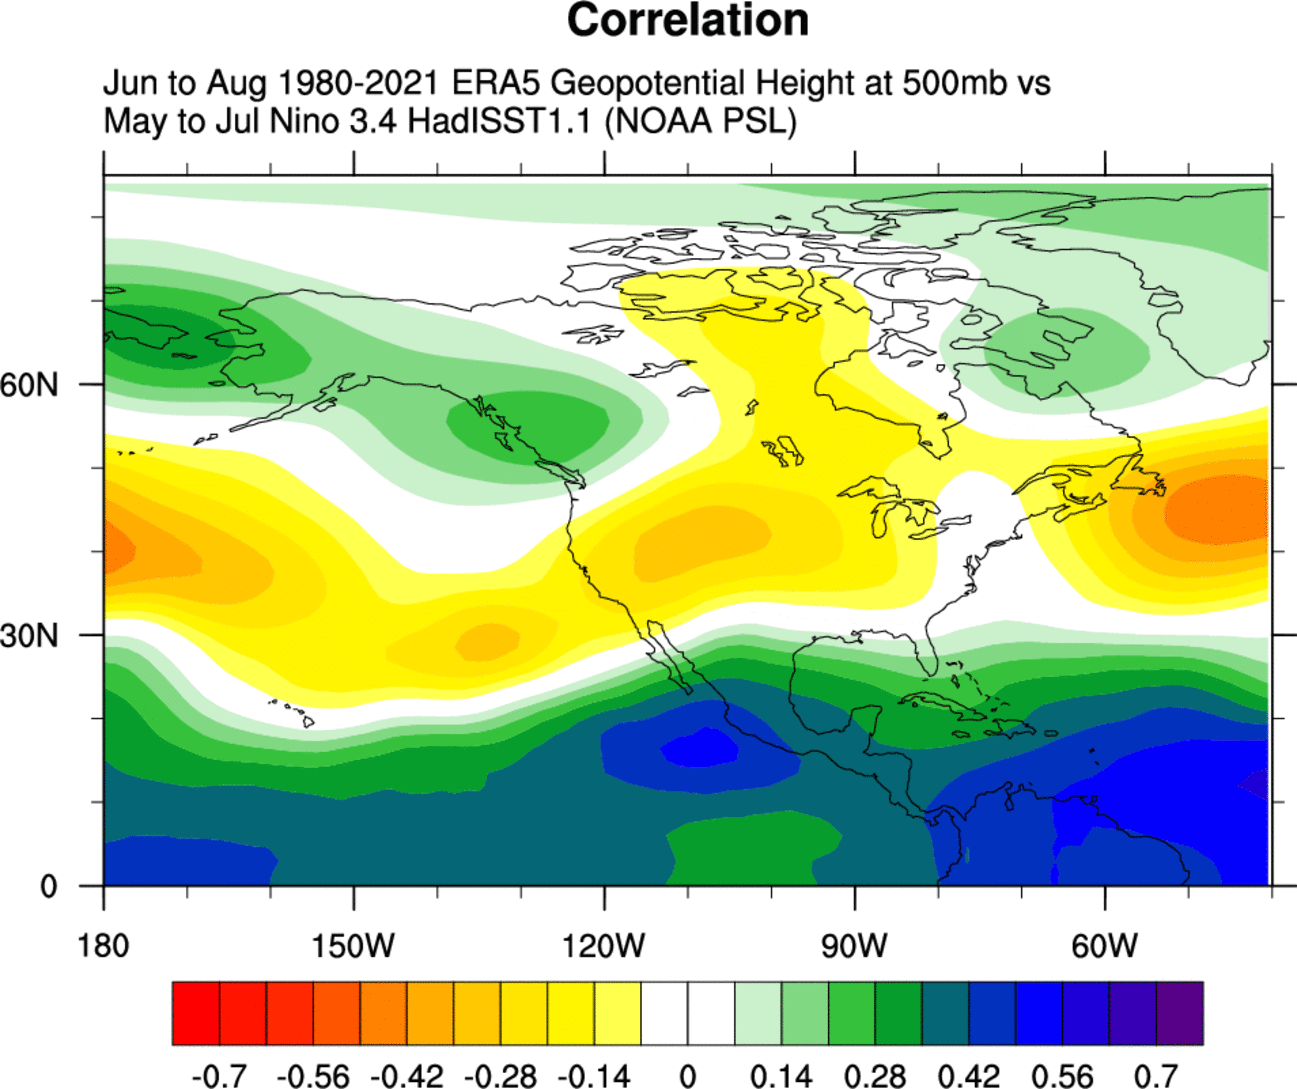 But we can also see a stronger high-pressure signal over the northeastern United States, centering to the east into the North Atlantic.
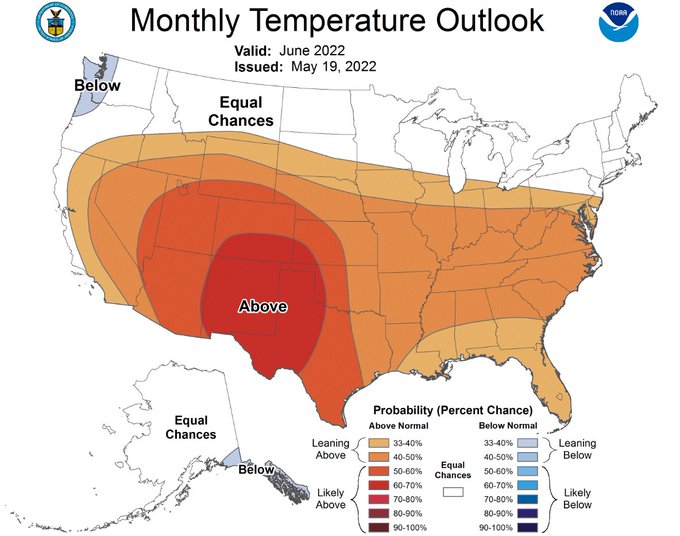
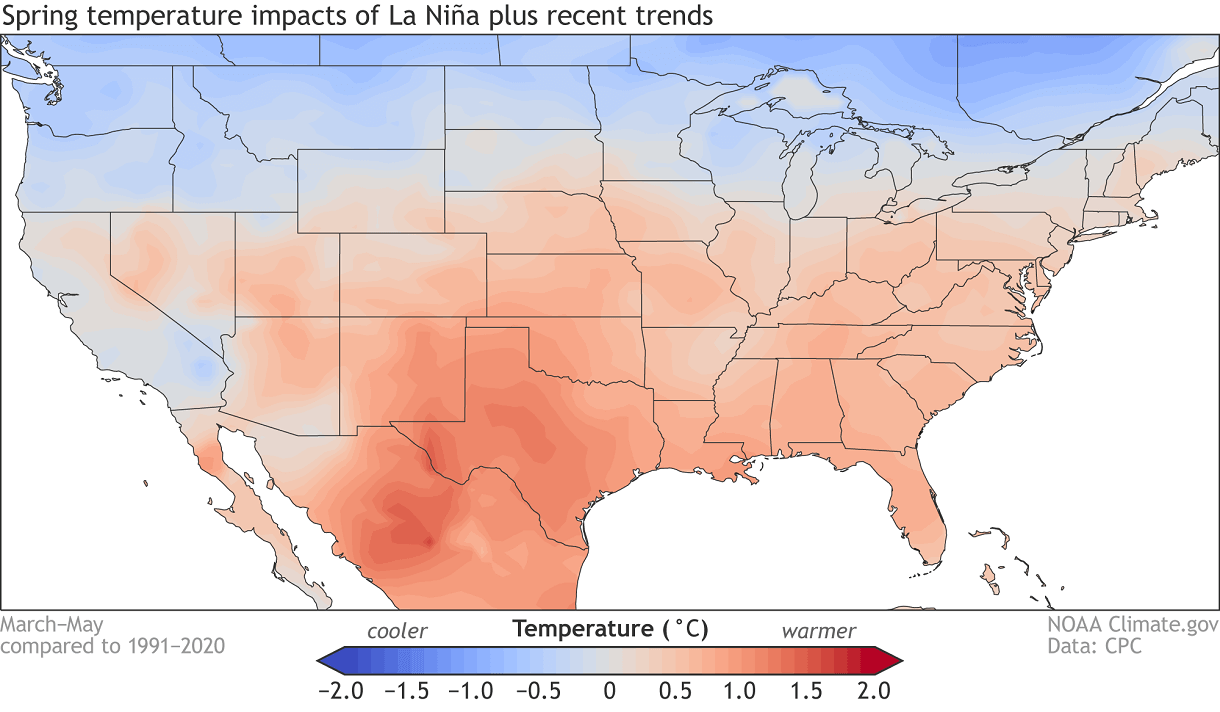
Below we have a special graphic, that shows the Spring temperature impact of a La Nina phase for the United States. We can see that the cold north/warm south pattern extends into the Spring season.
https://www.severe-weather.eu/long-range-2/la-nina-update-cooling-warm-cold-season-forecast-fa/
The spring precipitation pattern for a cold ENSO event is similar to the winter pattern. We have more precipitation north, northwest, and the parts of the eastern United States. Drier conditions prevail over much of the far south and the southwestern United States.
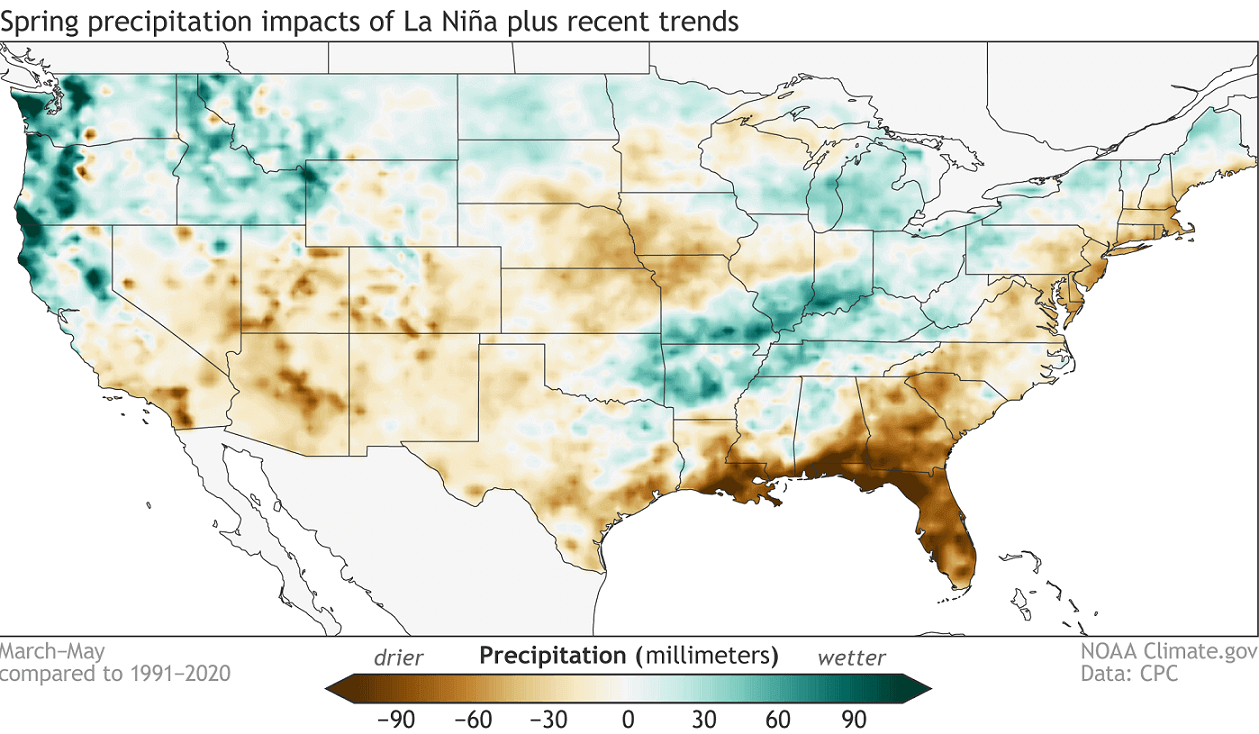 metmike: Recent temperature anomalies have in fact shown much more cold in the northern tier, which looks to continue the next 2 weeks. Precip has also been close to this pattern above but there IS A LOT RAIN COMING UP. You should go by the current 2 week forecast for guidance here and forget about this historical tendency map.
metmike: These are the Summer disparities vs average for analog years(those with a similar La Nina condition to what we have currently).
Below we have the Summer temperature and precipitation anomalies for the United States in Summers following a Spring La Nina.
We can see warmer than normal temperatures over much of the western half of the country. Of note is a colder than the normal signal for the southeastern United States.
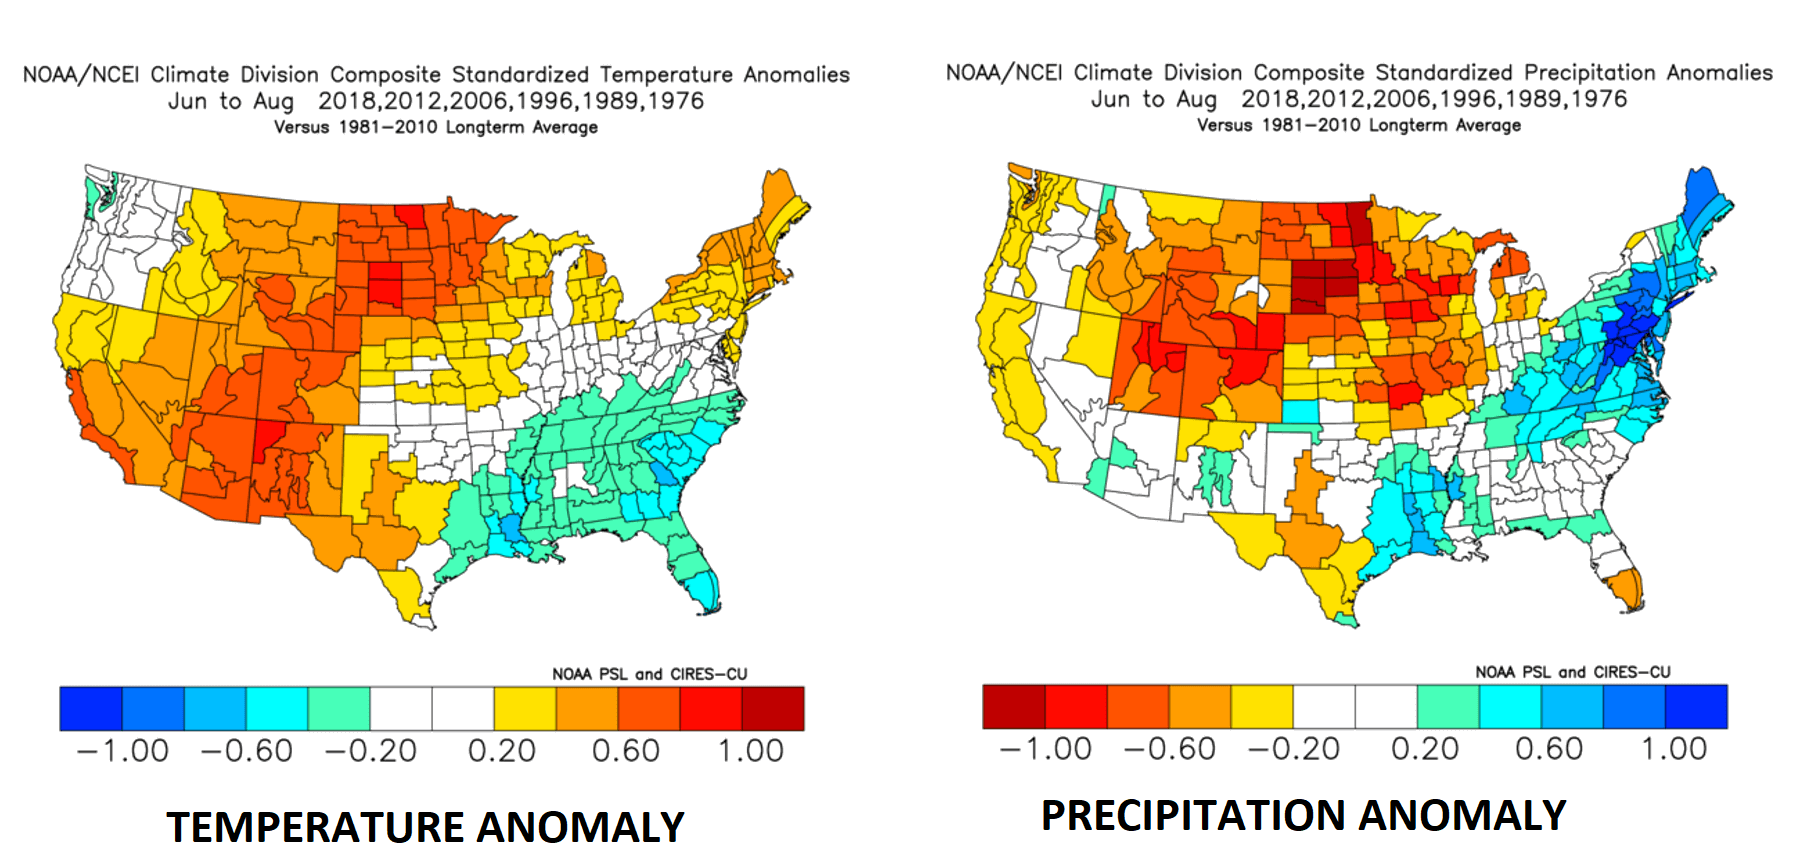
Precipitation-wise, we have a drier signal for a La Nina Summer over much of the north, central and western United States. More precipitation is hinted over the Ohio Valley and the northeastern United States, and also in the southeast.
metmike: Note the GLOBAL affects of a La Nina. Weather patterns can even be affected on the other side of the planet.
We have something called teleconnections in meteorology. There is usually a typical spacing and relationship between the large scale weather systems that goes on for many thousands of miles down/up stream. A powerful large scale weather pattern causing one extreme type of weather over a huge region, is likely to be helping to cause the opposite meteorological state/condition/weather outside of that geographical sphere of influence.......and there's a sort of chain reaction at times that can trigger physical dynamics 10,000+ miles from the source region which started it all in the tropical Pacific!
We will look at the seasonal trends for Summer 2022, using the ECMWF forecast. The period in question is the meteorological summer season, covering the June-July-August period, and is the peak of the warm season.
We typically use the ECMWF first, as is often referred to as the most reliable model in the long-range category. In reality, a lot can change with the individual year/season. But generally, the ECMWF model is at the top as far as “skill” goes.
In the pressure pattern forecast from ECMWF below, we can see a La Nina high-pressure system remaining in the North Pacific. It extends over the western/northern United States.
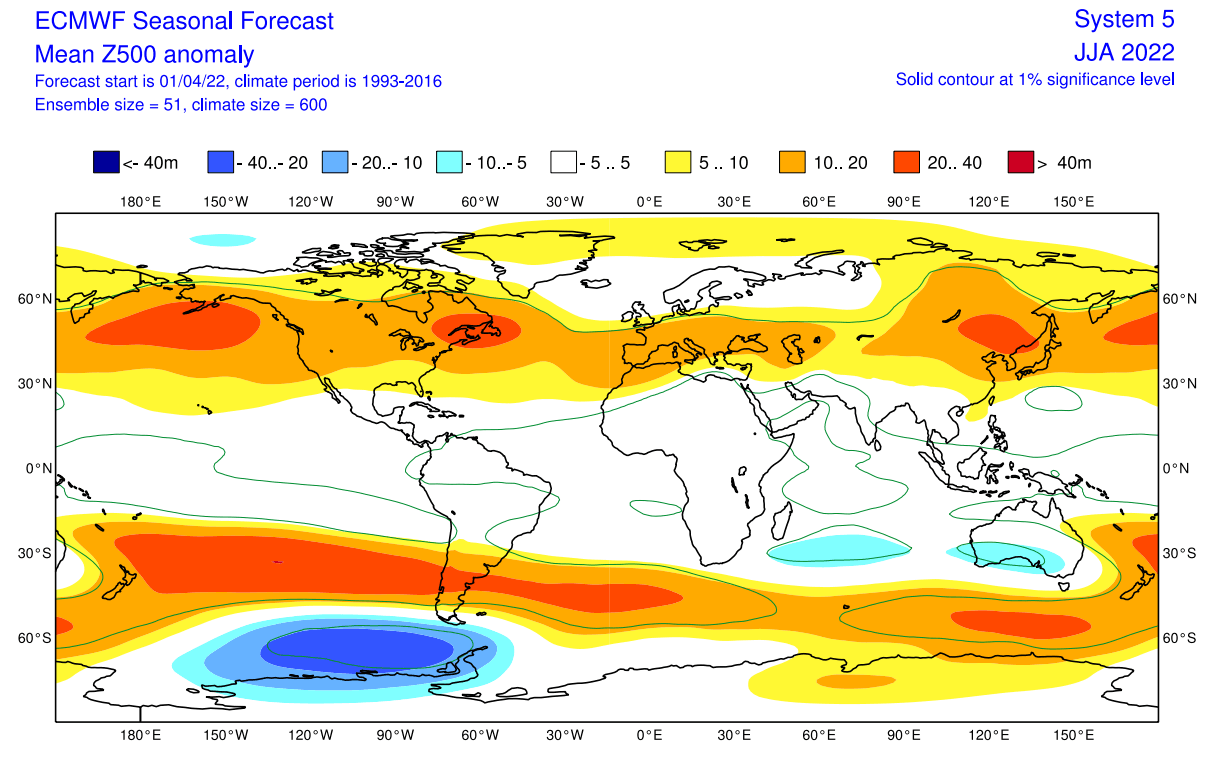
A stronger high-pressure area is found over the northeastern United States as we have seen in the La Nina signal graphic earlier above. This will have a regional effect on the weather development in the eastern United States and eastern Canada.
Another high-pressure system is over western Europe, with a low-pressure area contrasting over northern Europe.
The global temperature distribution also shows the La Nina pattern. Over North America, we see warm pooling over the central and northern United States. That is the warmer airmass under the high-pressure anomaly. Warm anomalies also extend over much of southern and eastern Canada.
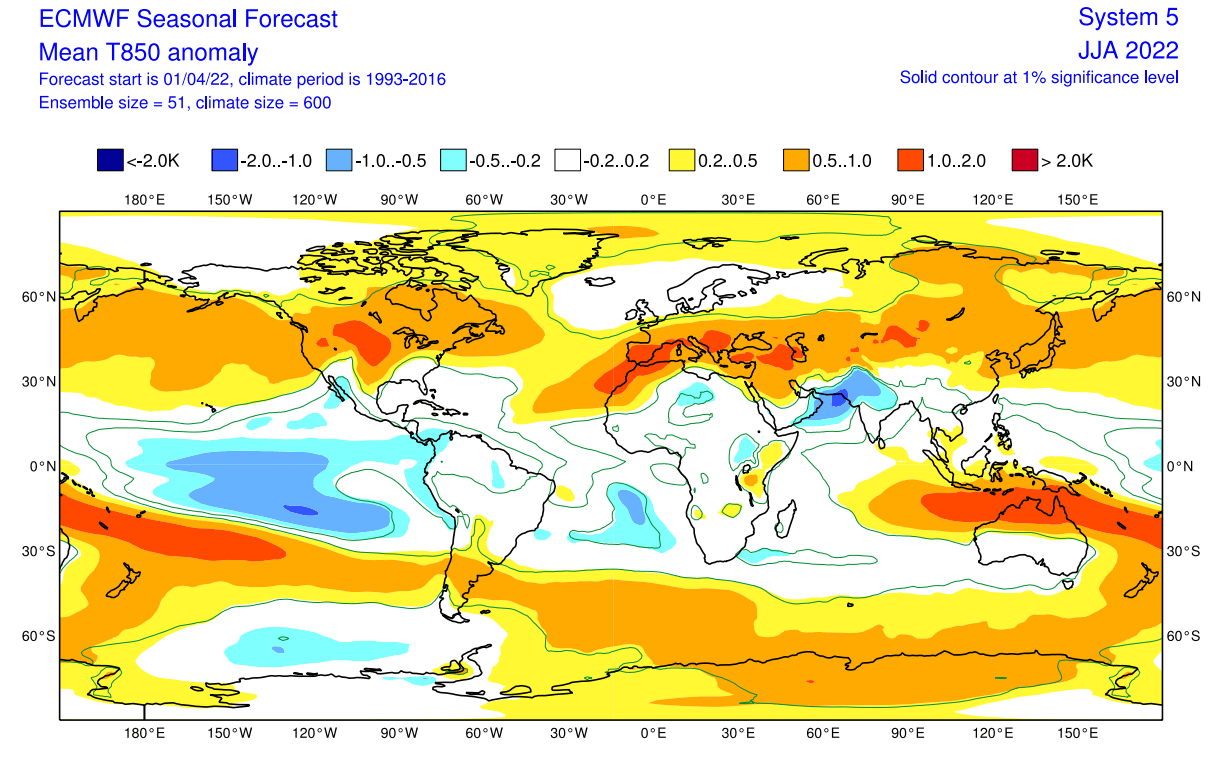
Europe features mostly warmer than normal conditions over the entire south-central half. Northern Europe however is seen neutral, under a likely cooler low-pressure area.
The precipitation forecast over North America shows drier conditions over most of the central and northern United States. But parts of the southeastern and southwestern United States, and eastern Canada have a higher chance of wetter conditions.
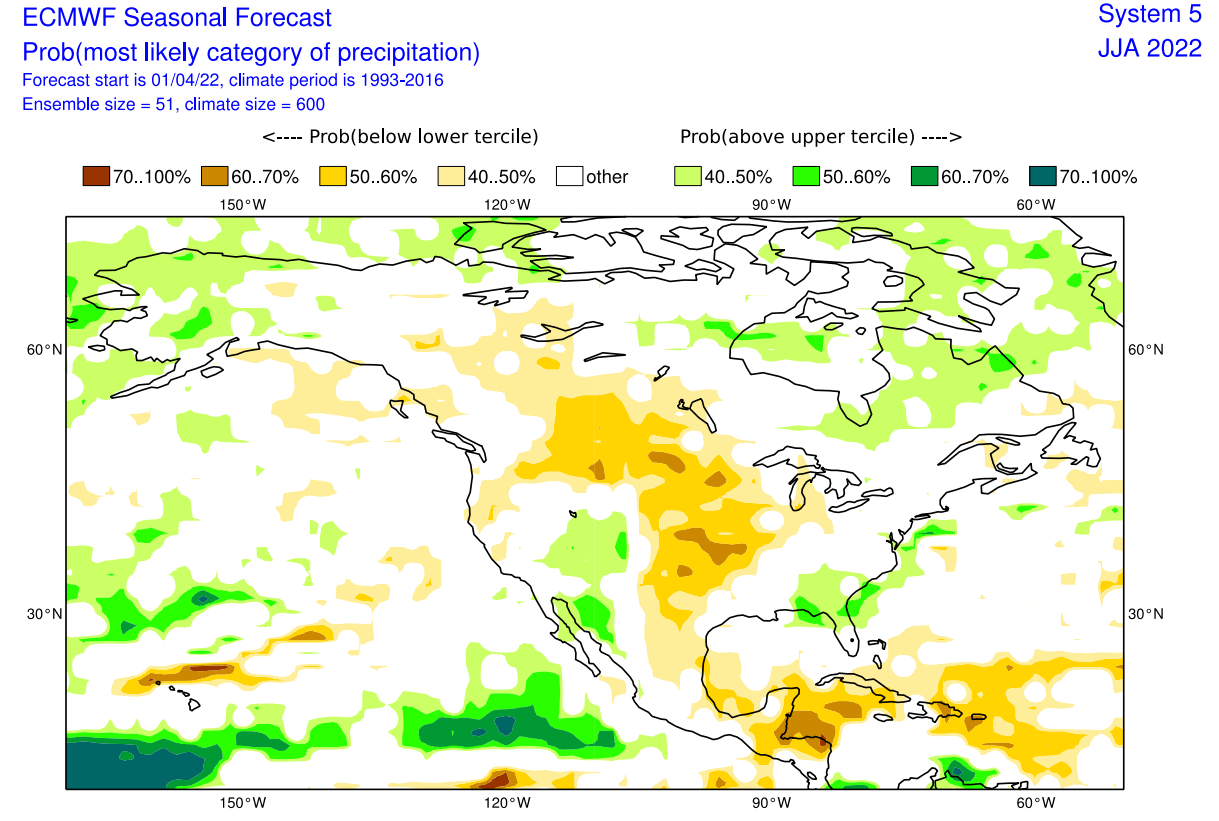
This is somewhat in line with the Summer La Nina influence that we have seen above, where the east and the southwestern United States can have more precipitation. The drier zones move into central and northern regions.
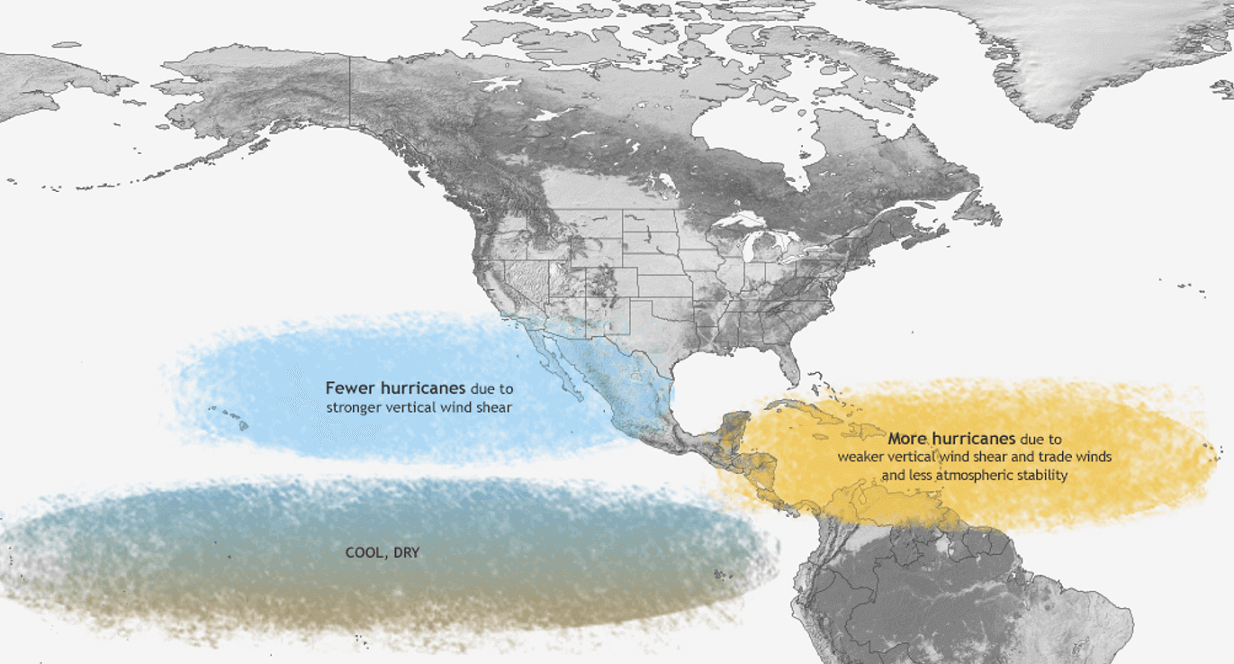
We cannot go by the Atlantic hurricane season when talking about the La Nina. There is a well-known influence of the La Nina on the hurricane season, as we have different atmospheric conditions.
In the image below, you can see the tendency for more hurricanes in the Atlantic, as the vertical wind shear is lower and the atmosphere is more unstable. In contrast, there are fewer hurricanes in the eastern Pacific, due to stronger wind shear.
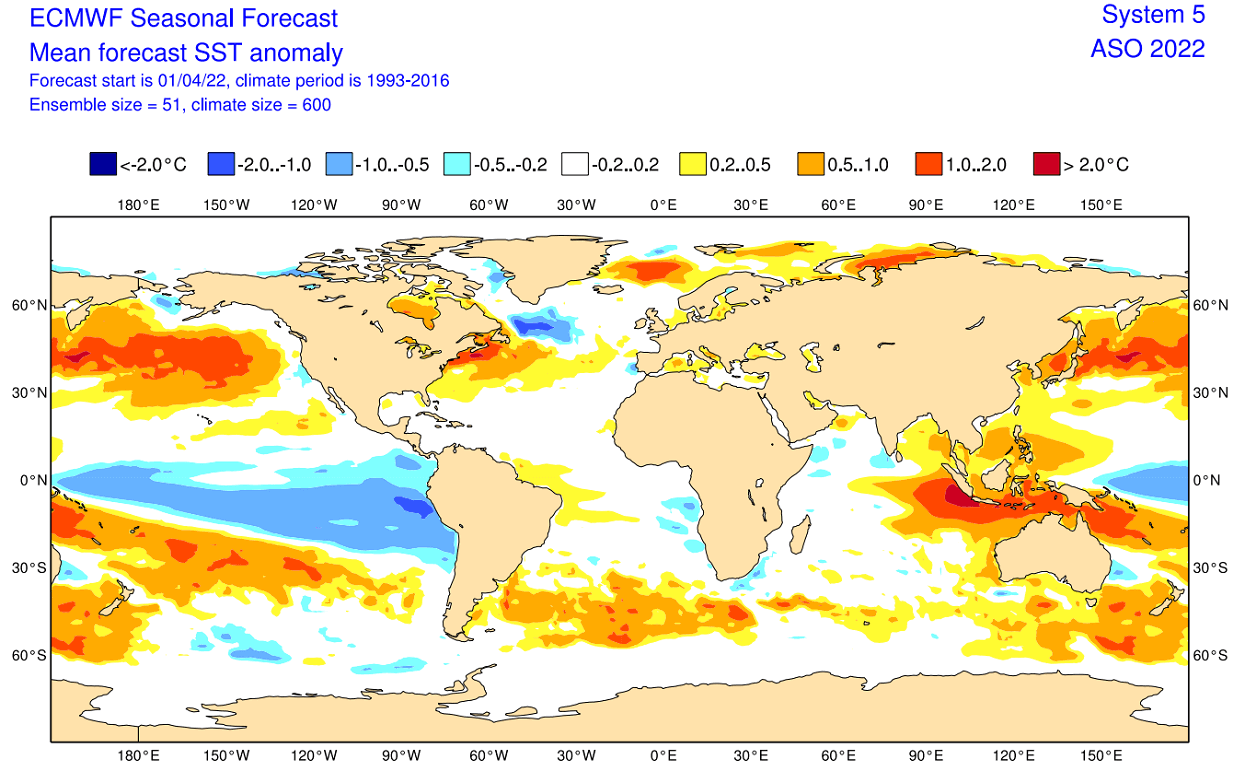
The latest ocean temperature forecast for the Hurricane season shows the active cold anomalies in the ENSO region. But in the tropical Atlantic Ocean, we see pretty neutral temperatures being forecast. A lack of warm anomalies in that region can indicate that a hyper-active season is currently less likely.
But looking at the actual ECMWF forecast for Accumulated Cyclone Energy (ACE), we do see an above-normal forecast for the Atlantic hurricane season. This can mean either a higher number of medium-power systems or a few major hurricanes that can quickly boost ACE.
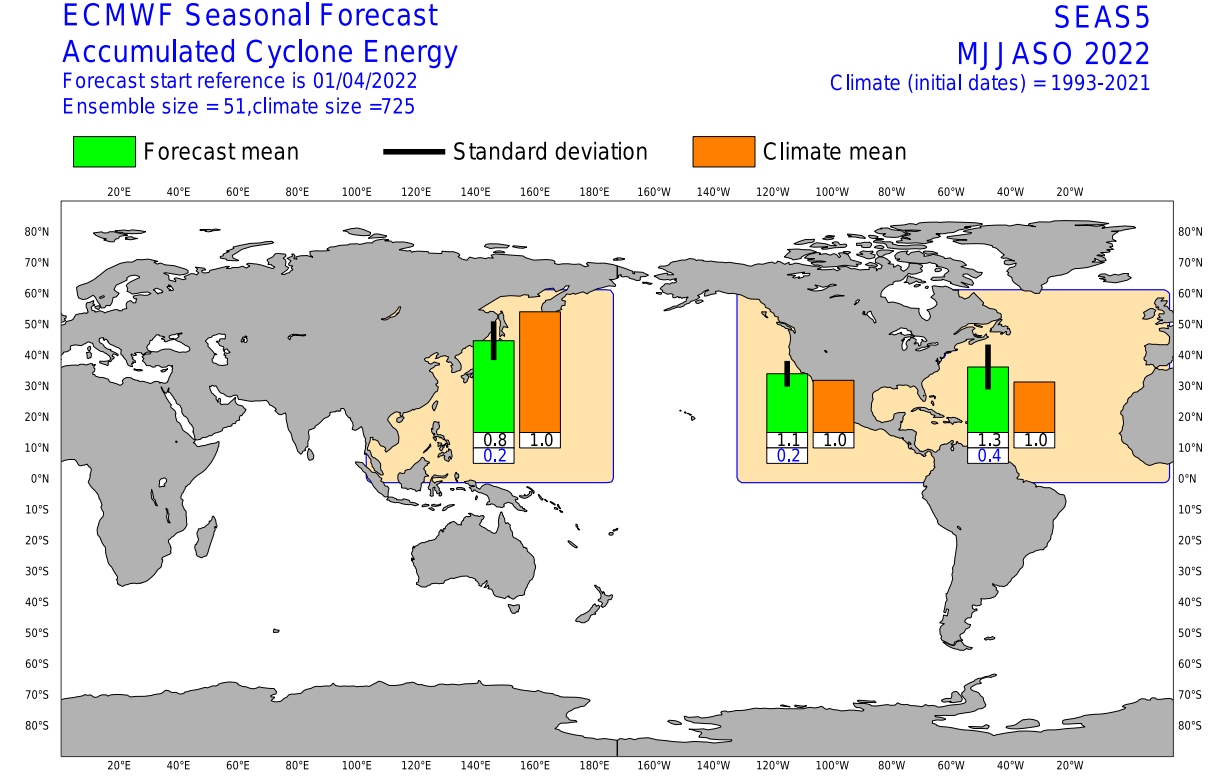
Accumulated cyclone energy (ACE) is generally a metric that expresses the energy of a tropical cyclone during its lifetime. We can combine the total energy from all systems to compare different seasons, which have been more active. But this does not mean much when it comes to landfalls.
A hurricane season with low total ACE can have 2-3 hurricane landfalls in the United States. On the other hand, a high-ACE season can have a higher number of storms that mainly stay out in the open waters.
We will keep you updated on the global weather development, so make sure to bookmark our page. Also, if you have seen this article in the Google App (Discover) feed, click the like (♥) button to see more of our forecasts and our latest articles on weather and nature in general.
metmike: Again, the link for this wonderful source is:
https://www.severe-weather.eu/long-range-2/la-nina-update-cooling-warm-cold-season-forecast-fa/
We should note, with around 100 pages of detailed, insightful weather/climate analysis/graphics at how many times he mentioned climate change as being responsible for any of it:
ZERO!
Watching the extended models to see if/when the first La Nina, rain suppressing, heat dome develops and where.
Latest weather here:
We're watching the models for signs of the currently strong La Nina signal to show up downstream in the US with long lasting, rain suppressing heat ridges.
Is the first one next week an early signal???
The model think it will be transient but model skill is very poor when we get well into week 2 and beyond.
Here's the just updated weeks 3-4 outlook. Take it with a grain of salt.
https://www.cpc.ncep.noaa.gov/products/predictions/WK34/


NCEP(Climate Prediction Center) will have its weekly ENSO update this afternoon.
Unlike weather forecasts that can change daily and look completely different 7 days later, the oceans change incredibly slower.
So despite the potential for some changes, they are likely to be very small vs the previous update a week earlier.
Latest on ENSO/La Nina:
Cold water anomalies continue strong in the tropic Pacific. In the last model update, a longer La Nina was predicted compared to the previous runs. In other words, the models still think La Nina fades at some point but instead of it happening this Summer(as predicted at the start of this year) La Nina will last thru 2022 as it fades.
ENSO: Recent Evolution,
Current Status and Predictions
Update prepared by:
Climate Prediction Center / NCEP
9 May 2022
Late week 2 short term weather models are lining up with a turn to a hot start to June.
https://www.marketforum.com/forum/topic/83844/#84510
ENSO: Recent Evolution,
Current Status and Predictions
Update prepared by:
Climate Prediction Center / NCEP
16 May 2022
metmike: Not much change. La Nina looks likely thru the rest of the year.
Let's face it. By the weather models, grains are going to go higher. Cattle are going to go higher. Hurricanes and war are going to drive gas and oil. And with the current out of control spending policies of the current administration, inflation is going to be rampant. Even dried kidney beans are going to be expensive. We're screwed!
ENSO Update from NOAA
La NIna is weakening a bit........which was expected.
It seems pretty obvious that the first part of Summer will very likely have a very impressive, rain suppressing heat ridge, probably driven by La Nina forcing.
Location is always uncertain. Next week will give us an extra week to look forward to see if the intense hot air dome over much of the country, especially the Midsection shifts or not.
Latest update shows the cold water anomalies in the eastern/central Pacific are weakening/shrinking(gone in the central), especially below the surface but the La Nina that won't die will continue to dominate the next several months and there will be a downstream heat ridge in a large part of the US because of it.
The next 2 weeks looks active with storm clusters around the periphery of the heat ridge.
The location can shift around, depending on the year but there have been numerous La Nina Summers that suddenly saw the rains shut down for good in July as the ridge shifted north and removed the mechanisms for it.
Incredibly informative/Insightful/Educational weather, oceanic and climate discussion:
La Nina hanging on but subsurface cool water is running out, so we will be neutral by this Fall(I think).
However, the atmosphere will still react to a surface La Nina ......cool water anomalies in the C/E Tropical Pacific for the rest of Summer.
This elevates the chance for hot/dry in the Cornbelt, especially WCB!
Minor adjustment to my previous thinking, thanks to our astute meteorological assistant, Jim.
https://www.marketforum.com/forum/topic/86953/#87124
Hey Larry, we have somebody challenging you for that position (-: