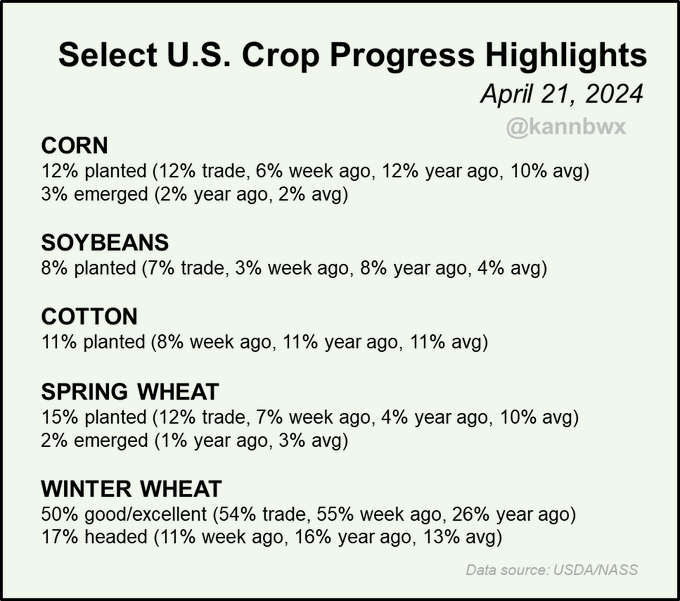
Wheat conditions dropped 5% in the G/E category. This has been a bullish factor for the market recently and especially tonight.
Full crop progress report:
+++++++++++++++++
U.S. winter #wheat conditions plunge 5 percentage points to 50% good/excellent (analyst range was 52-55). #Cotton planting is moving at an average pace but #corn, #soybeans and spring #wheat are all a bit ahead of average.
Though conditions dropped 5% they are still tracking much higher than the previous 2 years and close to 2021.
https://www.nass.usda.gov/Charts_and_Maps/Crop_Progress_&_Condition/2024/US_2024.pdf
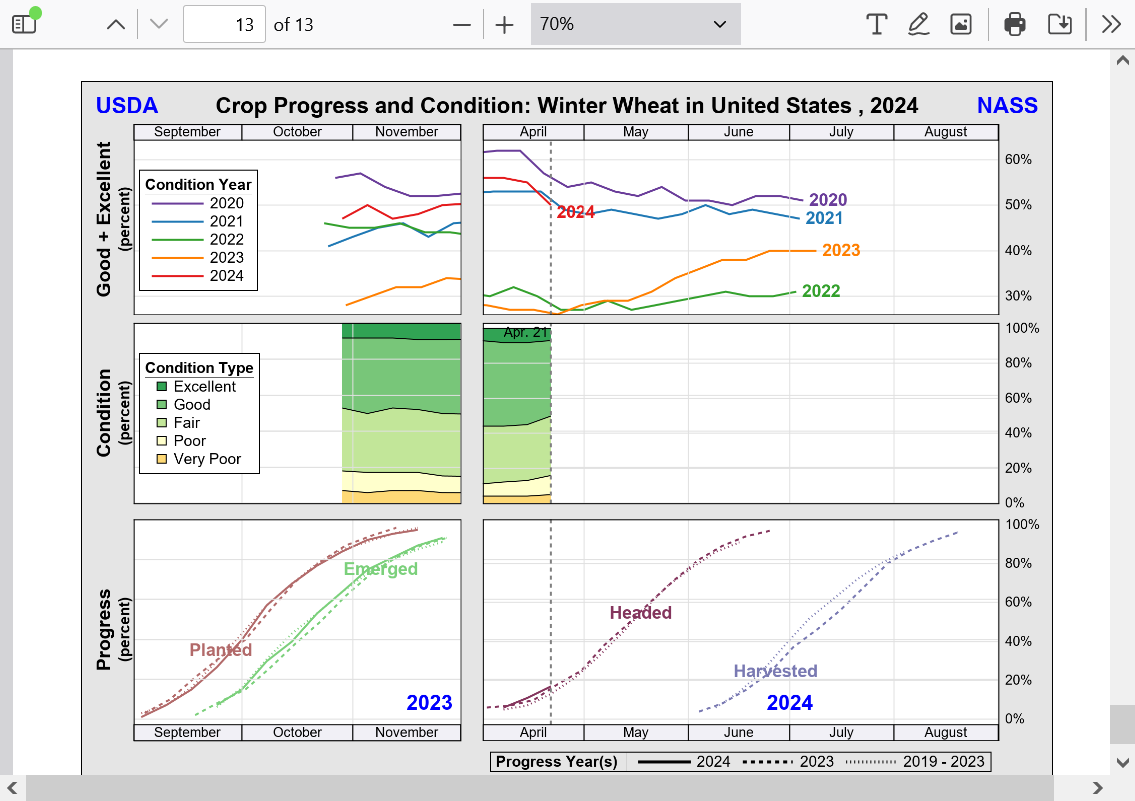
I'll have to check to see where the biggest drops were but #1 wheat producer, Kansas needs rain!
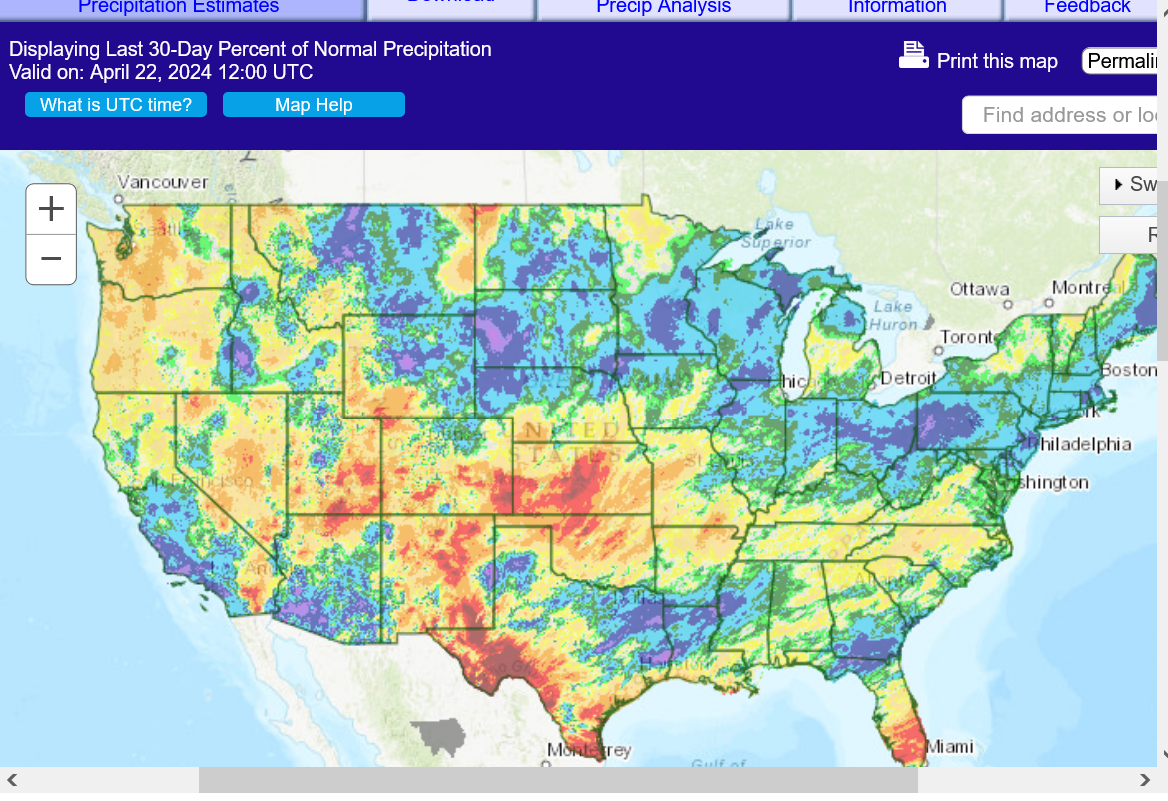
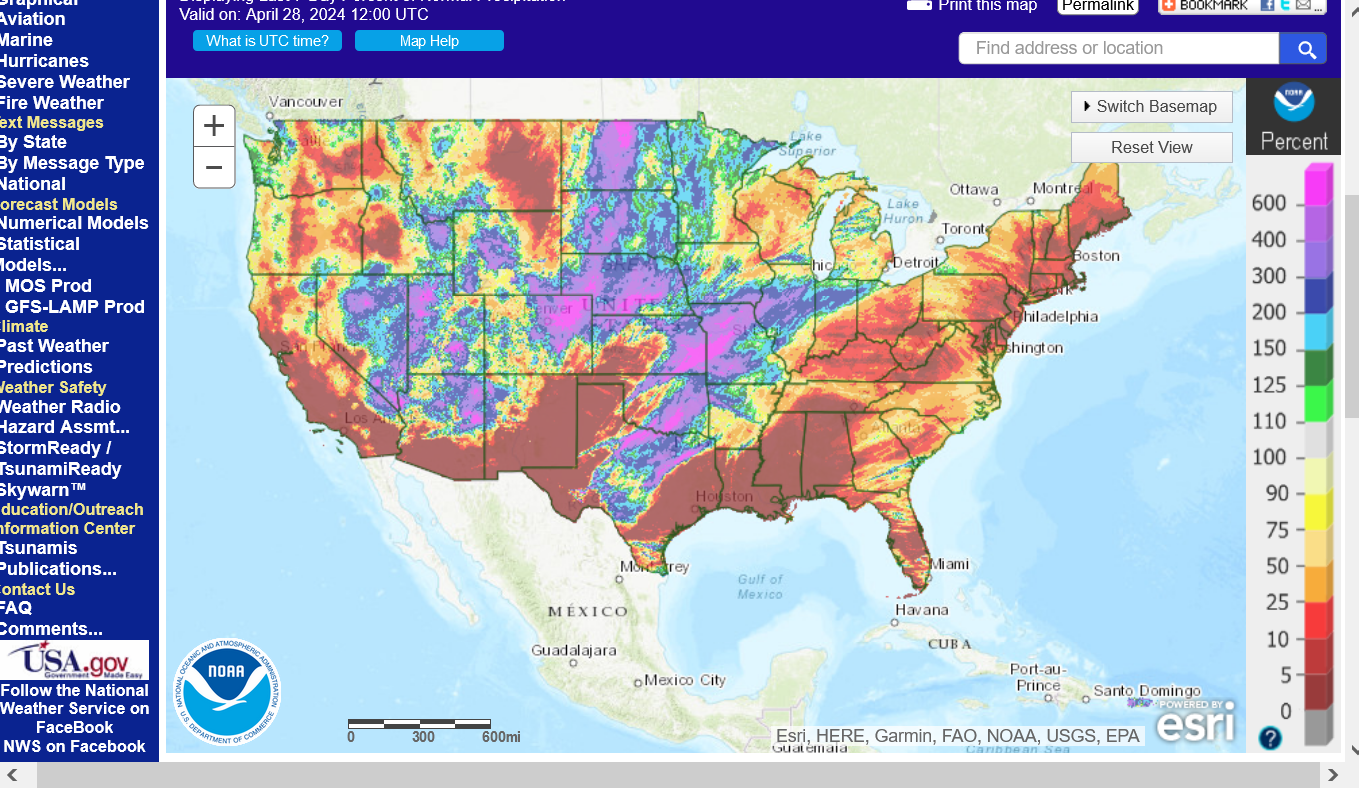
1. The last 30 days of precip % of average
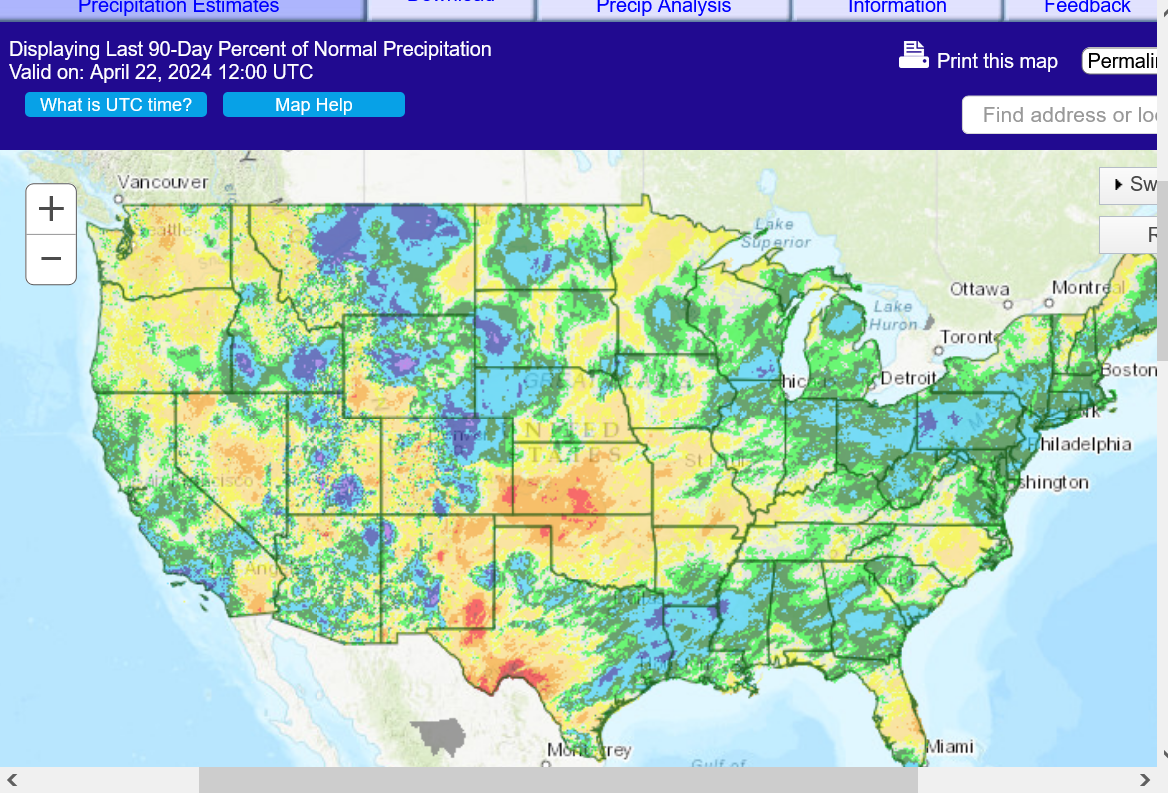
2. 90 days total % precip
https://water.weather.gov/precip/
The soil moisture maps are pretty odd right now and don't seem to line up with the precip as well as expected. Probably because the very mild/warm temps have caused unusually high evaporation rates/drying this Winter/Spring
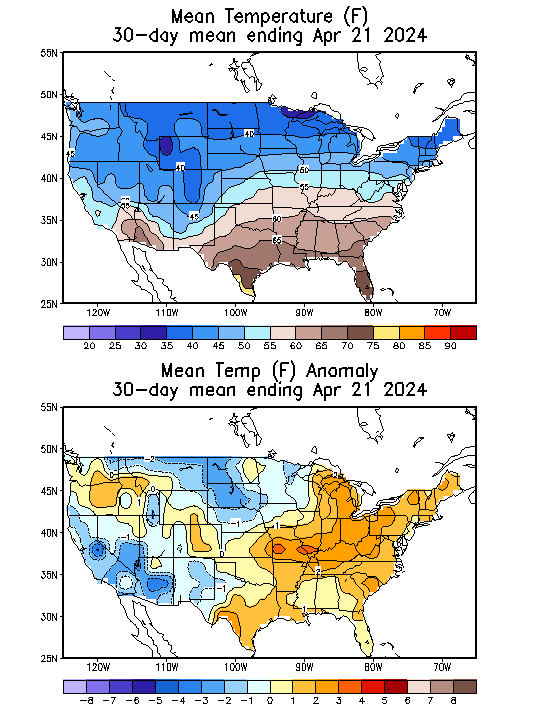
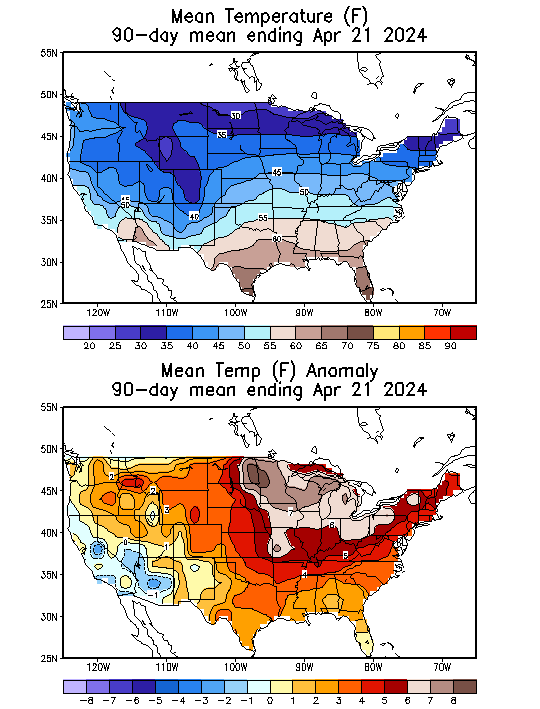
Temps
1. The last 30 days
2. The last 90 days
https://www.cpc.ncep.noaa.gov/products/tanal/temp_analyses.php
++++++++++++++++++++
https://www.marketforum.com/forum/topic/83844/#83853
Soilmoisture anomaly:
These maps sometimes take a day to catch up to incorporate the latest data(the bottom map is only updated once a week).
https://www.cpc.ncep.noaa.gov/products/Soilmst_Monitoring/US/Soilmst/Soilmst.shtml#
![]()


++++++++++++++++++++++++++++
Updated daily below:
https://mrcc.purdue.edu/cliwatch/watch.htm#curMonths

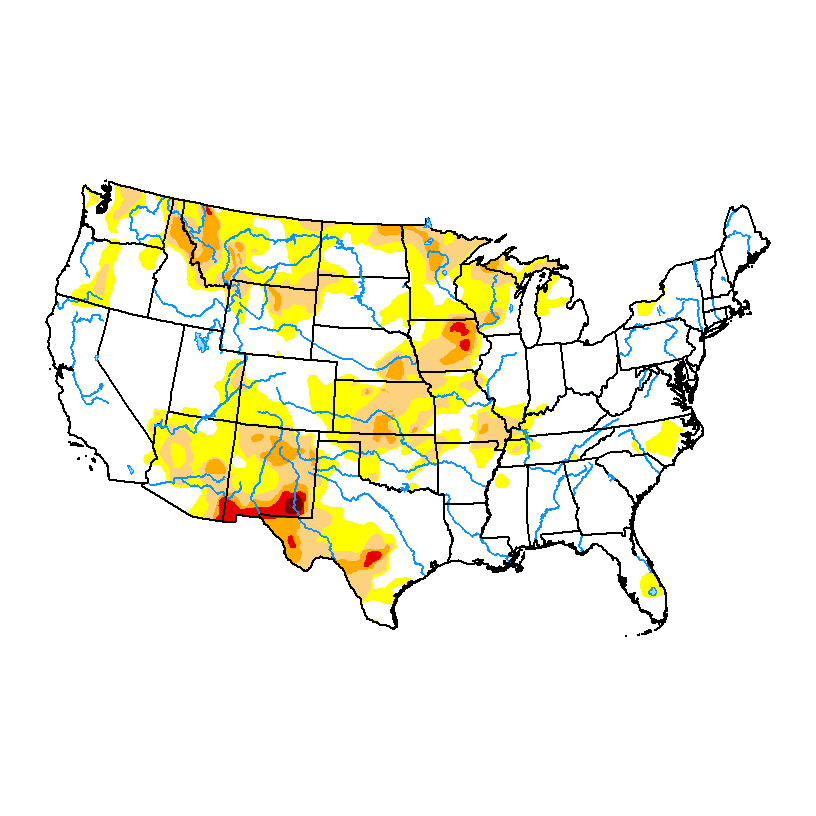
DROUGHT MONITOR
https://droughtmonitor.unl.edu/
Last week as of April 16, 2024
April 18, 2023-1 year ago:

Drought monitor previous years: You can see the natural La Niña, (cold water-in the tropical Pacific)causing the drought! Starting in 2020, then worsening for 2+ years!
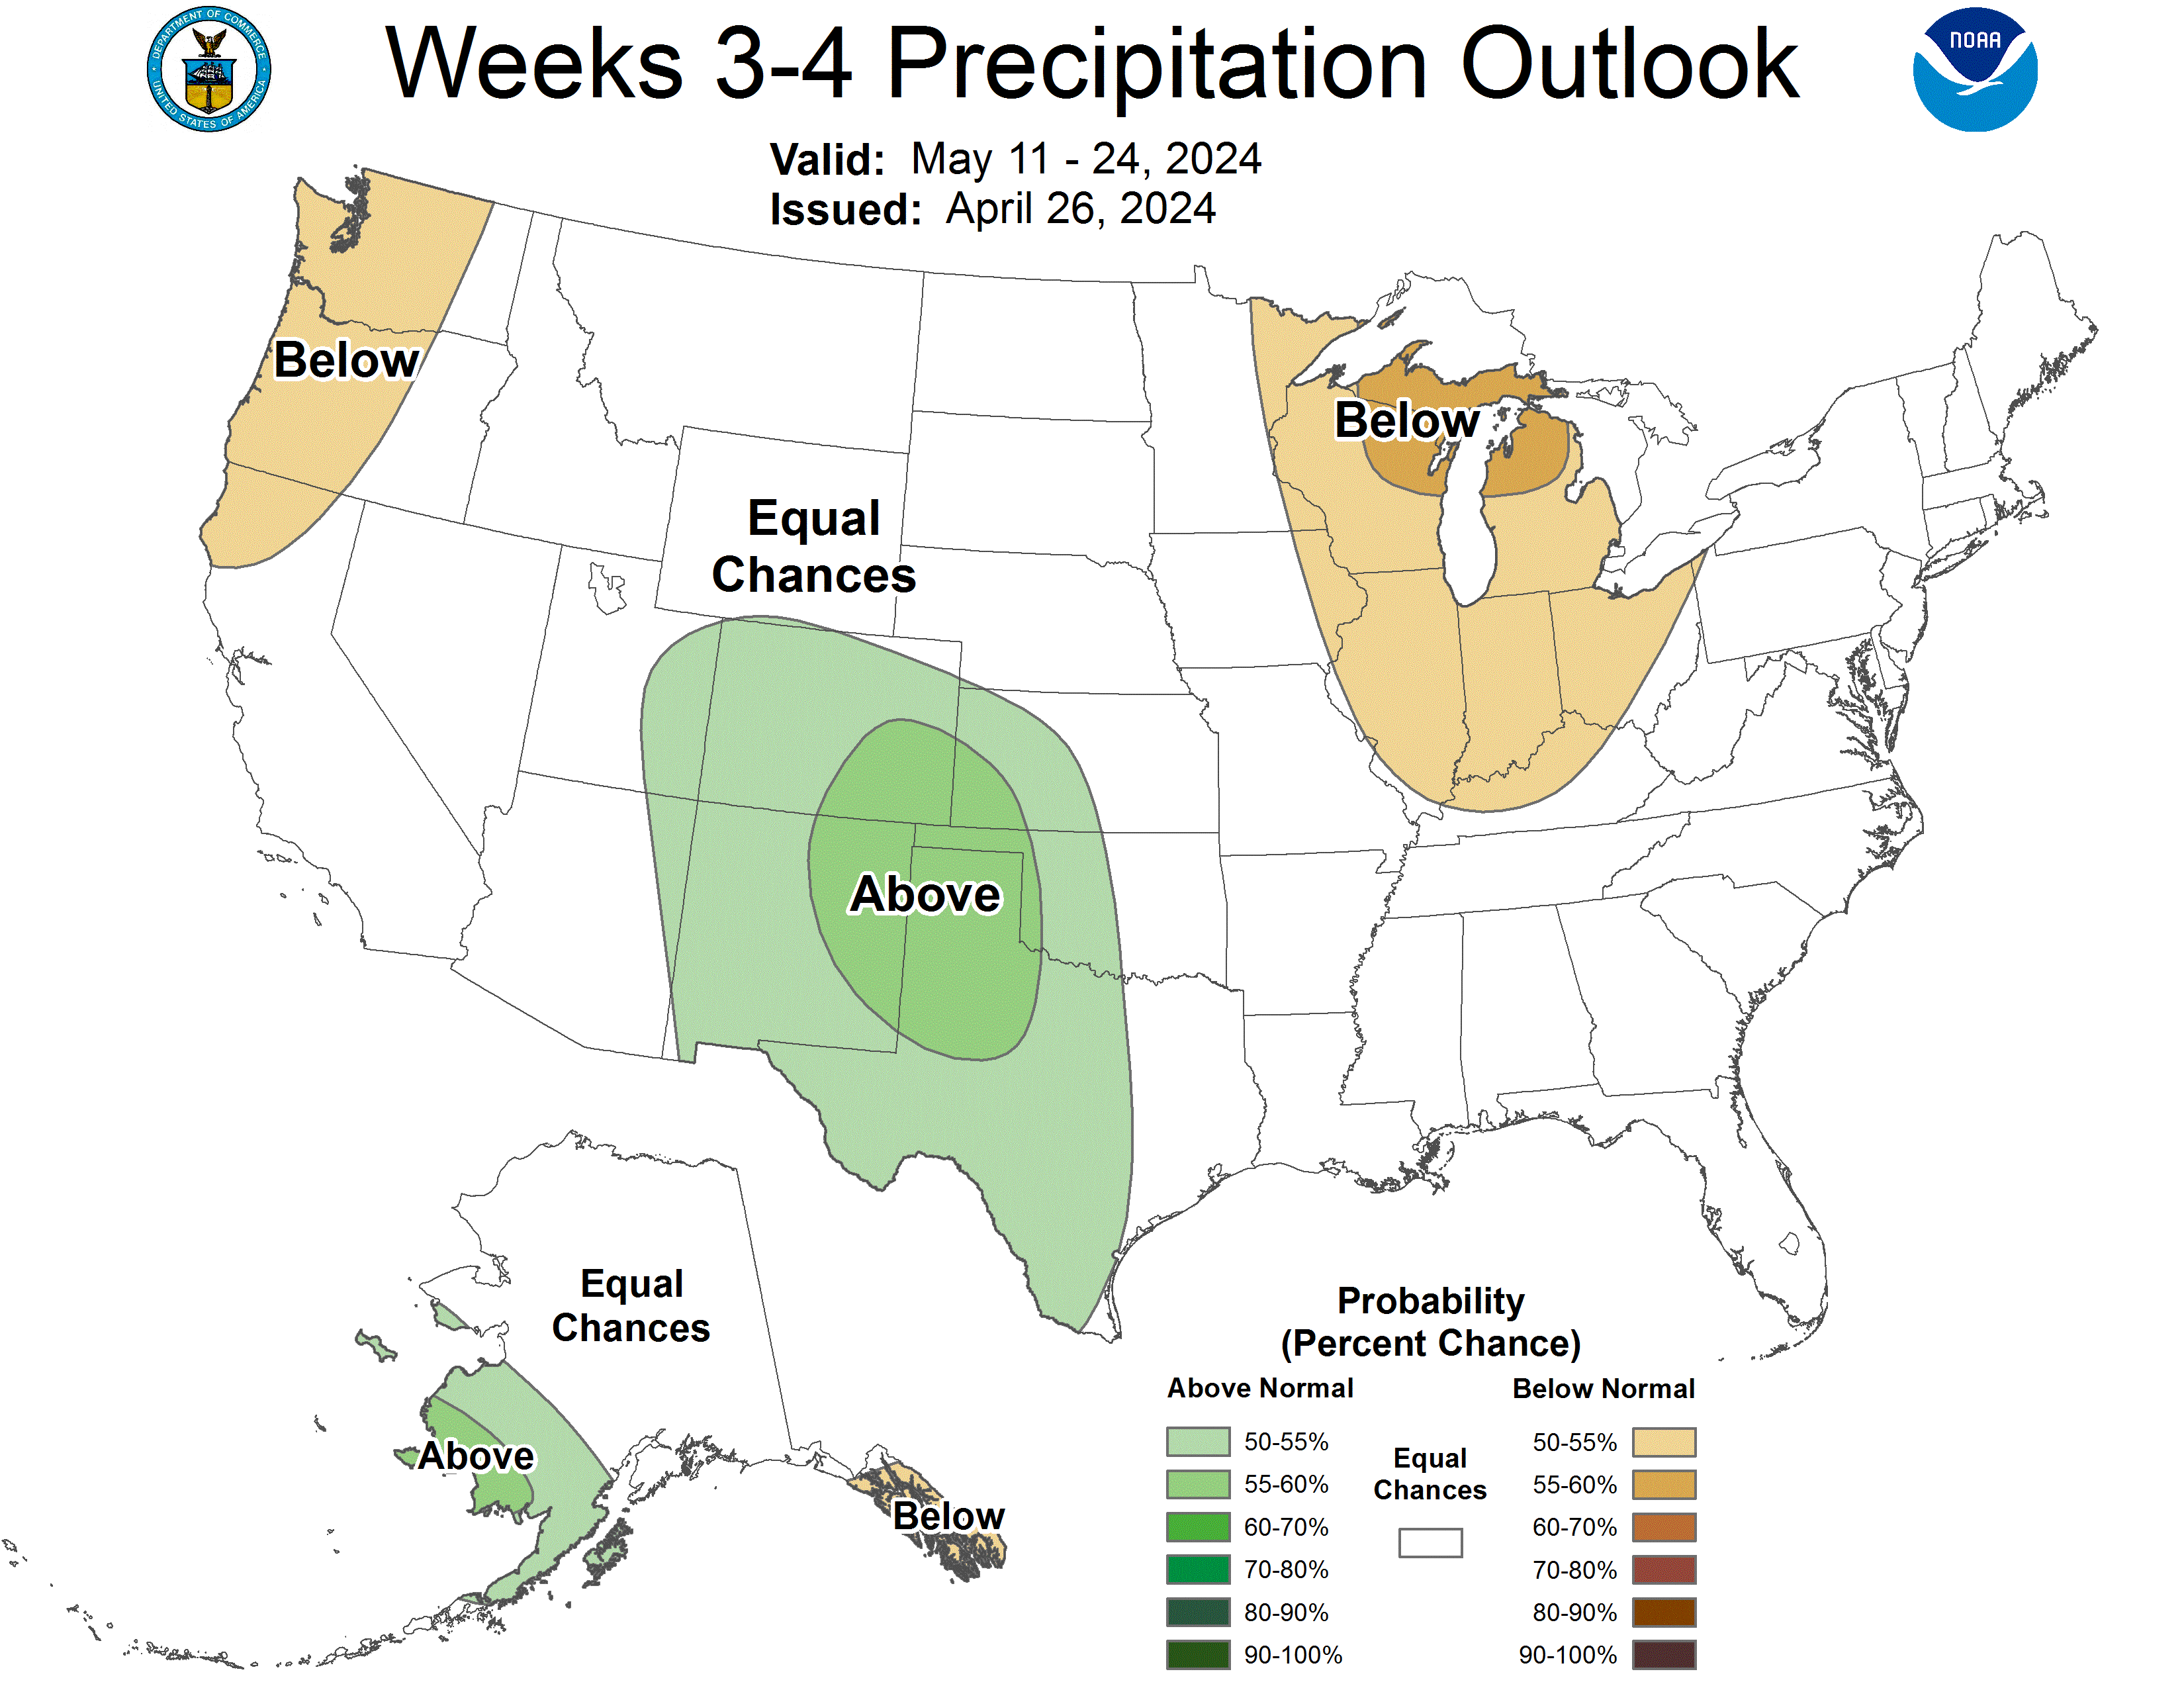
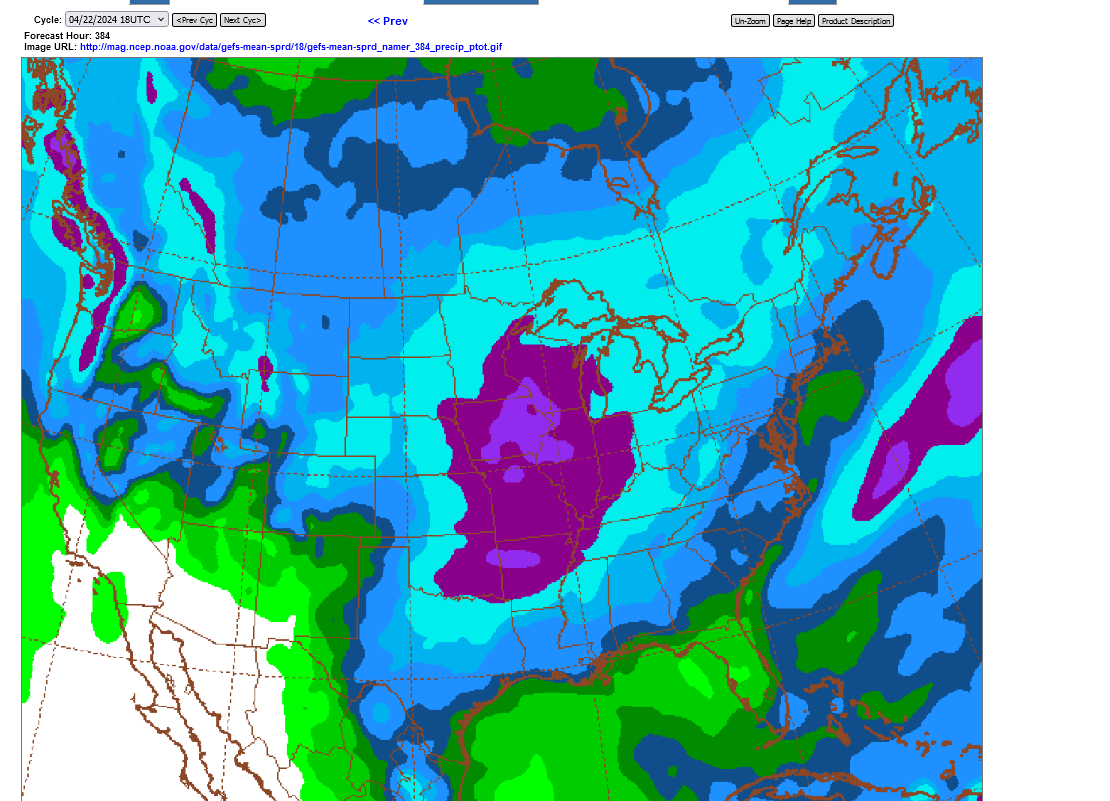
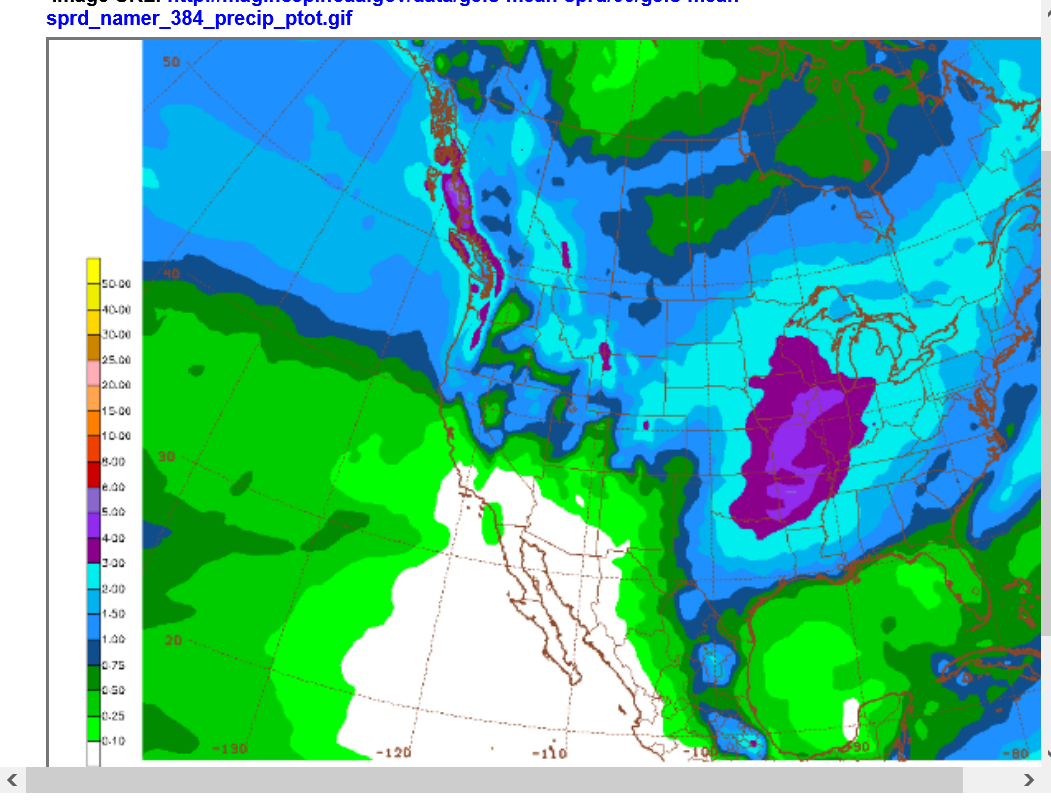
The 384 hour forecast from the just updated 18z GEFS model has a great deal of rain in it for the entire Midwest, extending back into much of KS.
This is BEARISH weather for wheat and a potentially limiting factor on strength. Other factors, including the 5% drop in the crop rating are important too.
https://mag.ncep.noaa.gov/Image.php
++++++++++++++++++++++++
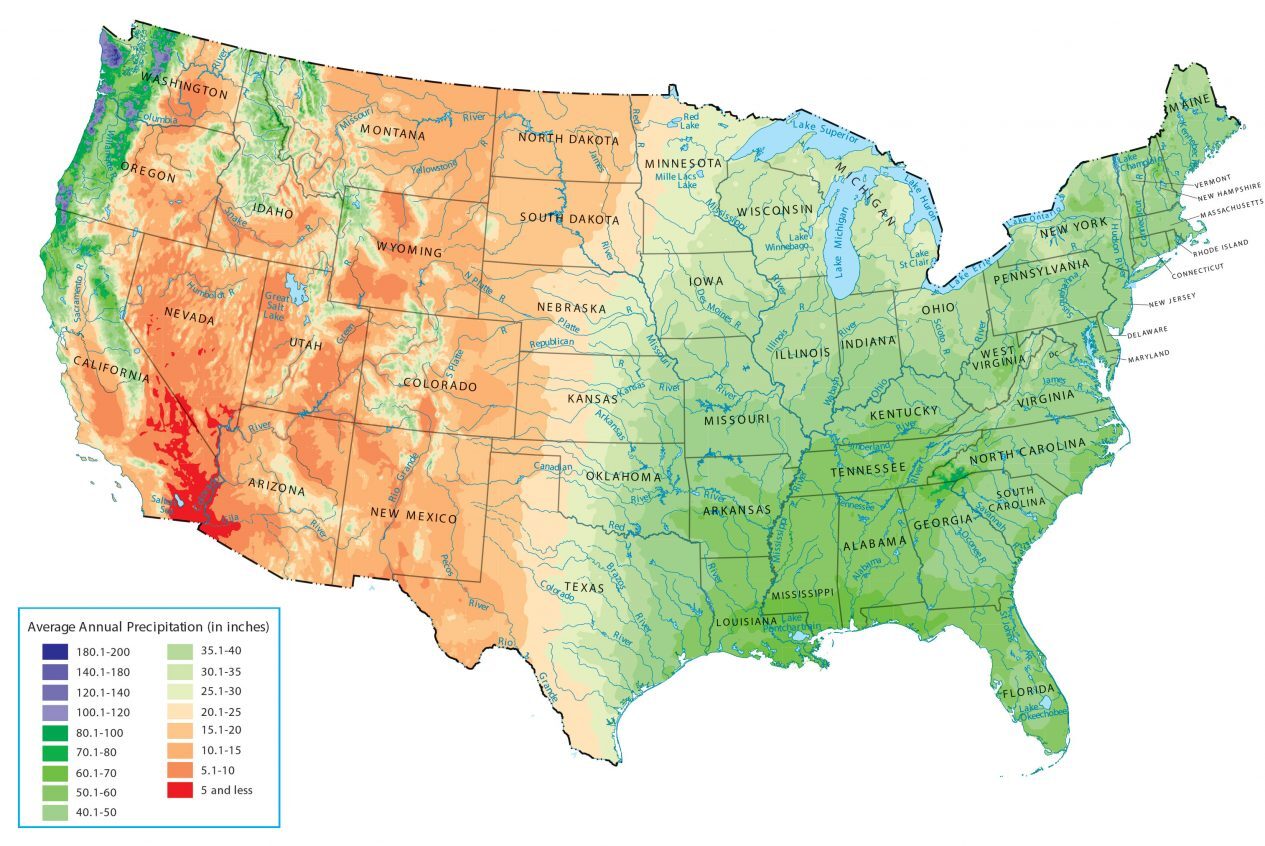
Western KS is always a tough place to make rain at!
Annual average precip map for the United States:
https://gisgeography.com/us-precipitation-map/

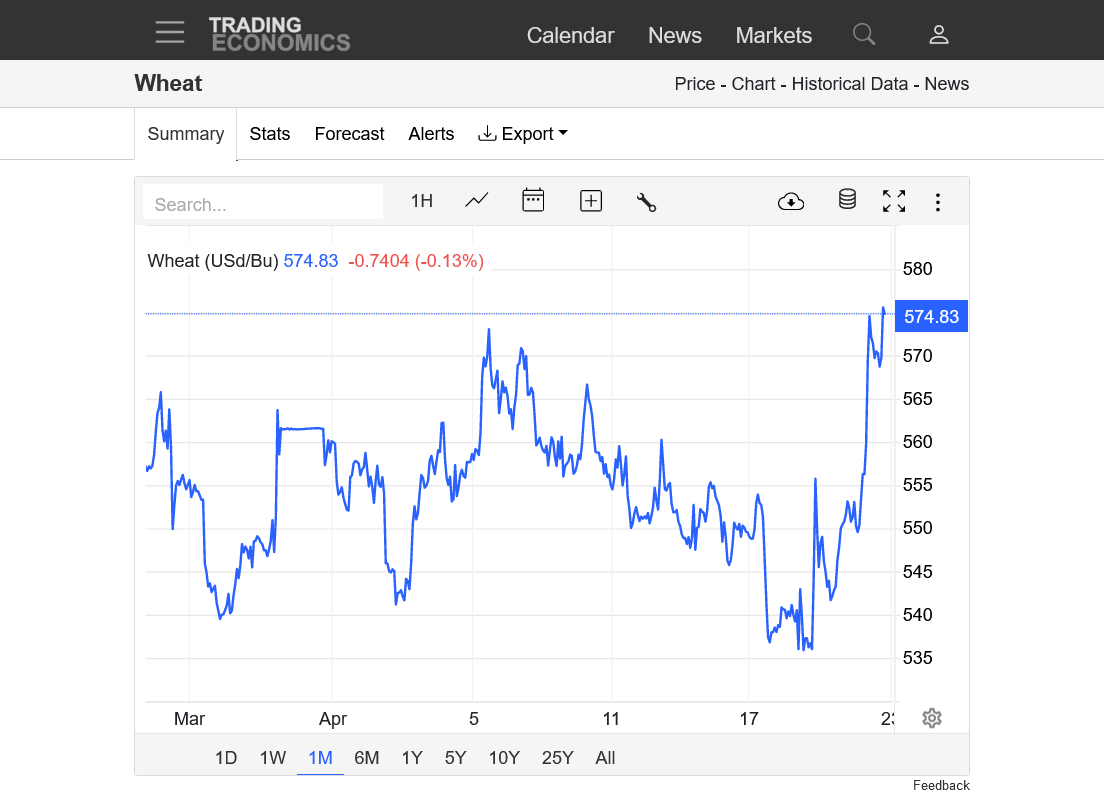
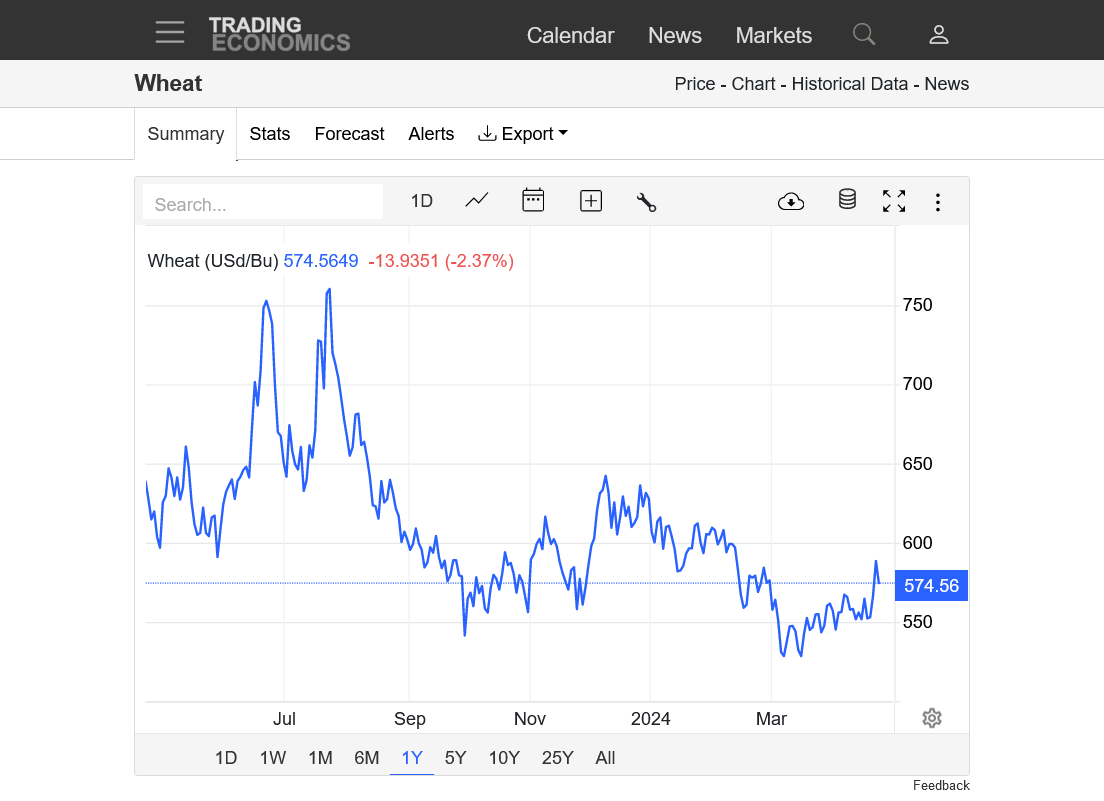
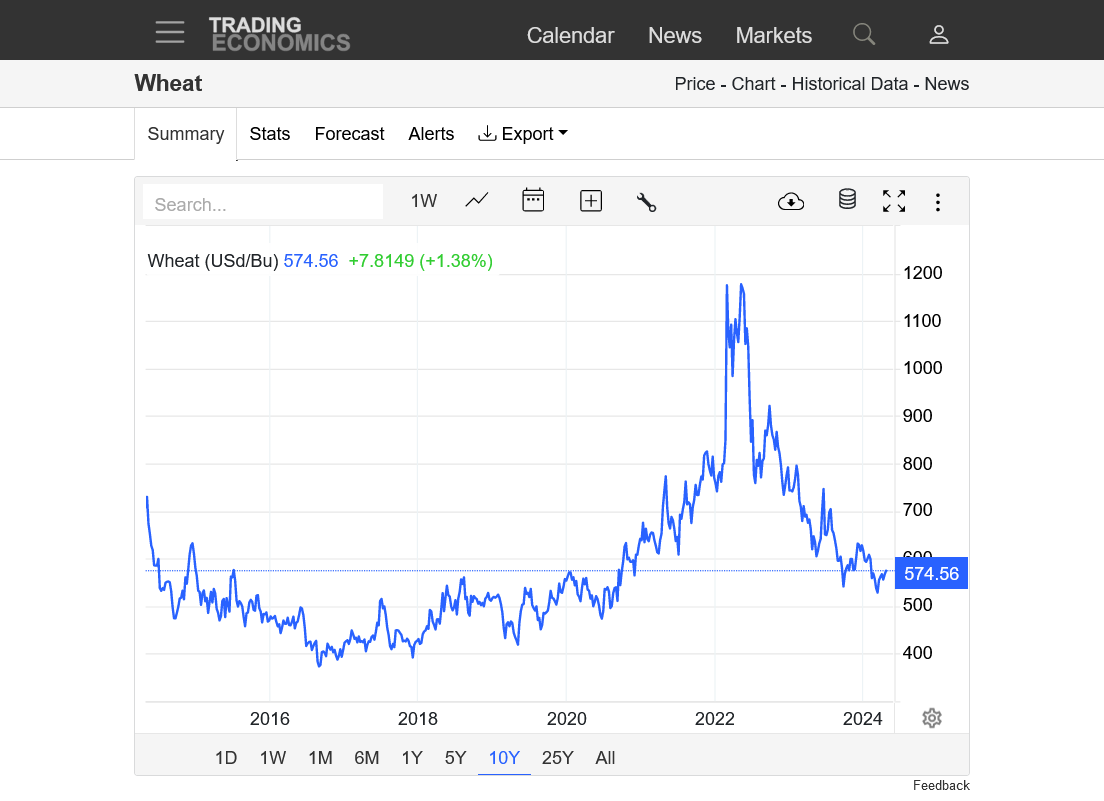
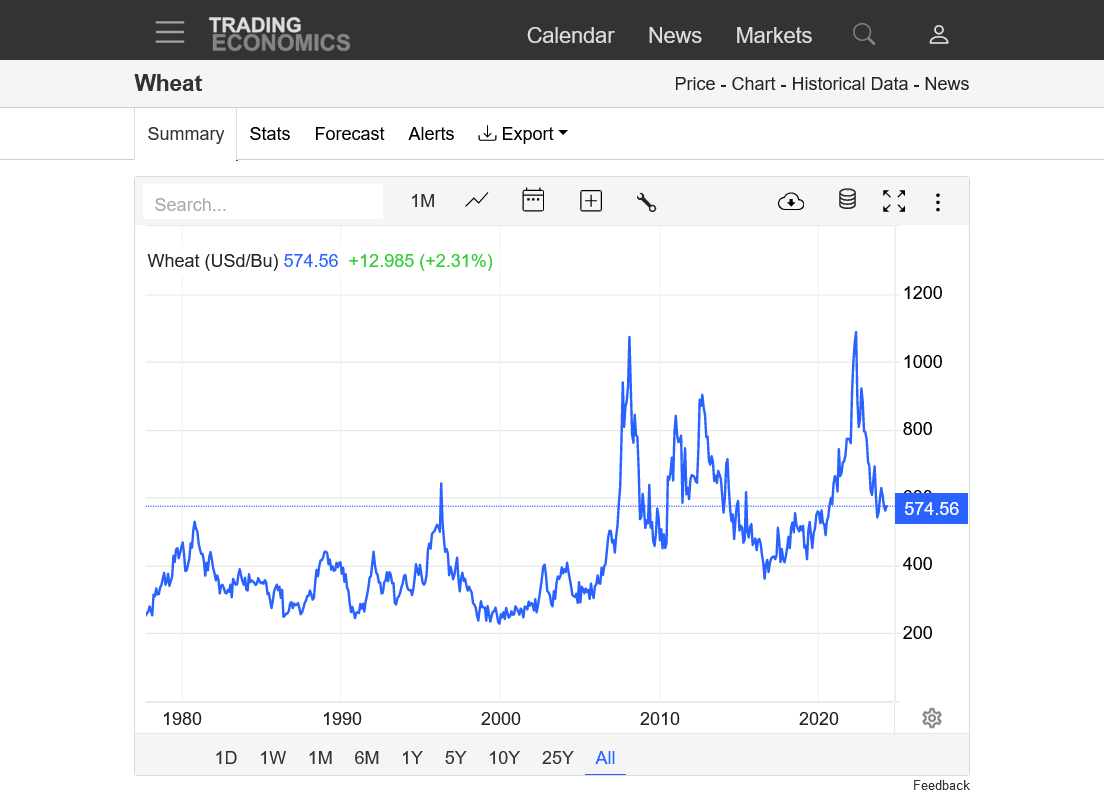
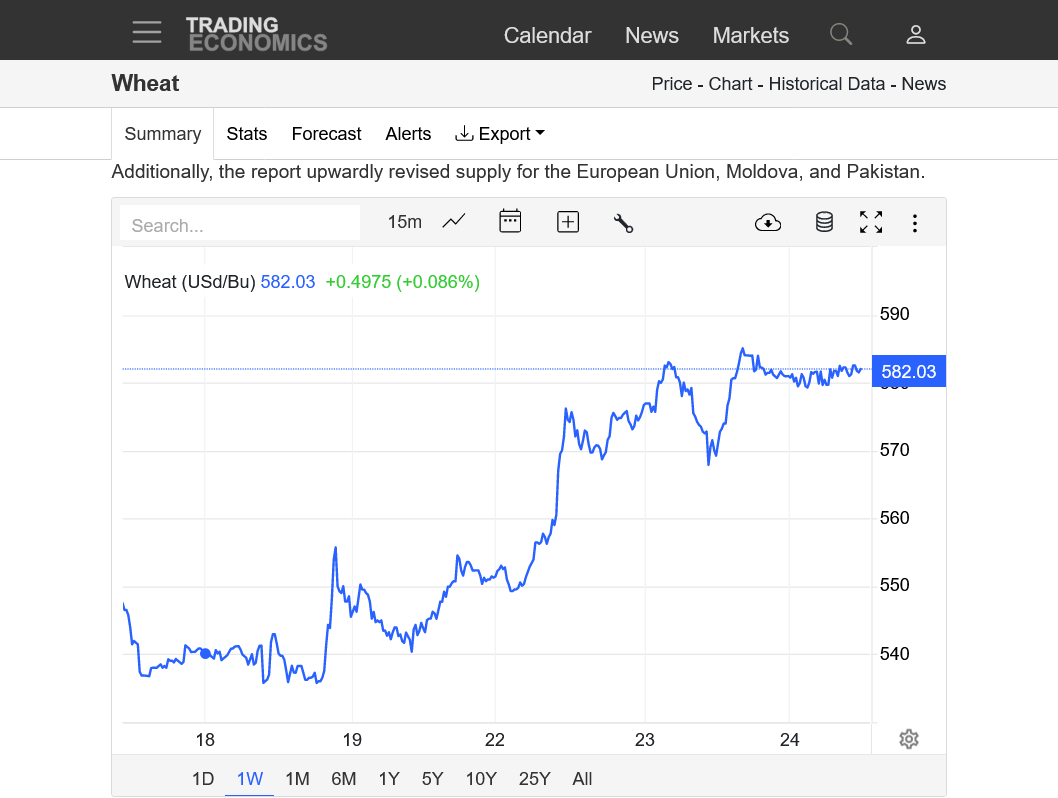
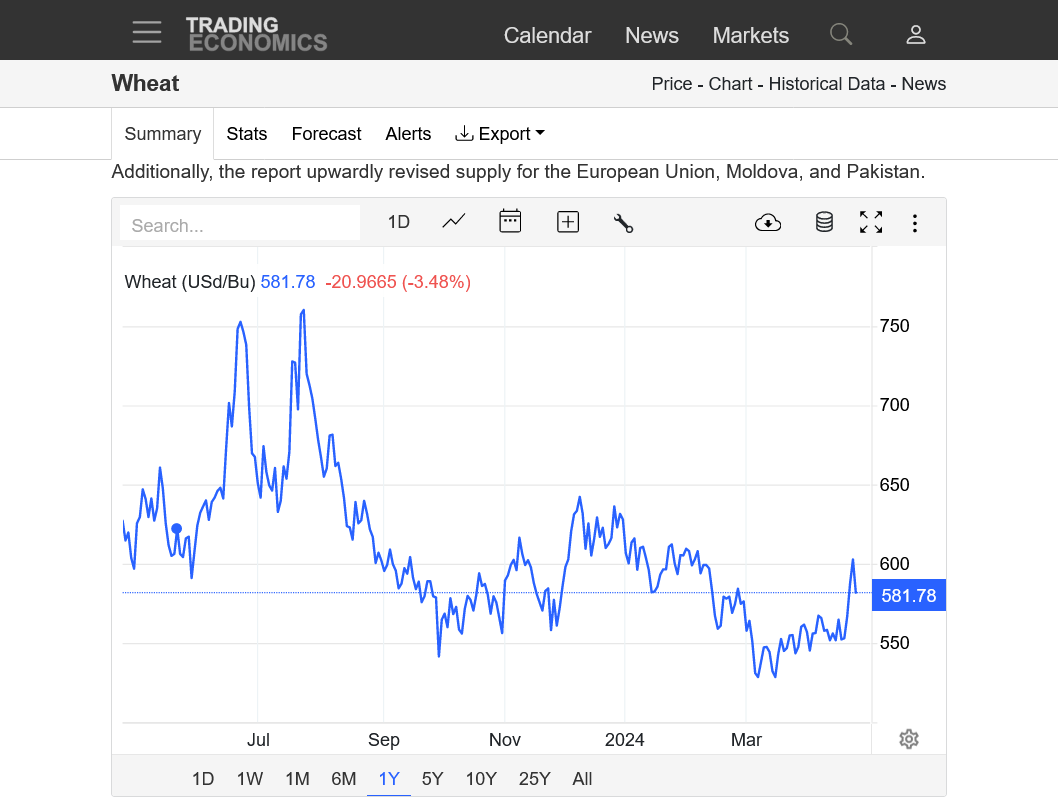
Wheat price:
1. 1 week
2. 1 month
3. 1 year
4. 10 years
5. 50 years
https://tradingeconomics.com/commodity/wheat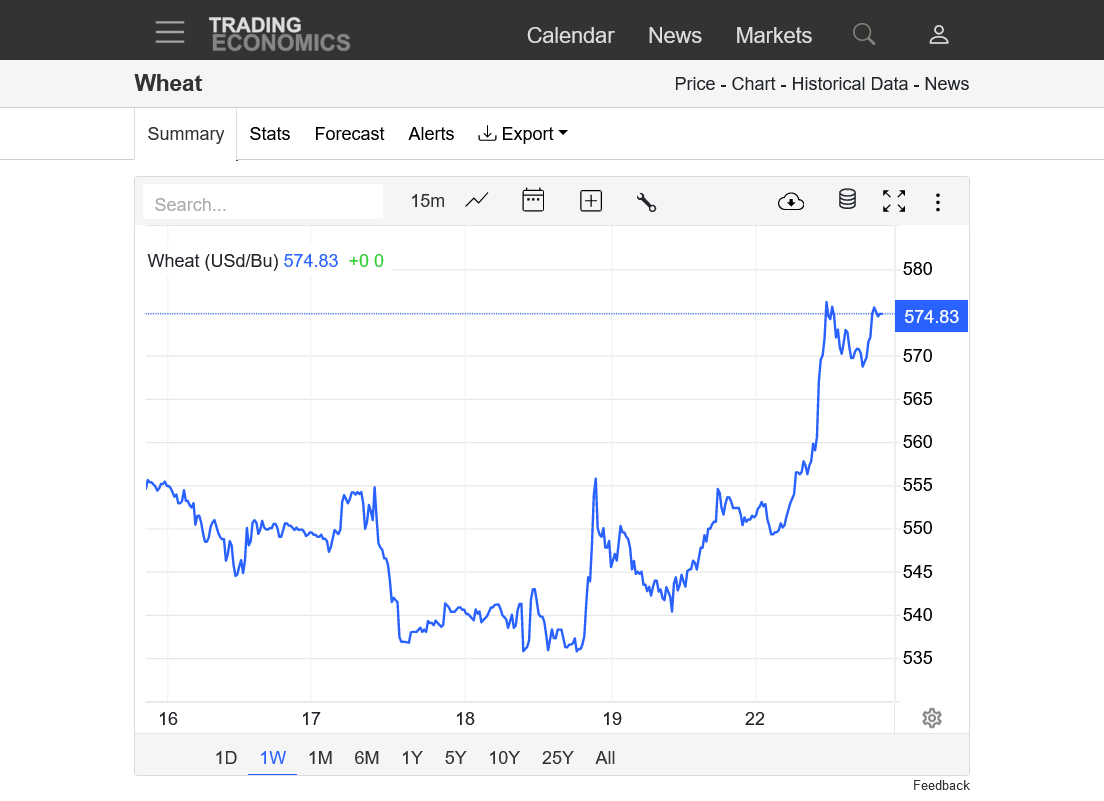
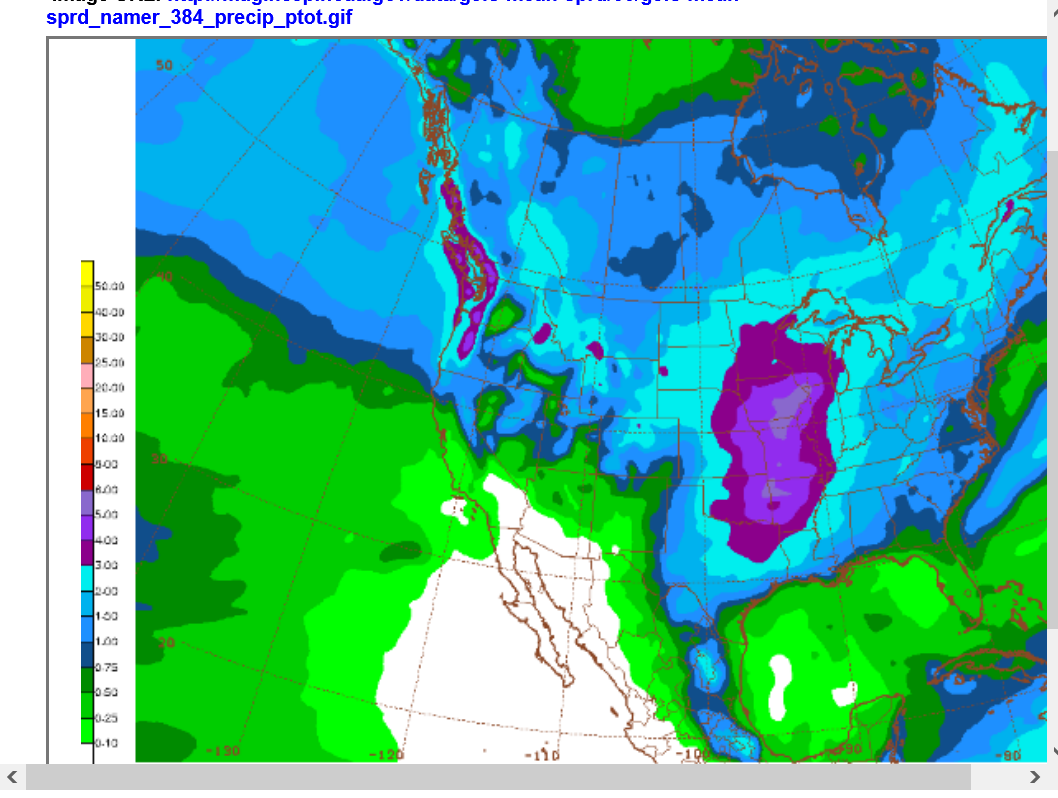
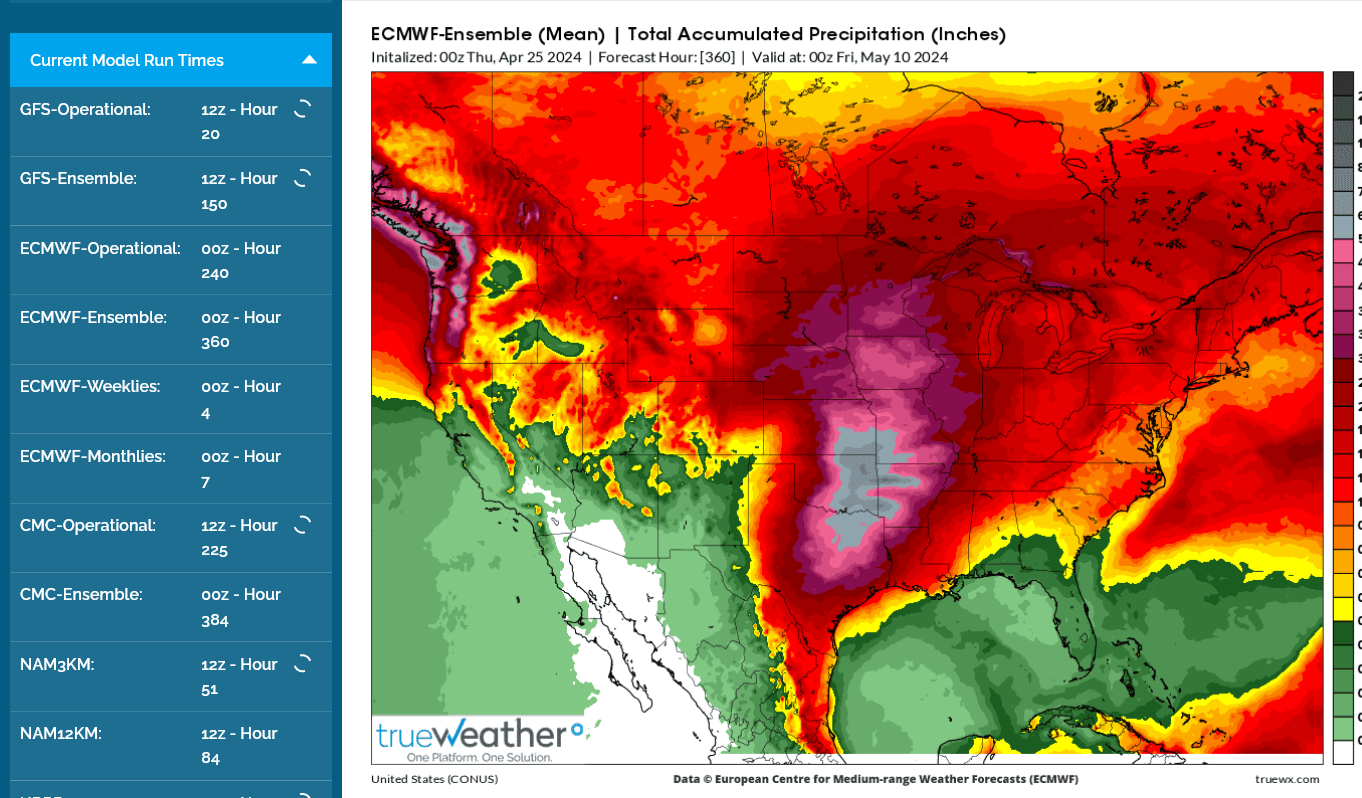
Just out 0z GEFS total rains thru 384 hours.
About the same vs the previous run.
The bright blue is 2+" The outside purple is 3+". Inside that is 4+" in the Central Belt to Southern Belt.
Wheat is holding on to recent gains in the last week:
https://tradingeconomics.com/commodity/wheat
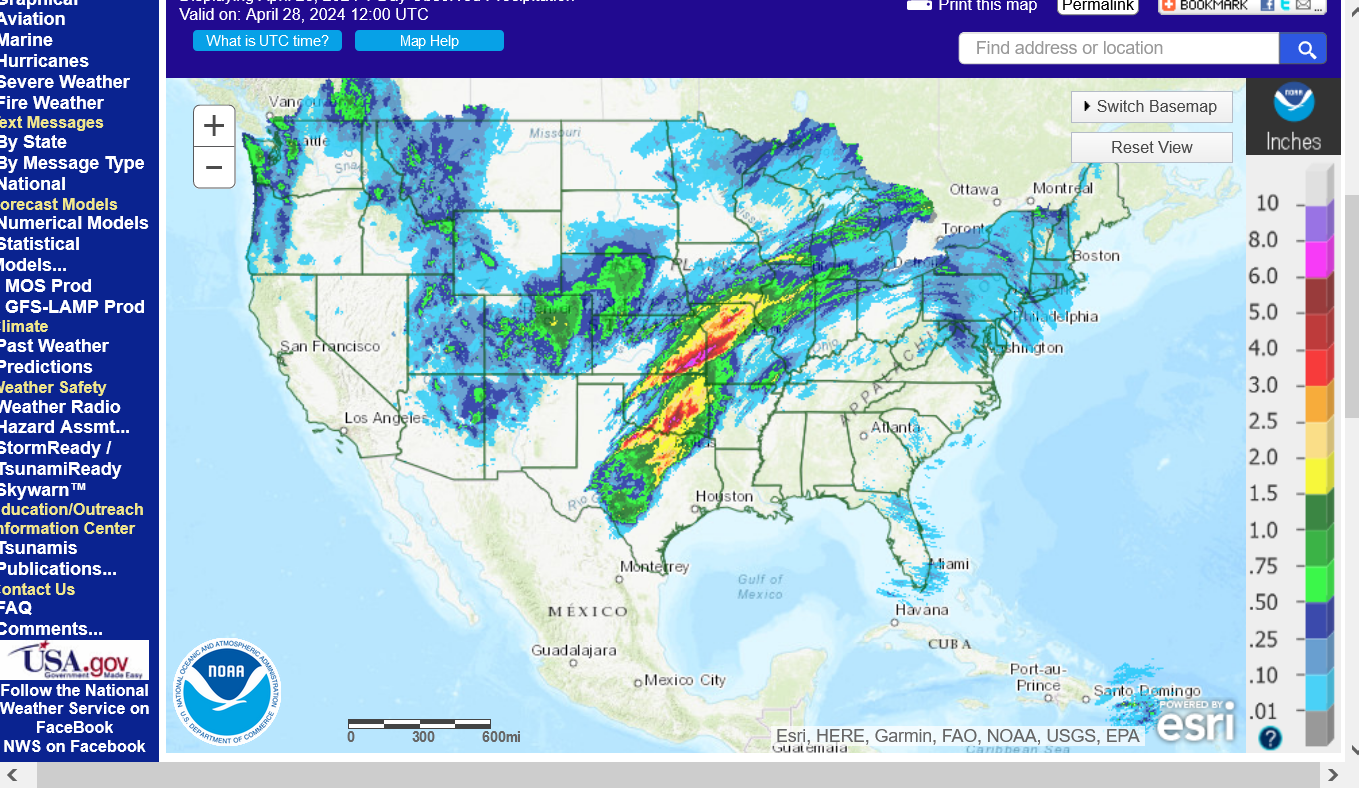
There a massive amount of rain on the way! More in KS than forecast for earlier this week which is bearish weather for wheat.
5 inches in the epicenter. This is going to slow down planting but be good to boost soil moisture for the upcoming growing season.
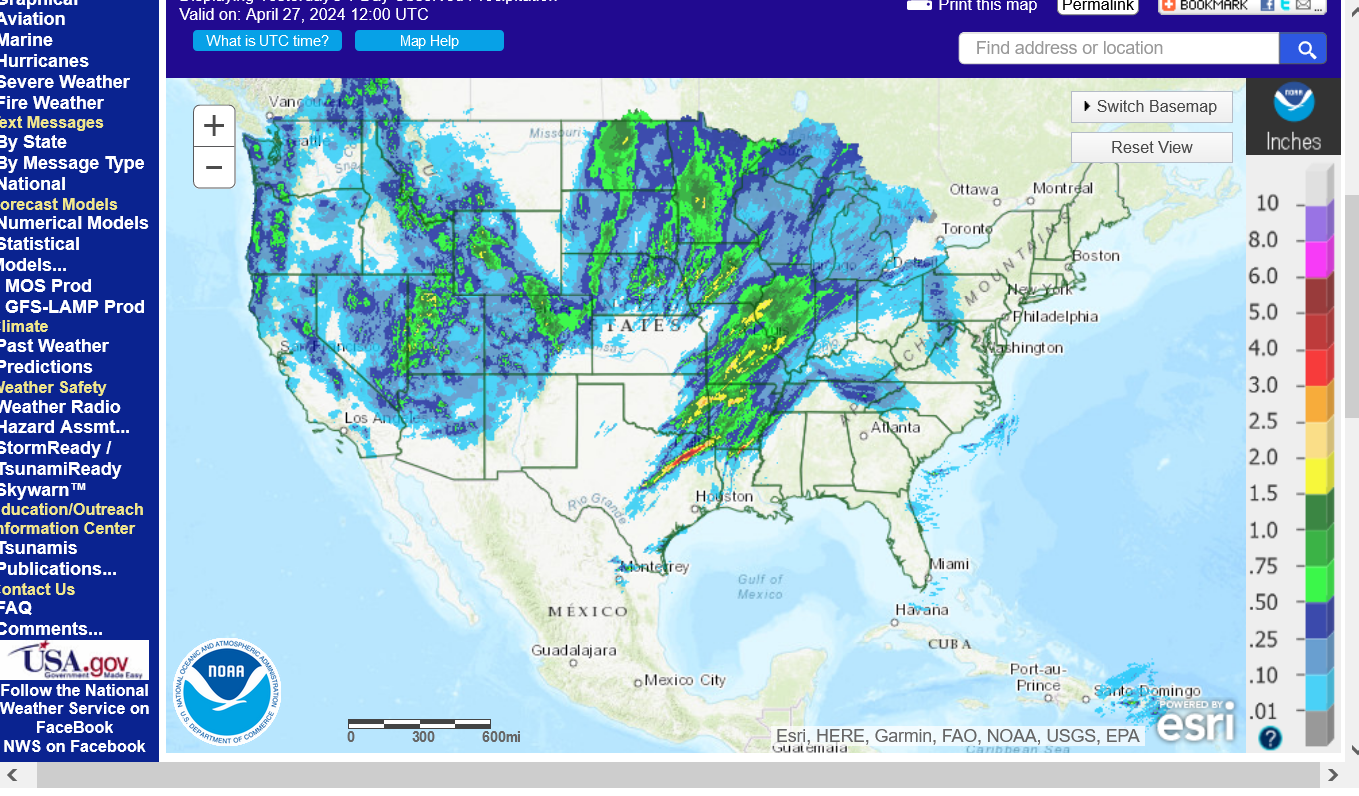
Earlier on Tuesday
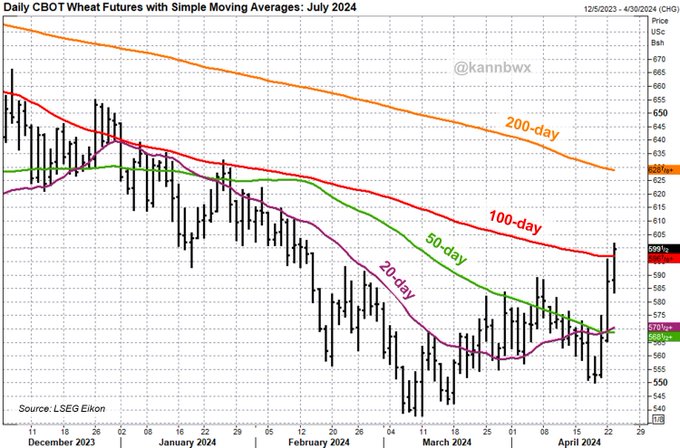
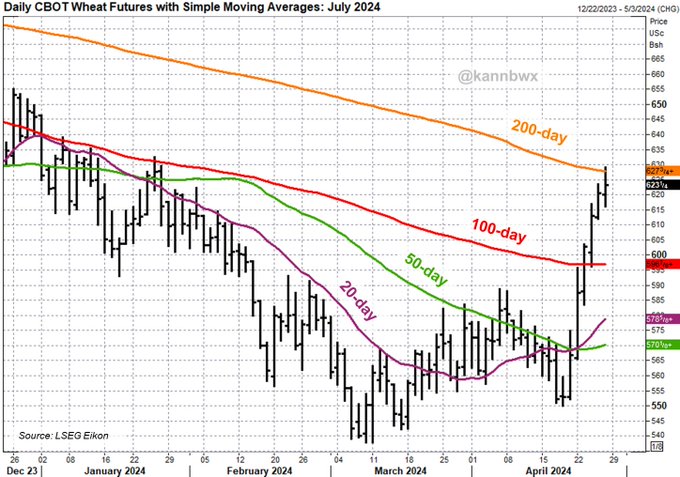
April 23: CBOT July #wheat futures extend gains on US crop health decline and general crop concerns in the N Hem. July wheat topped the 100-day avg for the first time since Jan and is up 8+% in the last 3 sessions, biggest rally since July. First $6+/bu since early Feb, too.
This is ALOT of rain! Up to 6 inches the next 2 weeks based on this 6z run of the GEFS model around the eastern KS/OK, western MO/AR and vicinity.
I've been thinking that needed rains in that area are bearish for wheat but this is bullish from excessive rain?
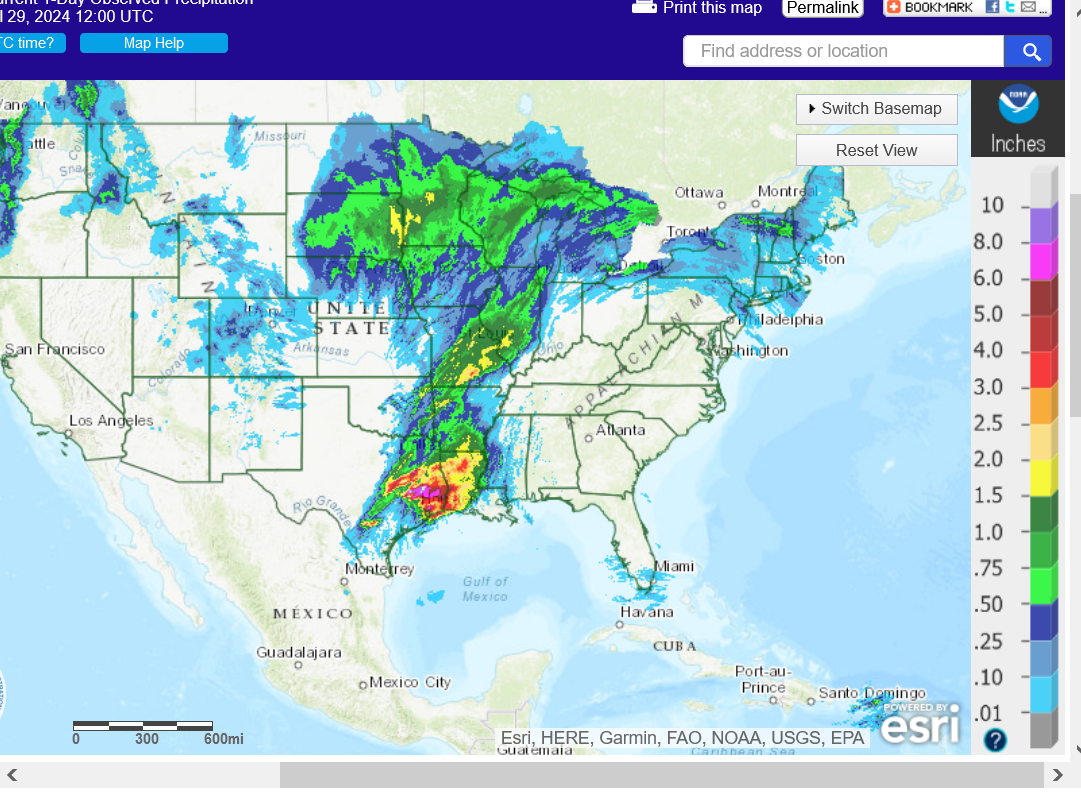
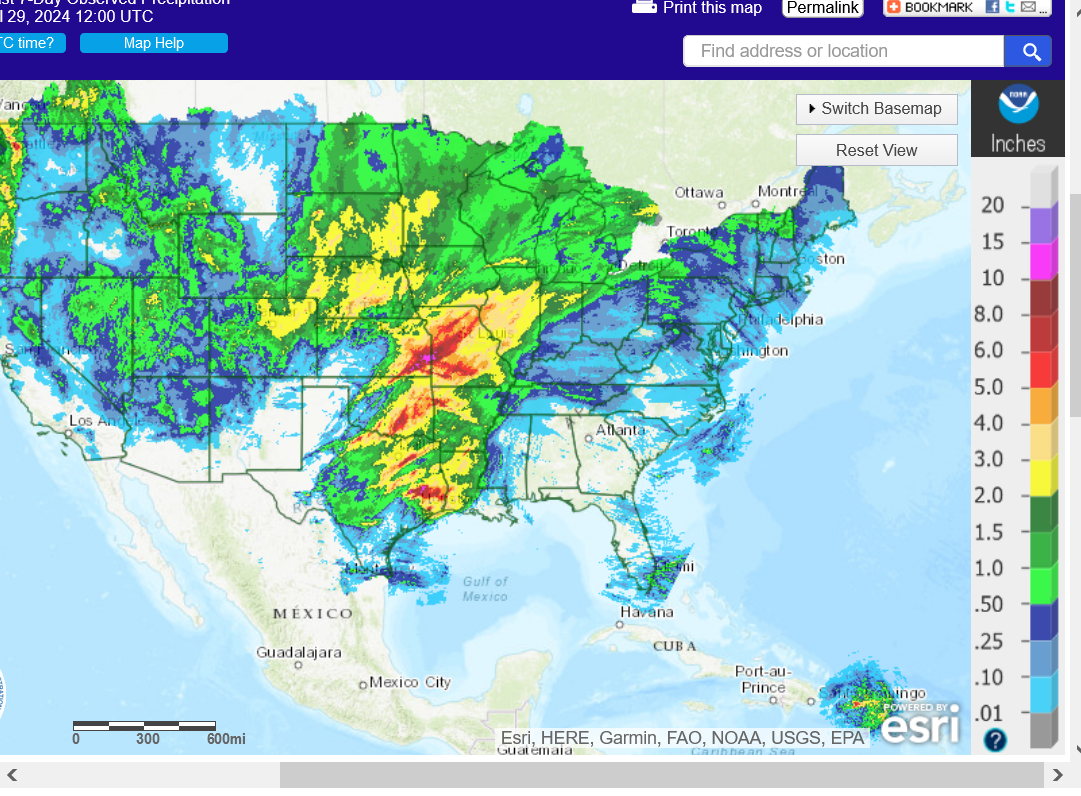
7 Day Total precipitation below:
http://www.wpc.ncep.noaa.govcdx /qpf/p168i.gif?1530796126

Excessive rain threat.
https://www.wpc.ncep.noaa.gov/qpf/excess_rain.shtml
Current Day 1 Forecast
Day 1 Threat Area in Text Format
Current Day 2 Forecast |
Day 3 outlook

+++++++++++++
https://www.marketforum.com/forum/topic/83844/#83853
https://www.cpc.ncep.noaa.gov/products/Soilmst_Monitoring/US/Soilmst/Soilmst.shtml#
![]()
April 23 Drought Monitor. Good bye drought in KS/MO/OK/AR.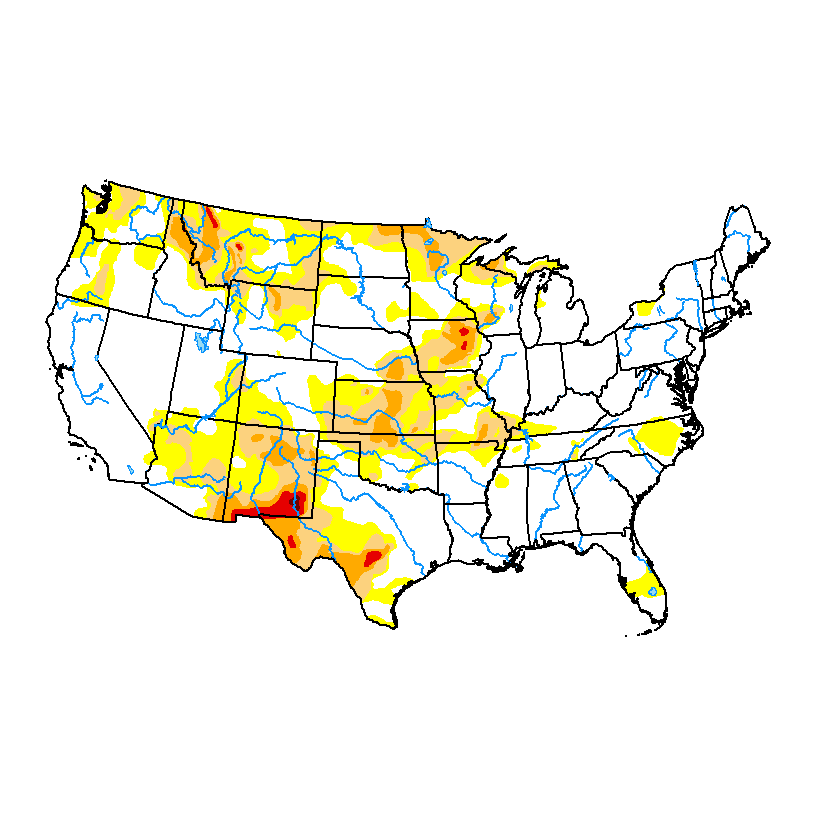 ++++++++++
The overnight 0z European model had 7+ inches in the wettest places the next 14 days:
++++++++++++
·
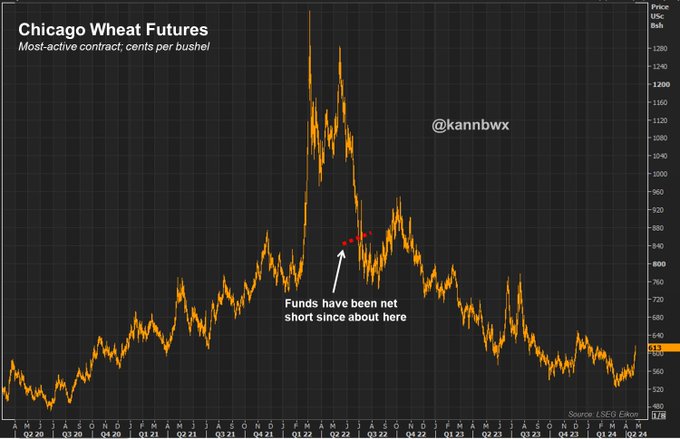
Putting recent CBOT #wheat strength in context with the last 4 years. Back in March, futures dipped to the lowest levels since August 2020. They had made all-time highs in March 2022. Large speculators have been short wheat since July 2022, unfazed by the mid-2023 rallies.
We had some very heavy rains the last couple of days.
Rains on Saturday/Saturday Night:
Rain totals Friday/Friday Night:
% of average rain the past week/7 days. Southwestern half of KS missed!
Still some heavy rains the next week or so(not excessive) then the pattern will become LESS wet.
7 Day Total precipitation below:
http://www.wpc.ncep.noaa.govcdx /qpf/p168i.gif?1530796126
All the latest weather here: