IMO, NG, when following wx, may finally be paying as much attention to CDD changes as it is to HDD changes. I think that is because we are finally far enough out for CDD gains to at least compensate for HDD losses in the two week model runs. Actually, so far today at 12Z, I'm seeing the 12Z GFS suite with CDD gains over 0Z that are larger than HDD losses over the full 2 weeks overall. In fact, on the last 2 op GFS runs, the overall two weeks have more CDD than HDD. Looking more closely, every day of the 12Z GFS (whose cold bias has been very small) has more CDD than HDD except 5/9. Even on the much more cold biased 12Z GEFS, 5/2, 5/7, 5/8, and all days 5/10+ have more CDD than HDD.
I agree Larry. Great points.
I posted on this topic ---degree days--yesterday and will update the ng stuff later today. Thanks for getting the discussion going .
Previous natural gas discussions:
Previous discussions on natural gas here:
https://www.marketforum.com/forum/topic/28351/
https://www.marketforum.com/forum/topic/27780/
https://www.marketforum.com/forum/topic/27305/
https://www.marketforum.com/forum/topic/26861/
https://www.marketforum.com/forum/topic/26506/
https://www.marketforum.com/forum/topic/26105/
https://www.marketforum.com/forum/topic/25678/
https://www.marketforum.com/forum/topic/25189/
https://www.marketforum.com/forum/topic/24662/
Here's the weather that affects the natural gas market. Cold causes an increase in residential heating. Hot causes an increase in residential cooling. Around May 8th, we make the turn in CDD's, seasonally passing up HDD's.......and the current 2 week forecast goes out beyond that right now.
Monday Weather:
https://www.marketforum.com/forum/topic/28830/
Tuesday Weather:
https://www.marketforum.com/forum/topic/28914/
Wednesday Weather:
https://www.marketforum.com/forum/topic/28994/
Thursday Weather:
https://www.marketforum.com/forum/topic/29069/
Friday Weather:
https://www.marketforum.com/forum/topic/29198/
Saturday Weather:
https://www.marketforum.com/forum/topic/29296/
Weather Sunday:
https://www.marketforum.com/forum/topic/29385/
For the past 7 months, the amount of heating demand from cold weather in the high population centers of the Midwest and East, historically-seasonally are the most important factor in price determination for natural gas.
As the weather warms up gradually in the Spring, the heating degree days(HDD’s) go down and CDD’s go up.
At some point they intersect and CDD’s pass up HDD’s for good..........until October. That point is around May 8th on average.
So starting in the 2nd full week of May, population weighted CDD’s because of hot weather are greater and become more and more important until they peak in mid/late July. After that, they are still very important but less important even as they start falling because the biggest change in demand for natural is always the result of big changes in temperatures which cause a big change in residential cooling or heating needs.
Despite CDD’s being a big deal in the Summer, especially during widespread major heat waves, they pale in the power to move the market compared to HDD’s in the Winter.
This is one of the reasons that we usually have injections that add to supply, sometimes big ones (+100+) during the Summer and withdrawals, sometimes huge ones during the Winter (-200+).
So temperature forecasts are much more important during the Winter but we have started the cooling degree season.
Working gas in storage was 1,339 Bcf as of Friday, April 19, 2019, according to EIA estimates. This represents a net increase of 92 Bcf from the previous week. Stocks were 55 Bcf higher than last year at this time and 369 Bcf below the five-year average of 1,708 Bcf. At 1,339 Bcf, total working gas is within the five-year historical range.
For information on sampling error in this report, see Estimated Measures of Sampling Variability table below.

Last Thursday: Natural Gas Storage Stocks Move Above Year-Ago Levels After EIA Reports 92 Bcf Build
Last 5 EIA reports:
https://www.investing.com/economic-calendar/natural-gas-storage-386
| Release Date | Time | Actual | Forecast | Previous | |
|---|---|---|---|---|---|
| May 02, 2019 | 10:30 | 92B | |||
| Apr 25, 2019 | 10:30 | 92B | 91B | 92B | |
| Apr 18, 2019 | 10:30 | 92B | 87B | 25B | |
| Apr 11, 2019 | 10:30 | 25B | 29B | 23B | |
| Apr 04, 2019 | 10:30 | 23B | 10B | -36B | |
| Mar 28, 2019 | 10:30 | -36B | -40B |
| Working gas in underground storage, Lower 48 states Summary textCSVJSN | |||||||||||||||||||||||||
|---|---|---|---|---|---|---|---|---|---|---|---|---|---|---|---|---|---|---|---|---|---|---|---|---|---|
| Historical Comparisons | |||||||||||||||||||||||||
| Stocks billion cubic feet (Bcf) | Year ago (04/19/18) | 5-year average (2014-18) | |||||||||||||||||||||||
| Region | 04/19/19 | 04/12/19 | net change | implied flow | Bcf | % change | Bcf | % change | |||||||||||||||||
| East | 251 | 228 | 23 | 23 | 205 | 22.4 | 277 | -9.4 | |||||||||||||||||
| Midwest | 264 | 254 | 10 | 10 | 213 | 23.9 | 338 | -21.9 | |||||||||||||||||
| Mountain | 70 | 66 | 4 | 4 | 84 | -16.7 | 117 | -40.2 | |||||||||||||||||
| Pacific | 138 | 128 | 10 | 10 | 177 | -22.0 | 216 | -36.1 | |||||||||||||||||
| South Central | 616 | 571 | 45 | 45 | 604 | 2.0 | 761 | -19.1 | |||||||||||||||||
| Salt | 204 | 187 | 17 | 17 | 182 | 12.1 | 227 | -10.1 | |||||||||||||||||
| Nonsalt | 413 | 384 | 29 | 29 | 421 | -1.9 | 533 | -22.5 | |||||||||||||||||
| Total | 1,339 | 1,247 | 92 | 92 | 1,284 | 4.3 | 1,708 | -21.6 | |||||||||||||||||
Totals may not equal sum of components because of independent rounding. | |||||||||||||||||||||||||
Working gas in storage was 1,339 Bcf as of Friday, April 19, 2019, according to EIA estimates. This represents a net increase of 92 Bcf from the previous week. Stocks were 55 Bcf higher than last year at this time and 369 Bcf below the five-year average of 1,708 Bcf. At 1,339 Bcf, total working gas is within the five-year historical range.
hese were the temperatures for the 7 days ending the previous Friday that was used for last Thursdays report.
These were the temperatures for the 7 day period ending last Friday that will go into this Thursdays report.. Pretty mild/warm over the entire country, so another big injection.
The point of showing it is to show that natural gas has a strong historical tendency to go up after mid February.
The lows in Feb., WERE perfectly timed with a typical, end of Winter low, which is followed by increasing prices over 80% of the time into early Spring.
However, this year has been a noted exception/aberration. Fundamentals are pretty/very bearish........note the price has stayed fairly low even though storage was much less than the 5 year average.....because the market feels very comfortable...... and has been projecting additional storage gains from supplies gushing in.
These natural gas price charts aren't the greatest but they did show a likely seasonal, double bottom............which we violated with gusto last week as we spiked to new lows from huge storage injections ahead..
Record late season withdrawals last April......2018 have only made the big injections that much more bearish on the year to year comparisions. So we have experienced something that's extraordinarily rare in the month of April-new lows(maybe has happened only once during the last 2 decades).
NG 7 days
Natural gas 3 months below
https://seekingalpha.com/article/4254210-april-2019-natural-gas-demand-overview-forecast
Summary
Natural gas consumption for January was the highest level for any month since 2001.
The average daily rate of dry natural gas production for January was the second highest for any month since EIA began tracking monthly dry natural gas production in 1973.
Under the latest weather forecasts, we project that natural gas consumption will decline in annual terms by around 1.70% (on average) over the next three months.
We have been bearish on natural gas and have been selling the rallies for the past month or so. However, we are not adding to our short exposure anymore.
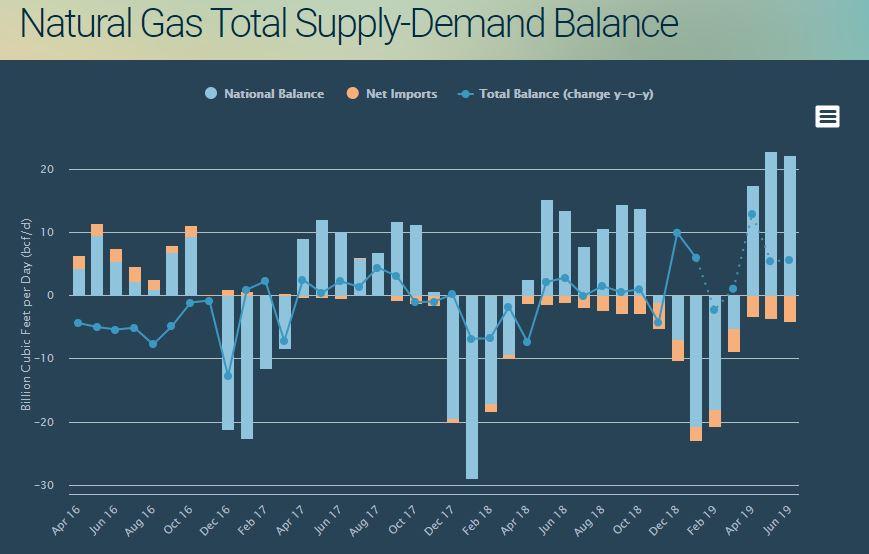
We believe that over the next three months, total supply will be growing faster (on an annualized basis) than total demand ensuring that total supply-demand balance will be looser relative to 2018.
Source: EIA, Bluegold Research estimates and calculations
This January, pipeline and LNG exports combined totaled 362.7 bcf or 11.7 bcf per day. The volume of total exports is now equivalent to 10.7% of national natural gas consumption on a monthly basis. On a 12-month average basis, exports now equate to around 10.90% of total demand - a new all-time record - and its share in the aggregate demand structure has almost doubled over the past three years.
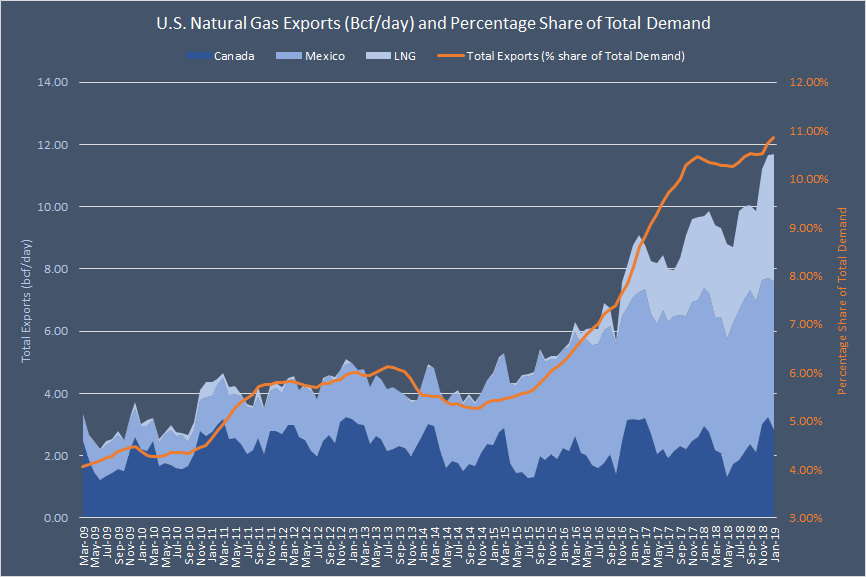
Exports remain the fastest-growing source of demand for American natural gas. While total demand (12-month average) increased by 20.2% over the past five years (from January 2014 to January 2019), exports more than doubled over the same period. In fact, exports have already surpassed the "Other" category in the overall demand mix and are now more significant in weight than U.S. commercial users (see the chart below). Next year, the share of exports will overtake residential consumption (on a 12-month average basis).

Source: EIA, Bluegold Research estimates and calculations
From Natural Gas Intelligence from earlier today:
Natural Gas Futures Called Slightly Higher After ‘Subtle’ Forecast Changes Overnight
8:50 AM
Natural Gas Intelligence after the close Tuesday:
Natural Gas Futures Slip as Weather Data Still Unclear for May; Cash Up on Pipe Work
With the strongest demand on tap for this week and the potential for moderating temperatures in May, traders quickly reversed the previous day’s gains and sent natural gas futures slightly lower on Tuesday. The June Nymex gas contract slipped 1.8 cents to $2.575, and July fell 2.3 cents to $2.617.
0Z 5/1 GEFS 2 week DD vs 0Z 4/30 GEFS for same period: HDD +5.5; CDD -4.5; Net gain of near 2 DD
0Z 5/1 EPS 2 week DD vs 0Z 4/30 EPS for same period: HDD flat; CDD -3.5; Net loss of near 3.5 DD
Average of these two 0Z models: HDD increased 3 while CDD dropped 4. So, overall neutral.
NG was up 4 cents at the "pit" open of 8 AM CDT. Per DJ news, "Natural gas prices increased on Wednesday as weather forecasts indicated an increase in both heating and cooling demand throughout the U.S."
So, the consensus of forecasts from major providers apparently were more bullish than the neutral of the models shown above. One thing is pretty clear: CDD changes have not ruled as regards today's trading. If any changes ruled, it was HDD rather than CDD. Or perhaps wx changes simply haven't dominated today's trading as that happens on some days, especially during shoulder/low demand periods.
Glad to see your comment Larry as I was perplexed on what might be causing the move and didn't see any weather.
Wed close:
Natural Gas Futures Spring to Life Despite Calls for Large EIA Build
Thursday morning:
Market Bracing for Triple-Digit EIA Build as June Natural Gas Called Lower
8:50 AM
With a potentially plump storage injection in the offing from this week’s Energy Information Administration (EIA) data, natural gas futures were trading lower early Thursday, eating into gains from the previous session. The June Nymex futures contract was off 2.2 cents to $2.598/MMBtu shortly after 8:30 a.m. ET.
WOW, the injection was huge at +123!!! NGI: Natural Gas Futures Hit Reverse as Triple-Digit EIA Build Tops Consensus
| Working gas in underground storage, Lower 48 states Summary text CSV JSN | |||||||||||||||||||||||||
|---|---|---|---|---|---|---|---|---|---|---|---|---|---|---|---|---|---|---|---|---|---|---|---|---|---|
| Historical Comparisons | |||||||||||||||||||||||||
| Stocks billion cubic feet (Bcf) | Year ago (04/26/18) | 5-year average (2014-18) | |||||||||||||||||||||||
| Region | 04/26/19 | 04/19/19 | net change | implied flow | Bcf | % change | Bcf | % change | |||||||||||||||||
| East | 279 | 251 | 28 | 28 | 220 | 26.8 | 296 | -5.7 | |||||||||||||||||
| Midwest | 290 | 264 | 26 | 26 | 220 | 31.8 | 351 | -17.4 | |||||||||||||||||
| Mountain | 75 | 70 | 5 | 5 | 86 | -12.8 | 119 | -37.0 | |||||||||||||||||
| Pacific | 152 | 138 | 14 | 14 | 186 | -18.3 | 223 | -31.8 | |||||||||||||||||
| South Central | 666 | 616 | 50 | 50 | 623 | 6.9 | 788 | -15.5 | |||||||||||||||||
| Salt | 224 | 204 | 20 | 20 | 189 | 18.5 | 238 | -5.9 | |||||||||||||||||
| Nonsalt | 442 | 413 | 29 | 29 | 434 | 1.8 | 550 | -19.6 | |||||||||||||||||
| Total | 1,462 | 1,339 | 123 | 123 | 1,334 | 9.6 | 1,778 | -17.8 | |||||||||||||||||
https://www.investing.com/economic-calendar/natural-gas-storage-386
Latest Release May 02, 2019 Actual123B Previous 92B
| Release Date | Time | Actual | Forecast | Previous | |
|---|---|---|---|---|---|
| May 09, 2019 | 10:30 | 92B | |||
| May 02, 2019 | 10:30 | 123B | 92B | ||
| Apr 25, 2019 | 10:30 | 92B | 91B | 92B | |
| Apr 18, 2019 | 10:30 | 92B | 87B | 25B | |
| Apr 11, 2019 | 10:30 | 25B | 29B | 23B | |
| Apr 04, 2019 | 10:30 | 23B | 10B | -36B |
Today's +123, which is for the week ending 4/26/19, obliterates the old record high for an April week of +103 that was set in 2001! Obviously it was quite bearish vs history as well as being solidly bearish vs surveys such as DJ's +112 average guess.
Closing comment Thursday from Natural Gas Intelligence:
Pressured by Plump EIA Print, Natural Gas Futures Pull Back
Natural gas futures came under pressure Thursday after a bearish miss from weekly government storage data, but prices found their footing to finish only a few..
metmike: Prices were higher late in the day, after the mega bearish EIA report.
Friday morning comments: Market Mulling ‘Outsized’ EIA Build as Natural Gas Futures Steady
0Z Fri vs 0Z Thu model runs:
1. GEFS: HDD 0; CDD +6
2. EPS: HDD +11; CDD 0
12Z Fri vs 0Z Fri model runs:
1. GEFS: HDD +3; CDD 0
2. EPS: HDD -2; CDD -1
Thanks much Larry!
With both CDDs and HDDs above average, the weather is mildly bullish(in early May, it's hard for weather to get very bullish because neither of them add up to a great deal of demand) but the massive supplies are crushing this market.
Cash prices are down around $2!
$2.477 is the contract low back on April 25th. It seems hard to imagine a reason for prices to go higher after seeing that huge record injection we had yesterday.
From Natural Gas Intelligence after the close Friday:
Bearish Weather, Fundamentals Drop Natural Gas Futures; Mild Temps Drive Discounted Spot Prices
5:45 PM
A lack of weather-driven demand, combined with an exceptionally large weekly inventory build, proved too much for natural gas futures bulls to overcome Friday as prices skidded lower for a second straight session. In the spot market, shoulder season temperatures tamped down buying interest in deals for weekend and Monday delivery; the NGI Spot Gas National Avg. slumped 9.0 cents to $2.105/MMBtu
 Seasonal Chart")