For the weather that affects residential heating and the price of natural gas, go here:
Monday's weather:
https://www.marketforum.com/forum/topic/23662/
Tuesday's Weather:
https://www.marketforum.com/forum/topic/23742/
Wednesday's Weather:
https://www.marketforum.com/forum/topic/23824/
Thursday's Weather:
https://www.marketforum.com/forum/topic/23878/
Friday's Weather:
https://www.marketforum.com/forum/topic/23954/
Saturday's Weather:
https://www.marketforum.com/forum/topic/24007/
Sunday's Weather(even warmer yet on top of yesterday's warmer maps):
From Natural Gas Intelligence earlier today:
Natural Gas Rallies as Coming Cold May Linger into March, Threaten Supplies
Wow! Look how fast the mild weather in December and early January caused us to close the storage gap below.

Note: The shaded area indicates the range between the historical minimum and maximum values for the weekly series from 2014 through 2018. The dashed vertical lines indicate current and year-ago weekly periods.
From the EIA last monthly report:
Data for November 2018 | Release Date: January 31, 2019
https://www.eia.gov/naturalgas/monthly/
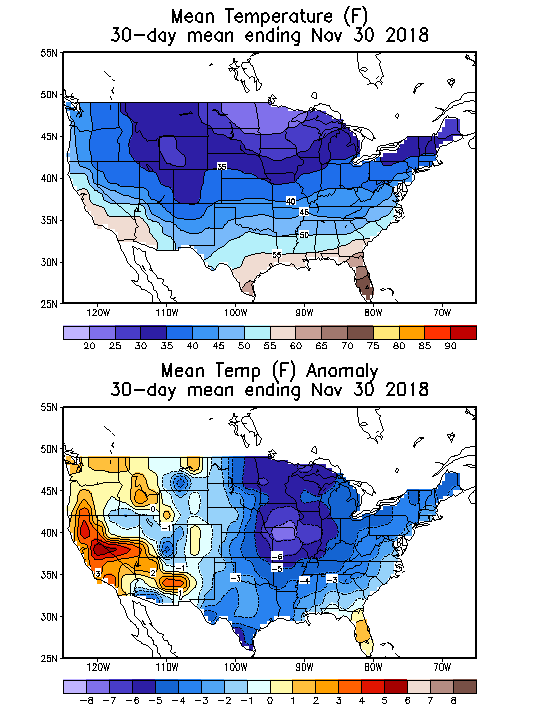
metmike: Cold November temperatures caused an unusually high amount of residential heating demand......which temporatly prevented the record high production from increasing the supplies/closing the 6-700 bcf gap in storage with the previous year. A negative temperature anomaly as much as 7 Deg F. in the Midwest(incredible to average that for an entire 30 days!), with very chilly weather east of the Rockies on the map below.
Then we had the opposite kind of weather in December.........record warm month for the Midwest and mild across the entire country. Look at the huge positive temperature anomalies below! This caused residential heating demand to be low, with tiny drawdowns vs average for December.
We gained on the previous years storage by leaps and bounds........and were caught up in early/mid January.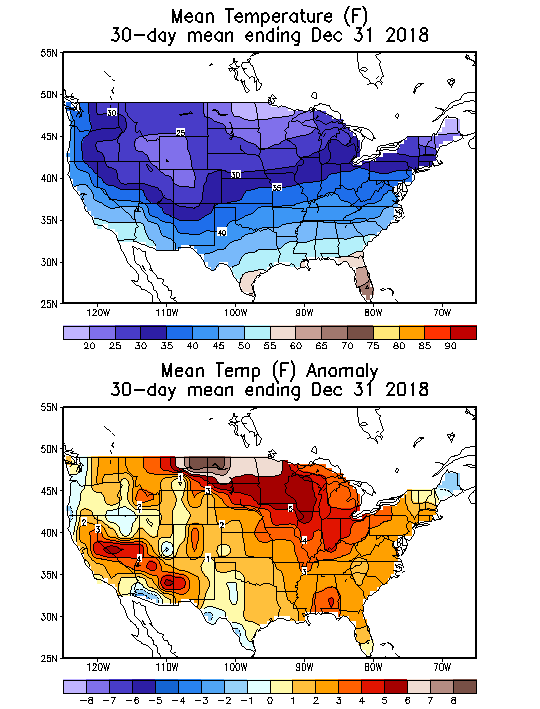
The Energy Information Administration (EIA) reported a 237 Bcf withdrawal from storage inventories for the week ending Feb. 1. The reported build fell about 10 Bcf shy of market expectations for a week that featured the coldest temperatures of the winter in key demand regions.
Nymex natural gas futures prices, which were already about a nickel lower ahead of the report, fell another penny or so as the print hit the screen. By 11 a.m. ET, the March contract was trading 7.7 cents lower at $2.585, and April was trading 6 cents lower at $2.597. The flip in the March/April spread reflects no concerns about a supply crunch, and the smaller-than-expected withdrawal fueled that sentiment.
“This came in bearish to market expectations and reflects a market that did not really tighten at all last week, despite severe cold across the Midwest. Modeling indicated bearish risks with the number today, though after a very surprising bearish miss last week, we were looking for an implicit revision,” Bespoke Weather Services chief meteorologist Jacob Meisel said.
Instead, the gas market remains quite loose and will struggle to bounce without clear evidence of tightening in daily supply/demand balances and more bullish weather. March gas at under $2.60 “still seems cheap given lingering cold risks and plummeting imports this week, but this is certainly a bearish EIA number that will limit upside at the front of the gas strip moving forward,” Meisel said.
Broken down by region, the Midwest reported an 84 Bcf withdrawal, the second largest pull ever for that region. A 79 Bcf draw was reported in the South Central and a 59 Bcf draw was reported in the East. Both the Mountain and Pacific regions reported pulls of less than 10 Bcf, according to EIA.
Total working gas in storage as of Feb. 1 stood at 1,960 Bcf, 135 Bcf below last year and 415 Bcf below the five-year average.
Ahead of the EIA report, most market participants had called for a withdrawal in the 240-250 Bcf range. Last year, the EIA reported a withdrawal of 116 Bcf for the same week, and the five-year average draw stands at 150 Bcf.
Some market observers said the reported draws in the Midwest and South Central region appeared low but struggled to determine the reason for such a miss, although many wondered about the impact of liquefied natural gas (LNG) demand as exports were low for the reporting week and so far this week as well.
-237 bcf BEARISH!
| Working gas in underground storage, Lower 48 states Summary textCSVJSN | |||||||||||||||||||||||||
|---|---|---|---|---|---|---|---|---|---|---|---|---|---|---|---|---|---|---|---|---|---|---|---|---|---|
| Historical Comparisons | |||||||||||||||||||||||||
| Stocks billion cubic feet (Bcf) | Year ago (02/01/18) | 5-year average (2014-18) | |||||||||||||||||||||||
| Region | 02/01/19 | 01/25/19 | net change | implied flow | Bcf | % change | Bcf | % change | |||||||||||||||||
| East | 468 | 527 | -59 | -59 | 493 | -5.1 | 530 | -11.7 | |||||||||||||||||
| Midwest | 522 | 606 | -84 | -84 | 551 | -5.3 | 612 | -14.7 | |||||||||||||||||
| Mountain | 105 | 114 | -9 | -9 | 132 | -20.5 | 142 | -26.1 | |||||||||||||||||
| Pacific | 172 | 178 | -6 | -6 | 214 | -19.6 | 232 | -25.9 | |||||||||||||||||
| South Central | 692 | 771 | -79 | -79 | 705 | -1.8 | 858 | -19.3 | |||||||||||||||||
| Salt | 241 | 278 | -37 | -37 | 182 | 32.4 | 241 | 0.0 | |||||||||||||||||
| Nonsalt | 451 | 493 | -42 | -42 | 523 | -13.8 | 617 | -26.9 | |||||||||||||||||
| Total | 1,960 | 2,197 | -237 | -237 | 2,095 | -6.4 | 2,375 | -17.5 | |||||||||||||||||
Totals may not equal sum of components because of independent rounding. | |||||||||||||||||||||||||
Working gas in storage was 1,960 Bcf as of Friday, February 1, 2019, according to EIA estimates. This represents a net decrease of 237 Bcf from the previous week. Stocks were 135 Bcf less than last year at this time and 415 Bcf below the five-year average of 2,375 Bcf. At 1,960 Bcf, total working gas is within the five-year historical range.
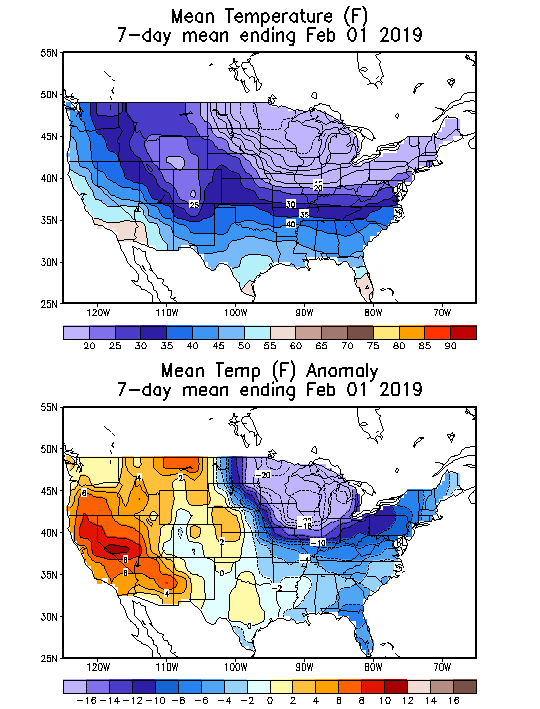
These were the 7 day temperatures that went into the report last week.
Extreme(record) cold in the Midwest/Great Lakes but just moderately cold in the Southeast.
These were the 7 day temperatures(mean) for the upcoming EIA report, this Thursday at 9:30am.
MUCH, MUCH milder in the high population centers east of the Rockies.
How small will the drawdown be?
Anybody want to guess?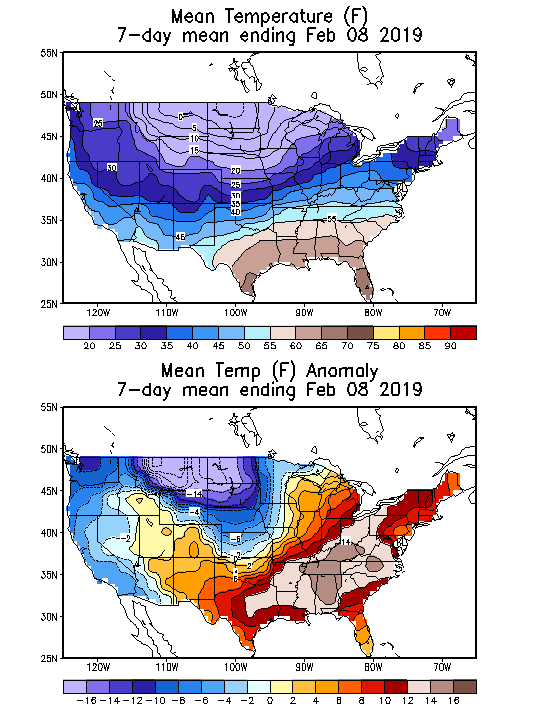
Natural gas prices gapped higher on last nights open at 2.650, leaving a price gap from that price to the high on Friday of 2.620.
So the gap was between 2.620 and 2.650. This WAS very bullish as it indicates a market pschology shift that is more bullish than the most bullish point during the previous trading session. This was the result of colder/higher HDD's in the forecast.
The bullishness peaked just after 8am this morning, when we spiked to 2.744.
Since then, ng has been fading along with some models not being as cold............GFS and Euro ensembles. Even though the GFS had MUCH high HDD's................which caused the spike higher, above 2.7 just after 10:30 am.......the end of week 2 on the GFS however was much milder.
Early afternoon weakness continued as we touched the low of 2.638 and partially filled the gap but it held. So the gap is now 2.620(Fridays high) and 2.638, todays low.
Completely filling the gap would produce a "gap and crap" signature/indicator which is an exhaustion/failure technical formation.
The idea behind the gap and crap/failure is that the exuberance of the added bullishness on the gap higher, resulted initially of traders buying at the market or hitting the offers/selling price with little regard to pricing(sometimes panic buying in some situations to cover shorts)..........then, when that action is over, the buying dries up and is replaced by increasing sellers, more confident of selling and they overwhelm what buying is left...........as the momentum swings from buyers being aggressive to sellers being more aggressive.
This 7 day chart doesn't show the gap but its from 2.620 to, right now 2.638 and showing signs of filling completely.
This would be an ominous technical formation for ng............as long as weather models did not suddenly turn sharply colder.
The top of the gap area is also good support.........which is why its the top of the gap, buyers have stepped in to buy at that point...........so far.
NG 7 days
Natural gas 10 years below:
Closing comments from Natural Gas Intelligence:
Developing Cold Snap Fuels Natural Gas Futures; Spot Prices Mixed
5:38 PM
Natural gas futures rallied to start the week as weather guidance trended colder with a weather system expected to hit the United States this weekend and others that would potentially last into March. The Nymex March gas futures contract climbed 5.9 cents to settle Monday at $2.642, while April jumped 5.5 cents to $2.659
Enough buying since the afternoon close to keep the bullish gap open from last night and early week trading.
As long as it stays open, it's officially a break away gap. If it closes((prices for March ng drop to 2.620 or lower), its the gap and crap technical formation described earlier.
Contributing to this evening's bullishness was an 18z GFS that was the coldest one of the last couple of days and the ensembles were also colder.
From NGI:
Overnight Guidance Maintains Medium-Range Cold to Keep March Natural Gas Prices Steady
metmike: Overnight, we filled the bullish gap when the 0z operational European model and Euro ensembles came out milder.
A few hours later, the 06z operational GFS and ensembles came out much colder and we spiked back higher.
Closing comments from Natural Gas Intelligence:
Near-term Cold Keeps Natural Gas Bulls in Game; Spot Gas Slides
5:31 PM
After a brief dip into negative territory, natural gas futures posted another gain Tuesday as the American weather model turned more aggressive, with cold returning to the East later this month. With already strong demand on tap beginning this week and lasting through next week, the Nymex March gas futures contract settled 4.6 cents higher at $2.688. April was up 4.6 cents to $2.705.
The 18z operational GFS is light years warmer in week 2 and represents an outlier solution. None of the previous GFS solutions or the GFS ensembles have been this mild.
NGI early Wednesday:
Weather Models Trend Bearish on Late February Demand Outlook, Sending Natural Gas Futures Lower
metmike: That light years warmer 18z operational GFS outlier, mentioned yesterday evening, turned out to be the first model picking up on the milder solutions overnight.
Thursday morning Natural Gas Intelligence:
Forecasts ‘Stabilized’ as Storage Data on Tap; March Natural Gas Called Slightly Higher
8:50 AM
With the weather outlook stable overnight and the market turning its attention to weekly government storage data likely to show a lighter than average withdrawal from U.S. natural gas stocks, March Nymex futures were trading slightly higher early Thursday
metmike: Signs of it potentially turning much colder(cold shifting east) later in week 2!
I bought back my short call spreads (UNG) for a 50% profit in two days per contract. Waiting for what feels like the next opportunity.
Wonderful Grant!
Thanks for sharing your trade with us.
Closing comments:
Natural Gas Futures Treading Water Until Weather Models Prove More Cold
5:19 PM
After a choppy day of trading, natural gas bulls failed to gain momentum even as weather models stabilized and showed cold weather returning to the country for the last few days of the month. The Nymex March gas futures contract settled Thursday at $2.573, down two-tenths of a cent. April slipped 1.1 cents to $2.61.
Forecasters See Small Changes to Outlook Overnight; Natural Gas Futures Steady Early
metmike: Some weather models look much colder in week 2, especially later in week 2 to me.
In addition to the already known impressive cold late week 1, there's very impressive cold during the more speculative late week 2 for much of the US outside of the far east/se on the model consensus with even that warmth fading at the end of week 2. This late week 2 intense cold is undoubtedly supporting NG today and the 12Z models were generally even colder than the already quite cold 0Z/6Z allowing for a further rise late. Even though late week 2 is well past the heart of winter when normals are coldest, the intensity would still be pretty impressive with a good number of days as cold or colder than the normals of the heart of winter.
Now we have a long holiday weekend with only modest trading volumes expected Monday and more limited forecast guidance than a normal weekday. However, the models will keep running and there will still be a pretty normal Sun evening open. My question to those who want to guess is will the market likely open solidly up, near steady (say within 3 cents), or solidly down then? How much projected cold has the market dialed in? A better way to think about it may be will the forecasts/models of today at 12Z hold the cold through Sun? Just holding that level of cold may be enough to allow for conservative forecasts of today to be cooled and NG to rise further. Obviously any colder and NG likely goes up strongly. Warmer model consensus would likely lead to a lower open,
Any guesses right now?
Edit: I did a small long from 2.630 for the weekend. I'm gambling but only a small amount and NG is still relatively low now, regardless. So, I think downside risk is not too large..perhaps $750/contract. I just feel like the risk to reward ratio is favorable for this small long. Plus I already made some $ going long today on the cold. So, I'm playing with house money so to speak.
Thanks Larry,
I agree with your assessments. I covered my tiny long position early in the afternoon but was thinking that staying long would have been a good choice.
One concern is the tenacious upper level ridge in the Southeast. If something like the 12z operational European model early in week 2 from the Friday run were to verify, then we will have well above normal temperatures for at least several days for a huge chunk of the high population centers in the East/Southeast.
I wouldn't want to be long if that expanded or lasted for more than a few days.
If not for the weekend, I would definately wanted to stay long however.
Interesting that we are even going to have a bit of CDD's in the S/SE with the heat down there.
Closing comments from Natural Gas Intelligence:
Weather Models Shift Slightly Colder, Boosting Natural Gas Futures; Spot Gas Mixed
6:35 PM
The long Presidents’ Day weekend was too much to bear for natural gas traders facing another cold blast that was set to linger through the week. With the latest forecasts showing more chilly weather to finish out the month, and the latest models intensifying that cold, the Nymex March gas futures contract settled Friday at $2.625, up 5.2 cents. April rose 4.6 cents to $2.656.
The 0z GFS has got a crazy milder change from the very cold 12 run that helped boost natural gas prices the last several hours.
This doesn't look right and I don't believe it but know your feeling looking at it. The Canadian ensembles are still just as cold and very cold, especially late in week 2.
The GFS ensembles at 0z have also warmed up a decent amount in week 2 for an ensemble.
I'm glad that I was coaching chess with my Friday group because I had an order in to buy ng again at 2.616 that never got hit the last 2 hours and was tempted to buy it on the close and would have bought it on the close if I saw your post, since I value your opinions greatly.
The end of week 2 does look like it may potentially turn much colder on the GFS ensembles and they guidance is changing so much that its probably going to look completely different on Sunday.....maybe back to much colder again, like the Canadian ensembles that has remained more consistent here.
Hi MetMike,
I’ve never been very clear about the idea of trading week to week weather variations in the context of day to day emotions on the floor.
For crops, clearly times like way too much (way too little) rain for spring planting or flower formation create opportunities. Clearly hot/cold extremes work similarly in vulnerable crops. The trouble I’ve always had with weather related fundamental analysis has been around how much weight to give any new information from predictive weather models.
Natural gas looks like an excellent choice. I’d expect the supply numbers to be pretty tight to the real world.
Heres the question:
How do you use this information to trade? Do you look for the market to over react then position yourself to profit as it returns to a normal state? Do your models reliably anticipate important weather conditions before everyone else and ride the changing conditions? Sell the news, buy the facts? Something else? Do you have basic set up and trigger conditions to enter or exit a trade?
I’m very curious as to how you use weather to trade. Wxfollower? Your thoughts?
Lar
Great questions lar,
In natural gas, the biggest change in demand/use comes from residential heating during the Winter, then residential cooling during the Summer. Natural gas is burned to generate electricity for air conditioning.
The most important regions are where the most people live that use natural gas and at the same time, have alot of cold and heat that requires them to use it.
The East Coast and Midwest have alot of high population centers that gobble up natural gas during times of extreme temperatures to keep their homes comfortable. The Southeast and Texas have a decent amount of people too that can be subjected to extreme temps.
The West Coast has some big cities but they are just along the coast and the population doesn't add up, especially considering that we would never see a stretch of near zero/0 cold, similar to what the polar vortex did recently in the Midwest.
Every week, on Thursdays at 9:30am Central, the US Energy Information Information Administration releases a storage report that tallies up the total amount of natural gas that was either used up by demand exceeding supplies............a drawdown(which happens almost every week during the ng demand intensive Winter weeks or an injection, which happens almost every week during the less demand intensive warmer months.
The 7 day period that it uses for these reports was from the 7 days ending the previous Friday(6 days previous).
The weather that caused the natural gas demand for that period is over a week past but the actual number is in question until the release of the report. The market will have already known how cold or warm that it was but the actual number will tell us how tight the supplies might be based on the actual estimated demand during that period.
If, for instance the supplies are gushing in greater than what we thought, the EIA number will show that storage did not drop as much as expected, considering the cold that occurred and the market takes on a more bearish posture.
Now for the actual weather that the market trades:
The EIA number is a backward looking fundamental. It tells us what already happened the week before. We aren't going to have a great deal of changes to things that already happened. Weather models on the other hand tell us what will likely happen and are foreward looking. They have a great potential for powerful changes in estimated demand use for natural gas. As you know, the weather temperature forecast can change by 20 or more degrees compared to the previous one when we look out beyond a few days.
The next few days usually don't change much with regards to changing ng demand and the market already knew what they would be a very long time ago..............often 2 weeks previously, which is how far the main weather models look out.
The market, consisting of all the traders will look at the weather forecast constantly each day and calculate how many HDD's Heating Degree Day's in the Winter and CDD's Cooling Degree Days in the Summer and dial that into its assessment for how much natural gas demand will take place during the next 2 weeks and how that will affect the EIA reports coming up for the next 3 weeks(weather at the end of 2 weeks, will go into the report in 3 weeks).
Every time a key weather model run takes place, the market will trade on any changes and dial that into an overall assessment that includes the many, many previous runs of that model and all the other models.
If the 12z GFS operational model is much colder for instance, like it was on Friday, then everyone sees this and assumes that there will be more natural gas used in the high population centers in the Midwest/East and the price immediately goes higher...........if the market is open.
Those with the latest technology to update the models will be the first to jump in and you can see a move higher as the added buyers, now willing to buy at a higher price because they believe ng is under priced/valued based on the previous weather models.
This quickly reaches an equilibrium as the higher price dials in the extra demand and the buying/selling is balanced again at the higher price.
During times when the market is closed, like now, weather models coming out can have a great deal of change that does not get dialed in by ratcheting up or down in small moves after each model change.
Instead, if the change in HDD/CDD build up is in the same direction in a cumulative way, the market will have a pent up buying or selling surge that hits immediately, the second that ng re opens on Sunday Night at 5pm central.
If the changes are significant, the market will gap open MUCH higher or lower than the price that it closed at on Friday. This happens frequently. It sometimes will open much higher or lower than the highest or lowest price that entire trading session on Friday and occassionally higher or lower than the previous week...........if the weather models during the 2 day period that ng was closed showed a complete weather pattern change from what they showed on Friday.
In the old days, it might take a day or two or longer for the market to dial in a pattern change like this as it gradually moved in that direction, with more and more guidance confirming and the smartest traders recognizing it first and getting in early.
Today, the market often OVER reacts to changes and everybody knows in a flash what the short term changes are. This causes the market price to wildly gyrate up and down(volatility), especially when key model solutions are coming out.
Often, a big change in a particular operational model at a certain time frame can be a fluke but just part of the choatic nature of those models but result in a sharp price spike in natural gas because of traders trading it as gospel for the moment.
If it is a fluke, the market comes back down, either shortly after that or when the next key model data shows otherwise.
I hope Larry will add a few things. He is a skilled natural gas trader and understands the dynamics every bit as well as metmike.
Like all markets, the ng market moves to a price that reflects what the participants feel ng is worth. Very cold weather increases demand, draws down storage and makes natural gas worth more. Traders/the market buys and sells each day at prices based on a host of factors but the one that changes the most is the weather forecast. Each new day brings a new forecast that updates the previous days and adds another day at the end of the forecast. In a long lived pattern...........let's say its a colder than average one in January, the updated forecast will add another cold day, increasing the bullishness and the price will keep going higher.
So a weather trader can follow a trend that can last weeks based on a colder than average weather regime that lasts for a similar length of time. Of course weather models are known for their volatility and changes. A weather trader can trade a shorter scale of time based on knee jerk reactions to these fluctuations, especially when there is no dominant trend up or down but instead, the market is noted for being up one day, then down the next because of model nuances handling projected temperatures.
In this case, timing is tricky and those with the best weather sources to get in and out, have an advantage since the market is hanging on the latest weather models.
In the mid 1990's, before the internet, I used to have a sateliite dish on my roof that brought me the latest weather data available from the National Weather Service, as fast as they got it. There weren't nearly as many weather models and the markets didn't trade almost around the clock(natural gas only closes for an hour during the week from 4-5pm).
Back then, I could put on a position from a weather model change and it would take hours for the market to react, especially if it was overnight. There is still some of that delayed reaction today as the main big traders trade in the morning on changes overnight but having a satellite dish on the roof advantage was gone with the advent of the internet.
And now, those sources are not the best. Many private firms run the data for the model runs with their expensive in house models which are double digit minutes faster than the NWS model runs which used to be the fastest. I noticed that over a decade ago, the market was reacting BEFORE I got the updated model data to use in order to put on a position BEFORE the market reacted. The initial reaction to the new data from those that have the data first, will have staying power if everybody else trades the same way based on when they see it. So you can be a bit later than the first to capitalize but still be on board for the rest of the move if it continues.
One way to think of it too. We here the expression that "the market is always right". Well, yes but only for that instant in time because the truth is..........the market is almost always wrong. If it was right, the price would not need to change constantly because this current price is the one that should stay. A speculator just has to be better than the market as a whole in determining what the next price will after he puts on a position, to when he covers/offsets that position.
If I think the market is underweighting the intensity of the cold coming up..........additional days at the end of the forecast will all be cold days for instance, or that the forecast for the days before then will get colder, then I will buy natural gas today and be rewarded for being right tomorrow and later on because the market will embrace my projection for additional cold by increasing the price of natural gas. At some point, I can sell it higher depending on my objectives.
The reverse is true if the forecasts get warmer. A trader being short will profit in those situations.
Here's a post on weather trading that I put up last year:
Mike's weather trading rules
Started by metmike - May 9, 2018, 11:07 a.m.