Wonderful February 12th it is! Share your blessings with somebody today. Seriously, don't just think about it for a moment......do it now.
Scroll down and enjoy the latest comprehensive weather to the max.
Here are the latest hazards across the country.
Purple/Pink/blue on land is cold/Winter weather. Brown is wind, Green is flooding. Gray is fog. Reddish is a red flag advisory.
Go to the link below, then hit the location/county on the map for details.
https://www.spc.noaa.gov/ Go to "hazards"


Current Jet Stream

Winter Weather
https://www.wpc.ncep.noaa.gov/wwd/winter_wx.shtml

Snowfall the next 3 days:
Forecast Hour: 084
Image URL: http://mag.ncep.noaa.gov/data/nam/12/nam_namer_084_snodpth_chng.gif

| Low Temperatures Tomorrow Morning |

High Temperatures
Huge, still an almost 80 degree contrast from N.Rockies/Plains to far Southeast.


Highs for days 3-7:
Very Cold NorthCentral to N. Rockies. Mild far South/Southeast. Rainbow of colors.
Cold wins more terrain but moderates headed southeast.


How do these days 3-7 temperatures compare to average at this time of year?
Incredible temperature contrast across the country from frigid Plains to mild FAR southeast. The cold wins out eventually but moderates headed southeast.
https://www.wpc.ncep.noaa.gov/medr/medr_mean.shtml


Weather maps for days 3-7 below:
Southern stream battles Northern stream..............Northern stream wins during this period.
Cold gets modified when it heads southeast. A southern stream system late in the week tracks into the colder air in the S/SE.

Liquid equivalent precip forecasts for the next 7 days are below.
Another big precip maker at the end of the week.
Day 1 below:
http://www.wpc.ncep.noaa.gov/qpf/fill_94qwbg.gif?1526306199054

Day 2 below:
http://www.wpc.ncep.noaa.gov/qpf/fill_98qwbg.gif?1528293750112

Day 3 below
http://www.wpc.ncep.noaa.gov/qpf/fill_99qwbg.gif?1528293842764

Days 4-5 below:
http://www.wpc.ncep.noaa.gov/qpf/95ep48iwbg_fill.gif?1526306162

Days 6-7 below:
http://www.wpc.ncep.noaa.gov/qpf/97ep48iwbg_fill.gif?1526306162

7 Day Total precipitation below:
http://www.wpc.ncep.noaa.govcdx /qpf/p168i.gif?1530796126

Current Dew Points
Moisture being ushered east/southeast by drier air to the west, behind a cold front.

Latest radar loop
http://www.nws.noaa.gov/radar_tab.php

| Full resolution version loop (3400x1700 pixels - 2.2mb) |

Go to: Most Recent Image
Precipitation the past 24 hours
![]()
You can go to this link to see precipitation totals from recent time periods:
https://water.weather.gov/precip/
Go to precipitation, then scroll down to pick a time frame. Hit states to get the borders to see locations better. Under products, you can hit "observed" or "Percent of normal"
+++++++++++++++++++++++++++++++++++++++++++++++
+++++++++++++++++++++++++++++++++++++
Precipitation compared to average for the last 7, 14, 30 and 60 days.
Usually not updated for previous day until late the next day.
https://www.atmos.illinois.edu/~snodgrss/Ag_Wx.html


The top map is the Canadian ensemble average, the maps below are the individual members that make up the average
+++++++++++++++++++++++++++++++++++++++++
Each member is like the parent, Canadian model operational model.......with a slight tweek/variation in parameters. Since we know the equations to represent the physics of the atmosphere in the models are not perfect, its useful to vary some of the equations that are uncertain(can make a difference) to see if it effects the outcome and how.
The average of all these variations(ensembles) often yields a better tool for forecasting. It's always more consistent. The individual operational model, like each individual ensemble member can vary greatly from run to run.........and represent an extreme end of the spectrum at times. The ensemble average of all the members, because it averages the extremes.............from opposite ends of the spectrum.........changes much less from run to run.
End of week 2....................12z ensembles from TUESDAY:
Analysis starting from a week ago, ending with today:
Last Friday: Same battle between upper level ridge in the Southeast(with warmth) and Upper level trough in the West to Plains with the northern stream from Canada aimed towards the trough, loaded with plenty of cold because of cross polar flow pouring into Canada. Very active, with alot of precip, huge temperature gradient from the far southeast to northwest. Cold should make it pretty far southeast in week 2.
Saturday: Huge disparity in individual solutions/members. Possible tenacious upper level ridge in the far Southeast, deep trough farther west with cold plunging into it. Heavy precip possible.
Sunday: This model is MUCH colder than all the others. The Southeast upper level ridge is pushed out into the Atlantic. The powerful northern stream, with cross polar flow is aimed towards the NorthCentral US with frigid air, which spreads out over a large part of the US. This disagrees with the GFS and European models.
Monday: Much more zonal, milder flow across the NorthCentral states on the mean/average vs streamlines that plunge from Alaska/NW Canada southward, aimed towards the N.Plains/Upper Midwest on previous solutions.
Tuesday: Big disparity. Decent amount of cold getting south of Canadian border on majority but not penetrating deeply southeast?
Wednesday: Battle between strong upper level ridge in the Southeast pumping up warm/moist air and northern stream coming out of Canada. The average/mean depicts something that is not on most models........will Northeast turn cold again?
Thursday: Huge question mark on how cold it will get late in week 2. Some solutions get very cold again(more today than yesterday at the end of week 2). How deep and where will the upper level trough be? How tenacious will the upper level ridge in the far Southeast be?
Friday: Giant sized disparity in solutions. Stronger upper level ridge Alaska/NW Canada and downstream trough couplet is more favorable for cold air delivery south..........on some solutions. Far Southeast upper level ridge hangs on with some solutions. Very favorable for active, stormy(some snow/ice) and heavy precip.
Saturday: Same general theme with less amplitude to the upper level ridges in the Southeast US and far W.Canada. In fact, the upper level trough has shifted farther east towards the Great Lakes on the mean. So more cold gets farther east/southeast in the US.
Sunday: Much milder at the end of week 2 today. The upper level ridge in the Southeast/East is stronger and the positively tilted trough to the west has more positive tilt and the trough line is farther west......imparting a more southern component to upper level winds in the southeast quadrant of the country.
Monday: Colder today, with the upper level and northern stream aimed a bit farther east.
Tuesday: Very similar to yesterday. Cold northern stream pretty dominant but a few solutions have the upper level ridge in the Southeast holding on.
360h GZ 500 forecast valid on Feb 27, 2019 12 UTC


0Z GFS Ensembles at 2 weeks:
Analysis, starting with a week ago:
Last Friday: Different than the Canadian ensembles! More cold aimed towards the Northeast, not as much upper level ridging in the Southeast.
Saturday: More upper level ridging in the Southeast/East than yesterday. Anomalous upper level trough to the west. Heavy precip. Cold West/Central, warm East.
Sunday: MUCH stronger Southeast ridge from the Southern Stream than the Canadian model and pretty good agreement on most solutions........pumping in copious moisture an warmth, with an upper level trough in the West likely. Colder air in the northwest to northcentral sector will have a tough time penetrating deeply towards the southeast.
Monday: Pretty strong upper level ridge in the Southeast to possibly up the East Coast............so mild there and points just west(with tons of moisture pumped up for the Gulf). Trough much farther west with cold air feeding in.
Tuesday: Northern stream much stronger and farther southeast today.........with cold getting pushed farther into the Midwest/Northeast than yesterday. Colder than yesterday and colder than the Canadian model. A few VERY cold solutions.
Wednesday: Northern stream looks pretty potent(with cold) in NorthCentral to Northeast........??? Where will the upper level trough be??? How strong will the upper level ridge in the far Southeast be?
Thursday: The GFS ensembles, in contrast to the cold Canadian model is much warmer in week 2 and continues thru the end.........at least in the East, where the upper level ridge in the Southeast holds stronger.
Friday: Not as amplified at the Canadian model. More zonal, less cold able to penetrate as far south. Ridge in Northwest Canada not as significant.
Saturday: Huge disagreements in the East from run to run and with individual solutions. The overall picture suggests an upper level trough being carved out in the Northeast, which would promote cold but this is contingent to the southern stream, upper level ridge in the Southeast cooperating and departing.
Sunday: Very much in doubt at the end of week 2 with the biggest question on this model being how much northern stream energy will be able to carve out an upper level low in Southeast Canada and where will the position be? If it digs farther south into the Northeast US, then the East is cold.............which some solutions show. However, the majority do not. Then there's the upper level ridge in the Southeast from the southern stream. How strong will that feature be? There is the potential of some places in the East to be 40 degrees warmer or colder based on one extreme of the other to verify.
Monday: Colder today at 2 weeks. Upper level ridge in the Southeast is out of the picture. Colder air to the northwest is allowed to settle east with less resistance.
Tuesday: VERY impressive northern stream. Some have the polar vortex plunging unusually far south again, which would bring extreme cold.

Latest, updated graph/forecast for AO and NAO here, including an explanation of how to interpret them.
Previous analysis, with the latest day at the bottom for late week 2 period.
Last Friday: AO a bit negative and favorable for cold to track south thru Canada and make it into the US. NAO a bit positive.............not so good for cold in the East. PNA increasing again as week 2 progresses...more favorable for cold pushing into the US farther east. Alot of uncertainty!
Saturday: AO is higher than its been in awhile, close to zero, not as favorable for cold but it's changing and uncertain from day to day. NA is positive and not favorable for cold in the East. PNA is negative, cold in the West but not the East. Tremendous uncertainty for placement of the main features could cause these indices to change fast.
Sunday: AO really spreads out at the end of week 2 and is close to zero. NAO is positive but then close to zero. PNA solidly negative then morphs close to zero. Overall not favorable for major cold in week 2 to penetrate very far southeast but that could change late in the period.
Monday: AO during week 2 goes way higher than anything we've seen in many months(making it very unfavorable for frigid weather to get into parts of the US. NAO is positive but dropping late in week 2. PNA is negative but increasing late in week 2. Indices in the state of flux, especially the AO today.
Tuesday: AO rises to very positive in week 1, then later in week 2 may plunge again. NAO is positive but drifts lower in week 2. PNA is negative in week 1 but increases to around zero by the end of week 2. Potential to turn sharply colder on some models(GFS ensembles) near the end of week 2 but with much uncertainty.
Wednesday: The connection to this site was not working this morning but one can guess that late week 2 indices may be morphing cold with a wide spread.
Thursday: The AO, which increases a great deal in week to strongly positive, plunges in week 2, back into negative territory by the end of week 2. This increases the chance of very cold air shifting farther south during the 2nd half of February. The NAO which will be slightly positive, also drops down near zero at the end of the period. The PNA is negative for 2 weeks, which favors the cold making it into the west.
Friday: AO goes from positive in week 1(unfavorable for cold to drop from high to low latitudes) to slightly negative in week 2............more favorable, with a lot of uncertainty. NAO goes from positive in week 1 to around zero at the end of week 2 with a few negative and PNA from negative to almost zero. Not seeing today's indices as being decisive enough to provide a strong clue on late February weather.
Saturday: Pretty clear trend. AO goes strongly positive in week 1, then crashes lower. Ending up fairly negative at the end of week 2 and dropping. This increases major cold risks for the 2nd half of February(favorable for air masses to move from high latitudes to mid latitudes). The NAO is positive in week 1(less cold in the Northeast) to slightly negative late in week 2(increasing chance for cold in the Northeast/East). The PNA stays a bit negative for 2 weeks. Favoring cold in the West the entire period.
Sunday: AO has very wide spread, starting unusually early, late in week 1, when most are positive to strongly positive but a couple veer negative. Week 2 features an over all drop with individual solutions zig zagging telling us not to count on this indicator as being reliable for that period. NAO is positive but gradually falling in week 2, down to near 0 at the end, mostly from solutions that think there will be an upper level low in Southeast Canada. PNA is negative(favoring cold in the West vs the Southeast) but very slowly increases to close to zero at the end. On Friday, these indicators were more favorable for late Feb cold than they are today. However they are in a state of flux.
Monday: AO is positive but drops in week 2.........more favorable for cold then with great spread. NAO is close enough to zero with a slight negative tilt late. PNA is negative but increasing. Nothing to write home about...............or on a forum (-:
Tuesday: AO, which is positive in week 1 drops in week 2. On some solutions, the AO drops off a cliff into extreme negative territory. Those solutions have a situation similar to the extreme cold of January and polar vortex displaced very far south. NAO falls into negative territory by the end of week 2. PNA is negative but gradually trends upward to nudge a tad above zero at day 14. Indices are increasingly favorable for widespread cold from high latitudes to be transported to the mid latitudes and penetrate deeply in the US in week 2 and beyond.
The link below, now has the PNA index added at the bottom:
National Weather Service 6-10 day, 8-14 day outlooks.
Big battle between the upper level ridge in the Southeast and southern stream and upper level trough to the west with northern stream cold air feeding into it...........these features will cause a lot of precip!
The last 2 days have featured the northern stream winning the battle and gradually pushing the colder air farther southeast.
Temperature Probability | |
Precipitation Probability | |
| the 8-14 day outlooks ArchivesAnalogsLines-Only FormatGIS Data | |
Temperature Probability | |
 | |
By mcfarm - Feb. 8, 2019, 7 a.m.
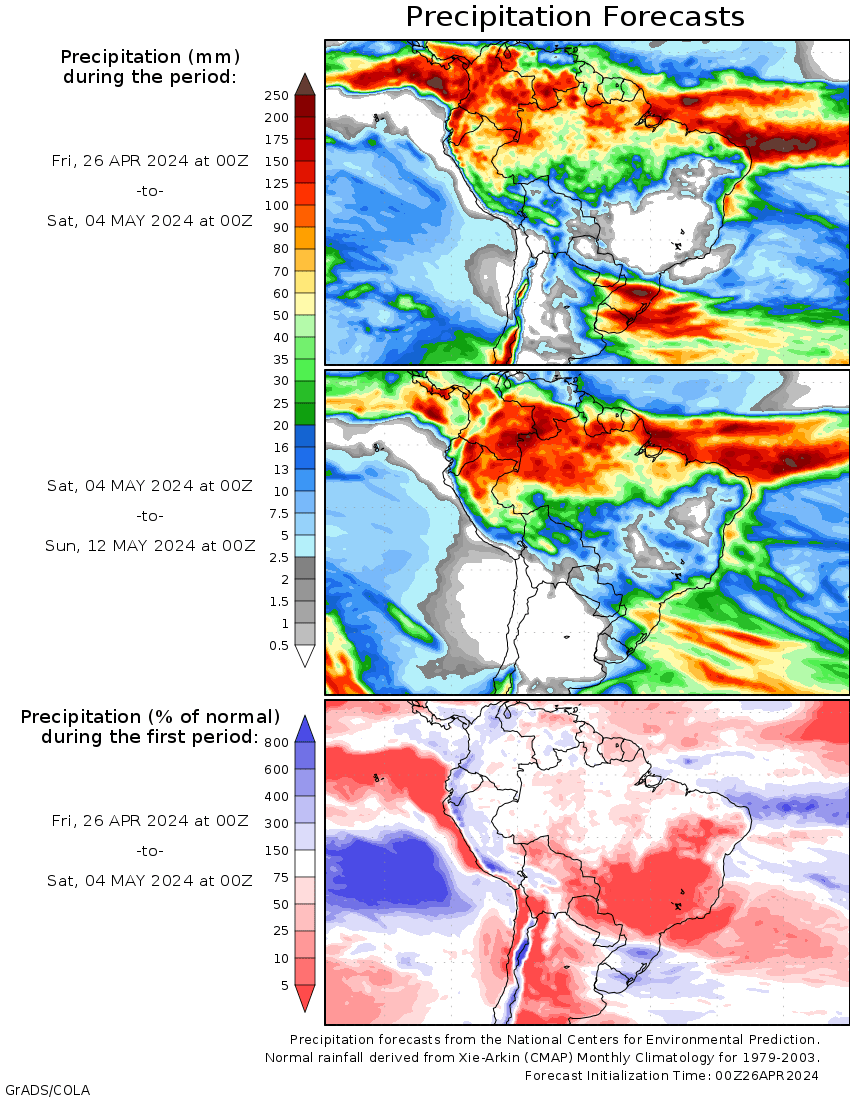
saw a new map for Brazil harvest weather in February...if that thing is accurate it shows some sort of rain nearly everyday in February....kind of impossible to cut beans with that
++++++++++++++++++++++++++++++++++++++
By metmike - Feb. 8, 2019, 12:41 p.m.
mcfarm,
They will be harvesting early in Brazil but the pattern does not look excessively wet to me, especially not in S. Brazil. Maybe parts of C.Brazil, mostly north of the bean growing areas.
+++++++++++++++++++++++++++++++++++
Re: Weather Sunday By pll - Feb. 10, 2019, 10:19 p.m.
Mike you sent us some wicked wind today on Maui!!!!!
++++++++++++++++++++++++++++
By metmike - Feb. 11, 2019, 3:16 p.m.
Extreme weather days 3-7:
From frigid temps to heavy snow in the north to heavy rains farther south/east.
Stormy in the West too.

++++++++++++++++++++++++++++++++++
By metmike - Feb. 11, 2019, 3:18 p.m.
Extreme weather days 8-14. VERY COLD northcentral to northwest.
