For the weather that affects the natural gas market, go here:
Sunday Weather:
https://www.marketforum.com/forum/topic/26066/
Monday Weather:
https://www.marketforum.com/forum/topic/26145/
Tuesday Weather:
https://www.marketforum.com/forum/topic/26222/
Wednesday Weather:
https://www.marketforum.com/forum/topic/26256/
Thursday Weather:
https://www.marketforum.com/forum/topic/26331/
Friday Weather:
Getting late in the year for HDD's to have a big impact on natural gas trading.
Previous discussions on natural gas here:
https://www.marketforum.com/forum/topic/25678/
https://www.marketforum.com/forum/topic/25189/
https://www.marketforum.com/forum/topic/24662/
Look how fast the mild weather in December and early January caused us to close the storage gap below. But now, the gap has widened some vs the 5 year average and last year again because of extreme cold a couple of weeks ago.
We turned very chilly last March into April with some unusually late season drawdowns............so the current deficit will erode during that time frame.

Note: The shaded area indicates the range between the historical minimum and maximum values for the weekly series from 2014 through 2018. The dashed vertical lines indicate current and year-ago weekly periods.
EIA -204 bcf
NGI: Natural Gas Futures Take a Hit After Somewhat Bearish EIA Storage miss vs expectations but finished slightly higher that day, then modestly/strongly lower on Friday and lower for the week.
| Working gas in underground storage, Lower 48 states Summary textCSVJSN | |||||||||||||||||||||||||
|---|---|---|---|---|---|---|---|---|---|---|---|---|---|---|---|---|---|---|---|---|---|---|---|---|---|
| Historical Comparisons | |||||||||||||||||||||||||
| Stocks billion cubic feet (Bcf) | Year ago (03/08/18) | 5-year average (2014-18) | |||||||||||||||||||||||
| Region | 03/08/19 | 03/01/19 | net change | implied flow | Bcf | % change | Bcf | % change | |||||||||||||||||
| East | 262 | 311 | -49 | -49 | 320 | -18.1 | 338 | -22.5 | |||||||||||||||||
| Midwest | 287 | 338 | -51 | -51 | 354 | -18.9 | 398 | -27.9 | |||||||||||||||||
| Mountain | 66 | 73 | -7 | -7 | 94 | -29.8 | 116 | -43.1 | |||||||||||||||||
| Pacific | 102 | 112 | -10 | -10 | 170 | -40.0 | 199 | -48.7 | |||||||||||||||||
| South Central | 469 | 557 | -88 | -88 | 607 | -22.7 | 705 | -33.5 | |||||||||||||||||
| Salt | 129 | 180 | -51 | -51 | 186 | -30.6 | 195 | -33.8 | |||||||||||||||||
| Nonsalt | 340 | 377 | -37 | -37 | 420 | -19.0 | 510 | -33.3 | |||||||||||||||||
| Total | 1,186 | 1,390 | -204 | -204 | 1,545 | -23.2 | 1,755 | -32.4 | |||||||||||||||||
These were the record cold temperatures that went into Thursda's EIA number released at 9:30am. The cold anomalies in the Plains and Upper Midwest are off the charts.......literally with regards to the coldest shade.
Violets representing the -16 anomaly are the coldest that we can show but there were places that were -24 vs average!!!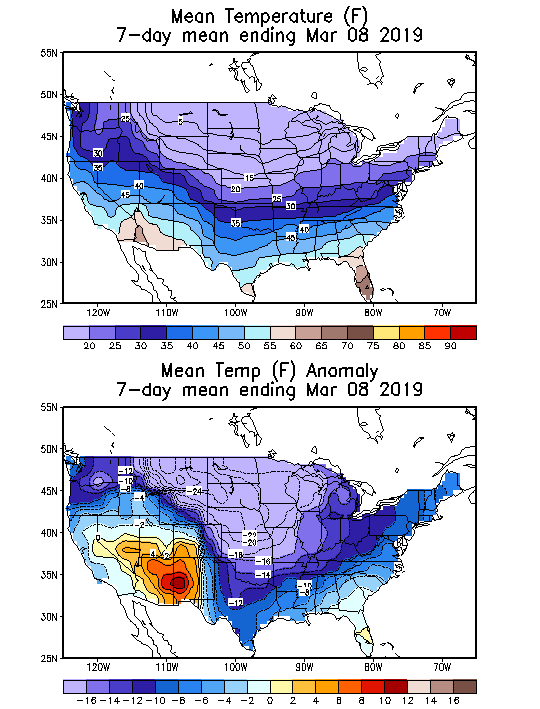
These were the temperatures that will go into this Thursday's EIA report, 7 days, ending last Friday.
MUCH, MUCH milder.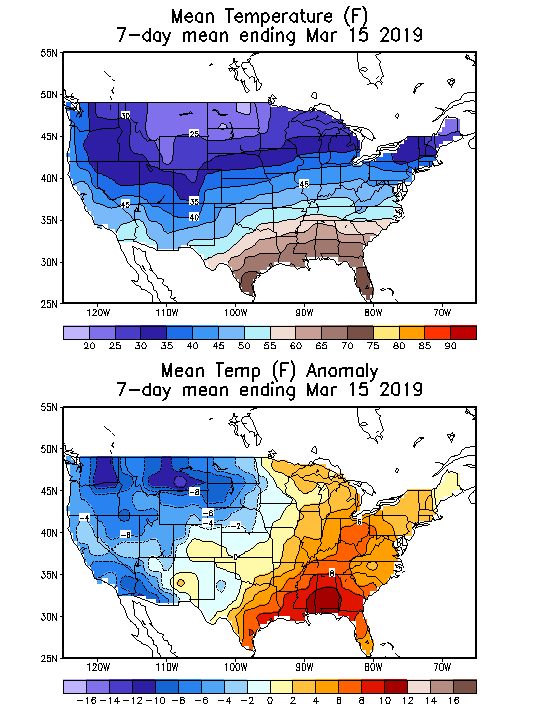
The point of showing it is to show that natural gas has a strong historical tendency to go up from mid February into April.
The lows in Feb., would be perfectly timed with a typical, end of Winter low, which is followed by increasing prices over 80% of the time into early Spring.
One should also note that at this time of year, when most of the heating season is over, weather/cold temperatures that increases heating demand in the high population centers has less power to determine prices.............as long as supplies aren't precariously low(they are low but not extremely low) or the demand/supply fundamentals are not extremely tight. Fundamentals are actually pretty bearish........note the price is still fairly low even though storage is still less than the 5 year average.....because the market feels very comfortable...... is projecting additional storage gains from supplies gushing in.
These natural gas price charts aren't the greatest (for April) but they do show a likely seasonal bottom.
The Feb price dropped below the Jan lows and reversed higher.
Huge support in that zone on the yearly chart, with numerous trips down to between around 2.5 to 2.6 that solidly held.
Last Sunday Night we gapped lower in prices(below the lows on Friday) was a downside breakaway gap from much milder forecasts between Friday's close and Sunday Nights open.
This was followed by weaker prices for a couple of days but we reversed and were strong for a couple of days ahead of and just after the EIA report.... barely filled the gap late Thursday..........then had nothing left to the upside with temperatures looking VERY mild and the extremely bullish EIA report vs average past us.
Friday was a big down day, closing on the lows for the day and lower for the week.
Sunday Night this week, we opened with a tiny gap lower but filled that right away here early on.
NG 7 days
Natural gas 3 months below
Natural gas 1 year chart
3/17 12Z runs vs 3/15 12Z runs in HDD:
GEFS -4; EPS +10
Thanks Larry!
Tiny gap lower on the open.......below Friday's low but that was filled right away.
The weather models were already pretty mild on Friday and as you showed, the HDD changes are mixed and not powerful.
From Natural Gas Intelligence:
Natural Gas Futures Called Slightly Higher, but Mild Temps Likely to Close Out March
8:56 AM
Forecasts over the weekend pointed to mild conditions to end the month, albeit with a somewhat cooler outlook from one of the major weather models, and natural gas futures were trading close to even early Monday. The April Nymex futures contract was up 1.6 cents to $2.811/MMBtu shortly after 8:30 a.m. ET.
Closing comments Monday:
Late March Outlook Leaning Cooler as Natural Gas Futures Bounce
5:35 PM
Some cooler forecast trends late in the month coincided with an early-week bounce for natural gas futures Monday, though with weather sentiment far from bullish, market observers were looking beyond temperature trends to explain the move.
NGI from Tuesday Morning:
Huge’ Cold Change Overnight Boosts Natural Gas Futures Early
8:47 AM
A major overnight cold shift in the medium-range outlook had natural gas futures trading higher early Tuesday. At around 8:30 a.m. ET, the April Nymex futures contract was up 3.1 cents to $2.881/MMBtu, building on a 5.5 cent rally during the previous session.
The natural gas was on the day sessionlows and about to put in a reversal down day(new highs for the move, up to powerful resistance, followed by a lower close) but the operational GFS and ENS came to the rescue with, once again even colder solutions then previous runs.
This bounced us back to around the middle of the trading range, then we slowly weakened and drifted lower again as these cold waves are just too late in the season and don't look to define a new much colder pattern as much as they are just injecting a ton of cold in the middle of the 2 week forecasts.
Then the European model brought in more cold, much earlier and we spiked up(and gave me the chance to bail on some longs that I put on after the GFS came out and was starting to get behind on) . The end of the EURO however, was milder and we settled back to around 2.868 April which is where we are now, up +.018 or $180/contract if you are trading it.
Considering how much extra cold that we have in the forecast compared to yesterday and where we were early in the day, this is not a very good performance.
If the forecasts turn warmer again, clearly there is room to go much lower(but not new lows or close to Feb prices in my opinion).
Also, the EIA number on Thursday should be bearish and last years heating season extended several weeks longer than usual, so we have the chance to erode the deficit with last year over the next month.
NGI closing comments Tuesday:
Cold Trends ‘Impressive’ as Natural Gas Futures Gain; West Texas Basis Weakens
5:33 PM
A shift colder in forecasts Tuesday helped natural gas futures bulls build on Monday’s rally, although with the start of injections, imminent upward momentum appeared limited as the market awaited a better reading on balances. In the spot market, West Texas posted another round of heavy losses as the region continues to struggle with pipeline constraints; the NGI Spot Gas National Avg.fell 1.5 cents to $2.610/MMBtu.
NGI on Wednesday Morning:
Natural Gas Futures Range-Bound as Prices Down Early, Despite Supportive Forecasts
9:00 AM
The range-bound natural gas front-month futures were trading lower early Wednesday even as the latest weather guidance carried over significant colder trends from previous model runs. The April Nymex contract was off 3.7 cents to $2.837/MMBtu at around 8:40 a.m. ET.
Balances Seen Loosening as Natural Gas Futures Slip; Storm Threatens Snow for Northeast
5:39 PM
Recovering production volumes and weaker demand amid the transition to spring helped pressure natural gas futures lower Wednesday as the front month continued to bounce around a tight trading range.
metmike: Models for the 12z and 18z runs have been a bit milder(less overall HDD's) with the exception of the operational European model that was slightly colder.
Temperature forecast changes at this time of year can often be ignored by the ng market.
Natural Gas Futures Reaction Muted After On-Target EIA Report, Small Bearish Revision
-47 BCF was the number
We bounced a bit shortly after the released, then dropped to slightly lower prices from just before the release and are just hovering in a tight range now.
| Working gas in underground storage, Lower 48 states Summary text CSV JSN | |||||||||||||||||||||||||
|---|---|---|---|---|---|---|---|---|---|---|---|---|---|---|---|---|---|---|---|---|---|---|---|---|---|
| Historical Comparisons | |||||||||||||||||||||||||
| Stocks billion cubic feet (Bcf) | Year ago (03/15/18) | 5-year average (2014-18) | |||||||||||||||||||||||
| Region | 03/15/19 | 03/08/19 | net change | implied flow | Bcf | % change | Bcf | % change | |||||||||||||||||
| East | 245 | 262 | -17 | -17 | 276 | -11.2 | 310 | -21.0 | |||||||||||||||||
| Midwest | 268 | 287 | -19 | -19 | 320 | -16.3 | 374 | -28.3 | |||||||||||||||||
| Mountain | 62 | 66 | -4 | -4 | 90 | -31.1 | 115 | -46.1 | |||||||||||||||||
| Pacific | 96 | 102 | -6 | -6 | 169 | -43.2 | 200 | -52.0 | |||||||||||||||||
| South Central | 471 | 473 | R | -2 | -2 | 603 | -21.9 | 699 | -32.6 | ||||||||||||||||
| Salt | 135 | 129 | 6 | 6 | 183 | -26.2 | 194 | -30.4 | |||||||||||||||||
| Nonsalt | 336 | 344 | R | -8 | -8 | 419 | -19.8 | 506 | -33.6 | ||||||||||||||||
| Total | 1,143 | 1,190 | R | -47 | -47 | 1,458 | -21.6 | 1,699 | -32.7 | ||||||||||||||||
| R=Revised. The reported revision caused the stocks for March 08, 2019 to change from 1,186 Bcf to 1,190 Bcf. As a result, the implied net change between the weeks ending March 01 and March 08 changed from -204 Bcf to -200 Bcf. | |||||||||||||||||||||||||
NGI closing comments Thursday:
Waha Crater Deepens; Natural Gas Futures Unmoved by Latest EIA Data
5:45 PM
An on-target Energy Information Administration (EIA) storage report, along with a mix of bearish and bullish macro factors heading into the
metmike: Wow, did you see that $900/contract spike lower at 7:18?
Still sharply lower but off those lows.
After trading only a couple hundred contracts the first couple of hours, we traded almost 3,000 since then with a bit of a bounce......there goes another 900 contracts in a couple of minutes with another spike lower as I'm typing and back near the lows..........WOW!
From Natural Gas Intelligence Friday Morning:
Large ‘Algo-Driven’ Drop Overnight as Natural Gas Futures Trading Lower Early
metmike: See a description of this action in the previous post yesterday evening as it was happening.
 Seasonal Chart")