
Previous thread:
Natural Gas June 1, 2026
52 responses |
Started by metmike - June 1, 2026, 8:37 a.m.
https://www.marketforum.com/forum/topic/120595/
++++++++++++
Get all the comprehensive weather here:
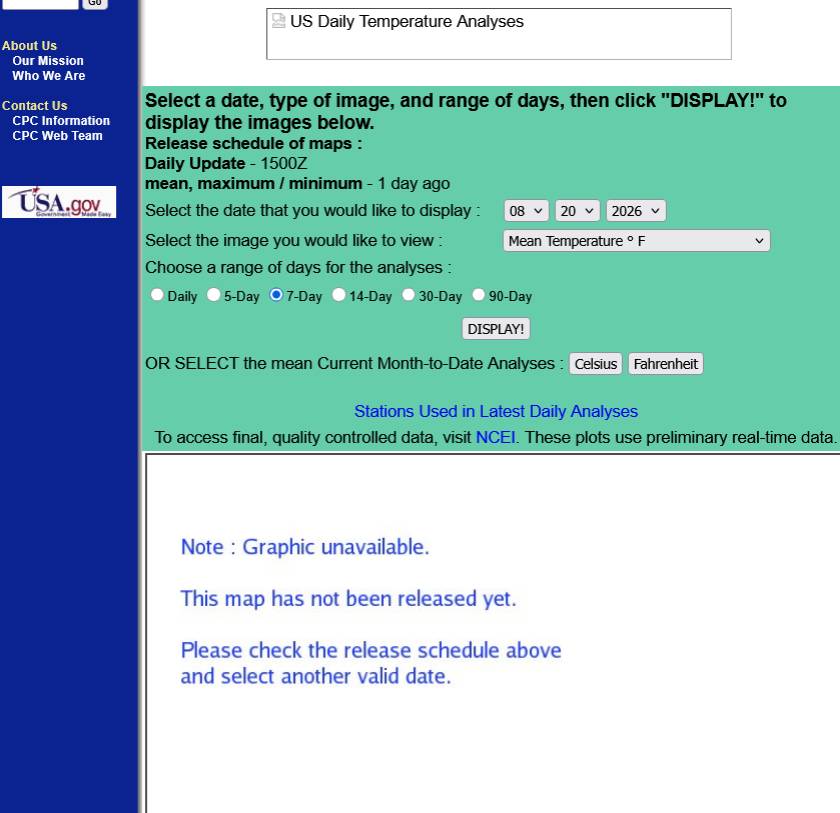
Temperatures last week for this mornings EIA report:
Record heat Northern Plains! Extremely Impressive anomalies to ADD to the HOTTEST time of year climatologically.
https://www.cpc.ncep.noaa.gov/products/tanal/temp_analyses.php

Brief spike higher. The blue line on the graph below, continues to stay above the 5 year average, moving close to parallel above it recently.

for week ending July 17, 2026 | Released: July 23, 2026 at 10:30 a.m. | Next Release: July 30, 2026
| Working gas in underground storage, Lower 48 states Summary text CSV JSN | |||||||||||||||||||||||||
|---|---|---|---|---|---|---|---|---|---|---|---|---|---|---|---|---|---|---|---|---|---|---|---|---|---|
| Historical Comparisons | |||||||||||||||||||||||||
| Stocks billion cubic feet (Bcf) | Year ago (07/17/25) | 5-year average (2021-25) | |||||||||||||||||||||||
| Region | 07/17/26 | 07/10/26 | net change | implied flow | Bcf | % change | Bcf | % change | |||||||||||||||||
| East | 631 | 614 | 17 | 17 | 633 | -0.3 | 616 | 2.4 | |||||||||||||||||
| Midwest | 766 | 749 | 17 | 17 | 744 | 3.0 | 723 | 5.9 | |||||||||||||||||
| Mountain | 240 | 240 | 0 | 0 | 238 | 0.8 | 201 | 19.4 | |||||||||||||||||
| Pacific | 314 | 319 | -5 | -5 | 297 | 5.7 | 264 | 18.9 | |||||||||||||||||
| South Central | 1,105 | 1,103 | 2 | 2 | 1,160 | -4.7 | 1,069 | 3.4 | |||||||||||||||||
| Salt | 317 | 324 | -7 | -7 | 326 | -2.8 | 288 | 10.1 | |||||||||||||||||
| Nonsalt | 788 | 779 | 9 | 9 | 833 | -5.4 | 782 | 0.8 | |||||||||||||||||
| Total | 3,056 | 3,024 | 32 | 32 | 3,072 | -0.5 | 2,873 | 6.4 | |||||||||||||||||
| Totals may not equal sum of components because of independent rounding. | |||||||||||||||||||||||||
Working gas in storage was 3,056 Bcf as of Friday, July 17, 2026, according to EIA estimates. This represents a net increase of 32 Bcf from the previous week. Stocks were 16 Bcf less than last year at this time and 183 Bcf above the five-year average of 2,873 Bcf. At 3,056 Bcf, total working gas is within the five-year historical range.
For information on sampling error in this report, see Estimated Measures of Sampling Variability table below.
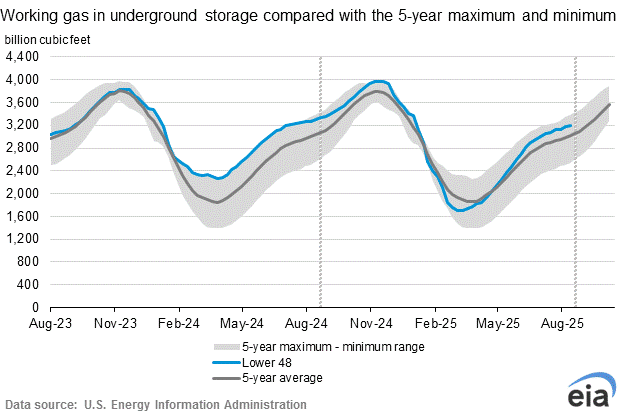
Note: The shaded area indicates the range between the historical minimum and maximum values for the weekly series from 2021 through 2025. The dashed vertical lines indicate current and year-ago weekly periods.
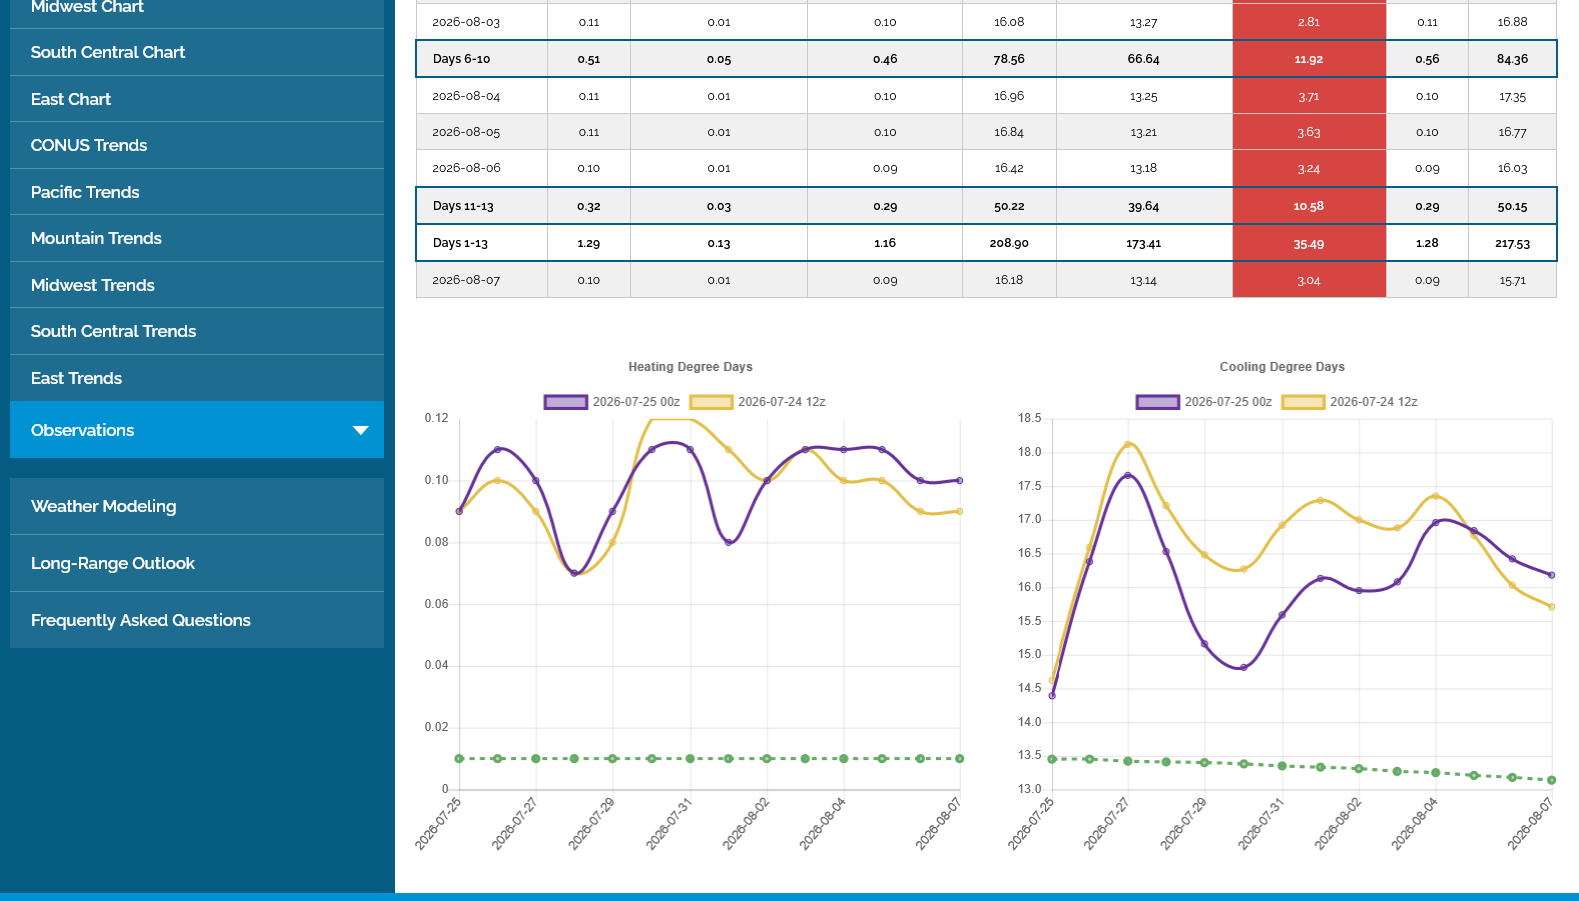
NG has been under pressure, DESPITE the intense heat in the forecast. Why is that?
1. The heat will happen in low population density areas of the country.
2. The market may be seeing the models being too hot.
3. Fundamentals are bearish
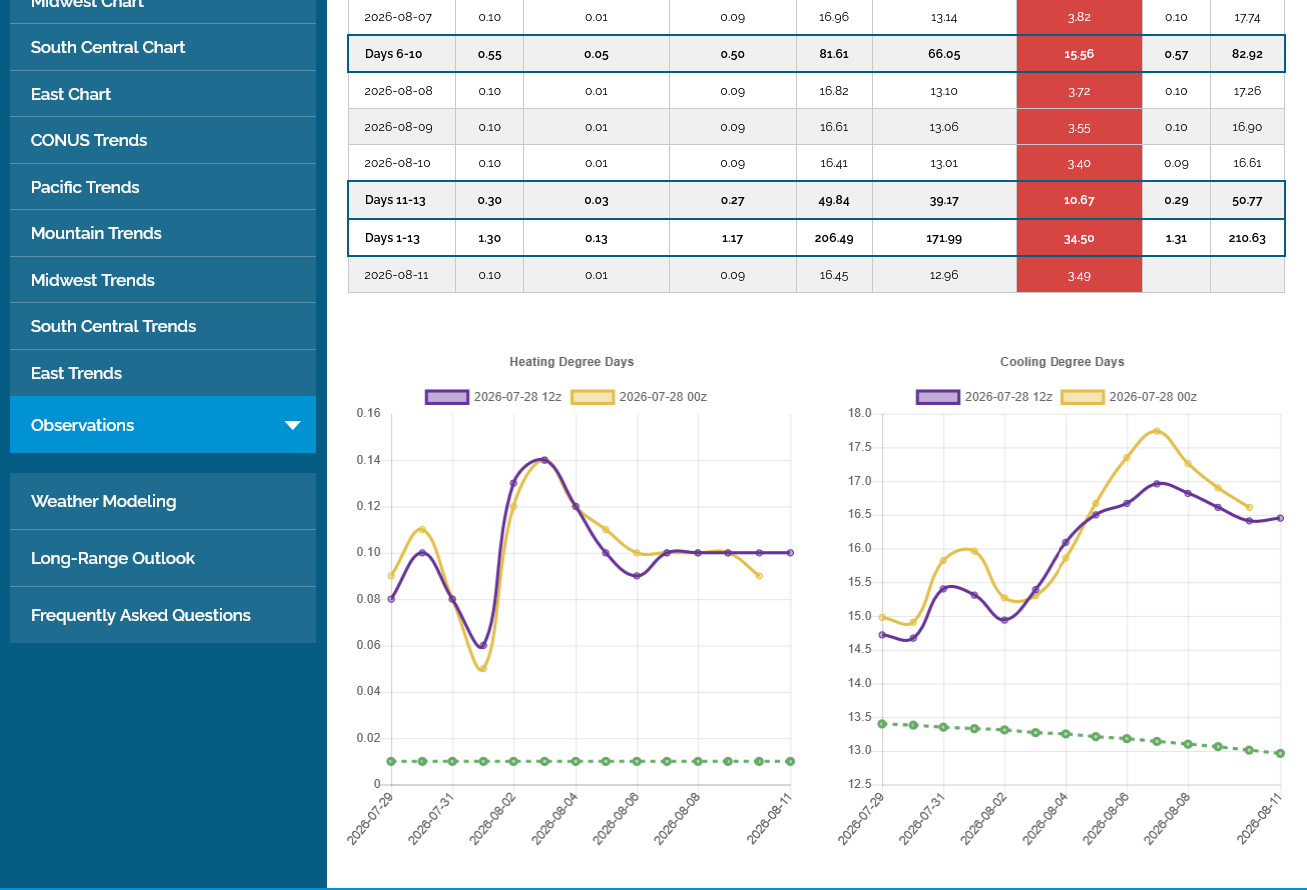
The last 0z European Ensemble model, purple on the right was a whopping -9 CDDs bearish compared to the previous run 12 hours earlier. Despite that, those lines are still well above the climatological average in the dashed green. That average HAS PEAKED and is now slowly falling. The market will always continue to compare the forecast with:
1. The seasonal average and
2. Most importantly, comparing the latest forecasts with previous ones (expectations).
++++++++++++++
Seasonals for natural gas ARE FLAT here but every year is different!
They turn sharply up ahead of the main demand season(Winter and HDDs).
https://charts.equityclock.com/natural-gas-futures-ng-seasonal-chart

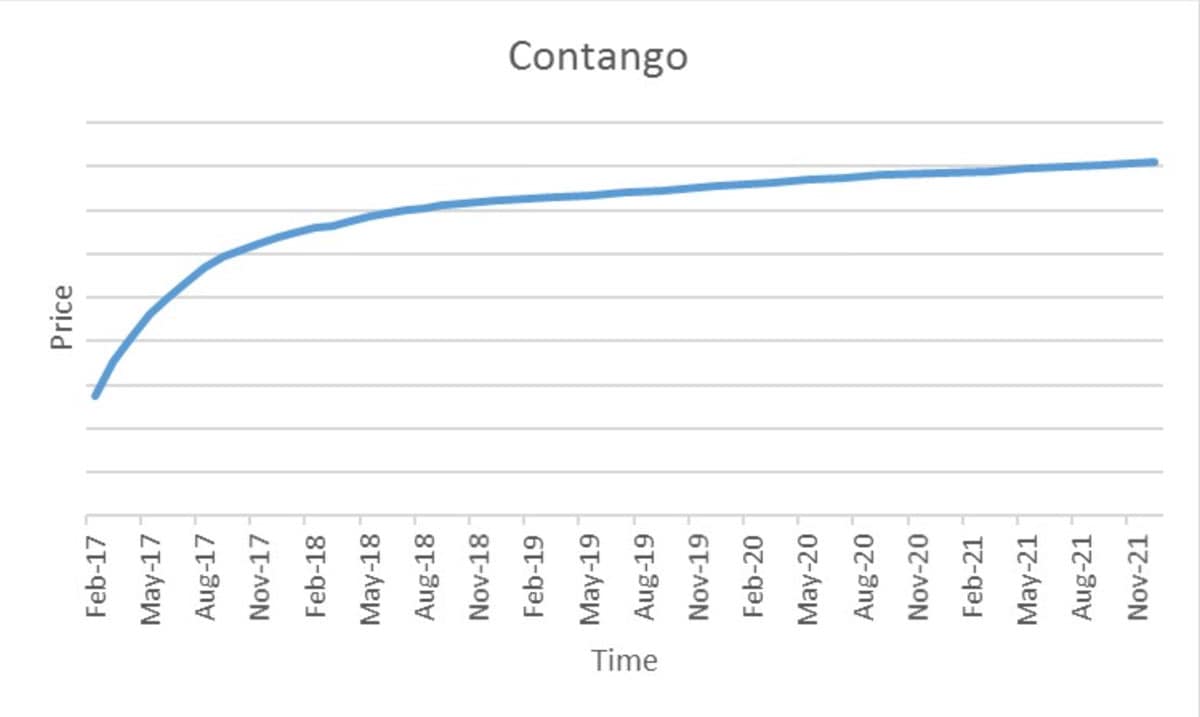
Commodities markets usually trade in Contango, with prices of the deferred contracts being priced HIGHER than the front months. The chart above, I think is INDEPENDENT of that.
https://tradingeconomics.com/commodity/natural-gas
1. 10 years: Symmetrical wedge/triangle(lower highs, higher lows). Breaking out to the down side? Depends on where you want to draw the the uptrend line! Remember, lines on the chart are often subjective(eyes of the beholder). However, the line below connecting the 2 highs is more definite(but that still doesn't make it meaningful!
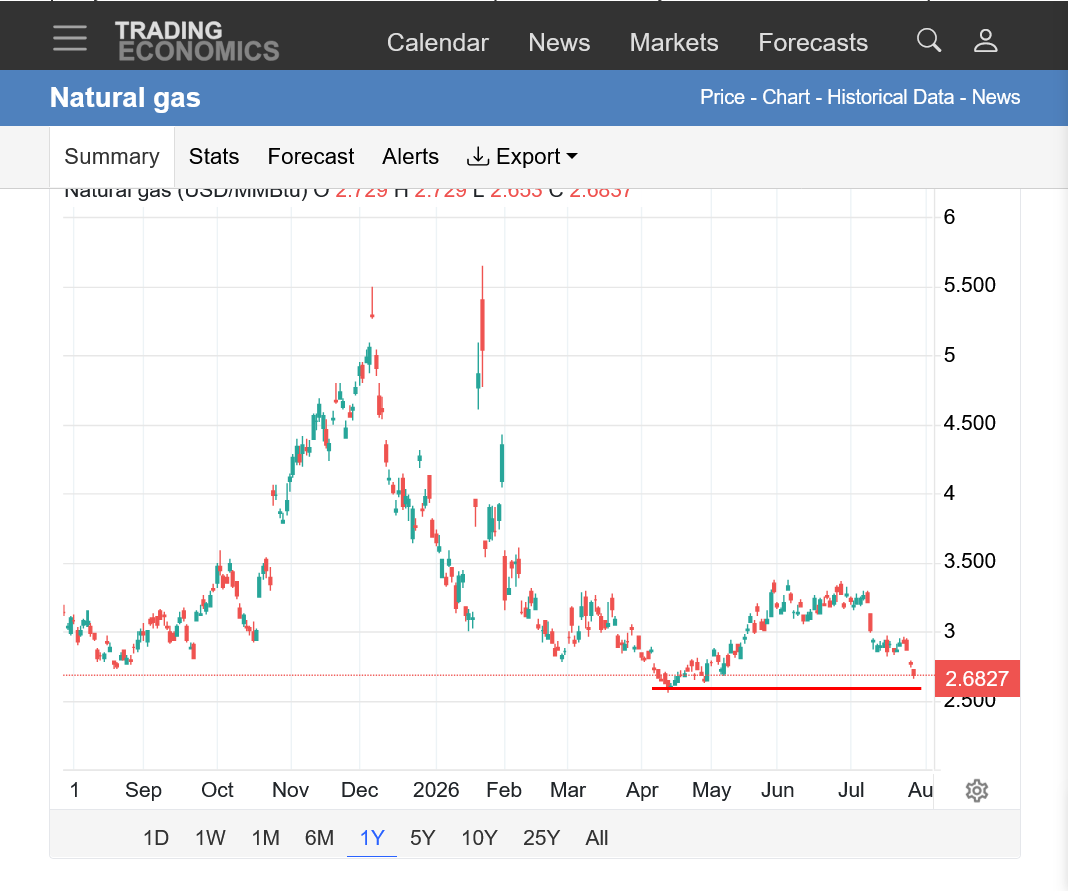
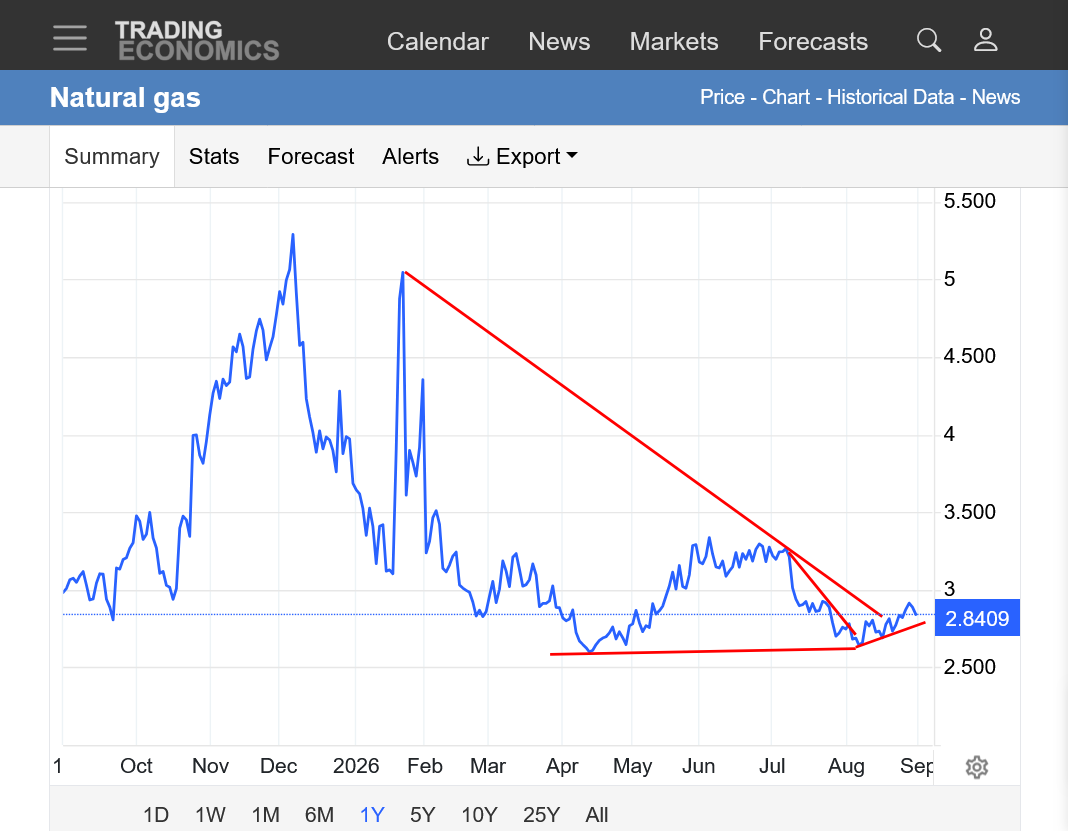
2. 1 year: Left side; WEATHER SPIKES last Winter! Seasonal low late Spring(delayed from mild end of the HDD season). Recent drop broke the uptrend since the Spring low but holding the lows.
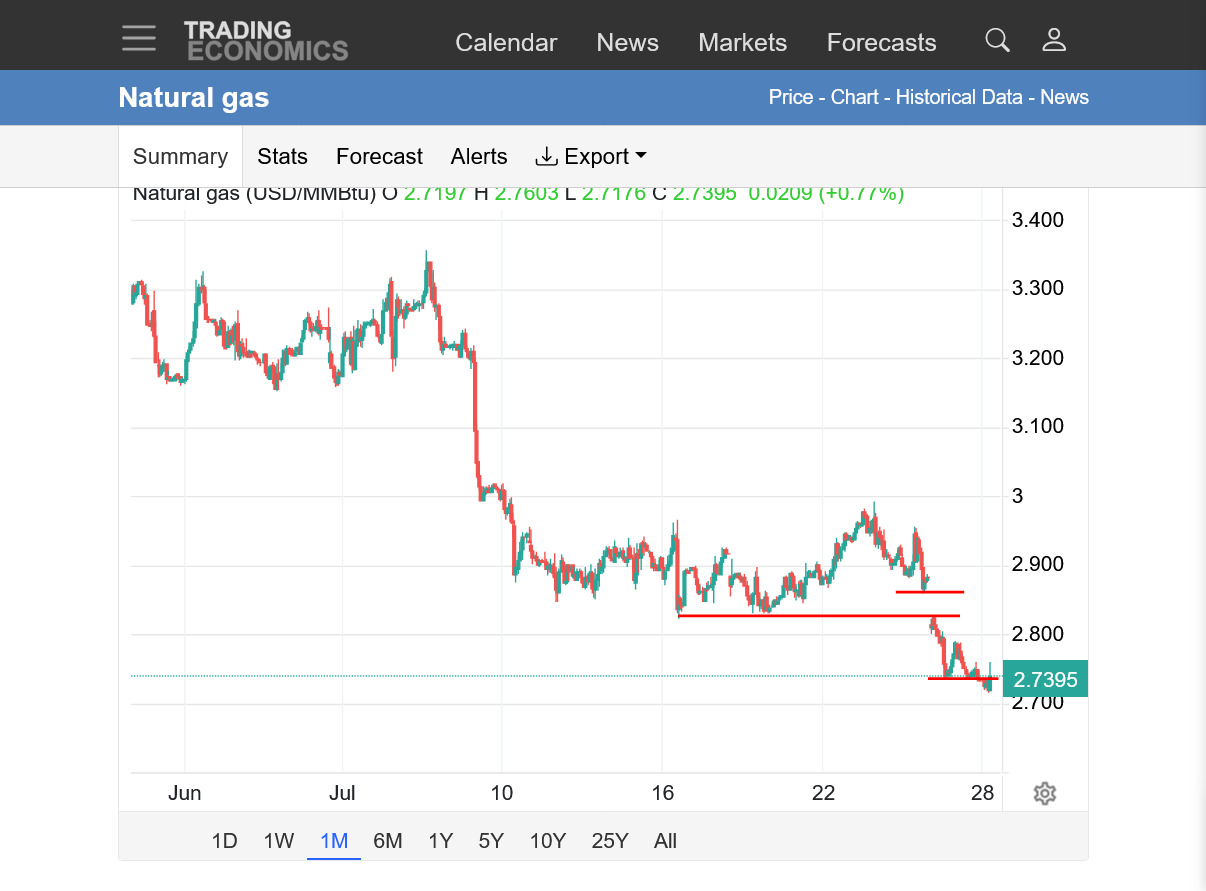
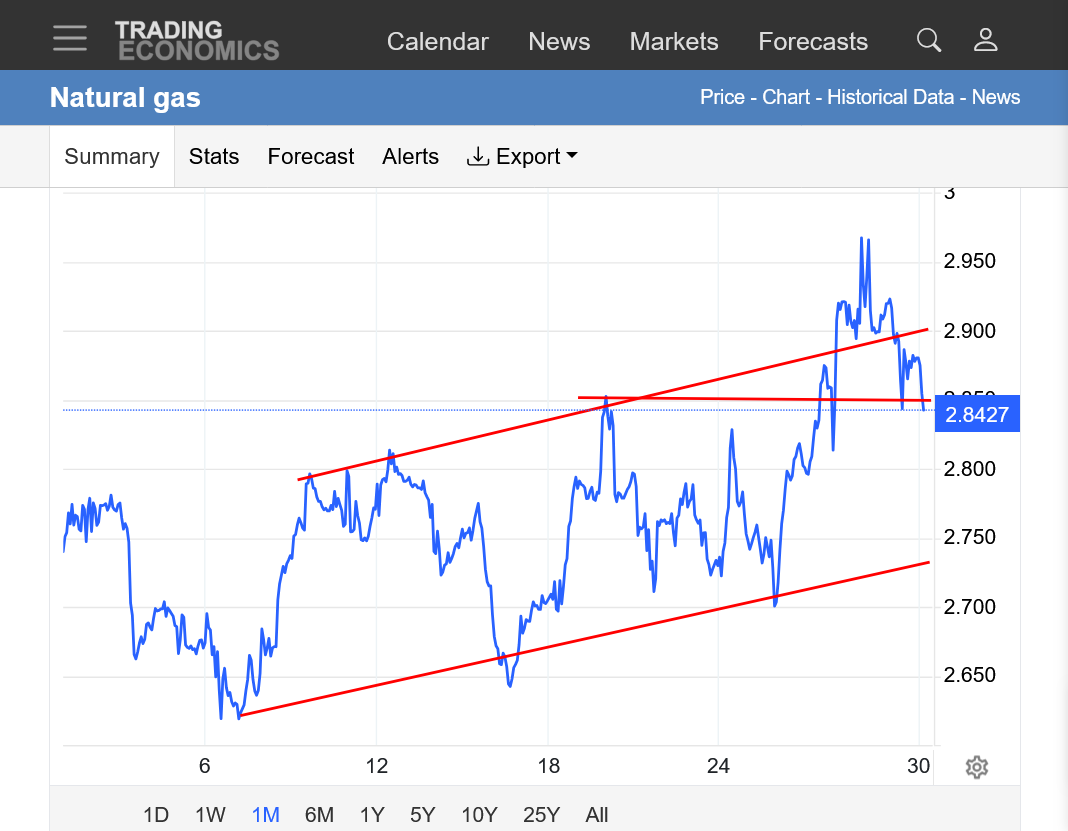
3. 1 month: Huge drop in early July!
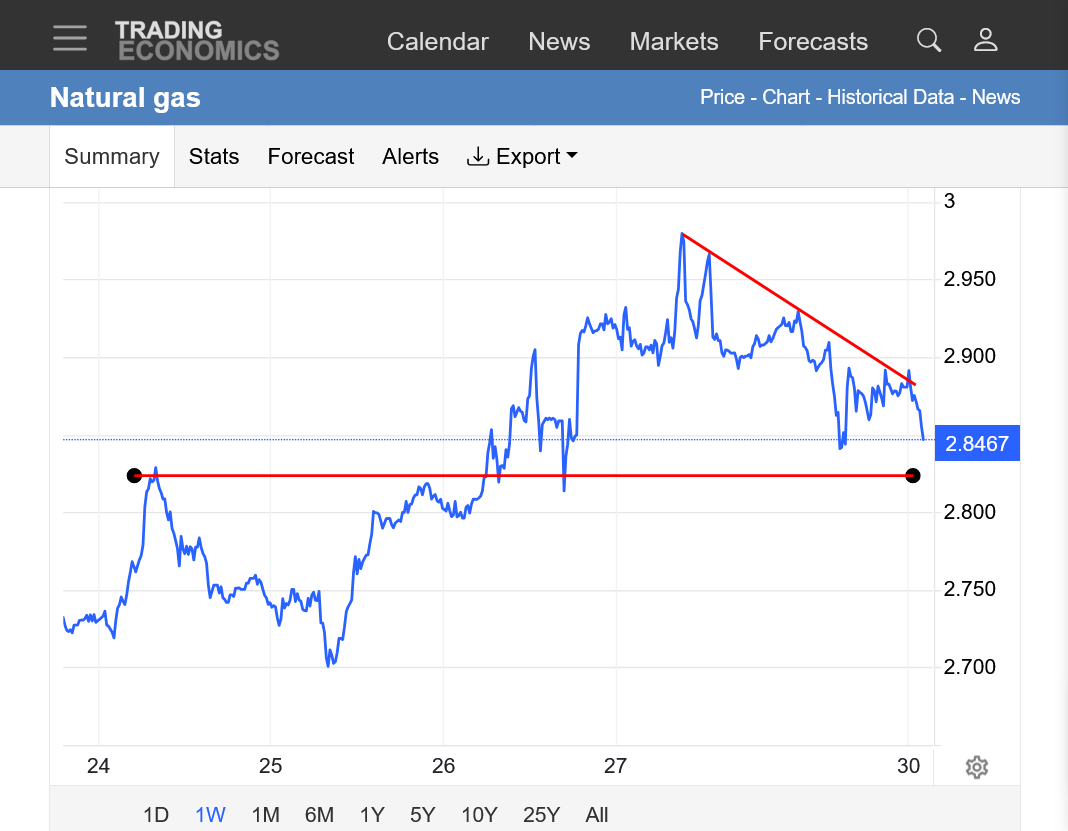
4. 1 week: Move up early in the week that failed just below $3. Weak finish but above the lows.
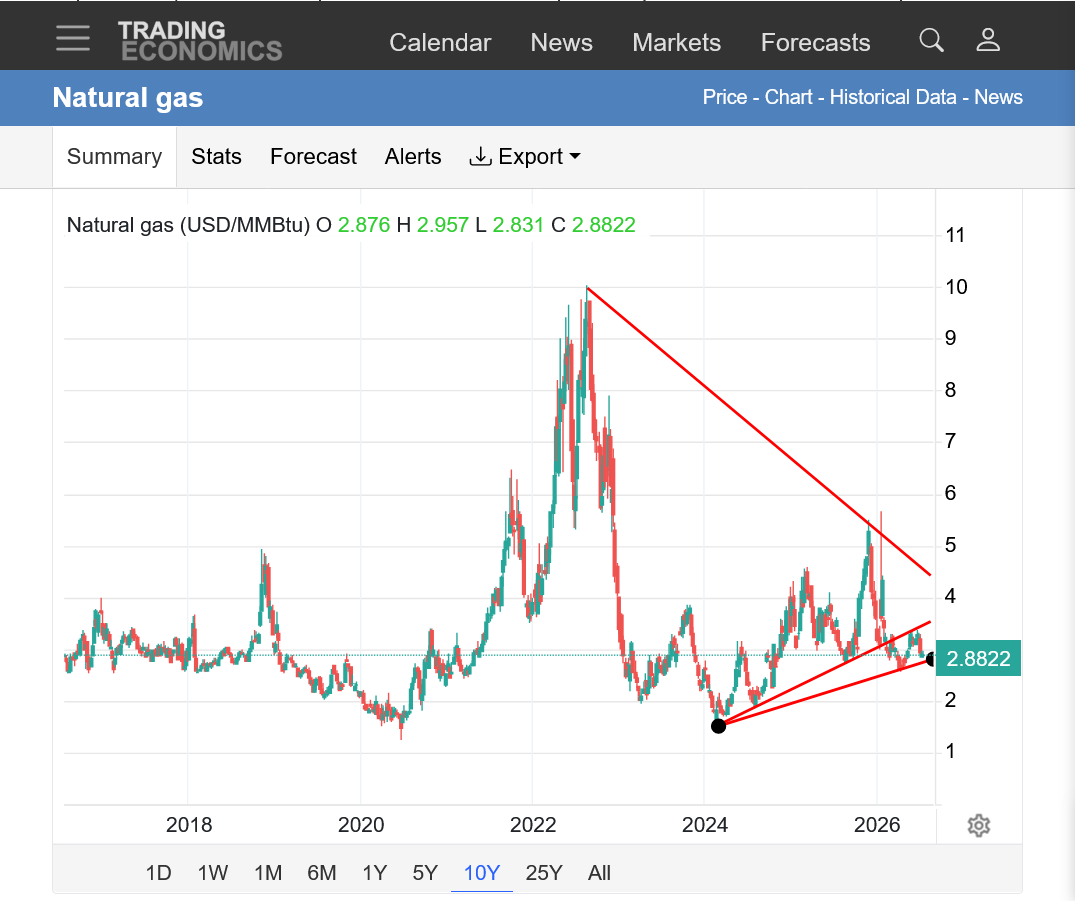
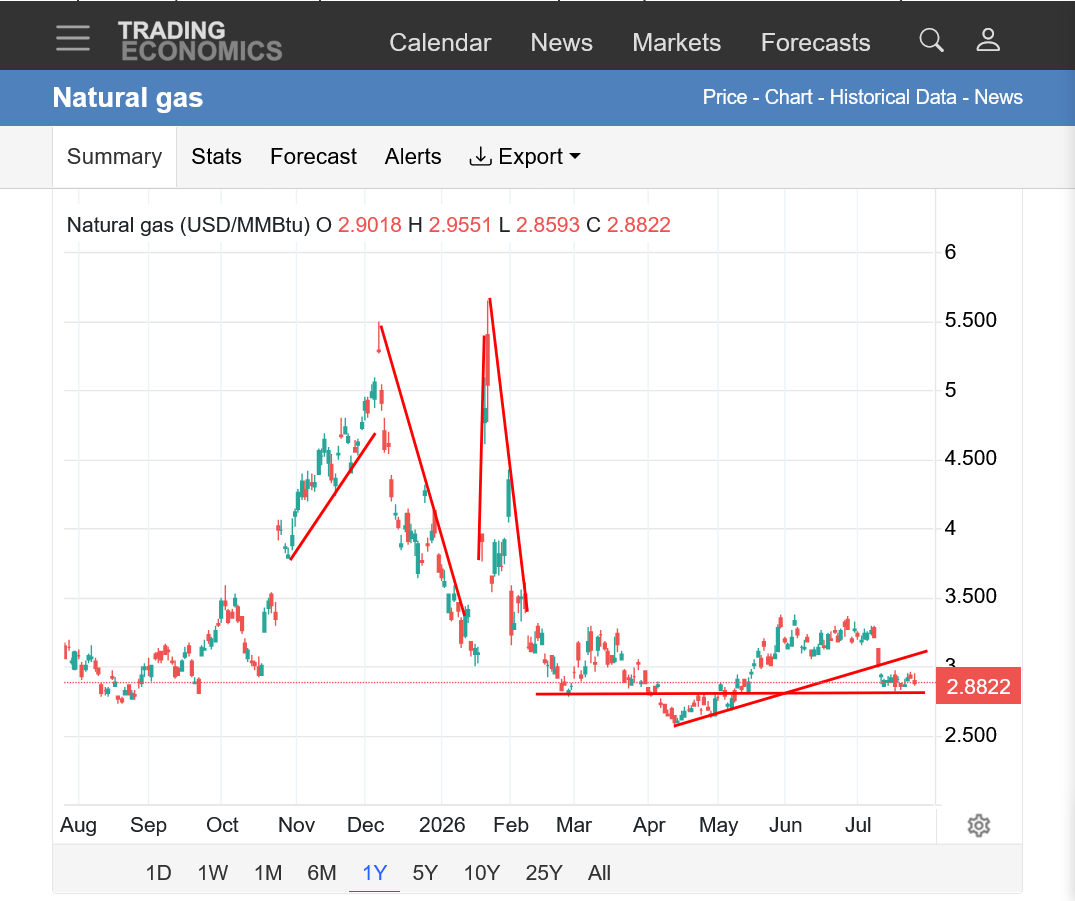
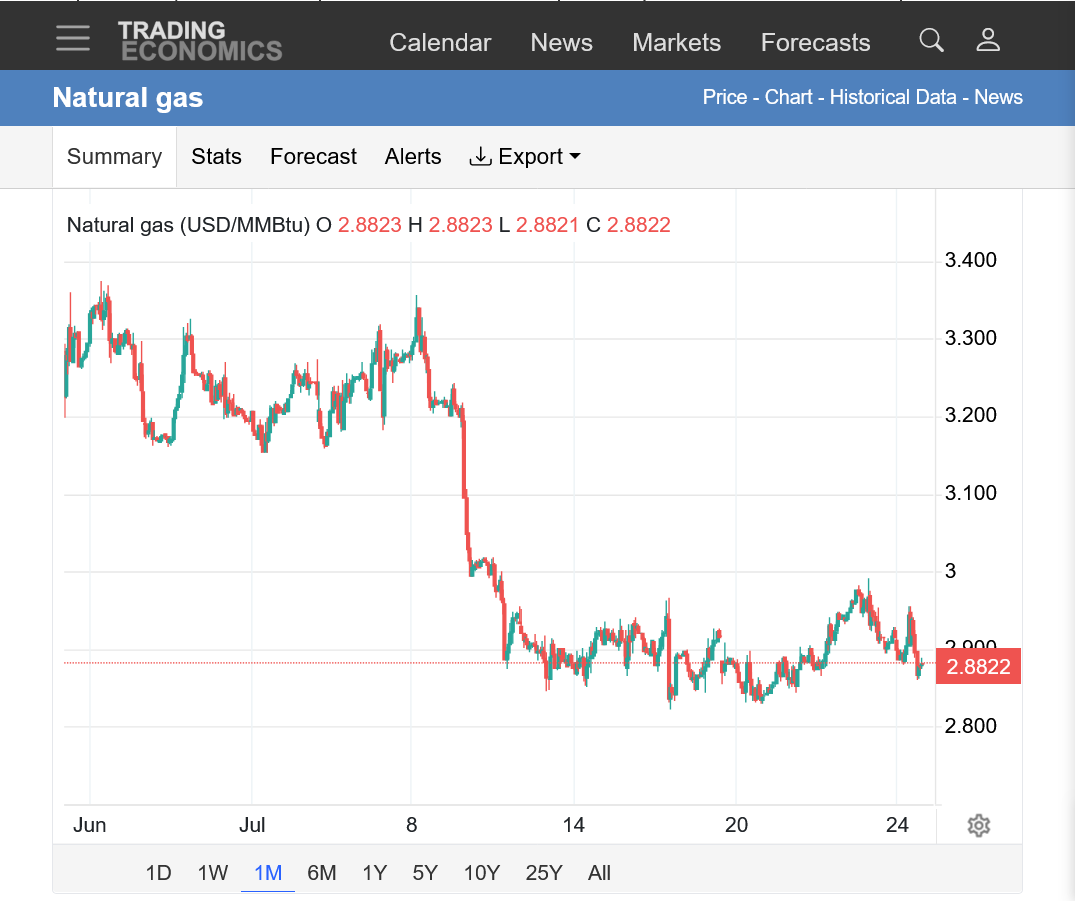
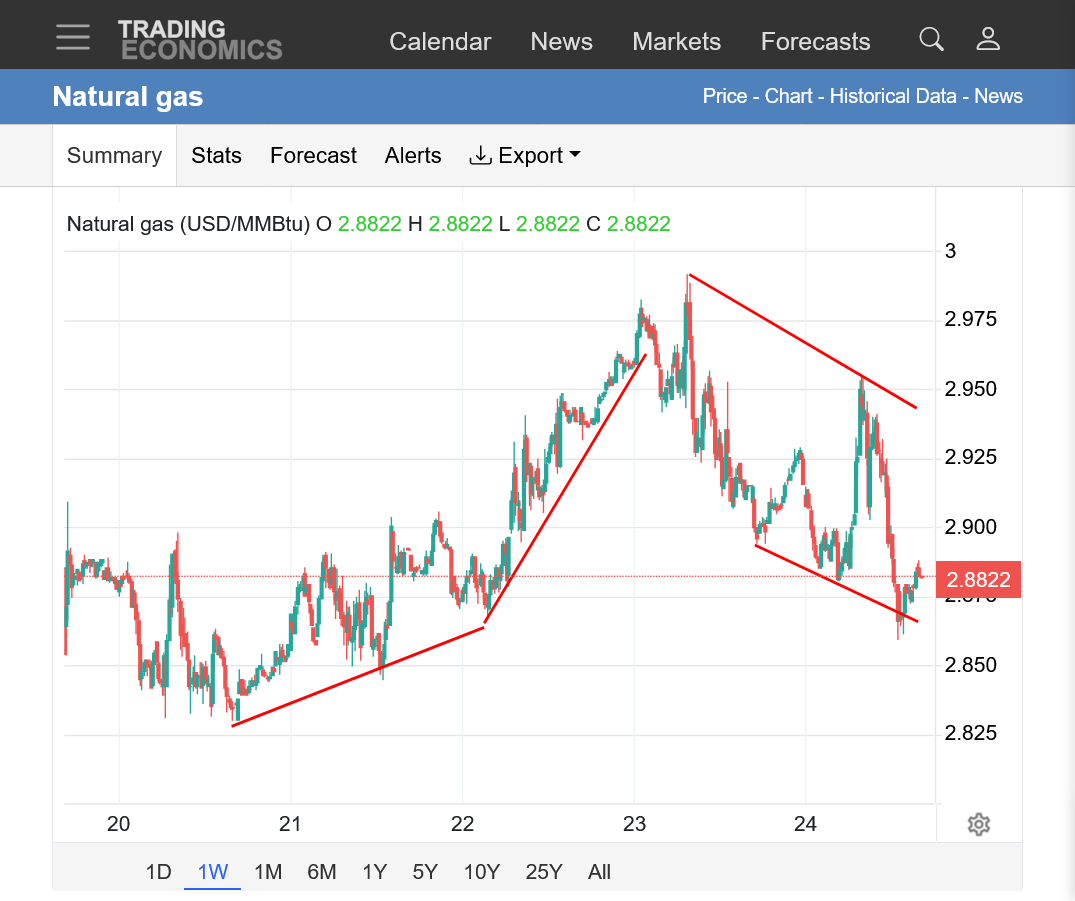
Natural gas could be close to a low here but its been going down, even with heat in the forecast so that's pretty bearish.
The front month, August expires today so a spike in 1 direction is always possible.
The overnight 0z European model was a bit hotter. After it came out, we still made new lows, so that's what I'm saying about the market inability to respond to bullish weather recently. Also the changes below(purple/right) are not a pattern change to hotter but instead, just a change in INDIVIDUAL DAYS with the same trajectory in the lines as before.
In other words, week 2 below on the right is HOTTER. But the last 4 data points, although hotter are still DROPPING with the same slope as the previous run, so it's still cooling but from a 1 day later, higher peak.
Still, its potentially BULLISH if future runs continue with hotter changes in week 2!
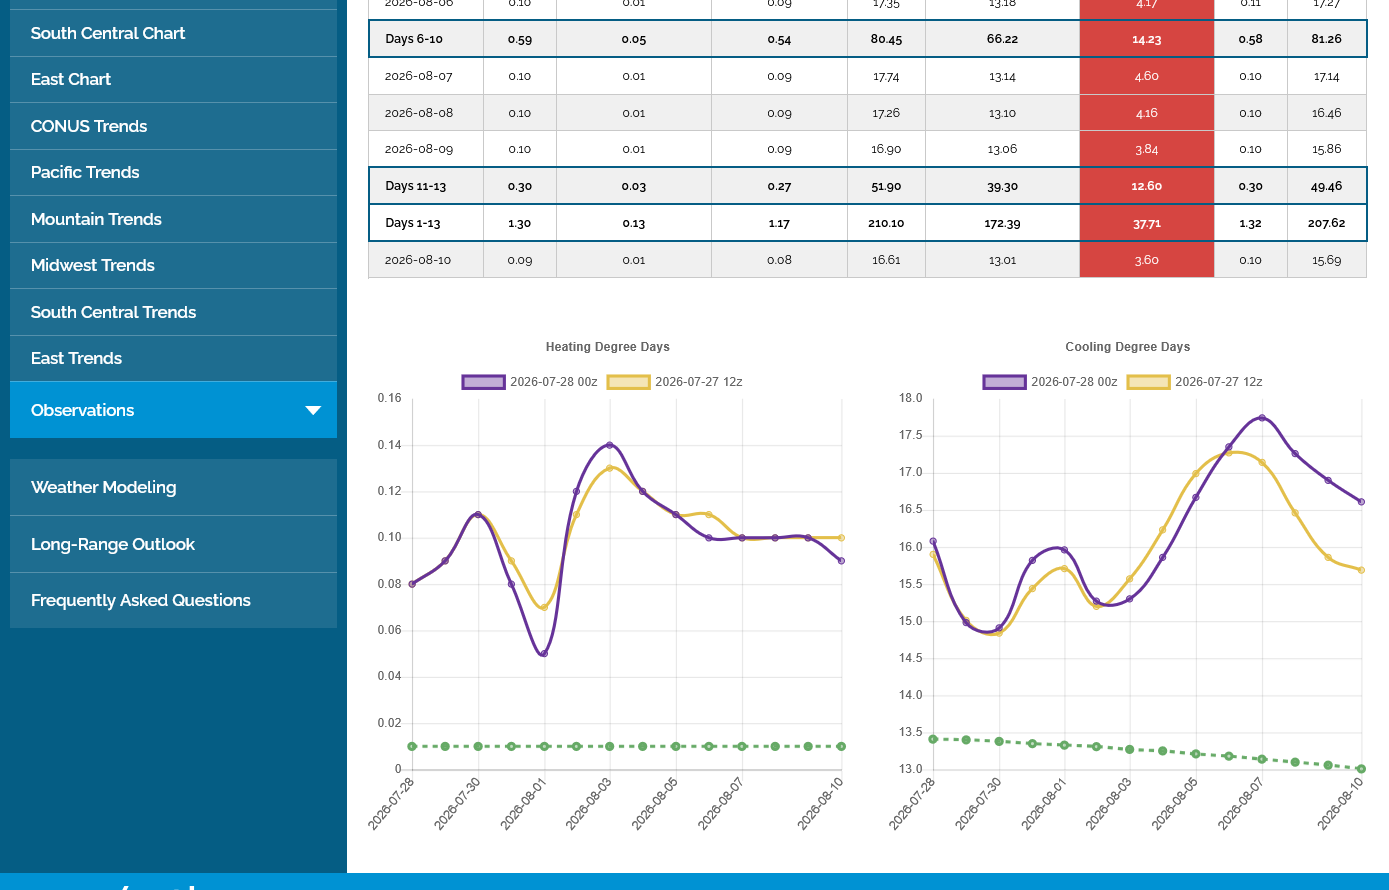
In looking at how ng responded to this overnight. It DID bounce briefly on the hotter chance, then dropped to new lows for the move BUT RECOVERED above the previous low.......so potentially bullish but again, the front month expires today.
I have not been trading natural gas this Summer or following extremely close am now and noted a GAP LOWER on Sunday Night in sympathy with the huge crude gap lower.
This is a downside break away gap and very bearish but could also be a gap and crap selling exhaustion at the end of a fairly long move down this Summer.
We should note at how bullish the CDDs have been the past few weeks, even if the heat is not in the highest population centers and the ng market still going DOWN. So this is a bear market unable to react to bullish heat or possibly having dialed it into the price on forecasts early this Summer.
This was the Sunday Night gap lower below:
https://tradingeconomics.com/commodity/natural-gas
There could be an especially bearish fundamental related to the war in Iran. Producers could be ramping up natural gas production in the United States in tandem with ramping up crude production and this is pressuring our prices more because ng prices are not as influenced as much from the global market as crude oil prices are.
I'm just searching for a reason for NG to be so incredibly bearish recently, even after crude bottomed and soared back higher.
I see first support about 2.59ish on the weekly continuous chart. The flag points to that same area.
Why do you birds have to peck at us worms? Cutworm LOL
Good one, cutworm!
cutworm is referring to this comment:
By metmike - July 27, 2026, 9:45 p.m.
++++++++++++++
I will say, cutworm that using that figurative expression about the early bird catching the worm and applying it to you, that as a trader, when you put your trading hat on and apply your knowledge/experience and highly developed analytical skills, that those early birds don't see you as food..........they see you as ONE OF THEM!
And knowing your posting here for the past 2 decades, even more impressive is your incredible integrity and honesty that makes me honored to have you as a friend and poster here.
For those that don't know, both of us live in Indiana, me in the southwest corner and cutworm in the southeast corner. He's a producer that understands farming from actually doing it. I learned what I know about agronomy from gardening and reading on the internet.
How much rain did you get last night, cutworm. How's your crop doing?
++++++++++++
I see your support area, drawn on the 1 year chart below.
https://tradingeconomics.com/commodity/natural-gas
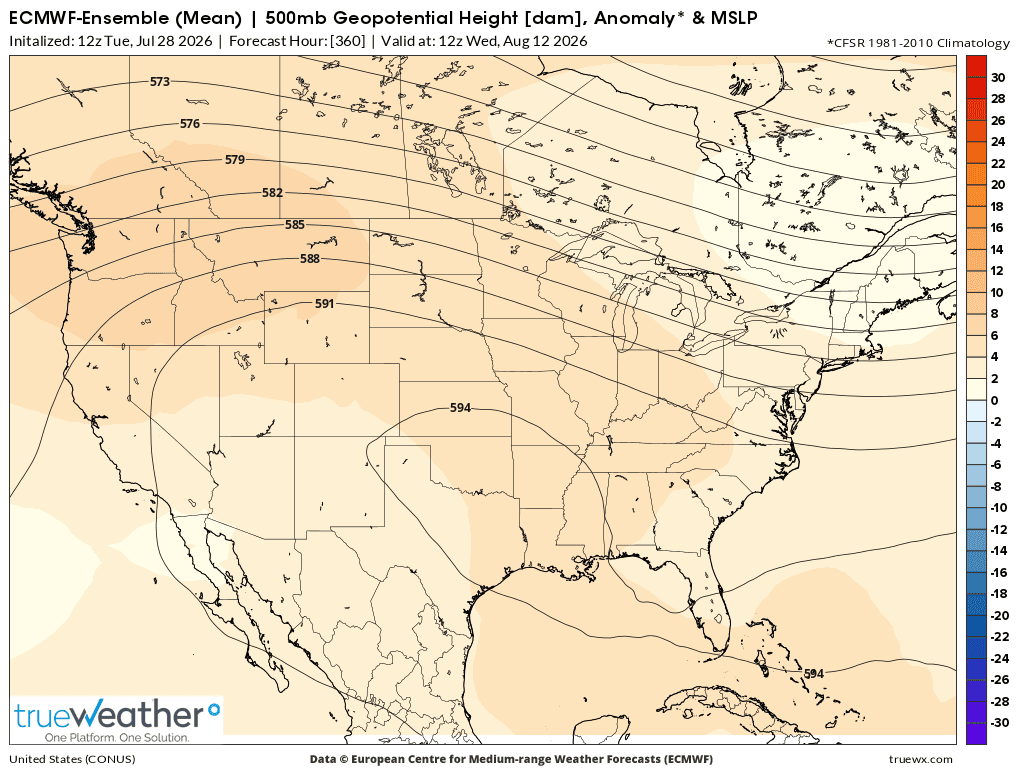
For me, I would like to see the heat ridge SHIFT FARTHER EAST/SOUTHEAST in August to impact the high population centers that gobble up the most ng to generate electricity for air conditioning.
My favorite trading set ups are selling highs(like the beans late last week) and buying lows like the natural gas MIGHT be making on big weather pattern changes.
Natural gas has some mega bearish fundamentals(and trader mentality) right now that have been crushing the weather's impact.
I've not studied current production recently but would suspect that we are gushing it out.
Your assessment of me is overly kind.
And humble too!
How's your crop and how much rain, cutworm?
5:15pm: I told you that I've not been following ng that close recently. The front month apparently expires tomorrow, not today.
+++++++++++
The last 12z European Ensemble model was -4 CDDs cooler than the previous run.
Mainly from individual days again.
Again, I want to see this heat ridge move farther east where more people live to try to pick a bottom here in this bear market.
Just look at the graph below and how much above the seasonal average in green the CDDs are already.............while ng crashes lower anyways.
BTW, the season peak in temperatures happened a week ago and now we are in a slow decline but each year is different. This Summer has been a HOT one overall. Just a matter of where the heat ridges have been and will be as they move around the country.
This was the last 500 mb map for 2 weeks(day 15) from the 3 main models. Heat ridge in the center and bullish for crop prices. Weak troughing East Coast, NOT bullish for natural gas prices.
1. European Ensemble
2. GEFS(American model)
3. Canadian Ensemble
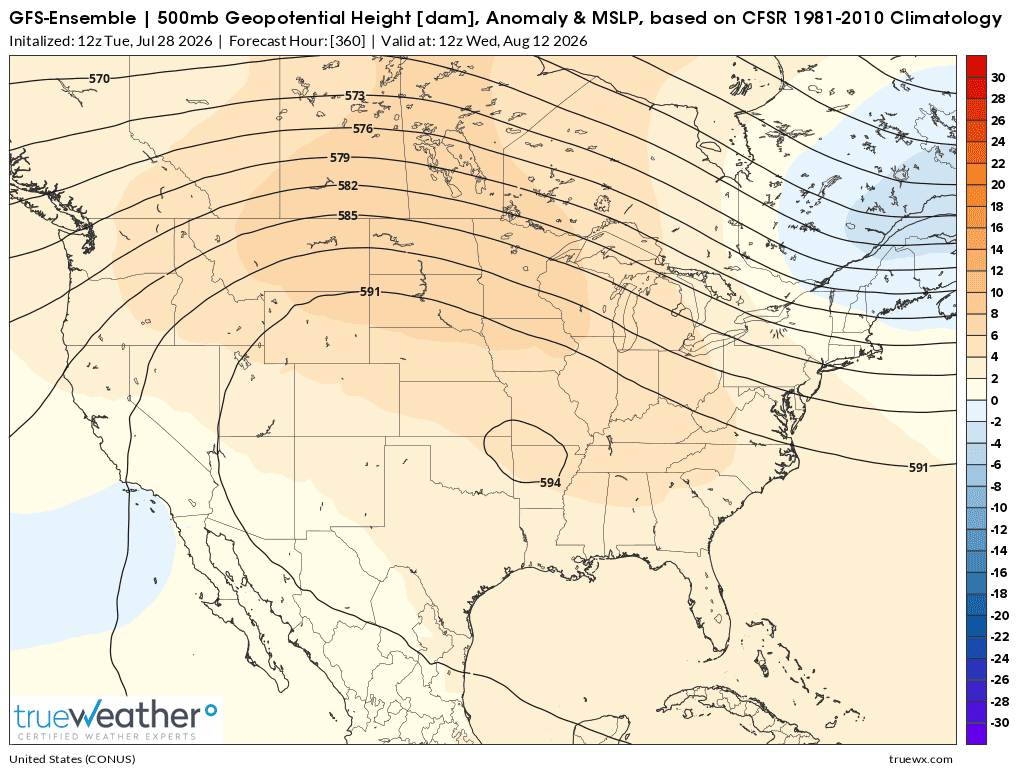
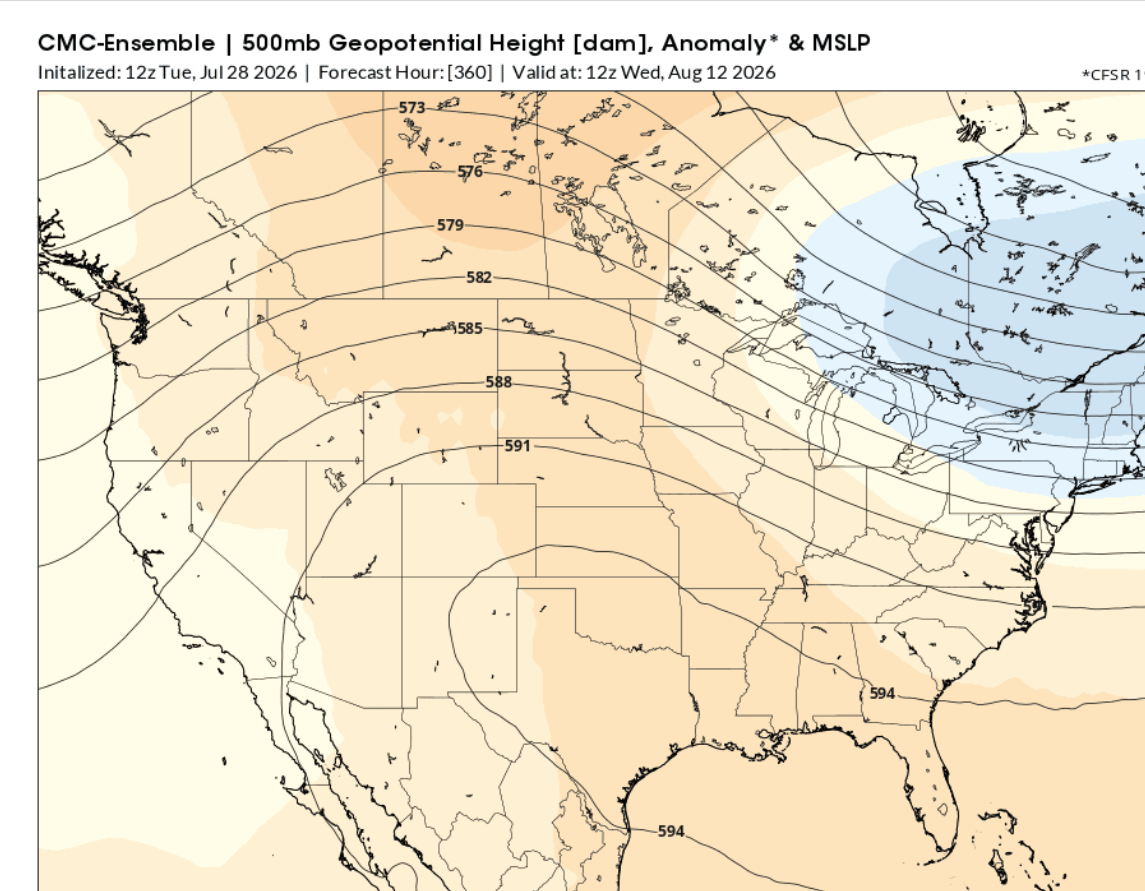
Cool Northeast, HOT West and Southeast.
https://www.cpc.ncep.noaa.gov/products/tanal/temp_analyses.php

+++++++++++++
Bullish number!!! Just +28
for week ending July 24, 2026 | Released: July 30, 2026 at 10:30 a.m. | Next Release: August 6, 2026
| Working gas in underground storage, Lower 48 states Summary text CSV JSN | |||||||||||||||||||||||||
|---|---|---|---|---|---|---|---|---|---|---|---|---|---|---|---|---|---|---|---|---|---|---|---|---|---|
| Historical Comparisons | |||||||||||||||||||||||||
| Stocks billion cubic feet (Bcf) | Year ago (07/24/25) | 5-year average (2021-25) | |||||||||||||||||||||||
| Region | 07/24/26 | 07/17/26 | net change | implied flow | Bcf | % change | Bcf | % change | |||||||||||||||||
| East | 654 | 631 | 23 | 23 | 649 | 0.8 | 631 | 3.6 | |||||||||||||||||
| Midwest | 789 | 766 | 23 | 23 | 762 | 3.5 | 740 | 6.6 | |||||||||||||||||
| Mountain | 238 | 240 | -2 | -2 | 242 | -1.7 | 203 | 17.2 | |||||||||||||||||
| Pacific | 307 | 314 | -7 | -7 | 301 | 2.0 | 264 | 16.3 | |||||||||||||||||
| South Central | 1,096 | 1,105 | -9 | -9 | 1,162 | -5.7 | 1,063 | 3.1 | |||||||||||||||||
| Salt | 303 | 317 | -14 | -14 | 317 | -4.4 | 278 | 9.0 | |||||||||||||||||
| Nonsalt | 793 | 788 | 5 | 5 | 844 | -6.0 | 784 | 1.1 | |||||||||||||||||
| Total | 3,084 | 3,056 | 28 | 28 | 3,116 | -1.0 | 2,899 | 6.4 | |||||||||||||||||
| Totals may not equal sum of components because of independent rounding. | |||||||||||||||||||||||||
Working gas in storage was 3,084 Bcf as of Friday, July 24, 2026, according to EIA estimates. This represents a net increase of 28 Bcf from the previous week. Stocks were 32 Bcf less than last year at this time and 185 Bcf above the five-year average of 2,899 Bcf. At 3,084 Bcf, total working gas is within the five-year historical range.
For information on sampling error in this report, see Estimated Measures of Sampling Variability table below.
++++++++++++
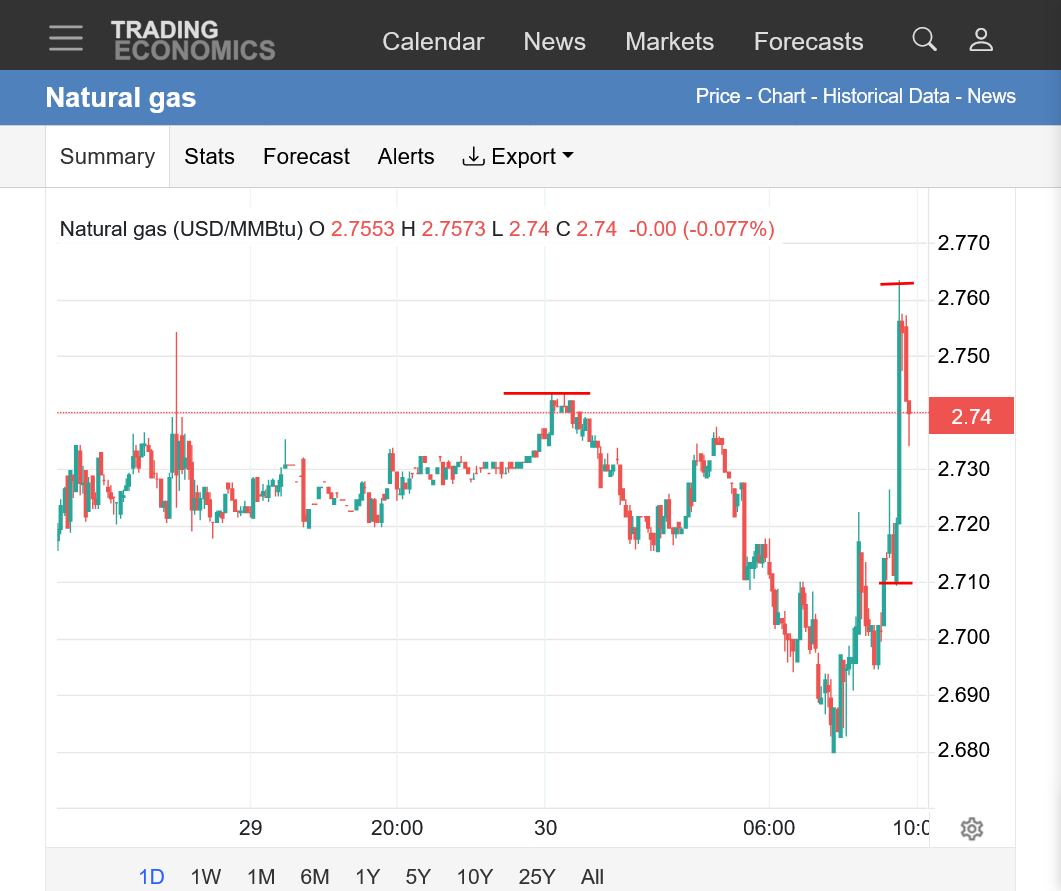
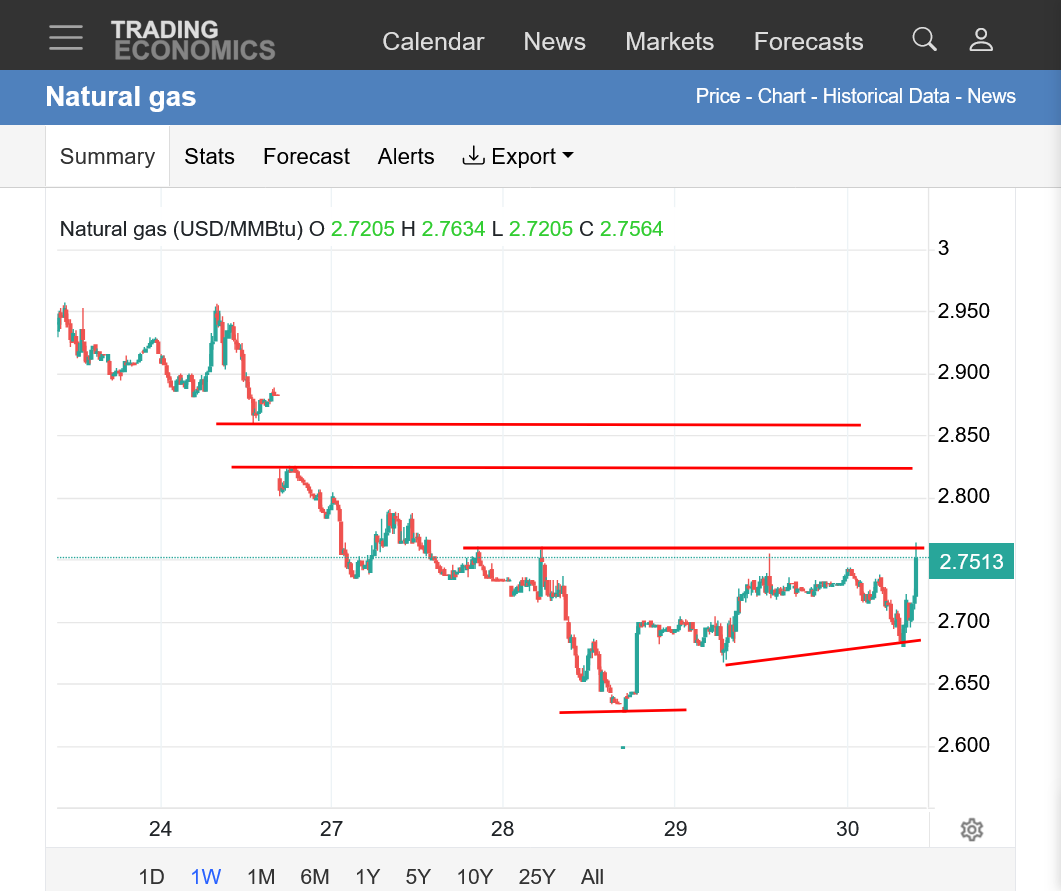
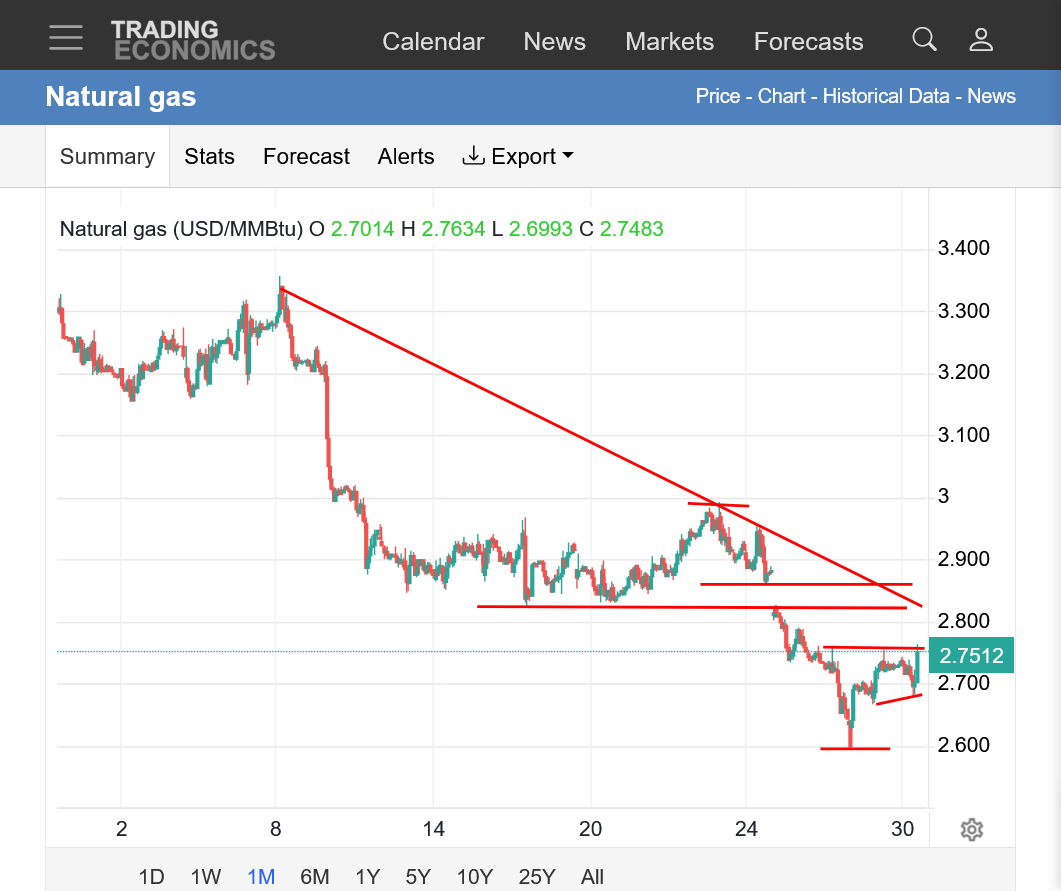
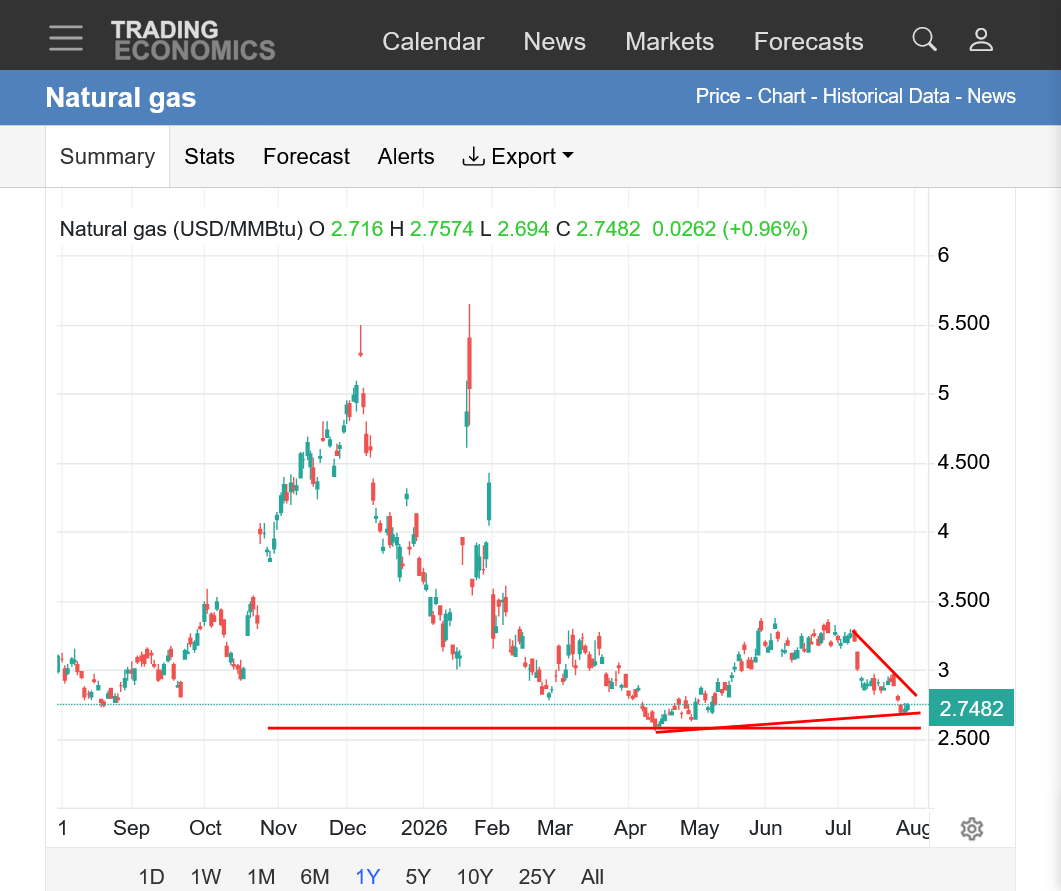
9:47 am
https://tradingeconomics.com/commodity/natural-gas
1. 1 day with spike up from the bullish EIA report
2. 1 week: Note the downside breakaway gap lower this past Sunday Night. Are the lows in? Was this a selling exhaustion gap?
3. 1 month: Downtrend. Downside break away gap.....or is it an exhaustion gap with the lows in???
4. 1 year: cutworm's line of support. Are the lows in?
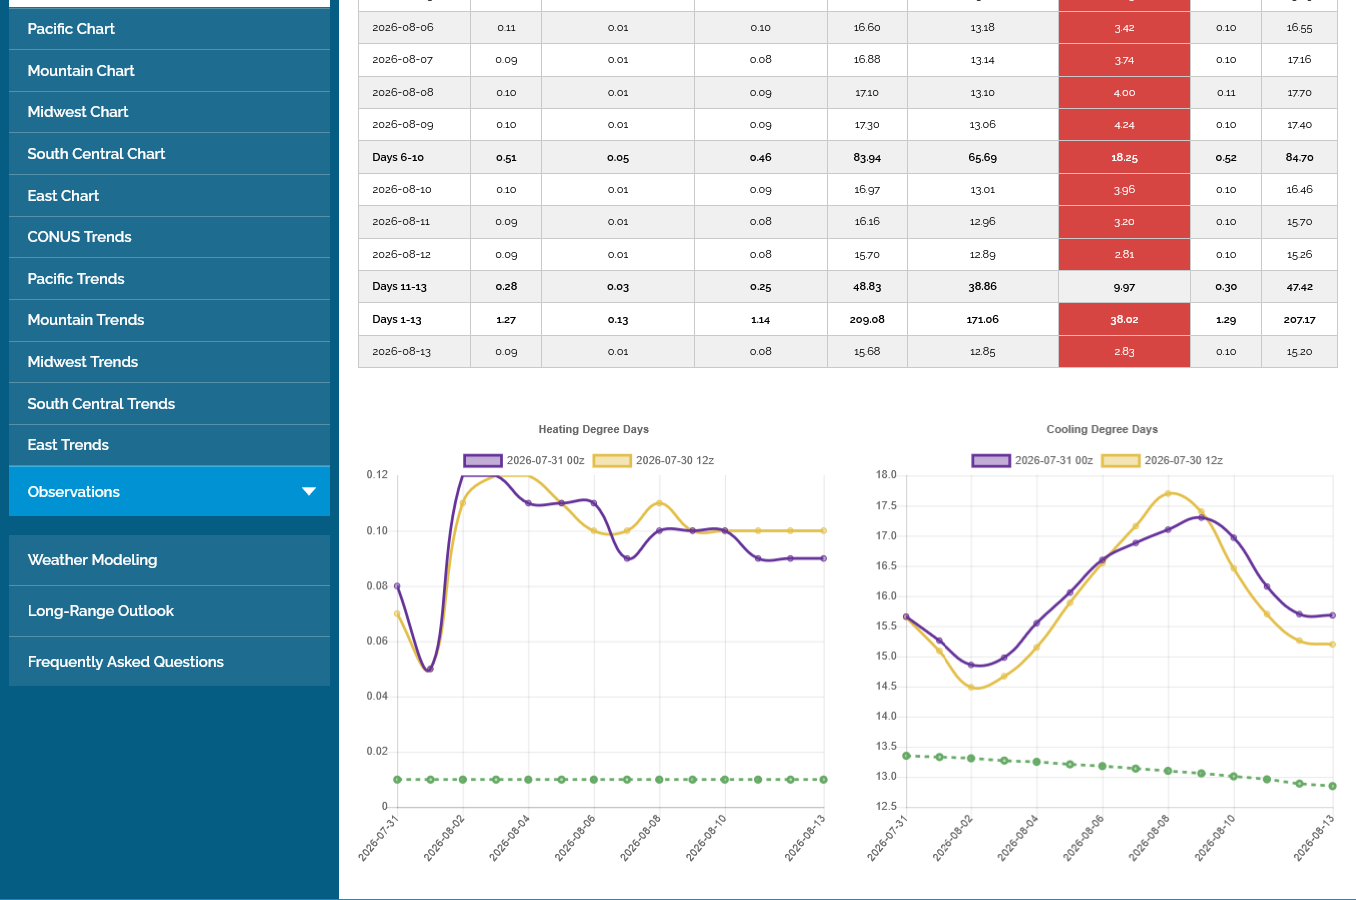
Although the actual CDDs were higher on the last EE model and slightly bullish because of individual days, the trajectory at the end is still DOWN.
When this first came out overnight, it likely caused ng to make new highs for the session and above Thursday's highs after the bullish EIA release.
Since then, the funds came in and sold us to new lows for the session.
Its funny but sometimes we blame "the funds" for day session moves that are the opposite of night session moves when that's not always the case.
https://www.marketforum.com/forum/topic/83844/#83852
Still plenty of heat but much farther SOUTH and east, where a lot of people use air conditioning. Could turn bullish for natural gas!
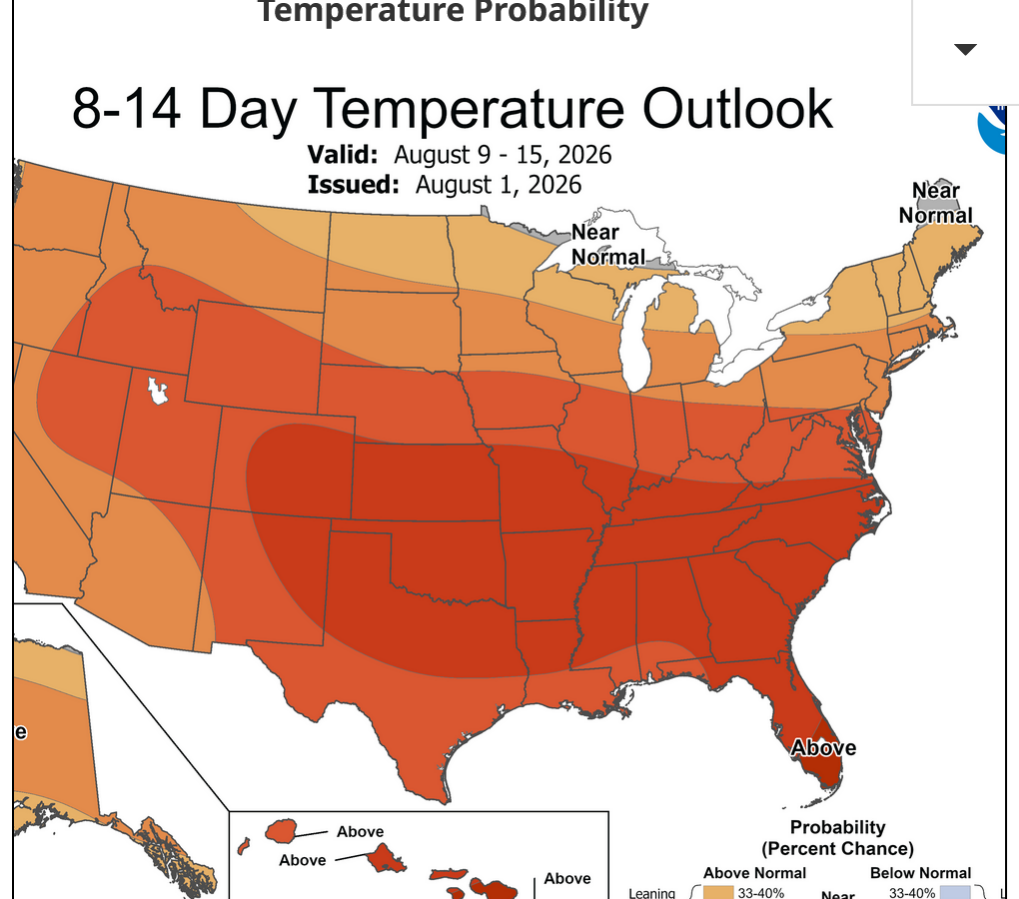
The market had a very strong PM/close on Friday after the 12z guidance, especially the European Ensemble model came out hotter.
Natural gas traders on hyperlink were fooled and way too bullish(not bearish enough this weekend) !!!!
Traders there thought we would open higher than we did but we opened lower instead.
https://hyperdash.com/asset/NATGAS
%20Price%20Chart%20%26%20Trading%20Hyperdash.png)
We opened at 2.745, with the hyperdash market trading close to 2.77 just before that which is a $250/contract difference lower open.
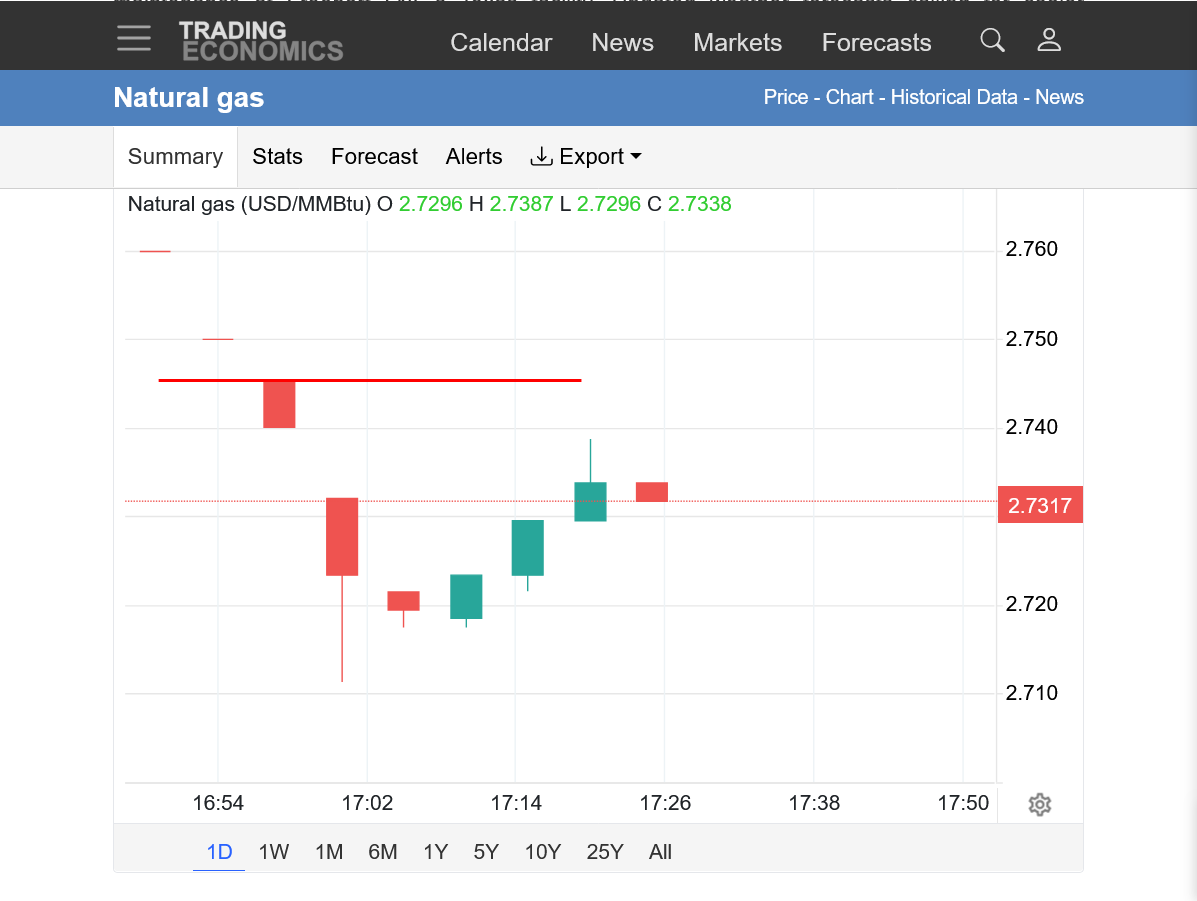
The open below is the red horizontal line on the far right on this graph that's not completely accurate. That open was also the high so far but we are bouncing back at the moment.
https://tradingeconomics.com/commodity/natural-gas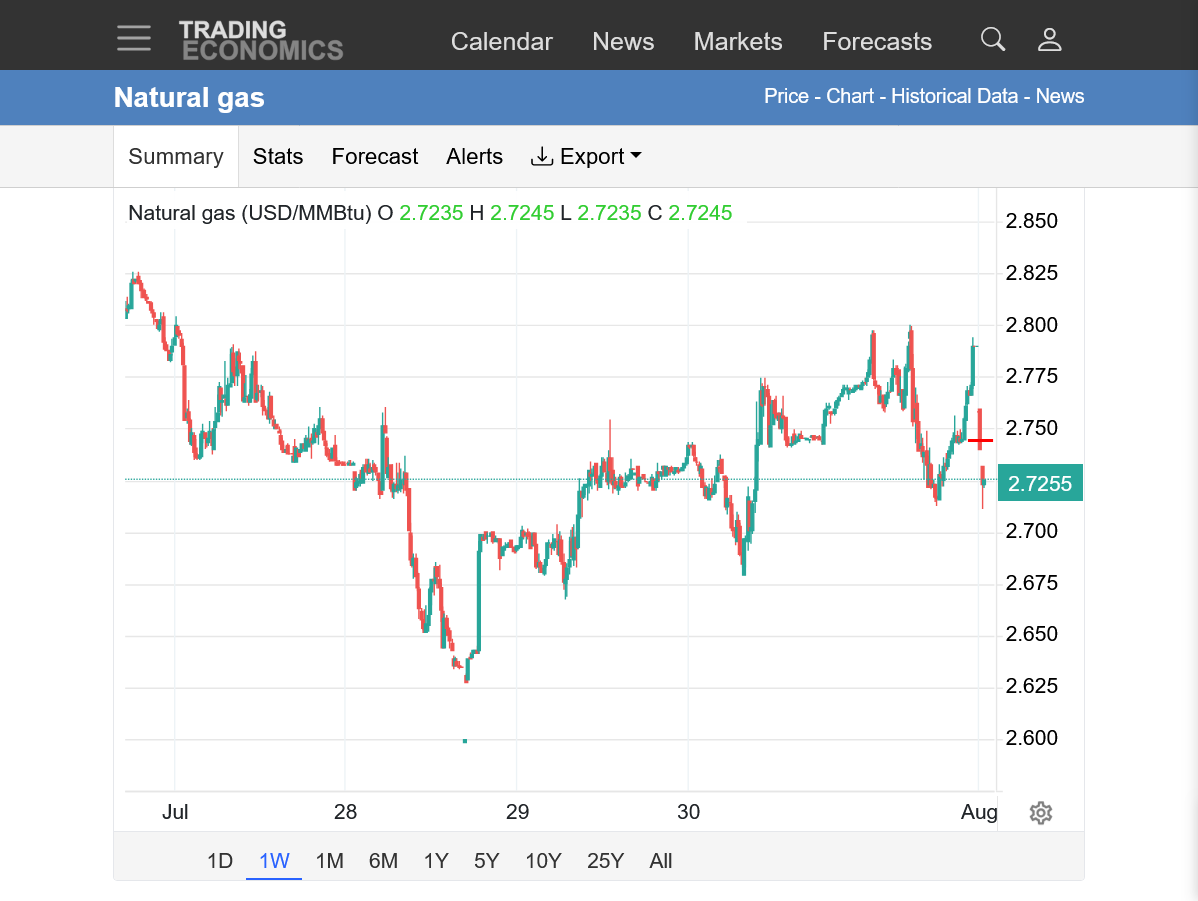
Here's a better look at the past 30 minutes BELOW using candlesticks. The open is at the top:
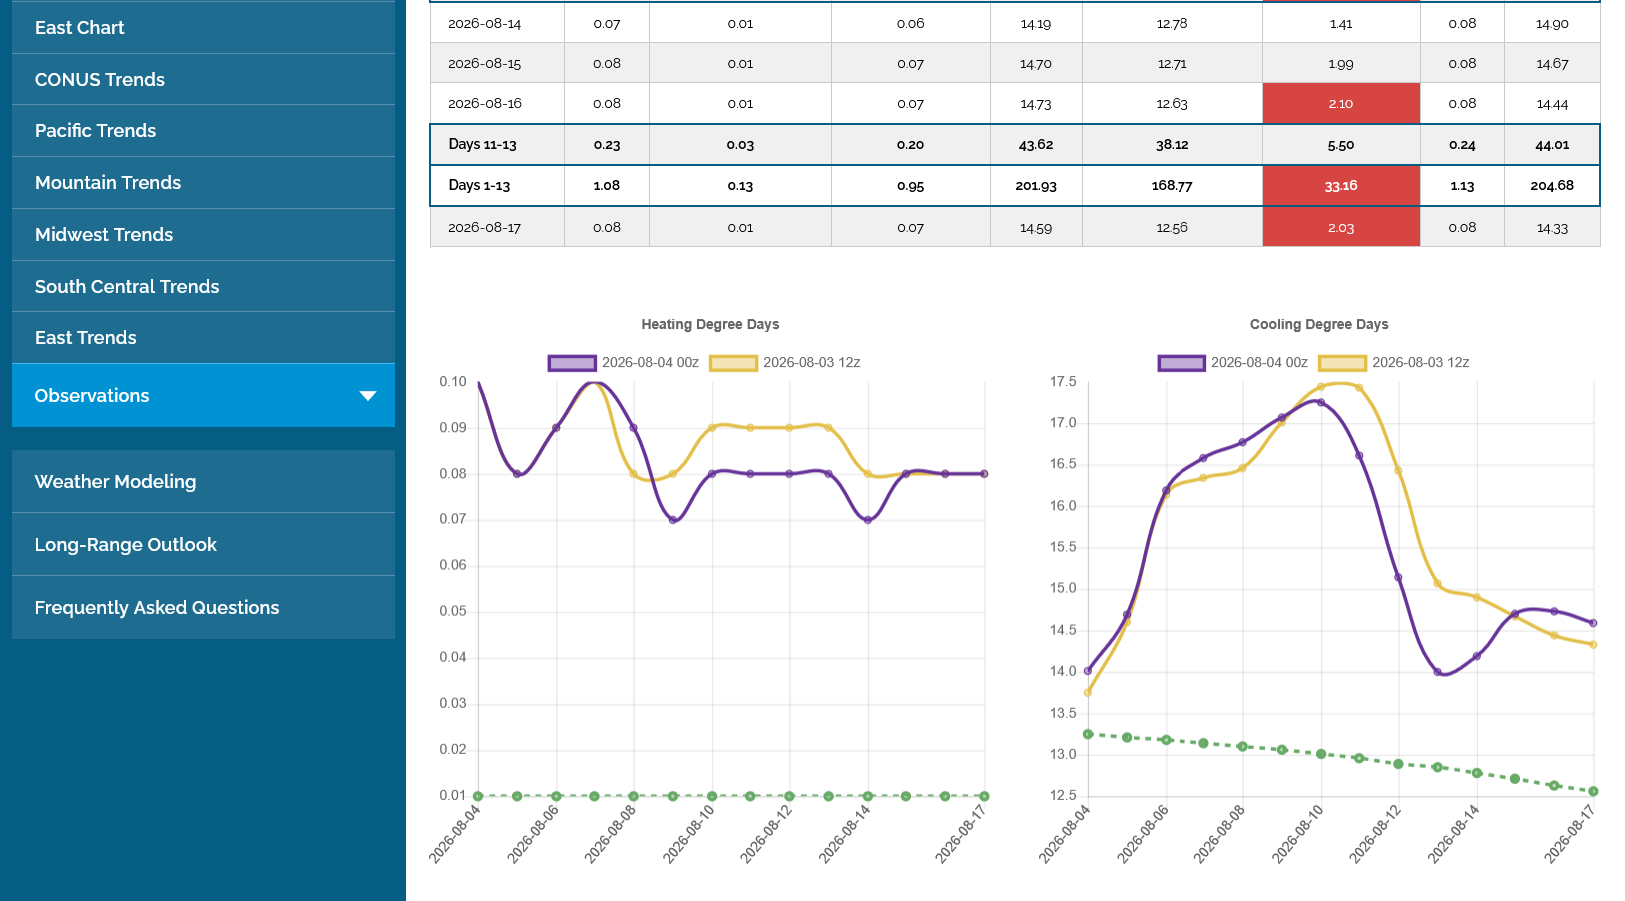
The overnight guidance took out an enormous amount of heat in the forecast especially in the Midwest!
This was the last 0z European Ensemble model in purple/right for the entire country(the one we always use). Previous 1 from 12 hours earlier. -3 CDDs on the last run:
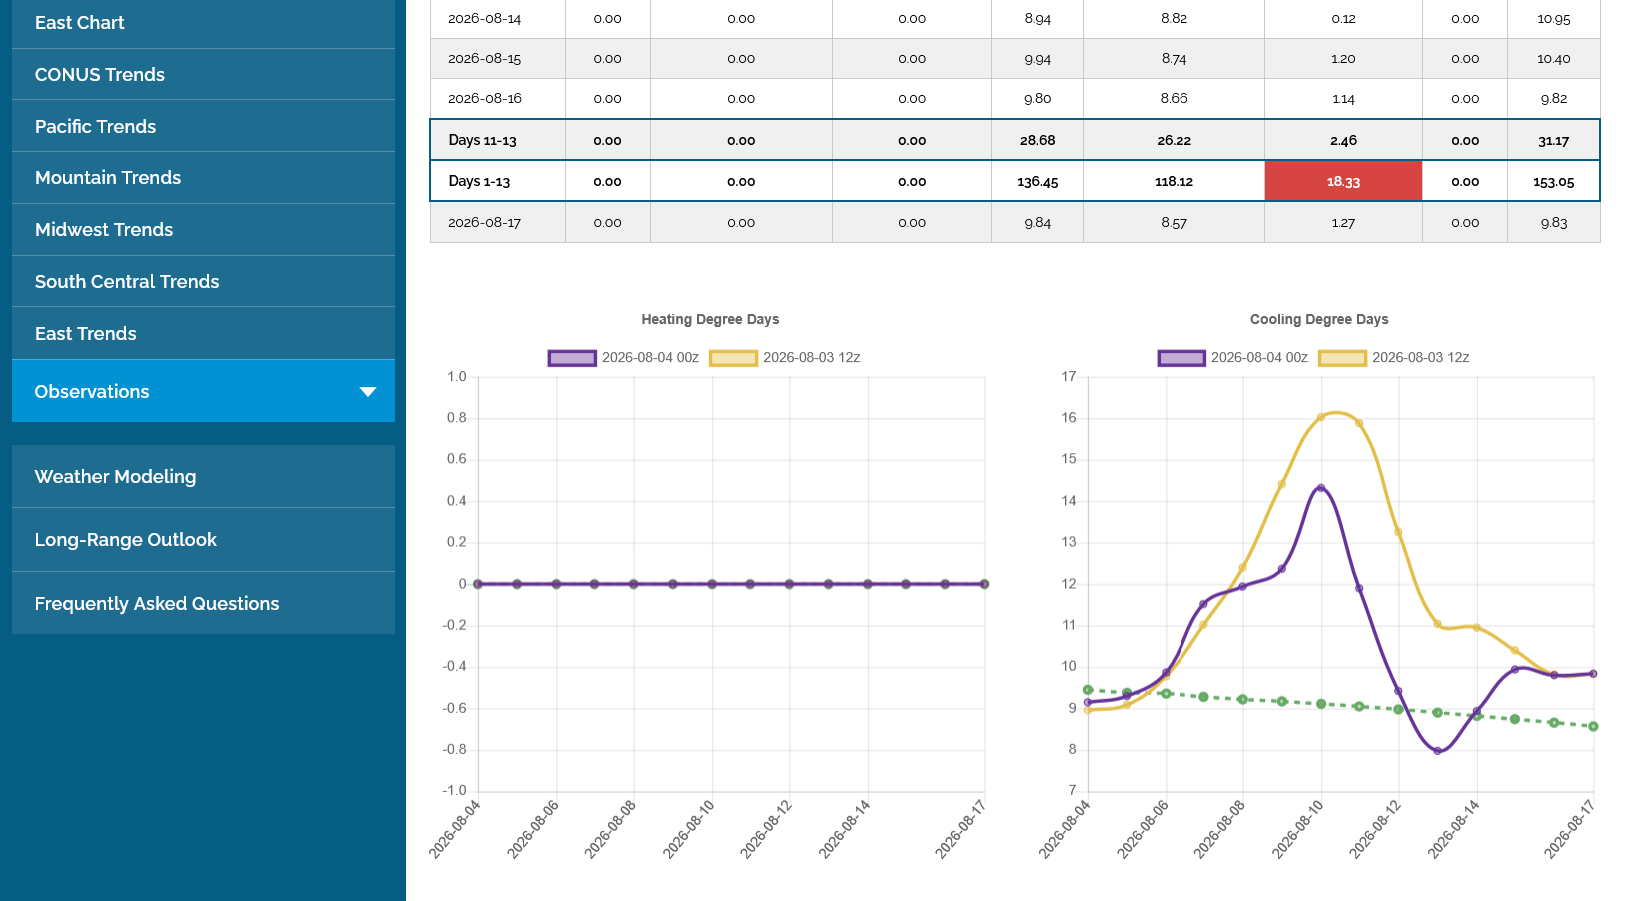
Look at the mind bogging cooler change for just the Midwest. -17 CDDs for just 1 run!!!!
+++++++++
https://tradingeconomics.com/commodity/natural-gas
1. 1 week: Top/right=Price/time when MUCH cooler weather models came out. Bottom line=last weeks lows. 2nd line=price before the BULLISH EIA was released.
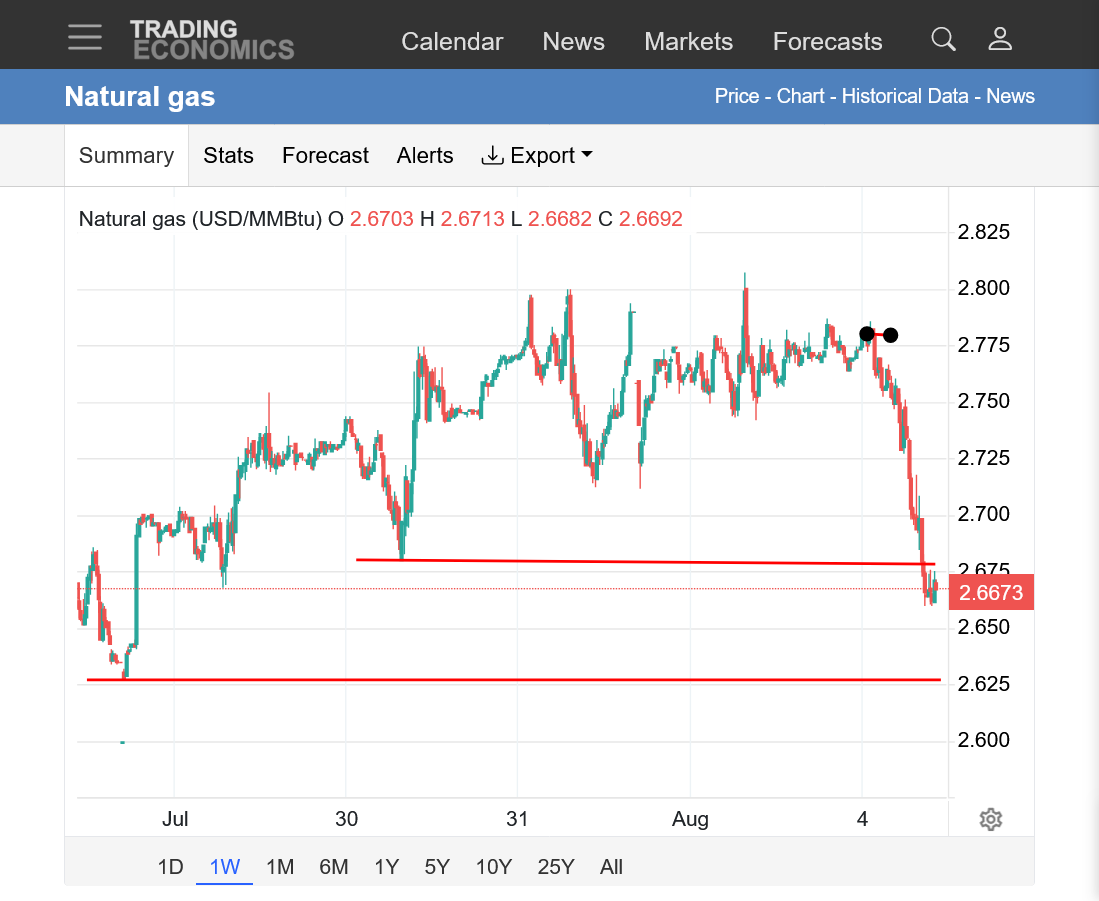
No changes to the weather forecast!
These were the 7 day temperatures for Thursday's EIA report at 9:30am.
EXTREME HEAT in the center. Mild along the East Coast.
https://www.cpc.ncep.noaa.gov/products/tanal/temp_analyses.php

for week ending July 31, 2026 | Released: August 6, 2026 at 10:30 a.m. | Next Release: August 13, 2026
| Working gas in underground storage, Lower 48 states Summary text CSV JSN | |||||||||||||||||||||||||
|---|---|---|---|---|---|---|---|---|---|---|---|---|---|---|---|---|---|---|---|---|---|---|---|---|---|
| Historical Comparisons | |||||||||||||||||||||||||
| Stocks billion cubic feet (Bcf) | Year ago (07/31/25) | 5-year average (2021-25) | |||||||||||||||||||||||
| Region | 07/31/26 | 07/24/26 | net change | implied flow | Bcf | % change | Bcf | % change | |||||||||||||||||
| East | 678 | 654 | 24 | 24 | 655 | 3.5 | 644 | 5.3 | |||||||||||||||||
| Midwest | 809 | 789 | 20 | 20 | 774 | 4.5 | 756 | 7.0 | |||||||||||||||||
| Mountain | 237 | 238 | -1 | -1 | 248 | -4.4 | 206 | 15.0 | |||||||||||||||||
| Pacific | 304 | 307 | -3 | -3 | 305 | -0.3 | 264 | 15.2 | |||||||||||||||||
| South Central | 1,090 | 1,096 | -6 | -6 | 1,147 | -5.0 | 1,052 | 3.6 | |||||||||||||||||
| Salt | 292 | 303 | -11 | -11 | 299 | -2.3 | 267 | 9.4 | |||||||||||||||||
| Nonsalt | 798 | 793 | 5 | 5 | 849 | -6.0 | 785 | 1.7 | |||||||||||||||||
| Total | 3,117 | 3,084 | 33 | 33 | 3,129 | -0.4 | 2,922 | 6.7 | |||||||||||||||||
| Totals may not equal sum of components because of independent rounding. | |||||||||||||||||||||||||
Working gas in storage was 3,117 Bcf as of Friday, July 31, 2026, according to EIA estimates. This represents a net increase of 33 Bcf from the previous week. Stocks were 12 Bcf less than last year at this time and 195 Bcf above the five-year average of 2,922 Bcf. At 3,117 Bcf, total working gas is within the five-year historical range.
For information on sampling error in this report, see Estimated Measures of Sampling Variability table below.
Note: The shaded area indicates the range between the historical minimum and maximum values for the weekly series from 2021 through 2025. The dashed vertical lines indicate current and year-ago weekly periods.
+++++++++++++
Spike down to new life of contracts lows!
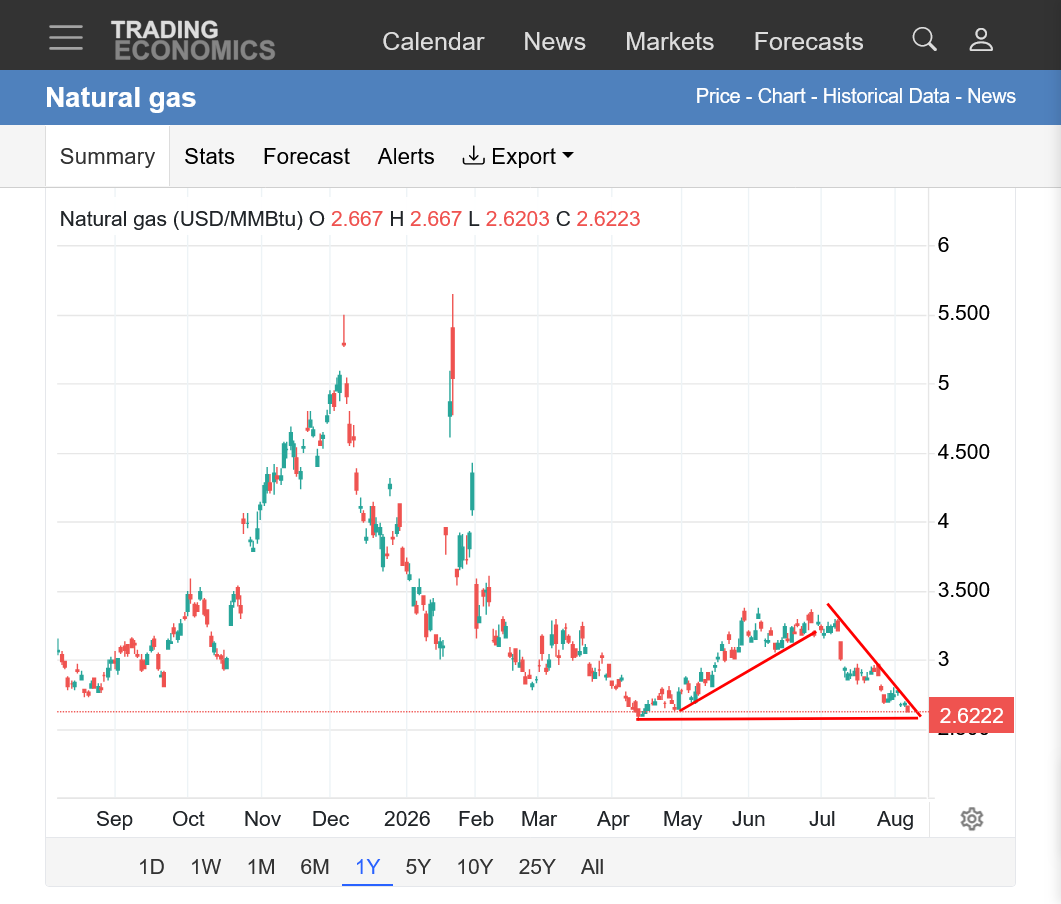
https://tradingeconomics.com/commodity/natural-gas
1. 1 year graph with cutworm's continuous chart support line at the bottom. Uptrend from late seasonal bottom that started at that support level after the mild end to the CDD season(bearish) kept the market under pressure well into April. Double/triple Summer top from heat with a sharp downtrend the past month.
Potential heat returning late this month:
Re: Re: Re: Re: Re: Re: Re: Re: Grains, Aug 3
By metmike - Aug. 6, 2026, 11:22 a.m.
Nat Gas had a small daily gap higher on the open and caused my buy order to barely NOT get filled but that's life and I cancelled it since filling the gap now makes it less bullish.
Regardless, the time/place, seasonal and weather forecast have a bullish tilt to them at the moment.
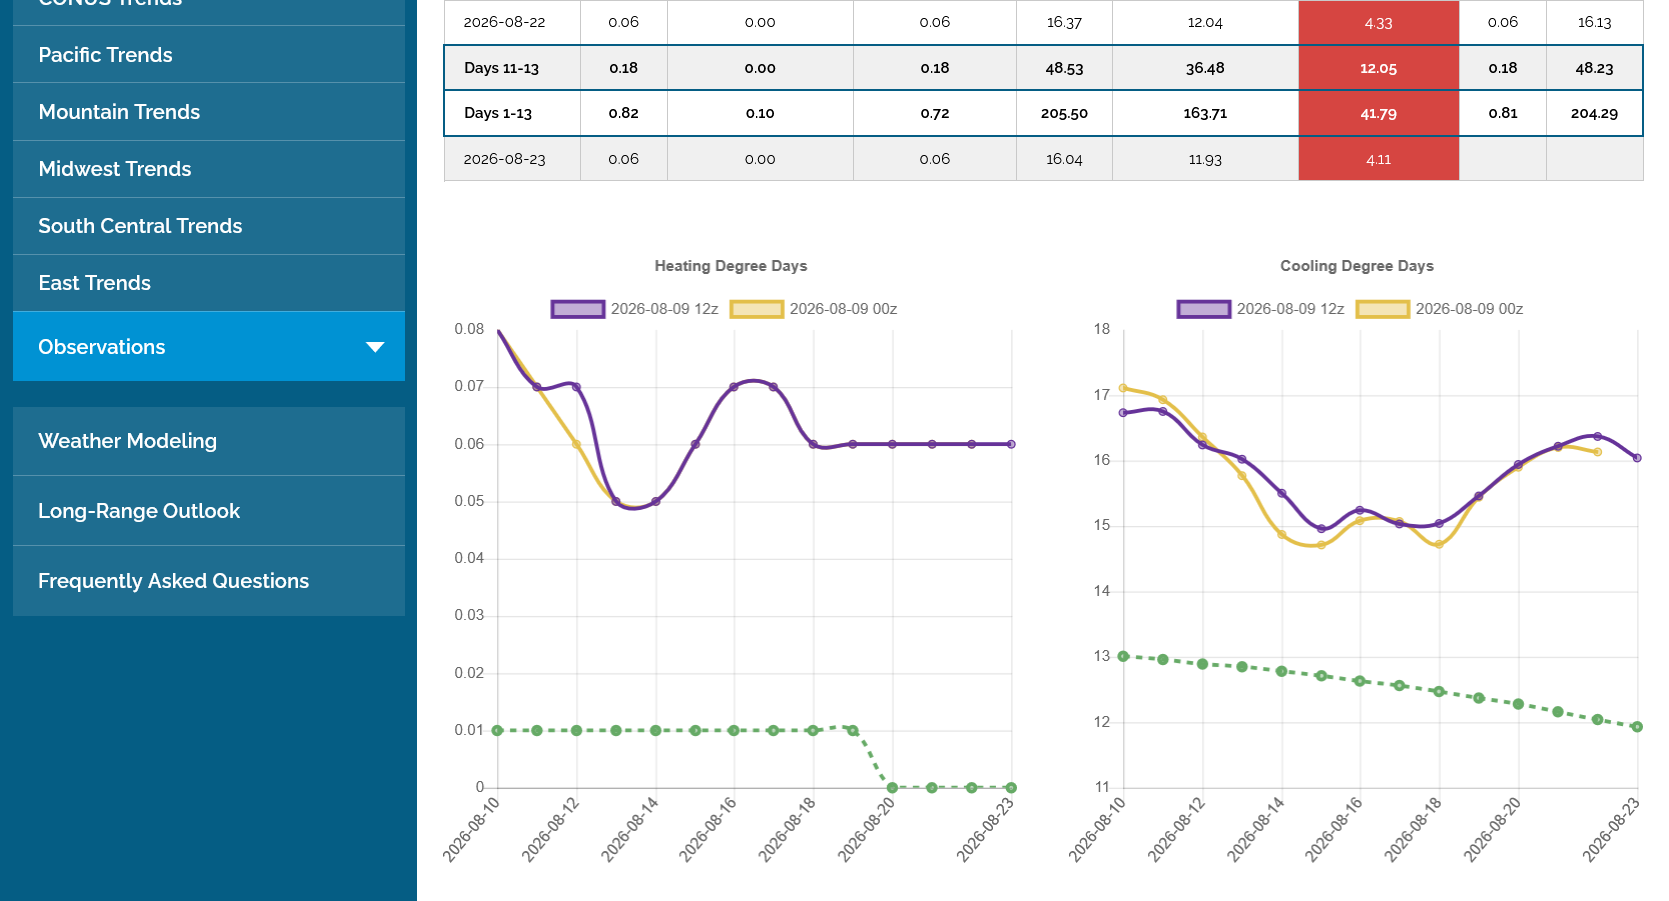
The last 12z European Ensemble model below in purple was +1 CDD vs the previous run 12 hours earlier.
Note how elevated those lines are compared to the seasonal/climatology in green that is dropping as we slowly cool off in August. In fact, the heat will actually increase in week 2 and cause the CDD differential to go up.
+++++++++
6:55pm:
This source is not accurately graphing natural gas. However the bottom 2 lines I drew show the daily gap higher between Friday's high and the open/low tonight.
The top red line was the high so far tonight that spiked up there 6 minutes after the open.
https://tradingeconomics.com/commodity/natural-gas
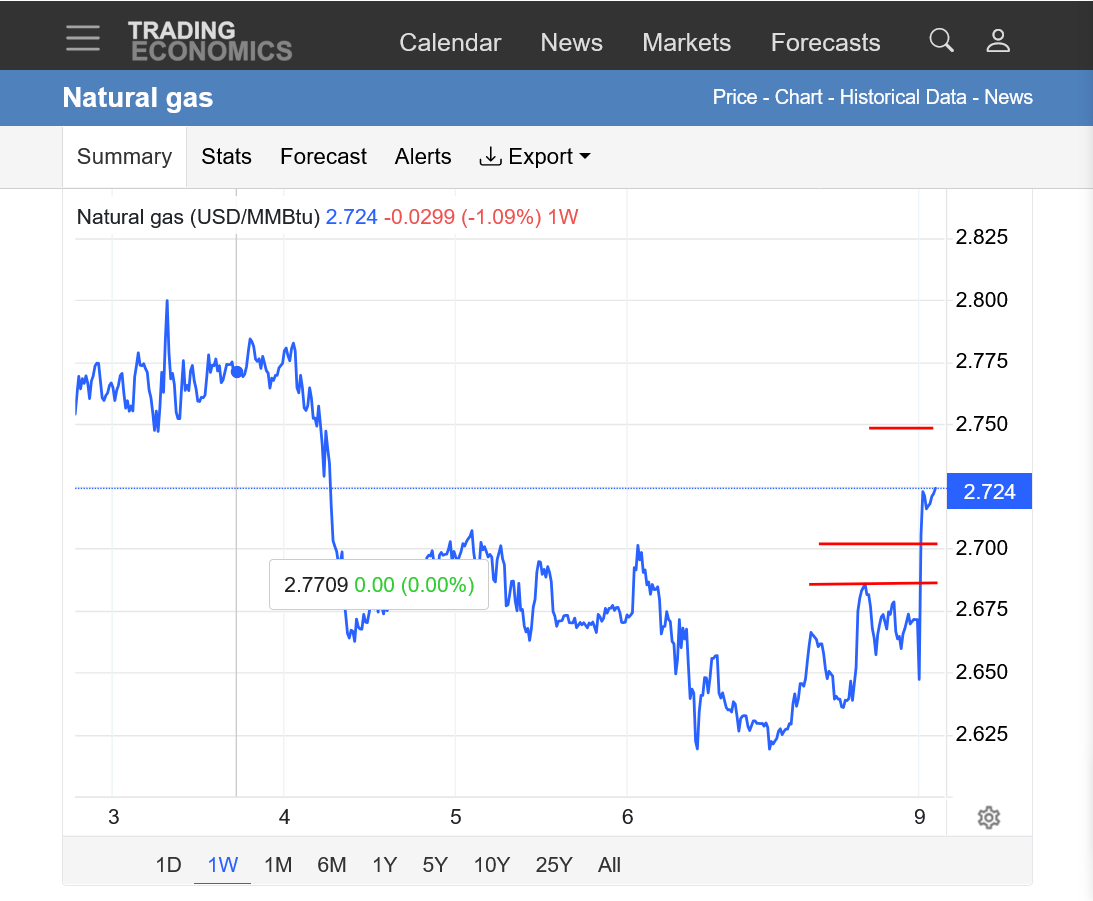
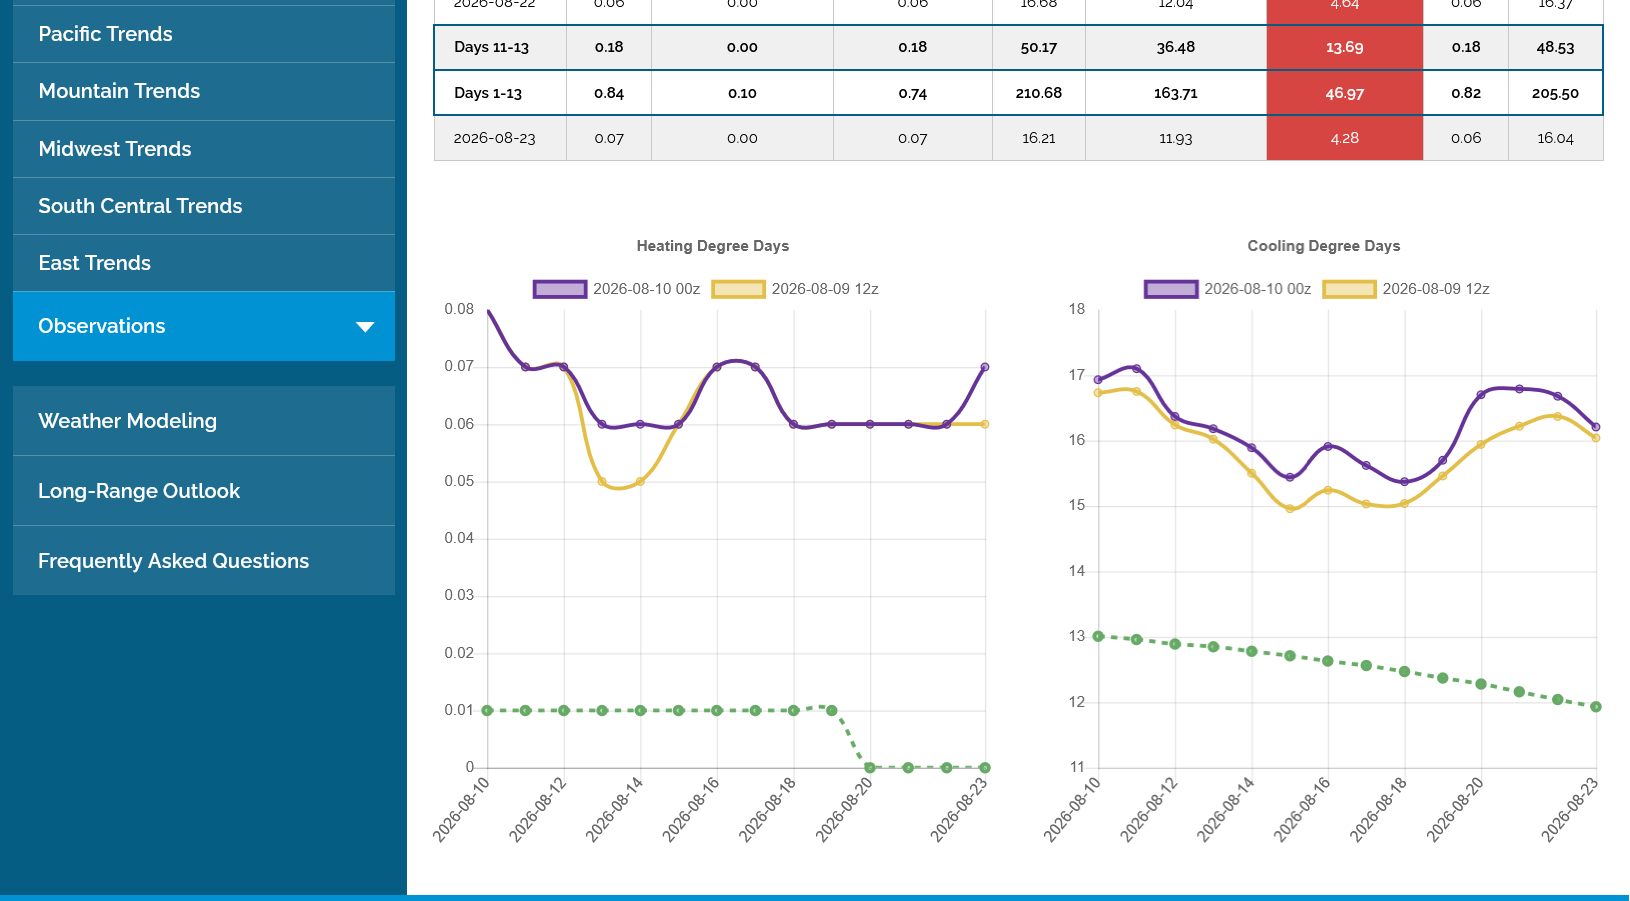
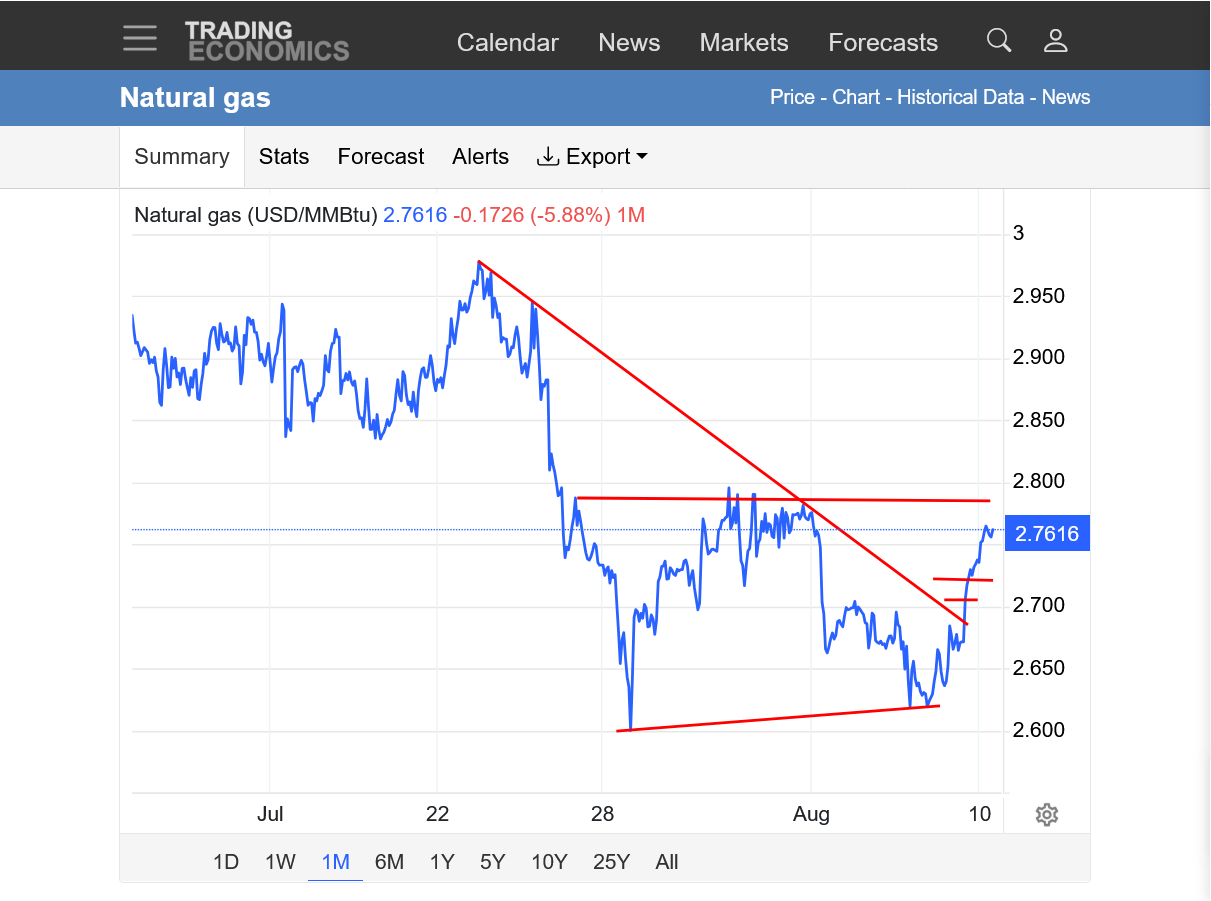
Natural gas continued higher overnight to confirm the upside break away gap on the Sunday Night open. This is very significant because it took place after a lengthy move down, near the lows after a reversal up in momentum, along with the seasonal also turning up and finally THE WEATHER FORECAST TURNING HOTTER which is the main driving force right now.
Overnight, the 0Z European Ensemble model, purple line on the right was ANOTHER +5 CDDs vs the previous run from 12 hours earlier which supported the move up all night.
https://tradingeconomics.com/commodity/natural-gas
1 month. Lines drawn:
1. Broken downtrend line.
2. Higher lows/bottom.
3. Upside break away GAP HIGHER from Friday's highs and Sunday Night open/lows(not accurately displayed by the free source).
4. Next resistance.
++++++++
https://www.marketforum.com/forum/topic/83844/#83852
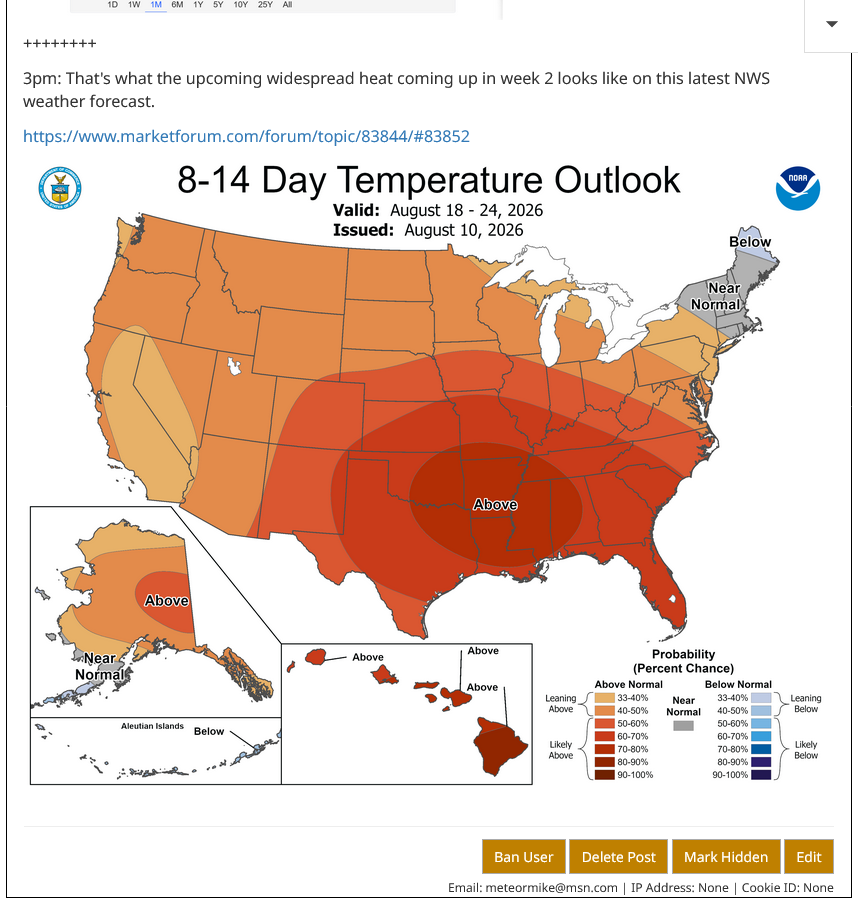
Pleasant in the Midwest. Hot in the Southwest.
https://www.cpc.ncep.noaa.gov/products/tanal/temp_analyses.php

++++++++++
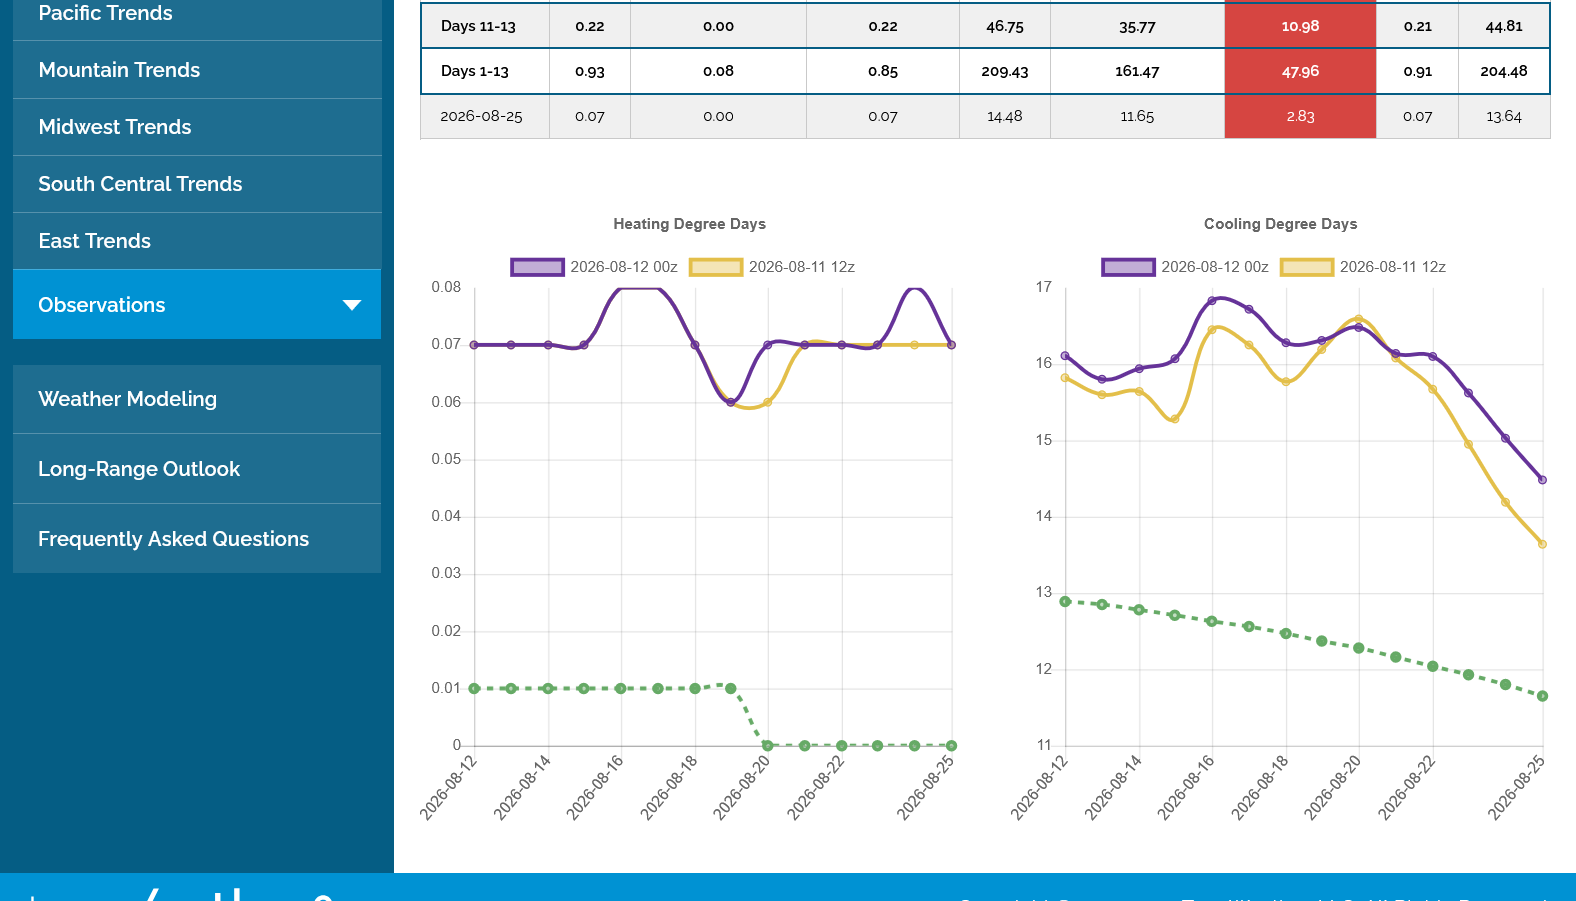
The late week 2 forecasts have been cooling things down(less hot) the past couple of runs. Purple/right was the 12z EE model. This is putting some pressure on ng prices that have given up over half their gains from Monday.
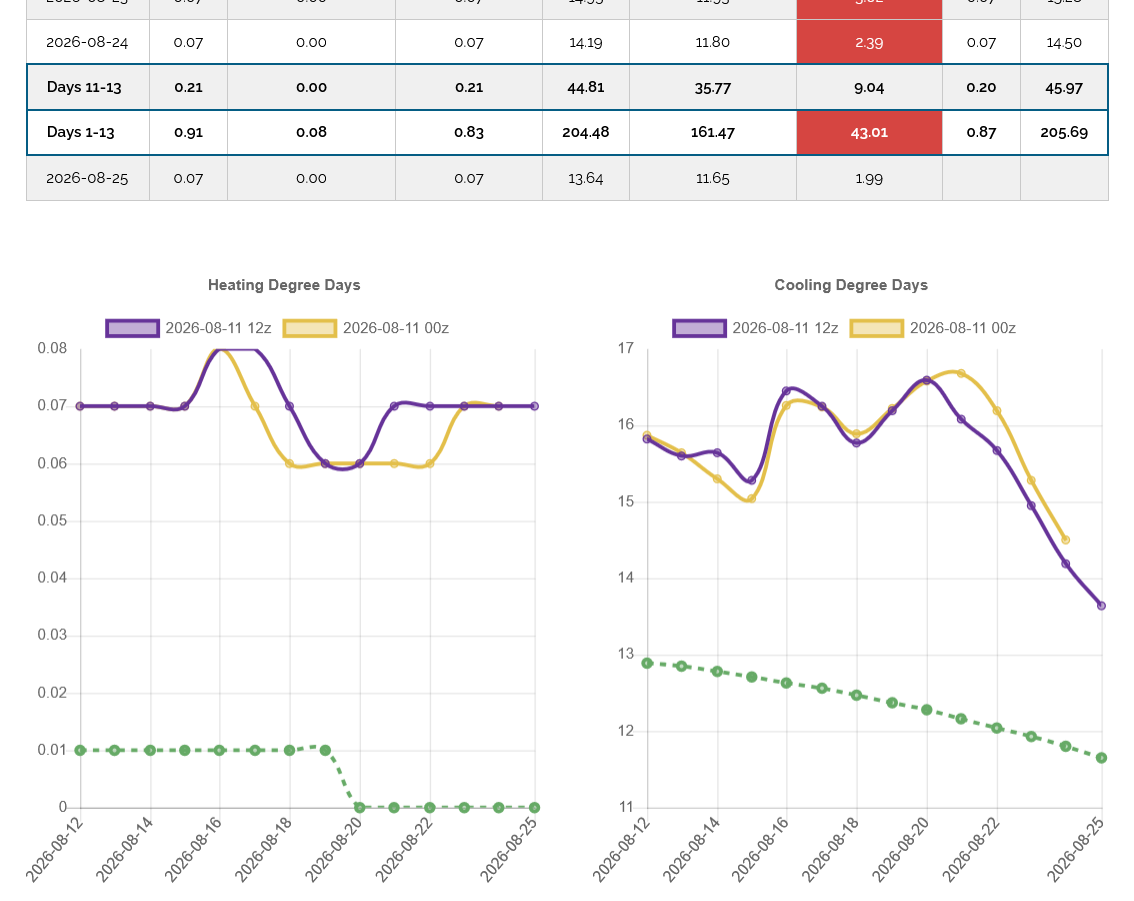
The last 0Z EE model in purple/right was +5 CDDs that helped NG to continue an overnight move higher that peaked just above the Monday highs(so far).
The pattern is the same (very hot vs average in green, then LESS hot late in the period) with the +5 CDDs being an uptick from most individual days.
+++++++++
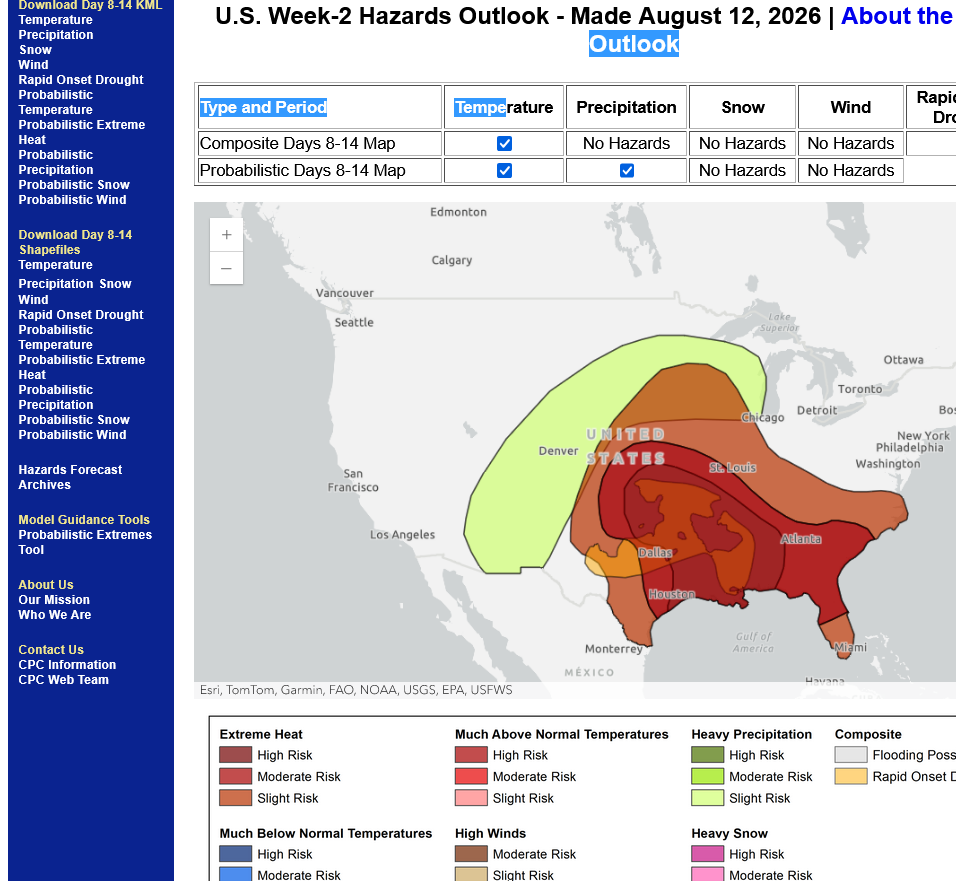
Heat persists into week 2 but diminishes late in the period.
https://www.cpc.ncep.noaa.gov/products/predictions/threats/threats.php
Bearish spike down to the top of the upside, breakaway gap higher from Sunday Night from the added heat in the forecast greatly increasing CDDs. We burn natural gas to generate electricity for residential cooling.
That gap is still wide open, though much of the intense heat is dialed in. Prices had already fallen a great deal earlier in the morning, ahead of the release and the spike lower lasted seconds with us being back to the pre report level(but still modestly lower on the daily bar).
for week ending August 7, 2026 | Released: August 13, 2026 at 10:30 a.m. | Next Release: August 20, 2026
| Working gas in underground storage, Lower 48 states Summary text CSV JSN | |||||||||||||||||||||||||
|---|---|---|---|---|---|---|---|---|---|---|---|---|---|---|---|---|---|---|---|---|---|---|---|---|---|
| Historical Comparisons | |||||||||||||||||||||||||
| Stocks billion cubic feet (Bcf) | Year ago (08/07/25) | 5-year average (2021-25) | |||||||||||||||||||||||
| Region | 08/07/26 | 07/31/26 | net change | implied flow | Bcf | % change | Bcf | % change | |||||||||||||||||
| East | 693 | 678 | 15 | 15 | 674 | 2.8 | 660 | 5.0 | |||||||||||||||||
| Midwest | 829 | 809 | 20 | 20 | 793 | 4.5 | 774 | 7.1 | |||||||||||||||||
| Mountain | 239 | 237 | 2 | 2 | 252 | -5.2 | 209 | 14.4 | |||||||||||||||||
| Pacific | 300 | 304 | -4 | -4 | 305 | -1.6 | 264 | 13.6 | |||||||||||||||||
| South Central | 1,093 | 1,090 | 3 | 3 | 1,153 | -5.2 | 1,048 | 4.3 | |||||||||||||||||
| Salt | 286 | 292 | -6 | -6 | 295 | -3.1 | 260 | 10.0 | |||||||||||||||||
| Nonsalt | 807 | 798 | 9 | 9 | 858 | -5.9 | 787 | 2.5 | |||||||||||||||||
| Total | 3,153 | 3,117 | 36 | 36 | 3,178 | -0.8 | 2,955 | 6.7 | |||||||||||||||||
| Totals may not equal sum of components because of independent rounding. | |||||||||||||||||||||||||
Working gas in storage was 3,153 Bcf as of Friday, August 7, 2026, according to EIA estimates. This represents a net increase of 36 Bcf from the previous week. Stocks were 25 Bcf less than last year at this time and 198 Bcf above the five-year average of 2,955 Bcf. At 3,153 Bcf, total working gas is within the five-year historical range.
For information on sampling error in this report, see Estimated Measures of Sampling Variability table below.
Note: The shaded area indicates the range between the historical minimum and maximum values for the weekly series from 2021 through 2025. The dashed vertical lines indicate current and year-ago weekly periods.
+++++++++++
2pm:
Note the CDDs from the last 4 runs of the GEFS, the last 12z run in purple showing cooling vs the previous one IN ADDITION to the cooling trend in week 2. This pushed natural gas back to the lows, testing the top of the bullish, break away gap higher on Sunday Night again.
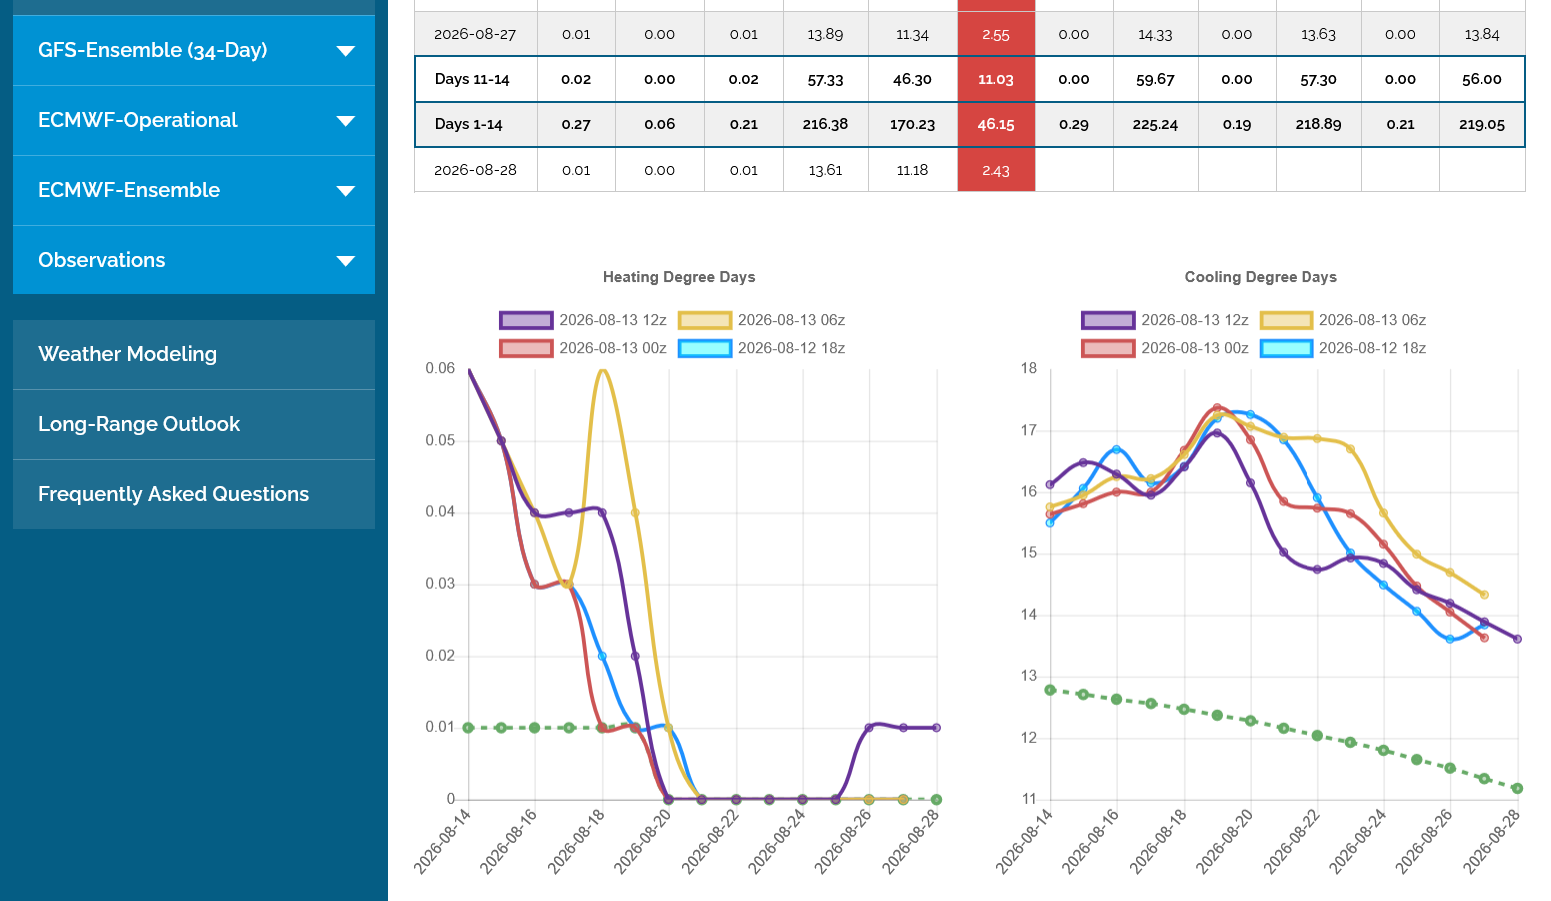
8-13-26 Heat wave in the South but shifts west in week 2!
Started by metmike - Aug. 13, 2026, 4:07 p.m.
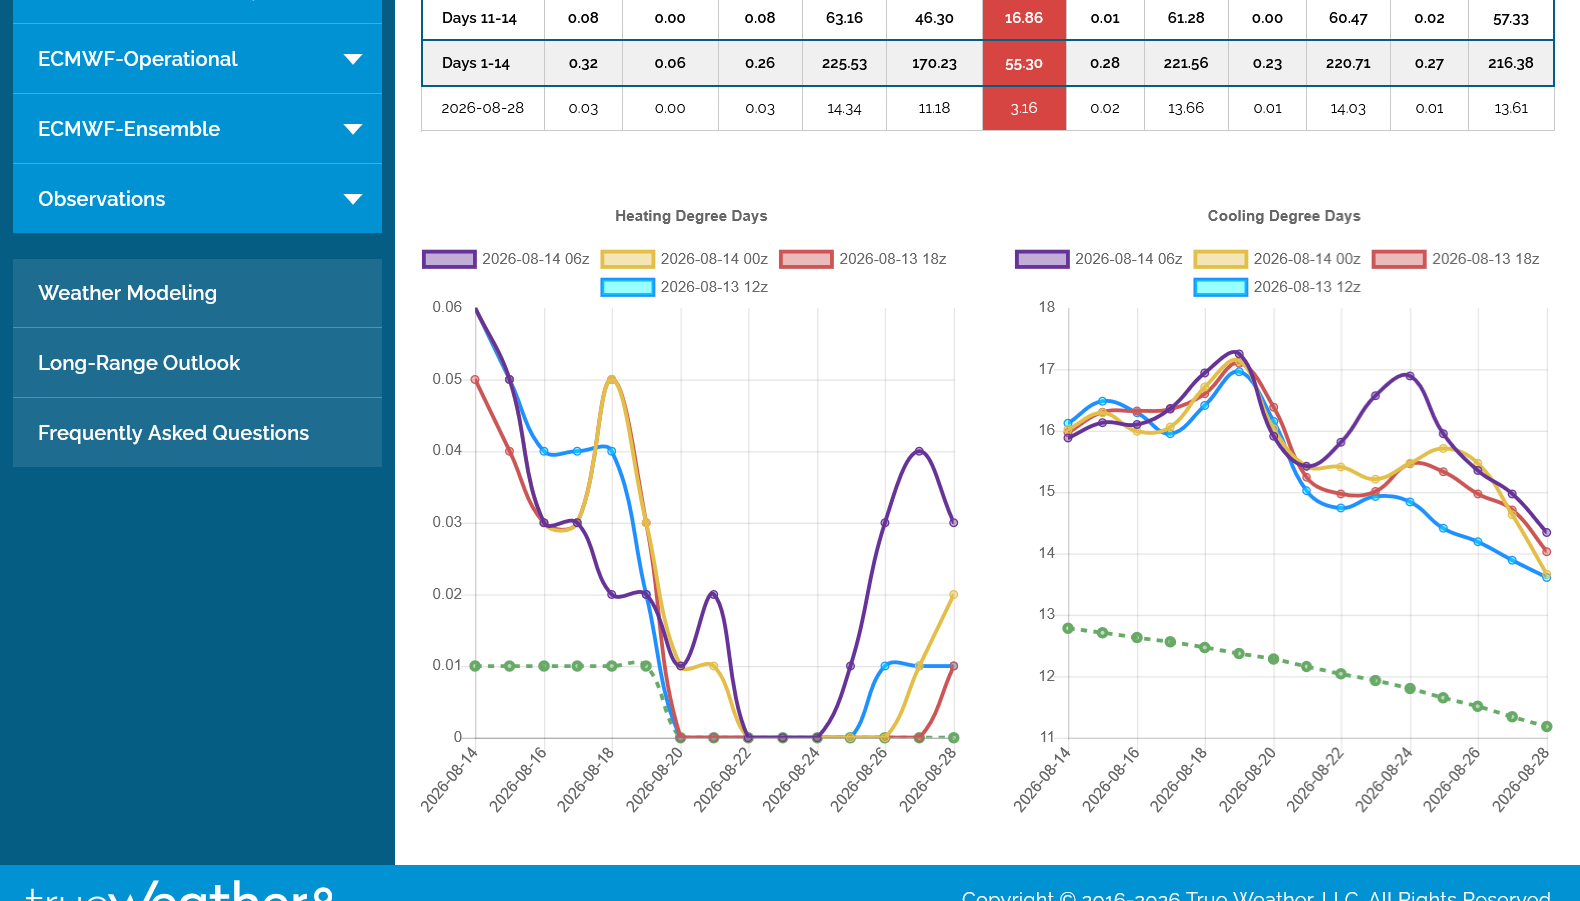
The overnight guidance was HOTTER.
These are the last 4 runs of the GEFS, 4 hours apart with the last 1 (hottest) one, the 6z run in purple.
++++++++++
4pm: The 12z European Ensemble model in purple was a whopping -8.6 CDDs compared to the previous run. That played a role in the price drop all day.
The close was at the low and just above the top of the bullish upside break away gap from Sunday night. Since it's been tested now a couple of times and there has not been much follow thru to the upside, it's looking more like an upside buying exhaustion gap that would be confirmed by lower prices early next week.
If we open at all lower on Sunday Night, it will put in a 1 week trading island with that gap lower which is a pretty impressive bearish formation.
It's been amazing with all this heat and more in the forecast that NG failed to go higher than it did this week. A market that fails/refuses to respond to bullish news is telling us there are some strong bearish forces holding it down.
We got the bearish gap lower on the open 3+ hours ago. Not just a gap lower on the daily bar but a gap lower on the weekly bar and leaving an island of trading prices last week, with the gap higher to start last week and gap lower to start this week(below every price all of last week) leaving a stranded weekly bar.
Temperatures are not that much cooler but the forecast never responded very bullishly last week when the heat was most impressive.
So the bullish moderate heat coming up the next 2 weeks is not even bullish enough to keep prices from falling to start this week!
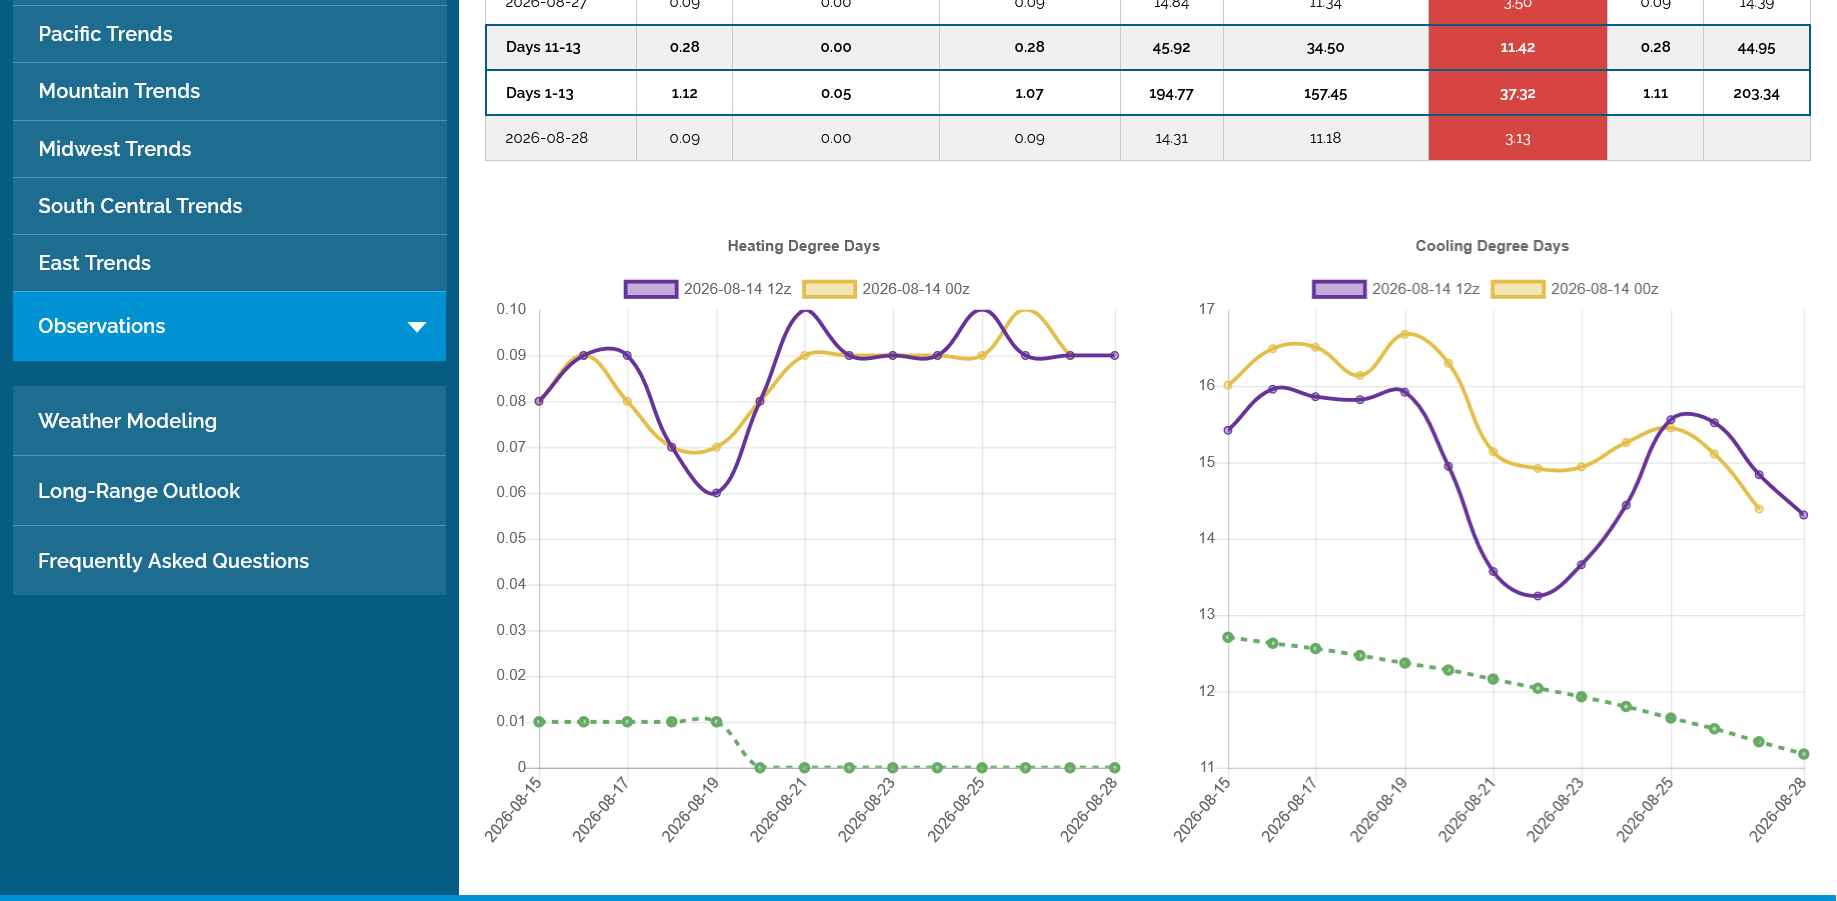
The last 12z European Ensemble CDD model is in purple on the right. Still pretty elevated compared to the falling green line, the climatological average.
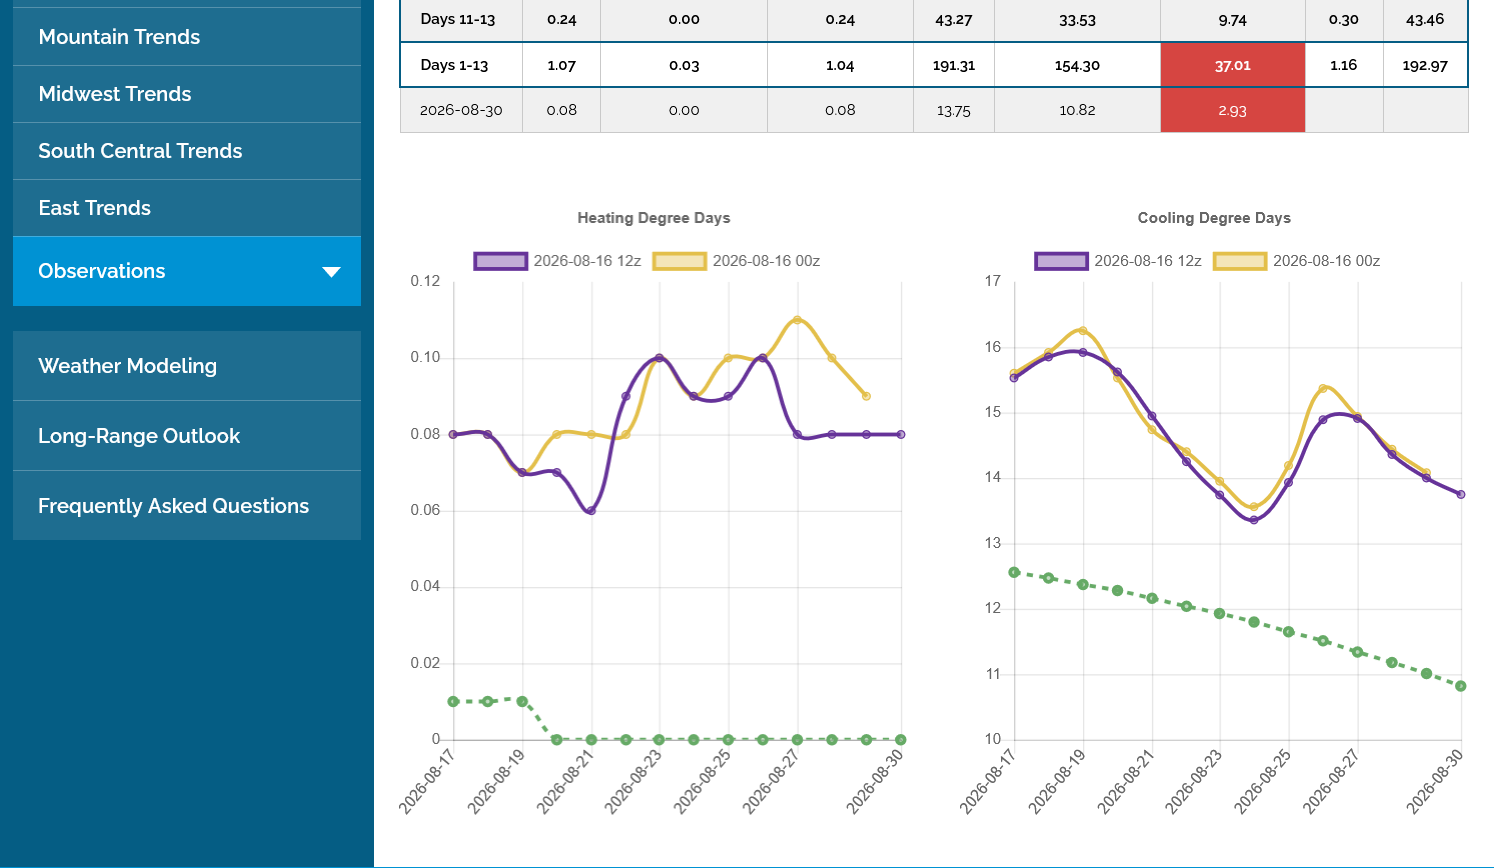
The EIA report on Thursday at 9:30 am will show a VERY SMALL injection compared to average! The market already dialed this heat in earlier this month.
https://www.cpc.ncep.noaa.gov/products/tanal/temp_analyses.php

+++++++++++++++
https://tradingeconomics.com/commodity/natural-gas
1. 1 day: Daily gap lower!
2. 1 week: Weekly gap lower!
3. 1 month: Double top last week. Weekly gap lower. Approaching support.
4. 1 year: Approaching major support. Descending triangle?
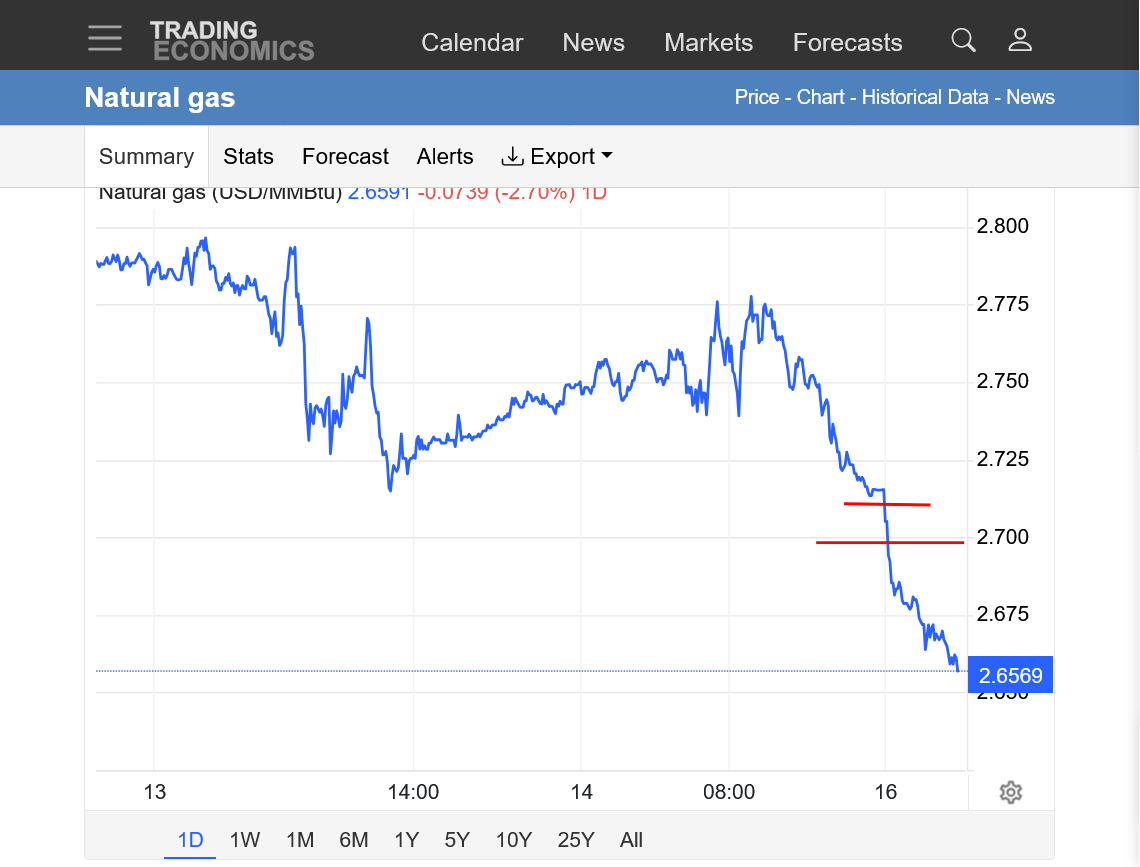
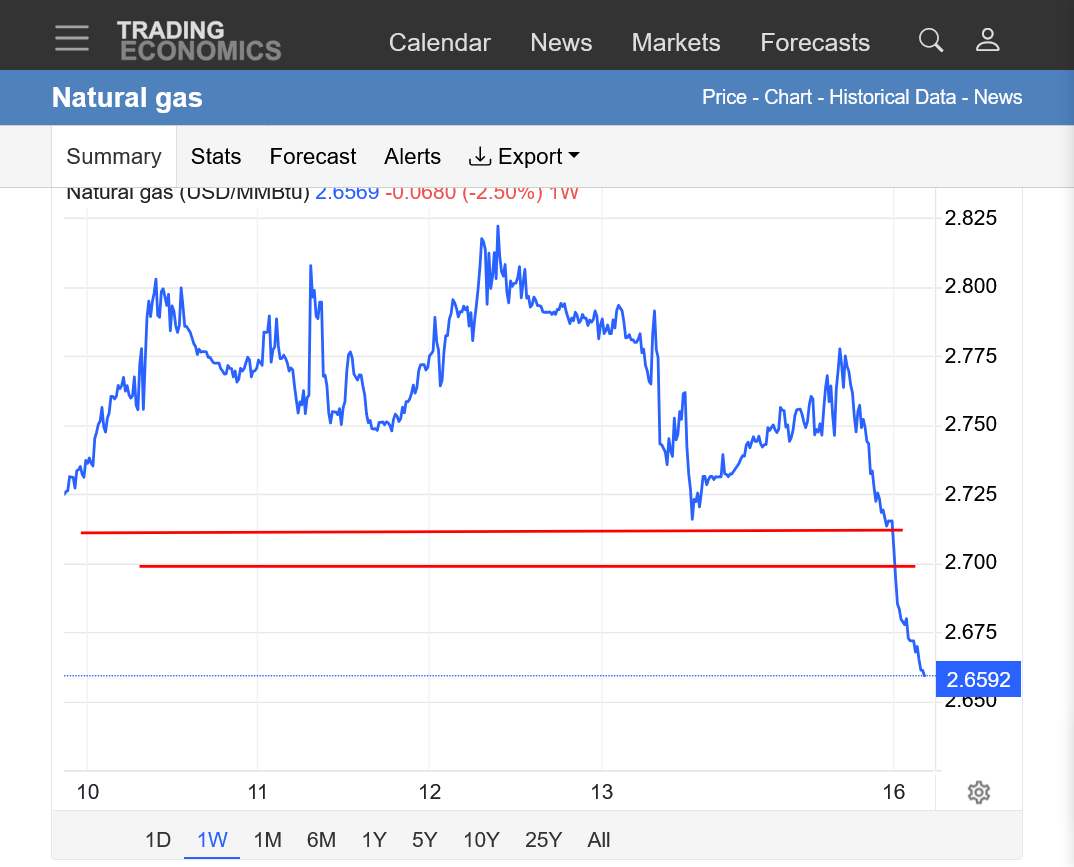
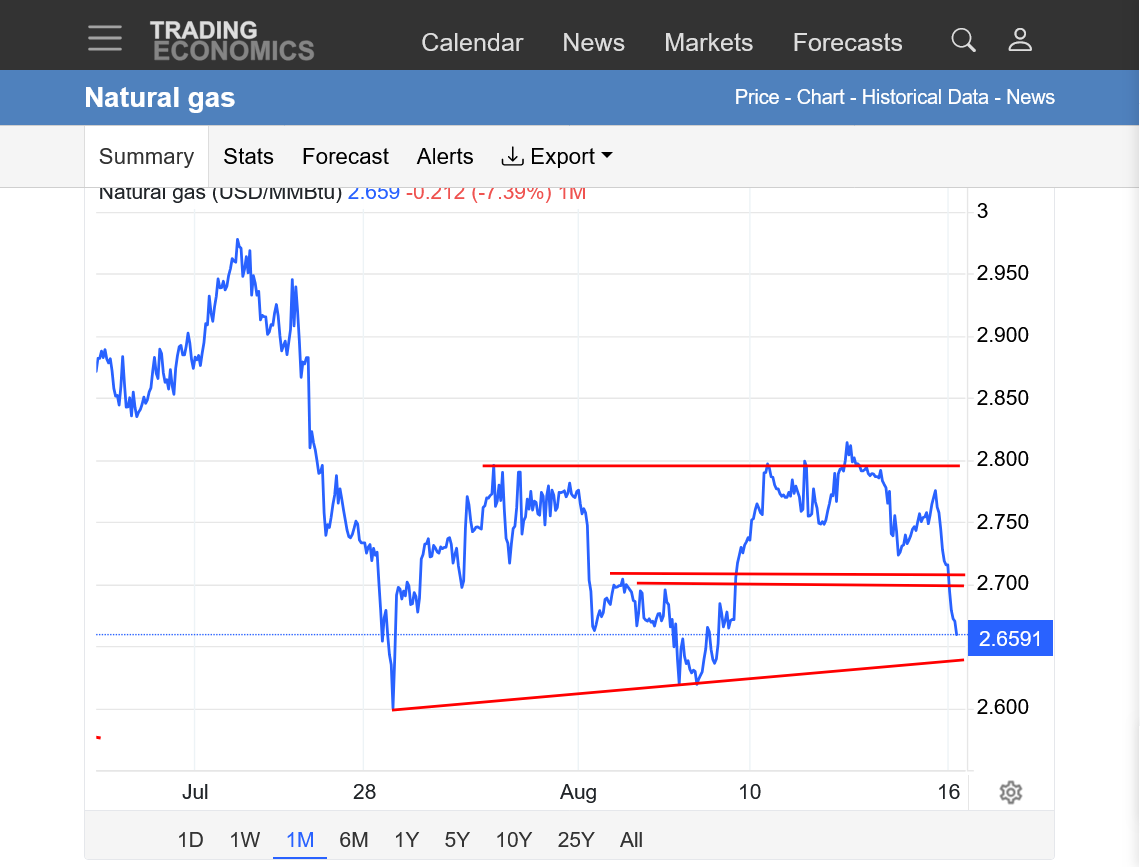
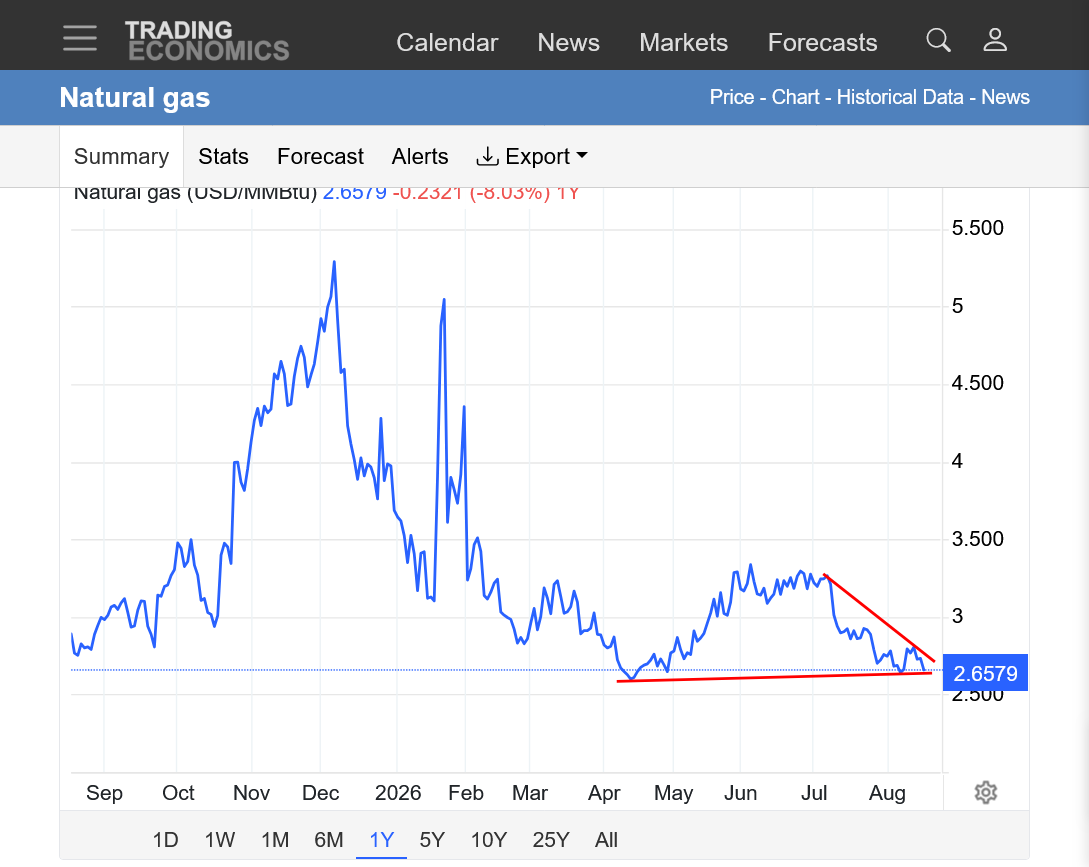
8am: That major support identified above held overnight.
We are now threatening to close the gap lower from the open that would serve as a gap and crap selling exhaustion on the charts. However, the timing and place are not ideal for a reliable trading formation.....even though this is bullish!
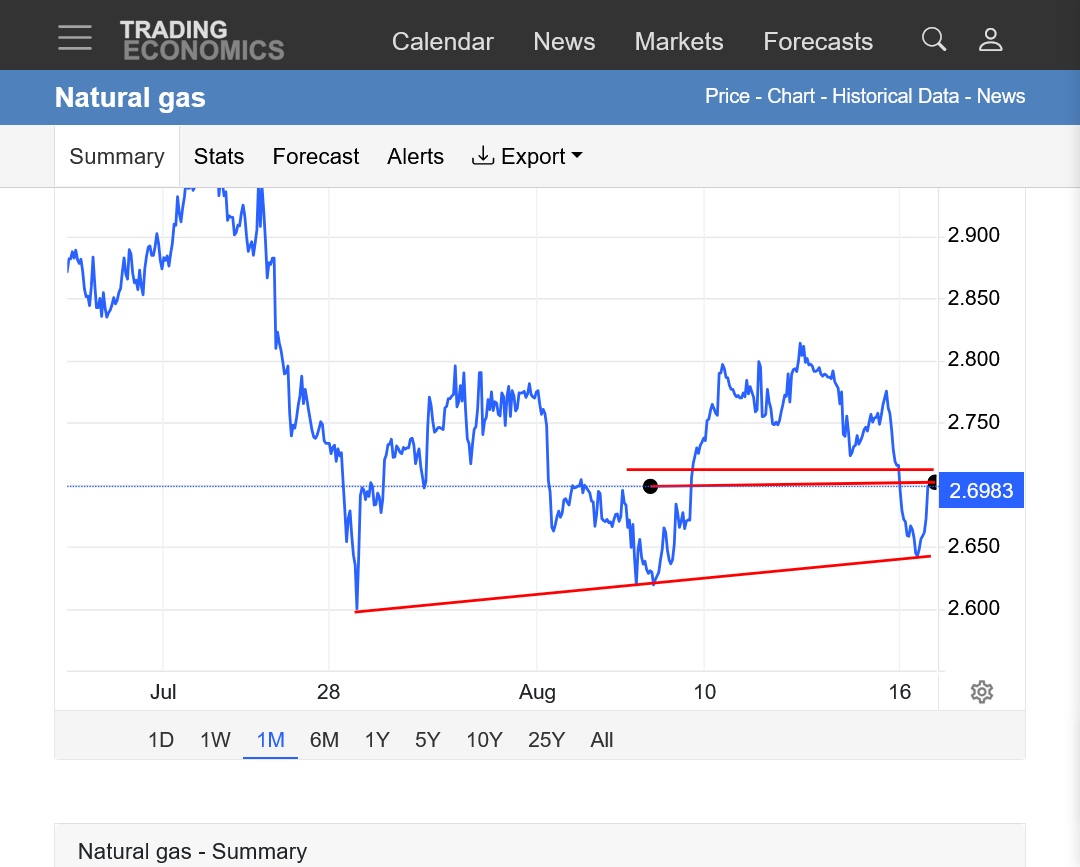
We got the gap and crap selling exhaustion(filled the gap lower from Sunday night), along with follow thru buying on Tuesday.
We also saw an increase in CDDs (+3.37 CDDs) on this last overnight 0z European Ensemble run in purple on the right.
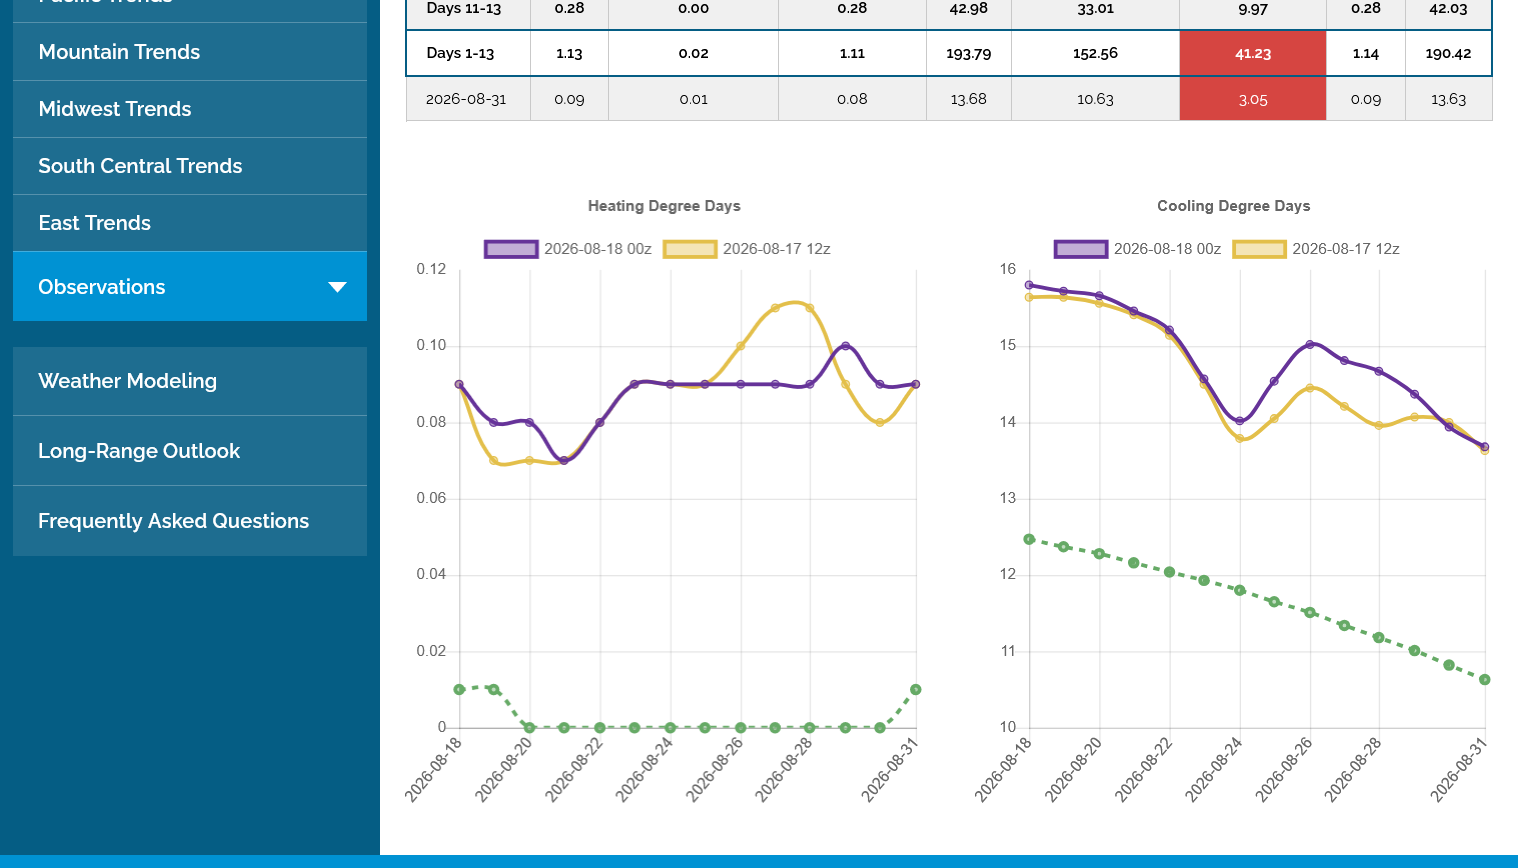
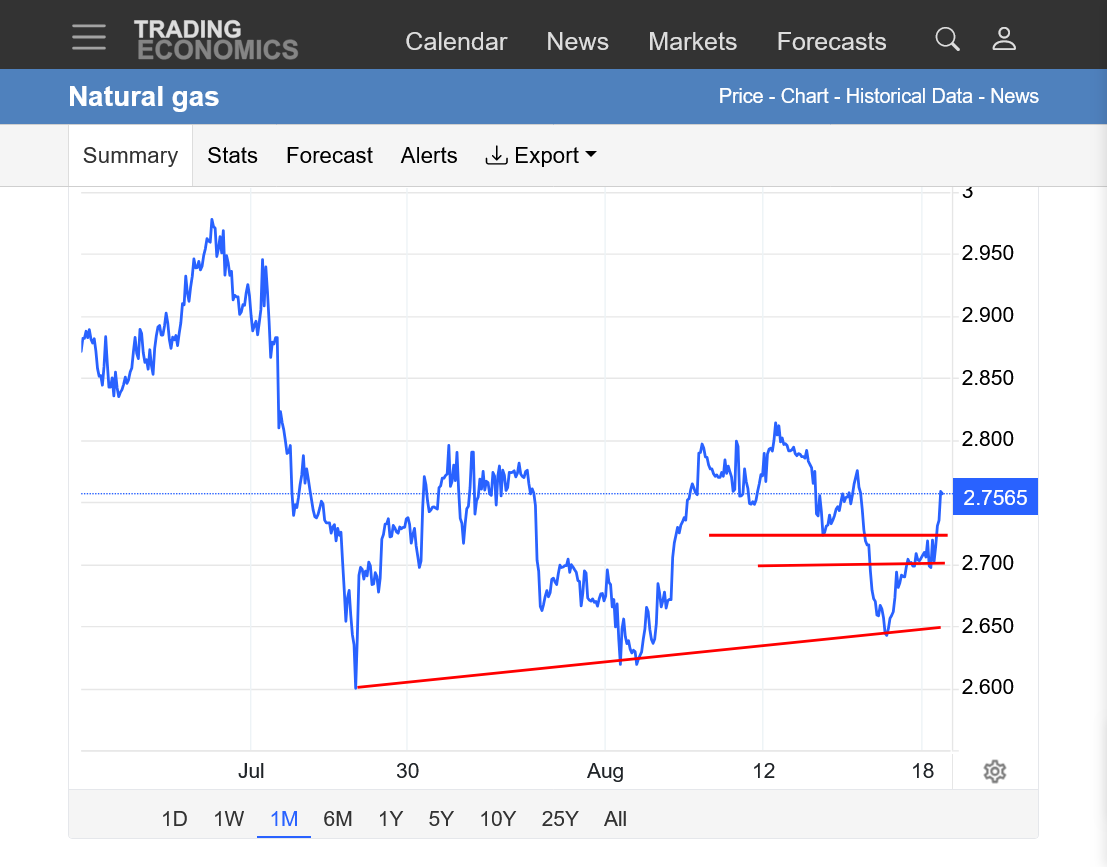
https://tradingeconomics.com/commodity/natural-gas
1. 1 month: Gap between Friday's low and Sunday Night's open/high is now closed = gap and crap selling exhaustion formation. Support/uptrend line defined by the last 3 lows is drawn(HIGHER lows).
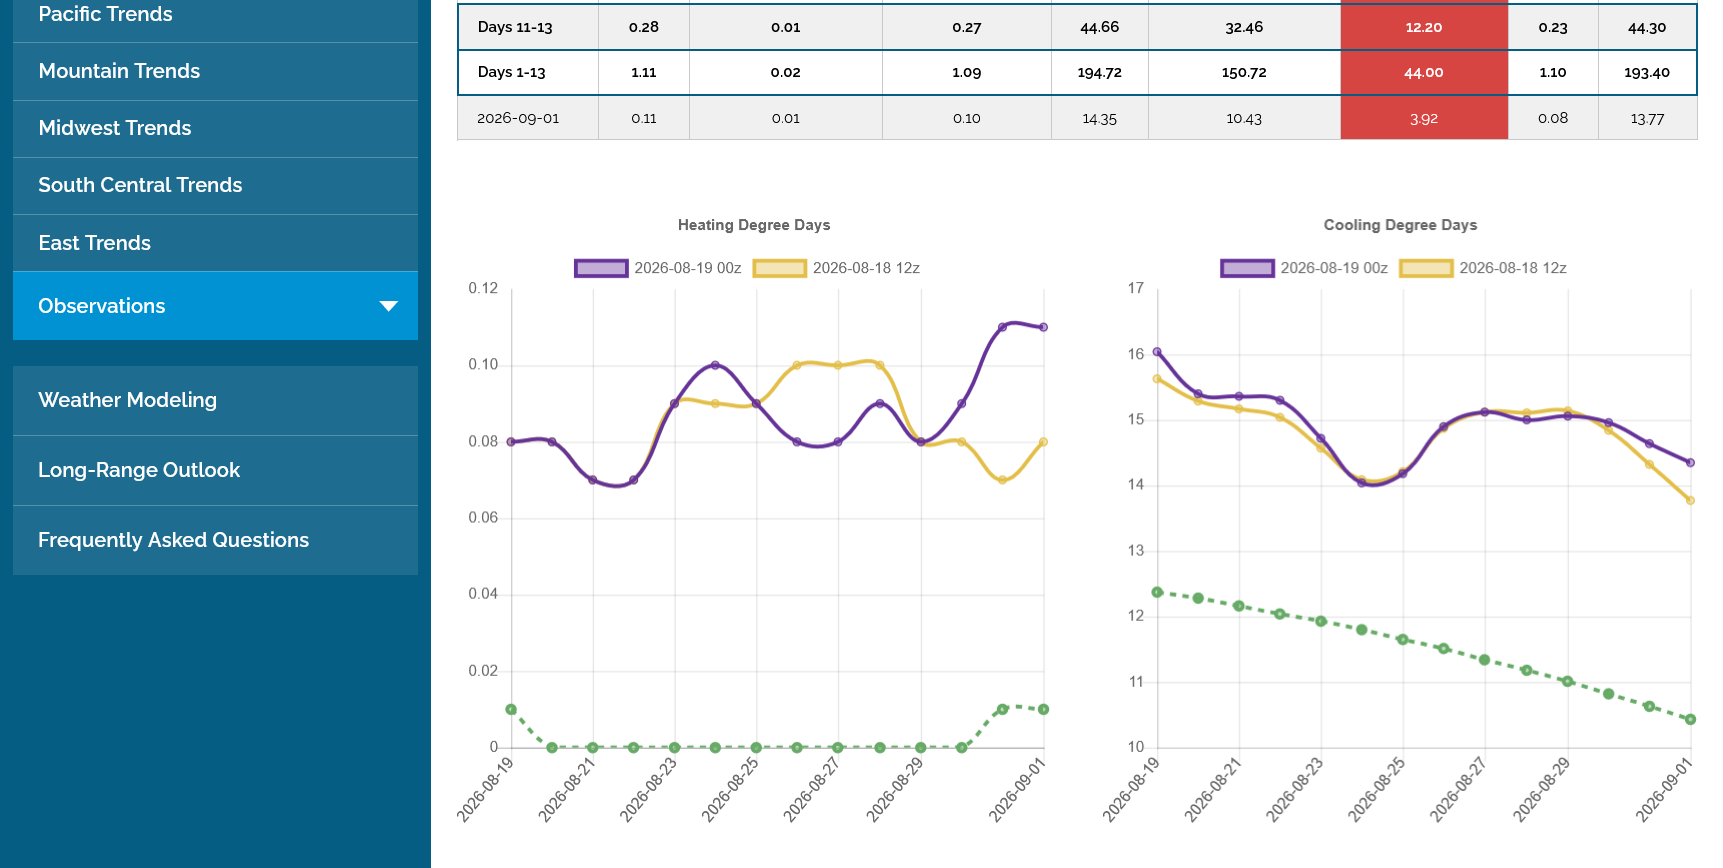
Seasonals turn sharply up in late September ahead of Winter(the main residential demand season for heating). Each year is different.
https://charts.equityclock.com/natural-gas-futures-ng-seasonal-chart
GREATLY elevated CDDs continue and even grow a bit in week 2 vs the green average from this last 0z European Ensemble run, purple/right. +1.3 CDDs compared to the previous run 12 hours earlier.
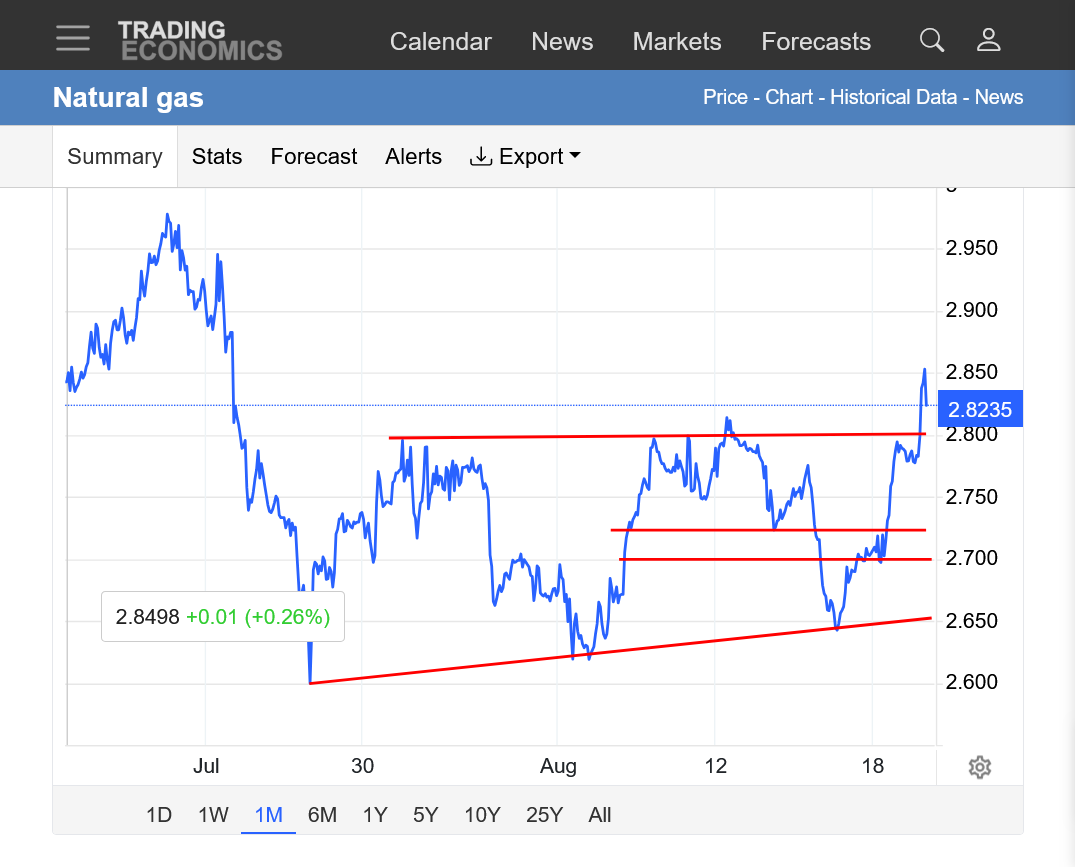
https://tradingeconomics.com/commodity/natural-gas
1. 1 month: Parallel horizontal lines =Filled gap and crap exhaustion (Sunday's open=below last weeks entire price trading bar=top of gap lower, Friday's low=bottom of gap).......left in the dust!
2. Tested support with new uptrend drawn with 3 points featuring HIGHER lows.
3. Above resistance=last weeks highs.
Ive been meaning to discuss the Eoropean NG crisis and record high prices ahead of Winter for the past week. This will put upward pressure on prices here too alomg with maximizing our exports.
do the funds trade this, and where can a person see their position?
Man do funds every trade this!!!!
They come in around 6am or so and often cause wild gyrations to the price shortly after that.
I don't have the COT data site in front of me but will try to look it up.
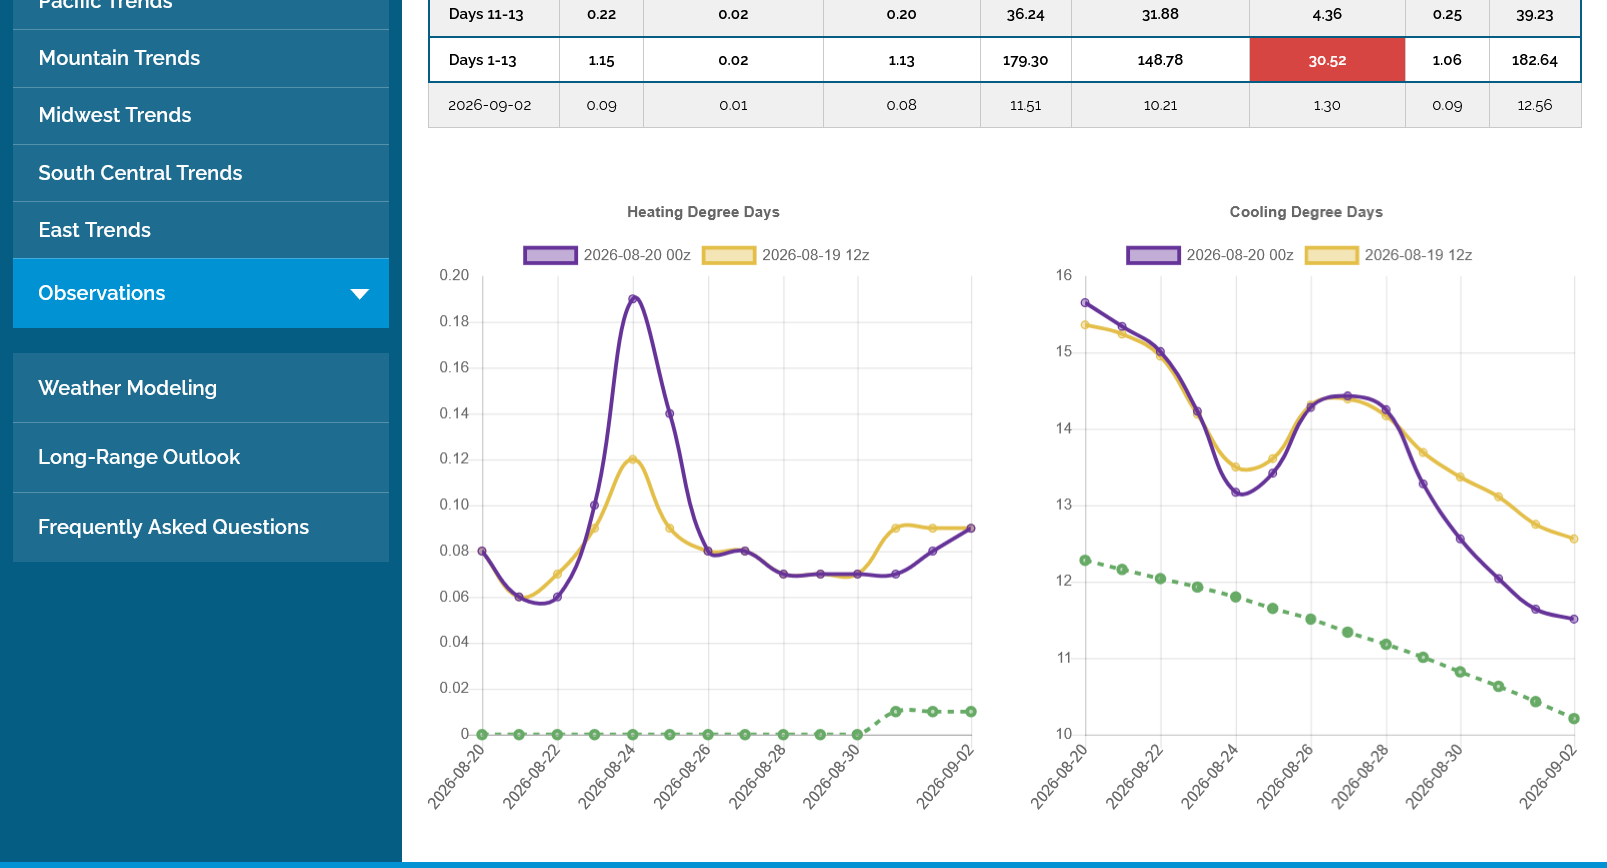
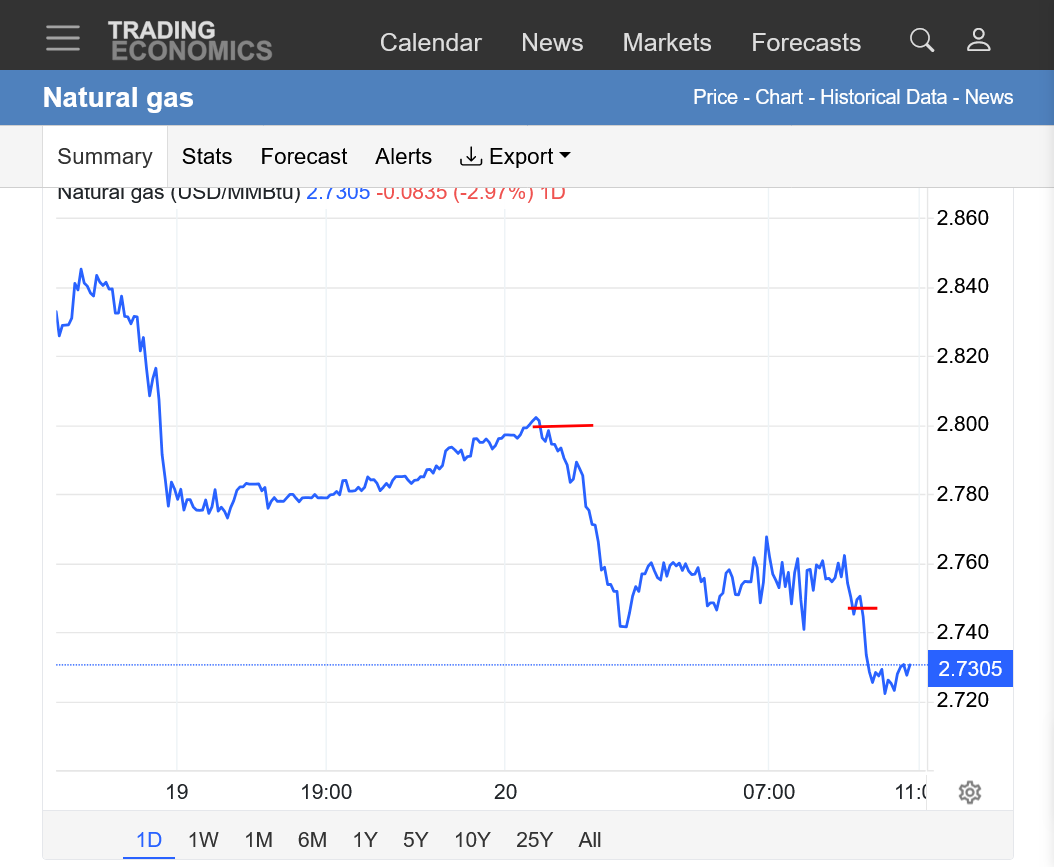
NG dropped $800/contract after this cooler, 0z European Ensemble run came out -3 CDDs(just after midnight) compared to the 12z run from 12 hours earlier. It's the purple line on the right with the cooling being in week 2, as evidenced by the last 5 data points.
++++++++++++
https://tradingeconomics.com/commodity/natural-gas
1. 1 day: First line was just after midnight when the COOLER 0z guidance started coming out. 2nd line was when the EIA report came out.
+++++++++++++++=
As mentioned earlier, this would be a BULLISH, small number from last week heat in high population areas that used AC's that got electricity from burning NG at power plants......but already dialed into the price. On the release, we actually had a very brief spike LOWER.
Re: Re: Re: Re: Natural Gas July 23, 2026
By metmike - Aug. 16, 2026, 9:31 p.m.
for week ending August 14, 2026 | Released: August 20, 2026 at 10:30 a.m. | Next Release: August 27, 2026
| Working gas in underground storage, Lower 48 states Summary text CSV JSN | |||||||||||||||||||||||||
|---|---|---|---|---|---|---|---|---|---|---|---|---|---|---|---|---|---|---|---|---|---|---|---|---|---|
| Historical Comparisons | |||||||||||||||||||||||||
| Stocks billion cubic feet (Bcf) | Year ago (08/14/25) | 5-year average (2021-25) | |||||||||||||||||||||||
| Region | 08/14/26 | 08/07/26 | net change | implied flow | Bcf | % change | Bcf | % change | |||||||||||||||||
| East | 708 | 693 | 15 | 15 | 688 | 2.9 | 674 | 5.0 | |||||||||||||||||
| Midwest | 848 | 829 | 19 | 19 | 810 | 4.7 | 795 | 6.7 | |||||||||||||||||
| Mountain | 237 | 239 | -2 | -2 | 255 | -7.1 | 212 | 11.8 | |||||||||||||||||
| Pacific | 296 | 300 | -4 | -4 | 302 | -2.0 | 263 | 12.5 | |||||||||||||||||
| South Central | 1,080 | 1,093 | -13 | -13 | 1,143 | -5.5 | 1,040 | 3.8 | |||||||||||||||||
| Salt | 268 | 286 | -18 | -18 | 284 | -5.6 | 252 | 6.3 | |||||||||||||||||
| Nonsalt | 812 | 807 | 5 | 5 | 859 | -5.5 | 789 | 2.9 | |||||||||||||||||
| Total | 3,169 | 3,153 | 16 | 16 | 3,197 | -0.9 | 2,984 | 6.2 | |||||||||||||||||
| Totals may not equal sum of components because of independent rounding. | |||||||||||||||||||||||||
Working gas in storage was 3,169 Bcf as of Friday, August 14, 2026, according to EIA estimates. This represents a net increase of 16 Bcf from the previous week. Stocks were 28 Bcf less than last year at this time and 185 Bcf above the five-year average of 2,984 Bcf. At 3,169 Bcf, total working gas is within the five-year historical range.
For information on sampling error in this report, see Estimated Measures of Sampling Variability table below.
Note: The shaded area indicates the range between the historical minimum and maximum values for the weekly series from 2021 through 2025. The dashed vertical lines indicate current and year-ago weekly periods.
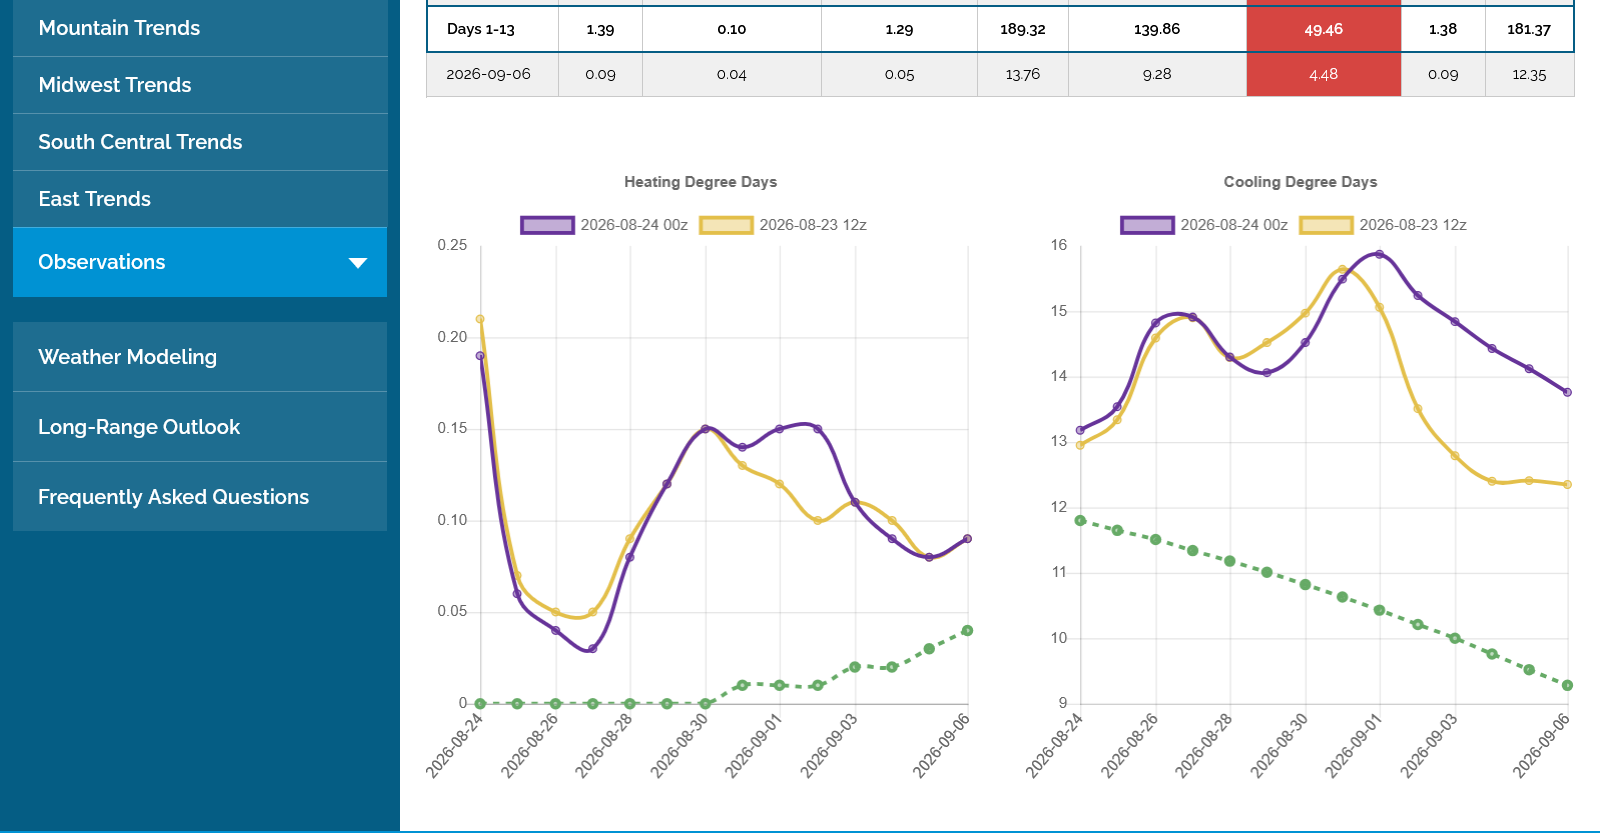
The last 0z European Ensemble model was a whopping +8 CDDs vs the previous run. Last run in purple/right. This was all from added week 2 heat. As soon as it came out, NG started a big overnight rally.
++++++++++++++
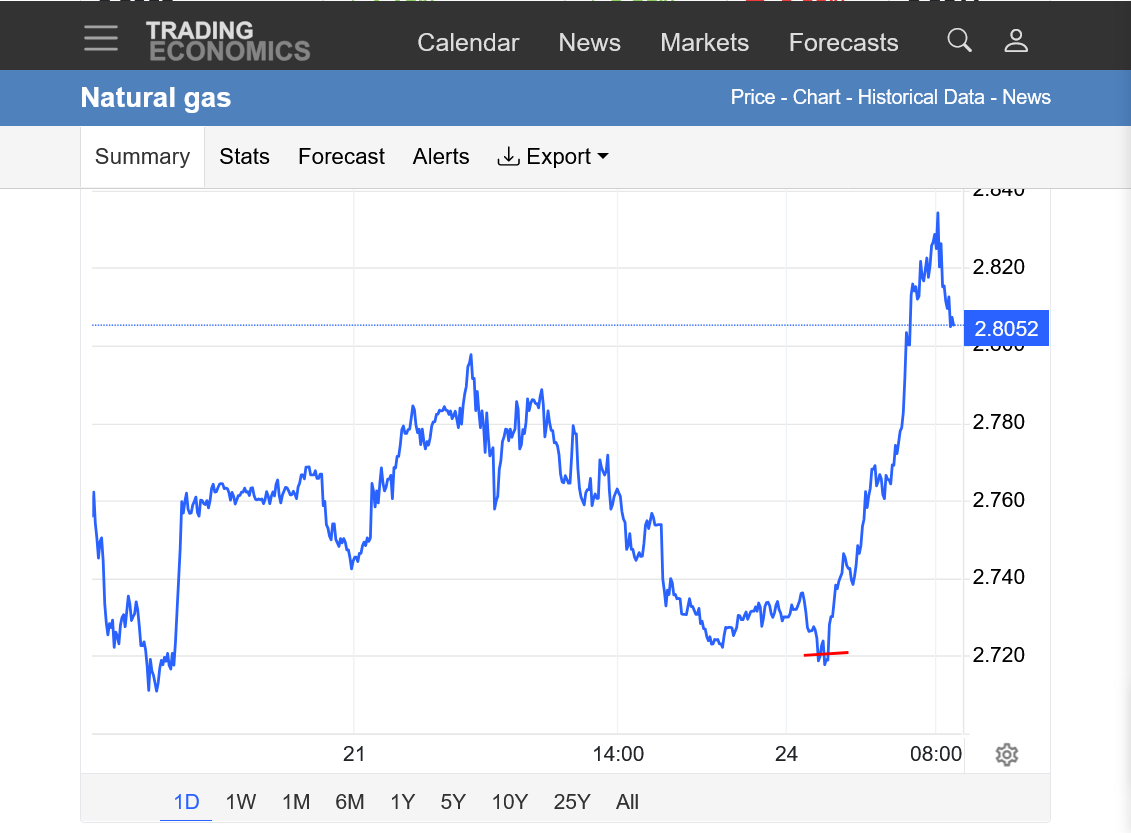
https://tradingeconomics.com/commodity/natural-gas
1. 1 week: Note the time when the hotter week 2 portion of the EE came out below.
++++++++++++++
Intense heat in the South last week, so the EIA will be small/bullish. However, this heat is the past. Futures markets mainly trade the FUTURE. That can include speculation on what the EIA # might be but the weather that happened during that period is the PAST.
https://www.cpc.ncep.noaa.gov/products/tanal/temp_analyses.php

++++++++++++++++++++++
https://tradingeconomics.com/commodity/natural-gas
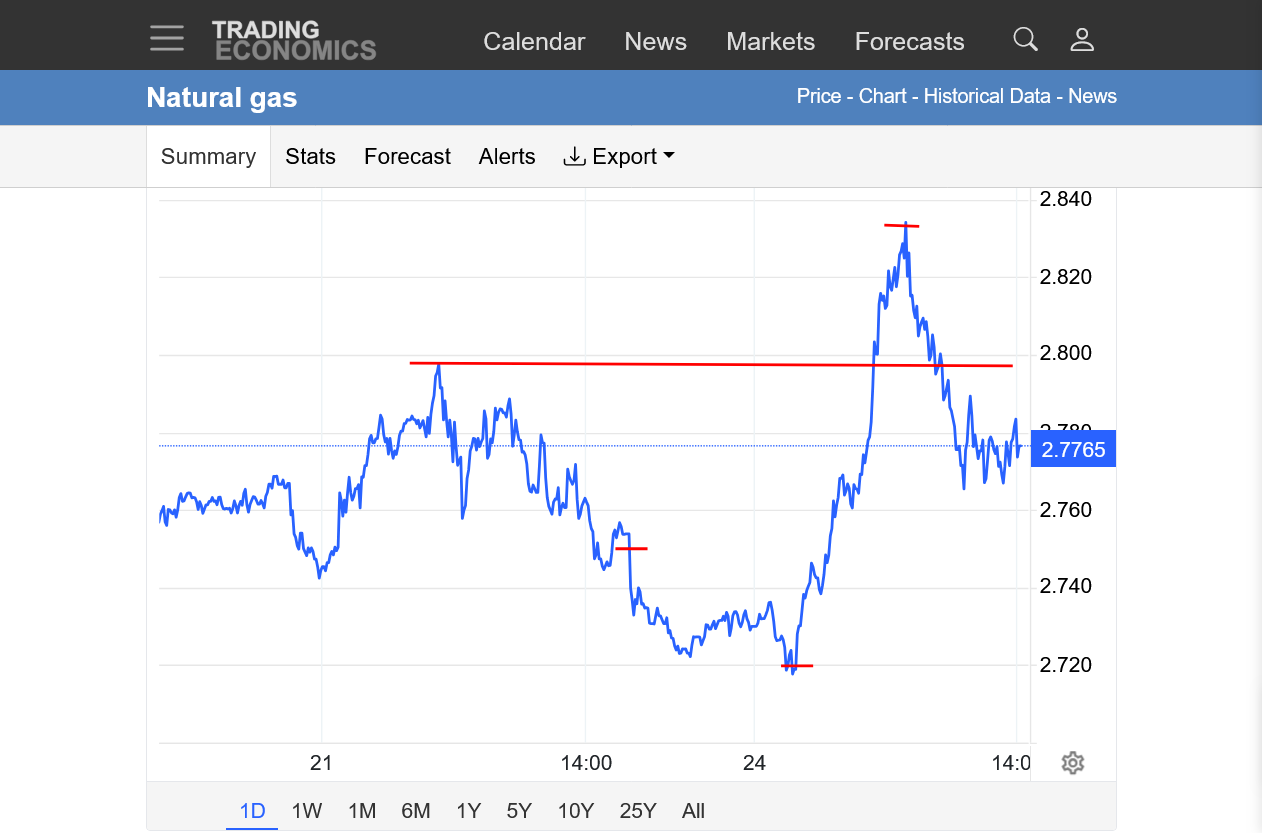
1 day below: Open last night at 5pm CDT was 2.75 and followed by selling. Starting just before 2am when the BULLISH/HOTTER EE model came out we took off like a rocket!. Highs around 8am, after a rally of $1100/contract from bottom to top. Close around mid range and BELOW the highs from Friday at 6am(after the funds came into sell NG hard all day session long on Friday).
Front month, September NG expires on Thursday!
https://tradingeconomics.com/commodity/natural-gas
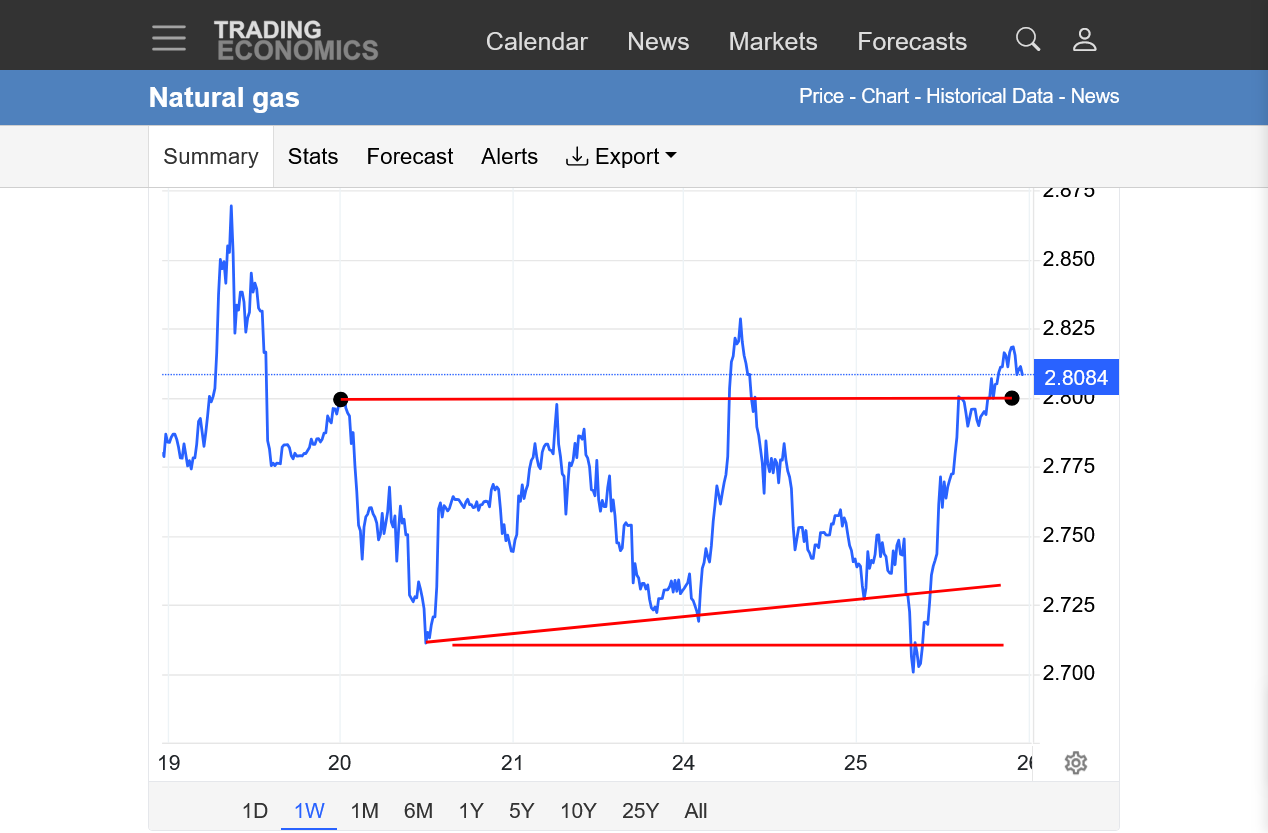
1. 1 week: NG did what it does more than any other market that I trade. Spiking thru resistance very early on Monday and looking like its about to break out to the upside but instead, putting in a FAKE OUT, then abruptly reversing and spiking thru support and looking like its breaking out to the downside and another FAKE OUT.......then reversing up and now we're back near the highs again.
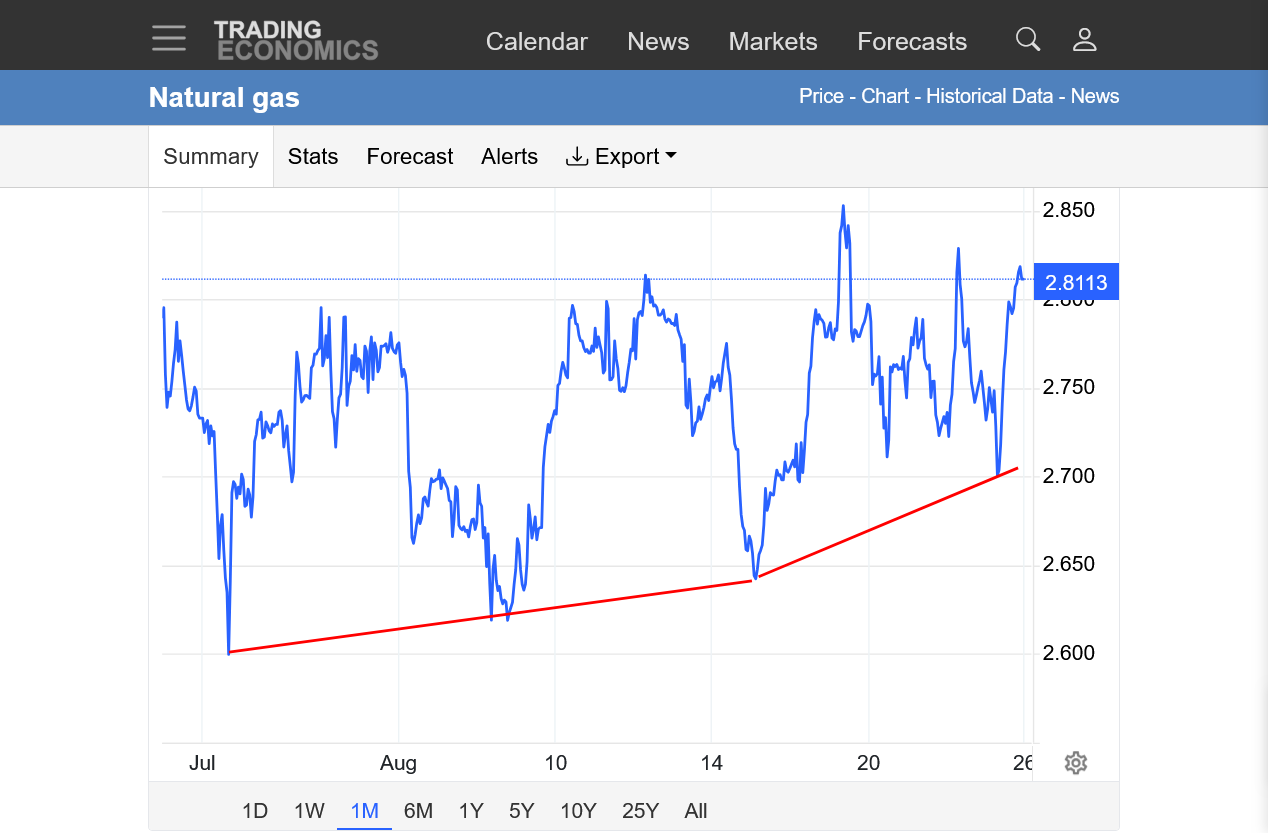
2. 1 month: 3 higher lows over the last month to establish an uptrend with the bulls having the advantage. Buyers are stepping in at higher and higher lows. We are in an area of resistance right now. Forming a sort of ascending triangle/wedge. Considering the heat + seasonals turning strongly up in September, my guess is that the price is higher next month.
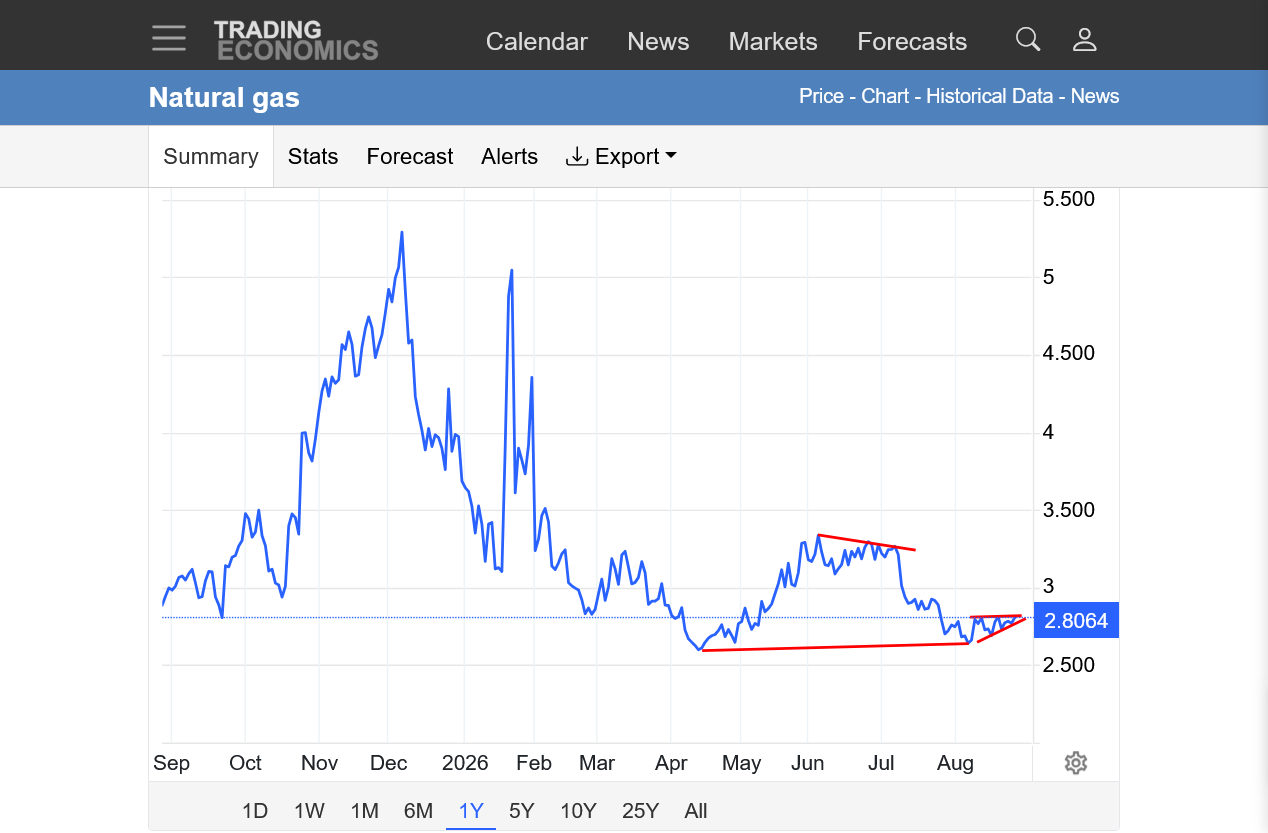
3. 1 year: Symmetrical triangle going from the higher lows since the late April low and lower highs since the June highs. However, we have an ascending triangle in August as seen to on the 1 month chart.
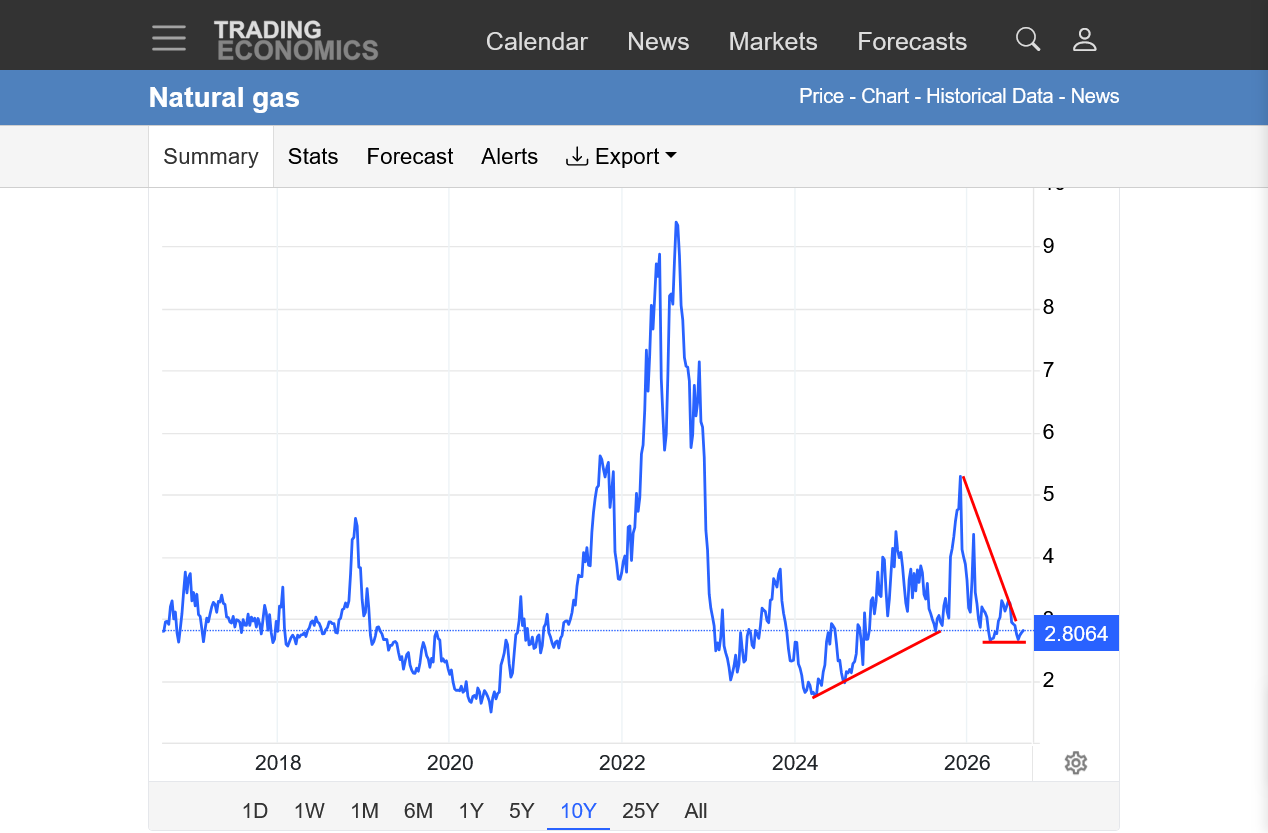
4. 10 years: I could have drawn a symmetrical triangle with the lower highs since the huge 2022 top or even since early 2026. Also, higher lows since the 2024 bottom.
More heat in the forecast in early September but that's been part of the forecast for much of the Summer.
Major heat waves have been known to support NG as late as September but CDDs are not as important right now as temperatures gradually cool off and even sustained heat is not going to reduce injections like they can earlier in the Summer but large speculators can use it as another item for buying.
https://www.marketforum.com/forum/topic/83844/#83852
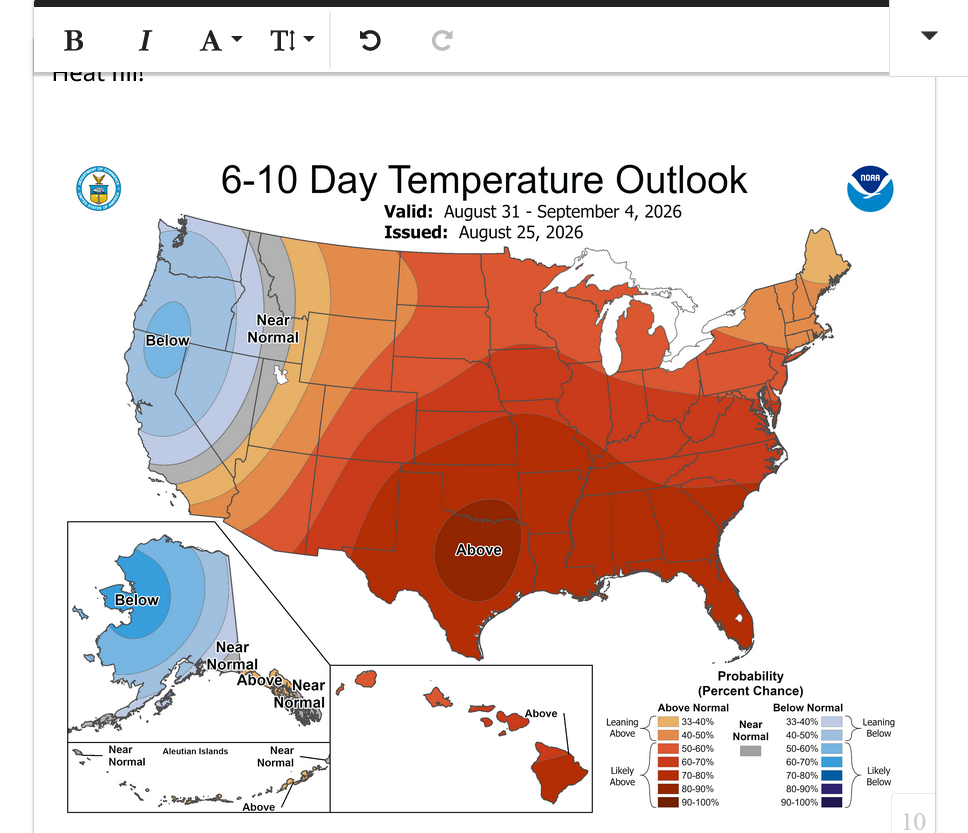
This last 0z European Ensemble model(purple/right) was another +3 CDDs vs the previous one 12 hours earlier which is supporting NG that appears to be breaking out to the upside.
Some pretty robust early September heat on the way!
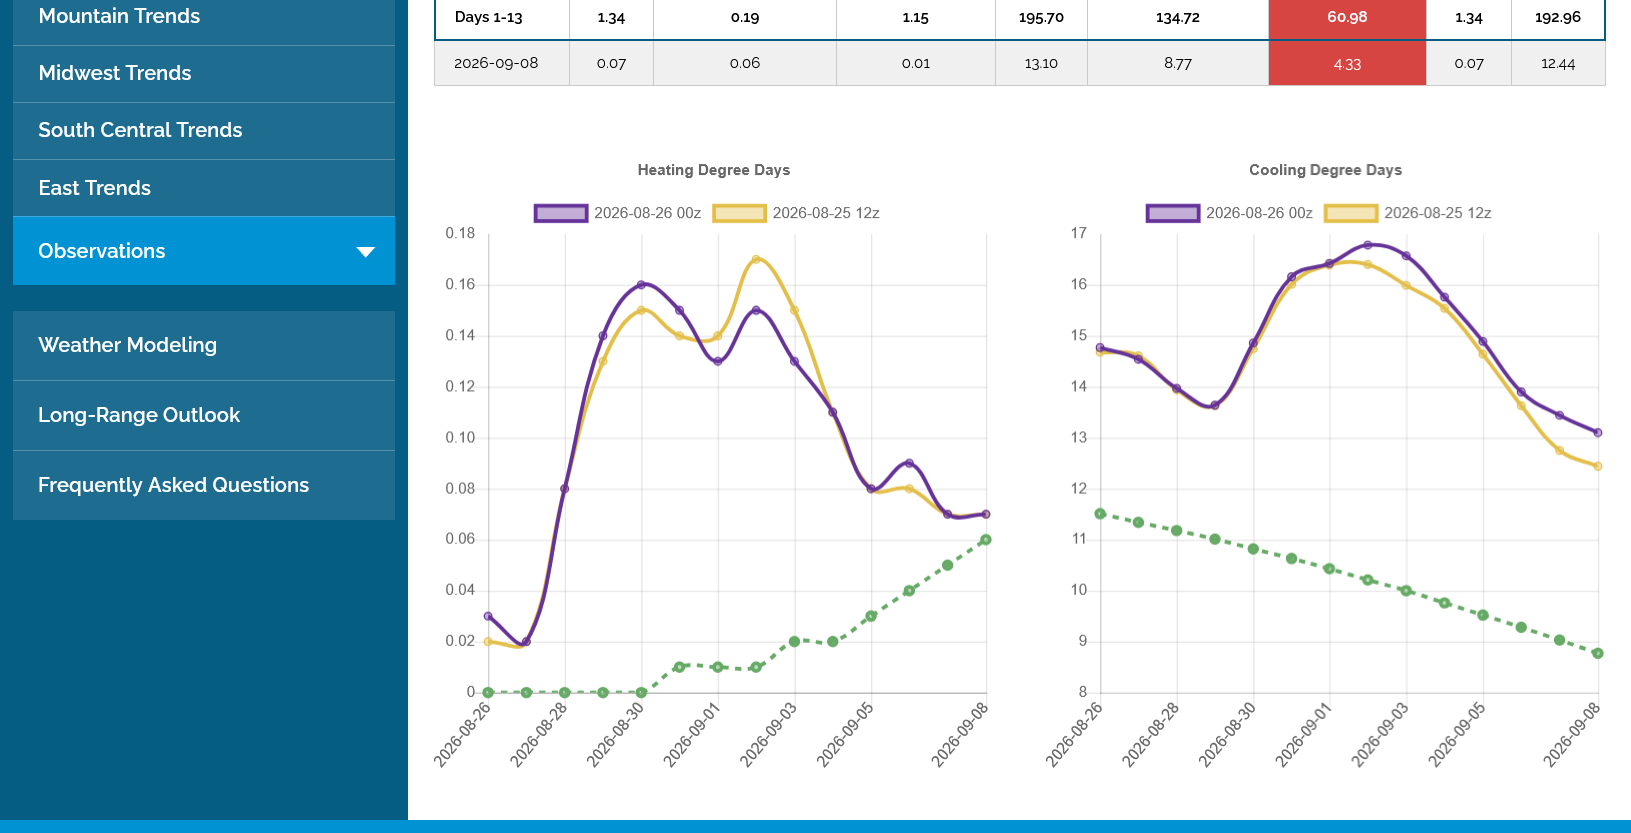
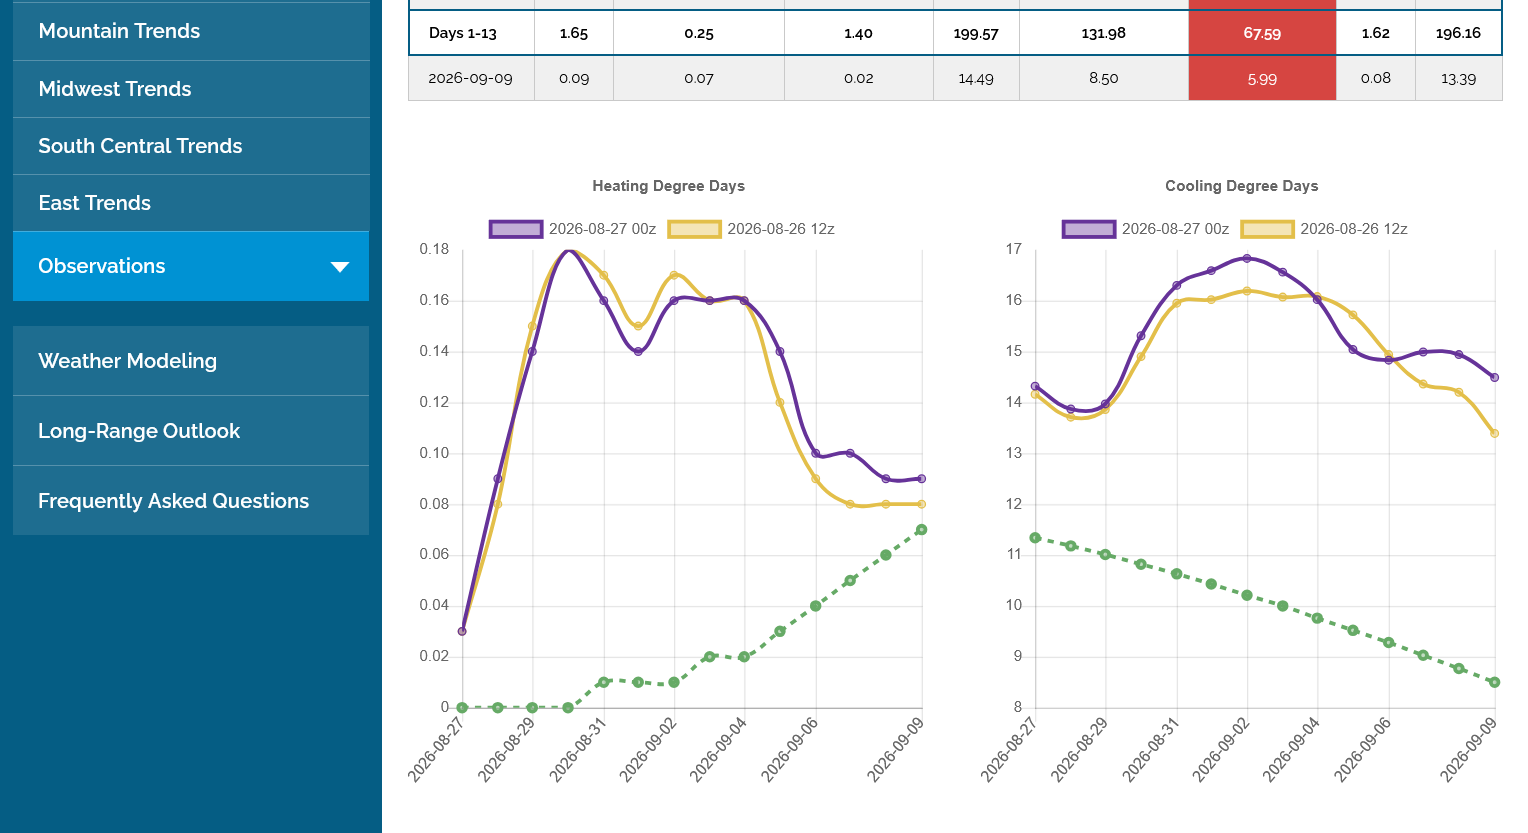
The last 0z EE model added another +3.4 CDDs overnight. Front month September expires today.
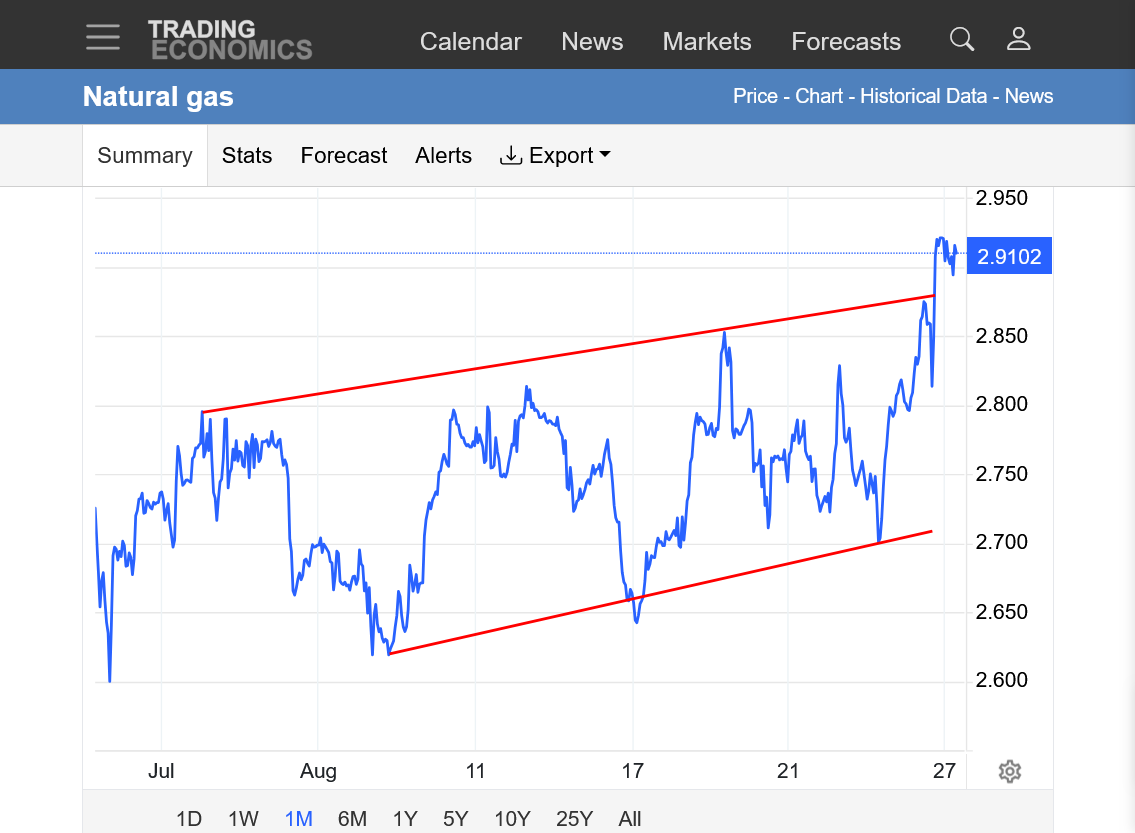
https://tradingeconomics.com/commodity/natural-gas
1. 1 month below
Our 7 day temperature source is having issues. The EIA number will be released at 9:30 am. There was some intense heat in the South last week, so look for a smallish injection compared to average(but the market expects that).
https://www.cpc.ncep.noaa.gov/products/tanal/temp_analyses.php
Tiny injection of just +15 Bcf but the market knew this and went down upon the release(buy the rumor-sell the fact type action). Note on the graph below that the current storage in blue is converging (closing the gap) with the 5 year average in gray.
However, despite all the heat this Summer, natural gas in storage remains ABOVE the 5 year average by +167 Bcf but below last year by -30 Bcf!
for week ending August 21, 2026 | Released: August 27, 2026 at 10:30 a.m. | Next Release: September 3, 2026
| Working gas in underground storage, Lower 48 states Summary text CSV JSN | |||||||||||||||||||||||||
|---|---|---|---|---|---|---|---|---|---|---|---|---|---|---|---|---|---|---|---|---|---|---|---|---|---|
| Historical Comparisons | |||||||||||||||||||||||||
| Stocks billion cubic feet (Bcf) | Year ago (08/21/25) | 5-year average (2021-25) | |||||||||||||||||||||||
| Region | 08/21/26 | 08/14/26 | net change | implied flow | Bcf | % change | Bcf | % change | |||||||||||||||||
| East | 727 | 708 | 19 | 19 | 705 | 3.1 | 692 | 5.1 | |||||||||||||||||
| Midwest | 866 | 848 | 18 | 18 | 829 | 4.5 | 818 | 5.9 | |||||||||||||||||
| Mountain | 238 | 237 | 1 | 1 | 254 | -6.3 | 214 | 11.2 | |||||||||||||||||
| Pacific | 293 | 296 | -3 | -3 | 298 | -1.7 | 263 | 11.4 | |||||||||||||||||
| South Central | 1,061 | 1,080 | -19 | -19 | 1,127 | -5.9 | 1,030 | 3.0 | |||||||||||||||||
| Salt | 248 | 268 | -20 | -20 | 273 | -9.2 | 243 | 2.1 | |||||||||||||||||
| Nonsalt | 813 | 812 | 1 | 1 | 854 | -4.8 | 788 | 3.2 | |||||||||||||||||
| Total | 3,184 | 3,169 | 15 | 15 | 3,214 | -0.9 | 3,017 | 5.5 | |||||||||||||||||
| Totals may not equal sum of components because of independent rounding. | |||||||||||||||||||||||||
Working gas in storage was 3,184 Bcf as of Friday, August 21, 2026, according to EIA estimates. This represents a net increase of 15 Bcf from the previous week. Stocks were 30 Bcf less than last year at this time and 167 Bcf above the five-year average of 3,017 Bcf. At 3,184 Bcf, total working gas is within the five-year historical range.
For information on sampling error in this report, see Estimated Measures of Sampling Variability table below.
Note: The shaded area indicates the range between the historical minimum and maximum values for the weekly series from 2021 through 2025. The dashed vertical lines indicate current and year-ago weekly periods.
https://tradingeconomics.com/commodity/natural-gas
1. 1 week: Big rally last week ahead of a bullish EIA, along with more heat in the forecast. After the release of the bullish EIA number, it was buy the rumor, SELL THE FACT action DOWN.
2. 1 month: Uptrend with higher lows and higher highs still valid but we are struggling to hold the previous high this evening with WEAK action considering the HOT forecast.
3. 1 year: Double bottom with April and August lows. Seasonals are up! Is this an ascending wedge/triangle? Seems unlikely to be a bear flag but that's in play.
The last 0z European Ensemble model was slightly less hot, -2 CDDs from individual days in the forecast being a tad less hot(in the same pattern). That apparently put pressure on the price thru the early morning hours.
Overall, however CDDs, though dropping parallel to the seasonally dropping green dashed line(closing the gap a tiny bit), will remain greatly elevated ABOVE average.
The likely scenario with this is that the small surplus in storage based on the 5 year average that ng has had, will be eroded the next few weeks and could become a small deficit in September as we approach the peak in massive injections that usually occurs between the cooling season and the heating season that features very little demand for NG that is burned to generate electricity for heating/cooling.
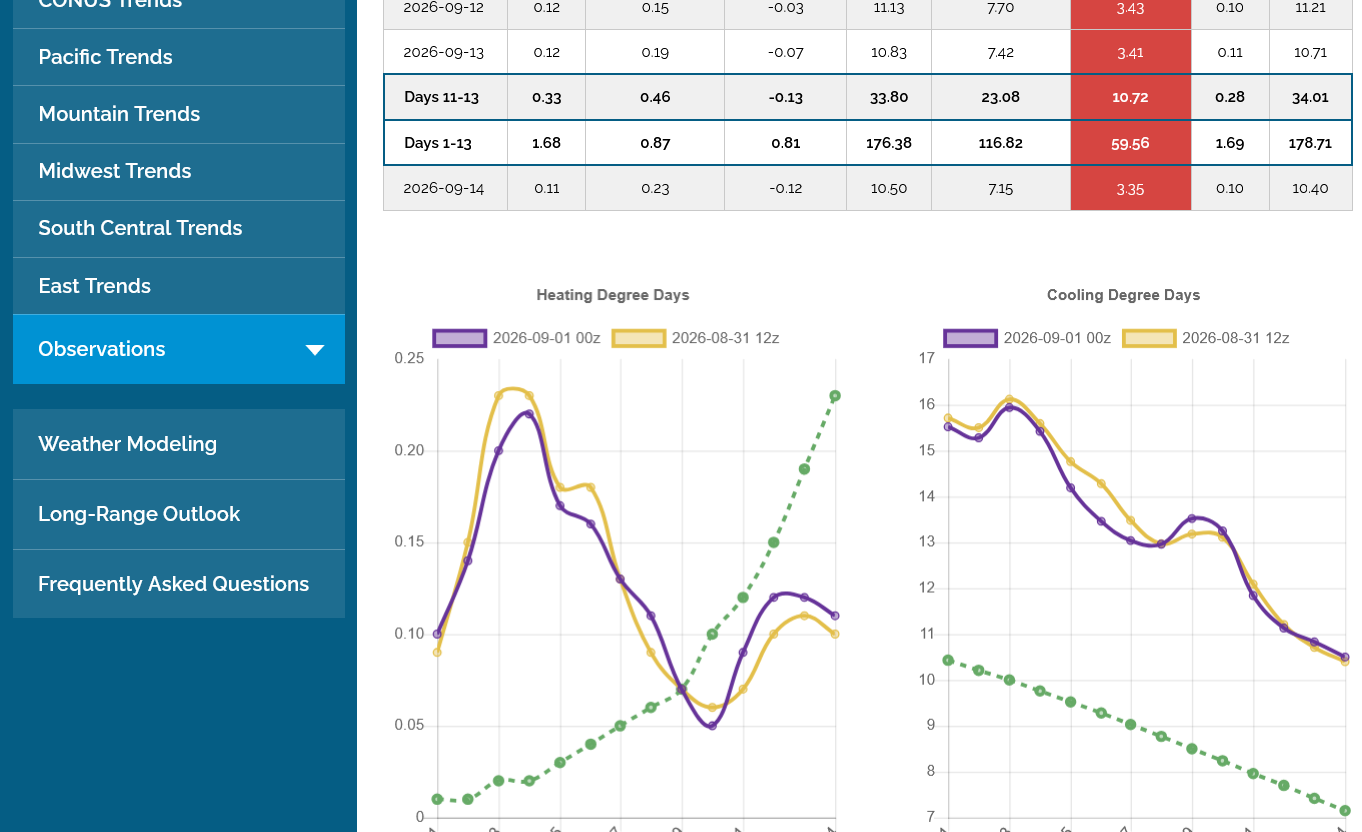
The overnight, 0z European Ensemble was just +2 CDDs from slightly hotter individual days from the same weather pattern. Not much impact/reaction to prices from this data. Weather trading in natural gas in September is not usually the best month in most years (CDD season winding down-HDD season still many weeks away) but seasonals turn strongly up by late in the month and the current weather is extremely bullish!
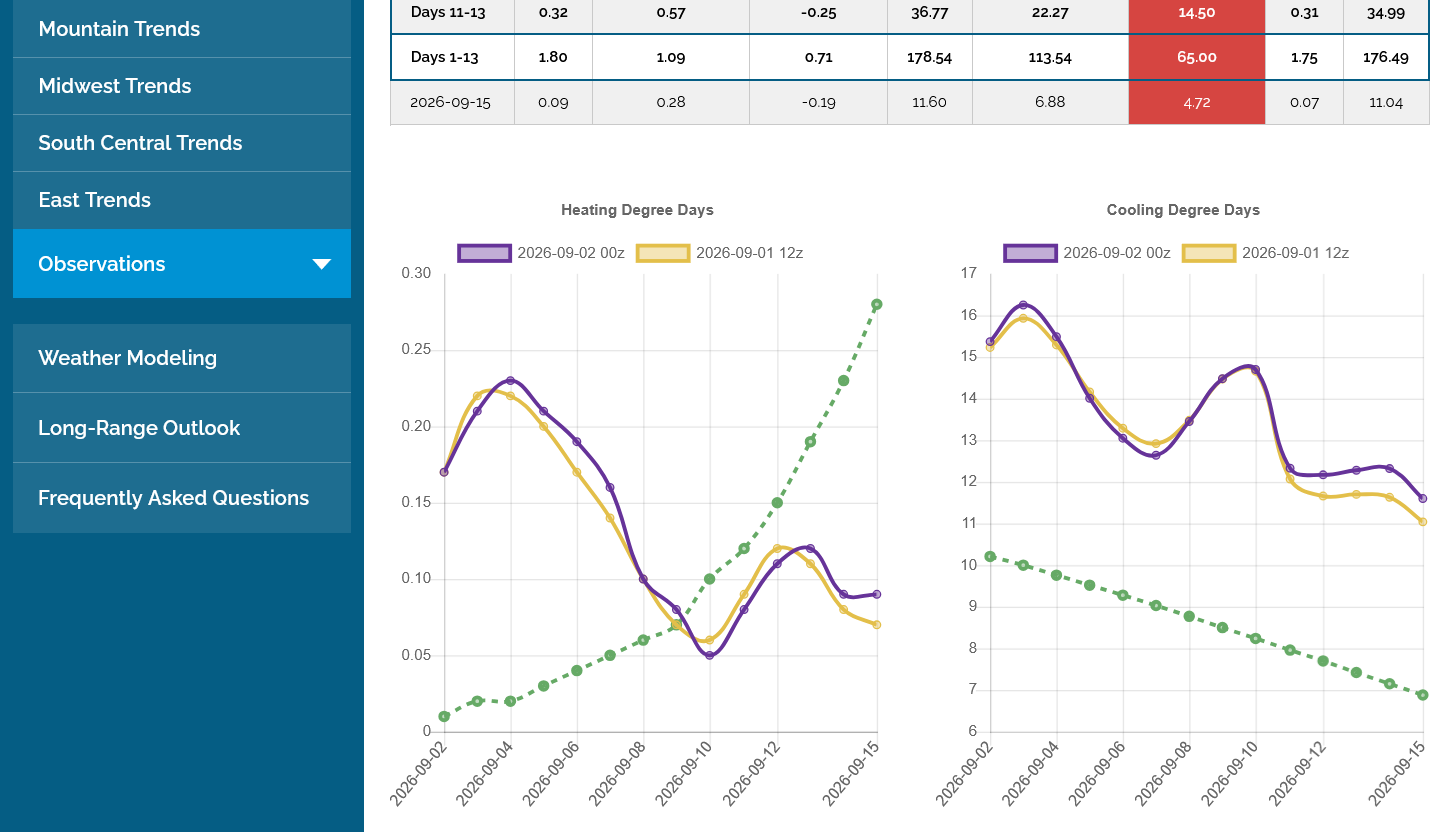
+++++++++++
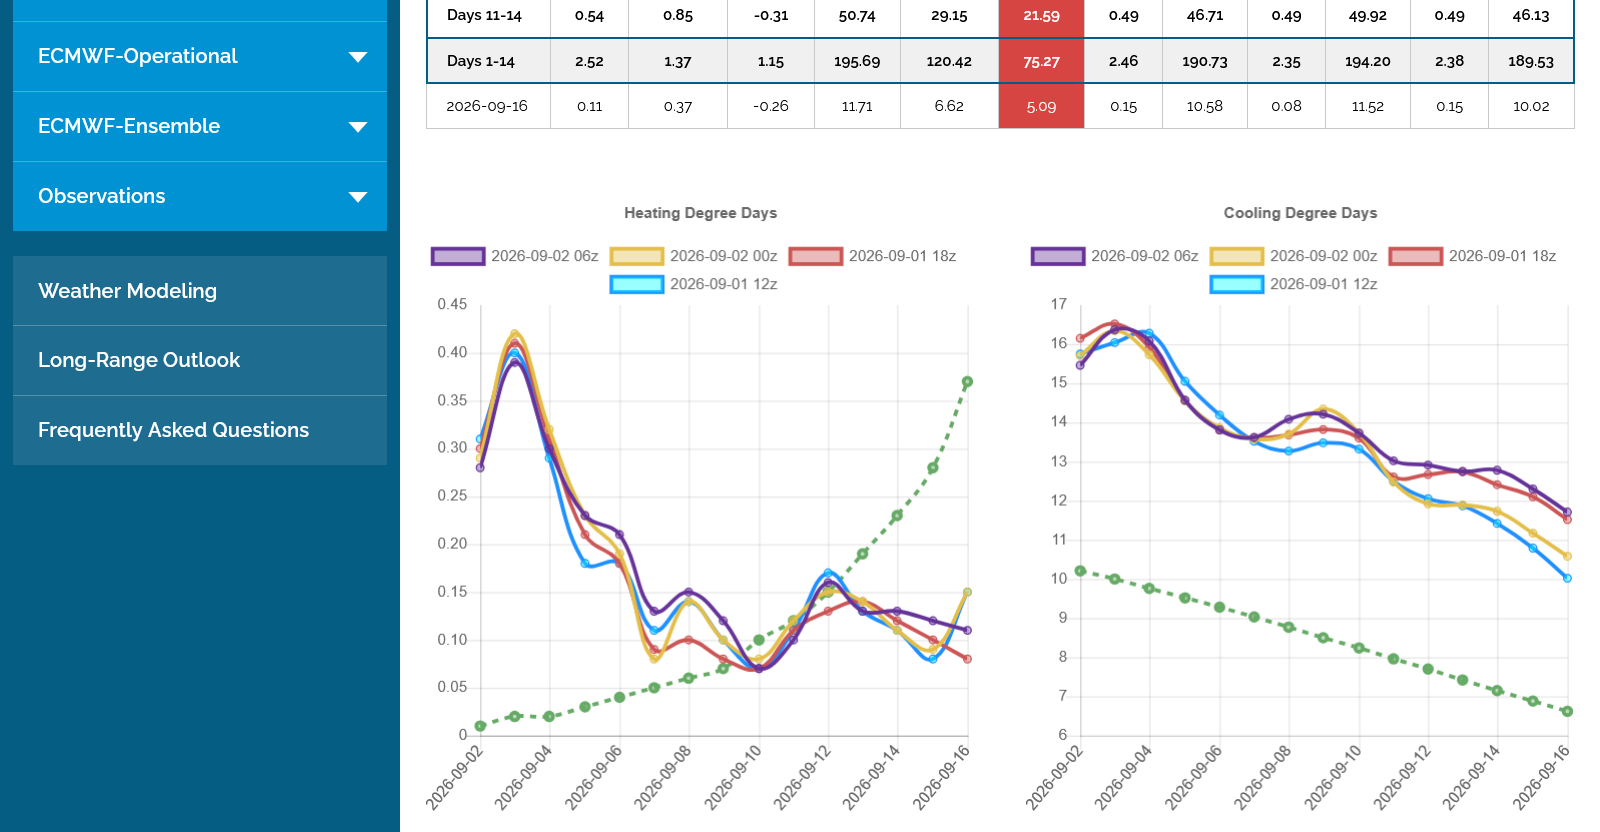
These were the last 4 solutions from the GEFS(6 hours apart), last one in purple just out being the hottest: The lines are all parallel to the historical cooling trend in green. However, every day is MUCH HOTTER than the average and they all add up to an unusually high, CUMULATIVE residential demand for NG used to generate electricity for cooling compared to average.
It's not just HOW hot it will be but how hot it will be compared to average and how hot it will be compared to yesterday's forecast that matter the most.
++++++++++++=
By far, the most frequent and SMART trading decision for a weather trader is TO DO NOTHING! Keep your powder dry, wait, then wait more......until you have the right set up. The wait is usually many weeks, often even months but the optimal set ups always emerge because the weather patterns are always changing and sometimes they feature extreme temperatures that were not there before. That's the time to LOAD THE BOAT! Your patience will be rewarded.
Don't mess with low confidence trades because you "need" the action or because you "want to" make money or for any other reasons that don't line up with your well defined set up for an optimal, high confidence trade that matches YOUR game.
The market is NOT playing YOUR game most of the time. Wait for everything to line up strongly enough in 1 direction, then when you pull the trigger with that higher confidence that comes with BEING SELECTIVE, risk MUCH MORE to reap MUCH BIGGER REWARDS. Use up a large amount of your position leveraging margin money to increase the size of your position
If you did your homework and have a good plan, you will make a ton of money in the long run. Keep in mind that the majority of traders lose all their money and many of them are really smart people. Be honest enough to recognize that and either change your trading strategy or follow the markets for fun without risking real money and find other ways to make money.
The top priority in trading futures is NOT to make money.
The top priority in trading futures is to NOT lose money on dumb trades and to NOT lose an excessive amount of money on any 1 trade!
And have a disciplined, risk/rewards strategy BEFORE putting the trade on.
Being humble and honest are key components to that!
You can fool yourself. You can fool other people.......but you can never fool the markets!
You can spend years trying to fight that, while it sabotages your trading. Then, very suddenly you gain humility and it sets you free! Just as suddenly, your new found humble psyche allows you to view the markets in a NEW way that takes out the ego thorn which was sabotaging your results from that destructive mindset.
++++++++++++=
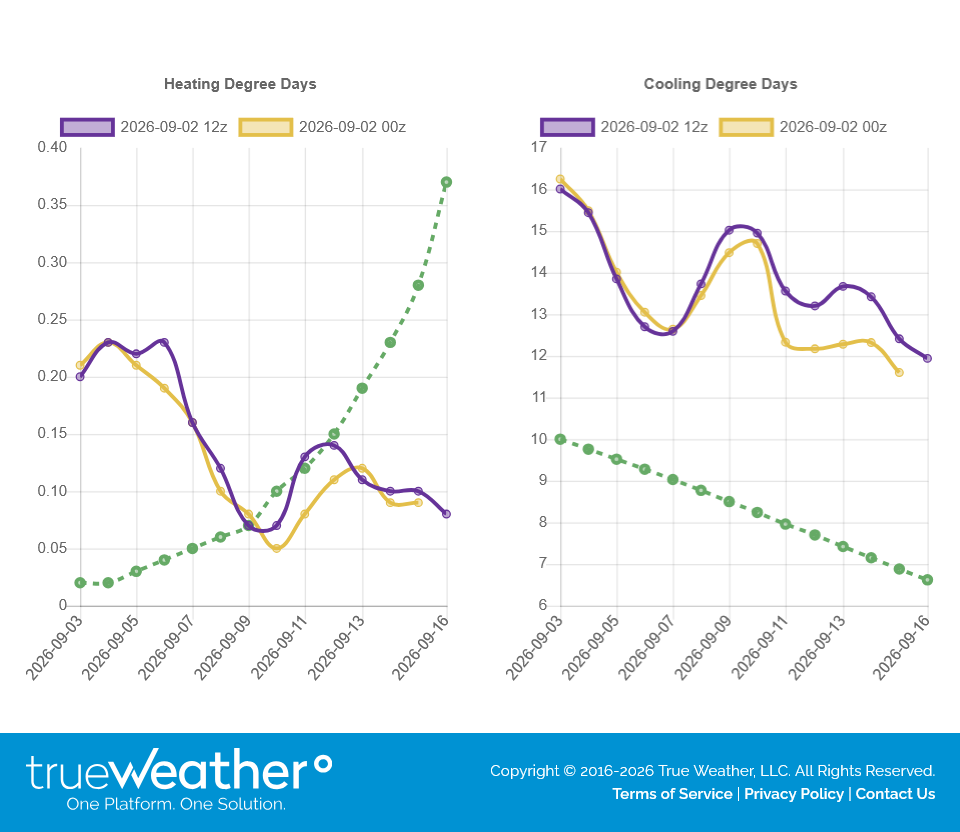
5pm: The last 12z EE was a whopping +6 CDDs hotter (purple line/right)and with no end in sight to this heat thru week 2, we are having an upside breakout above $3!!!
https://www.marketforum.com/forum/topic/83844/#83852
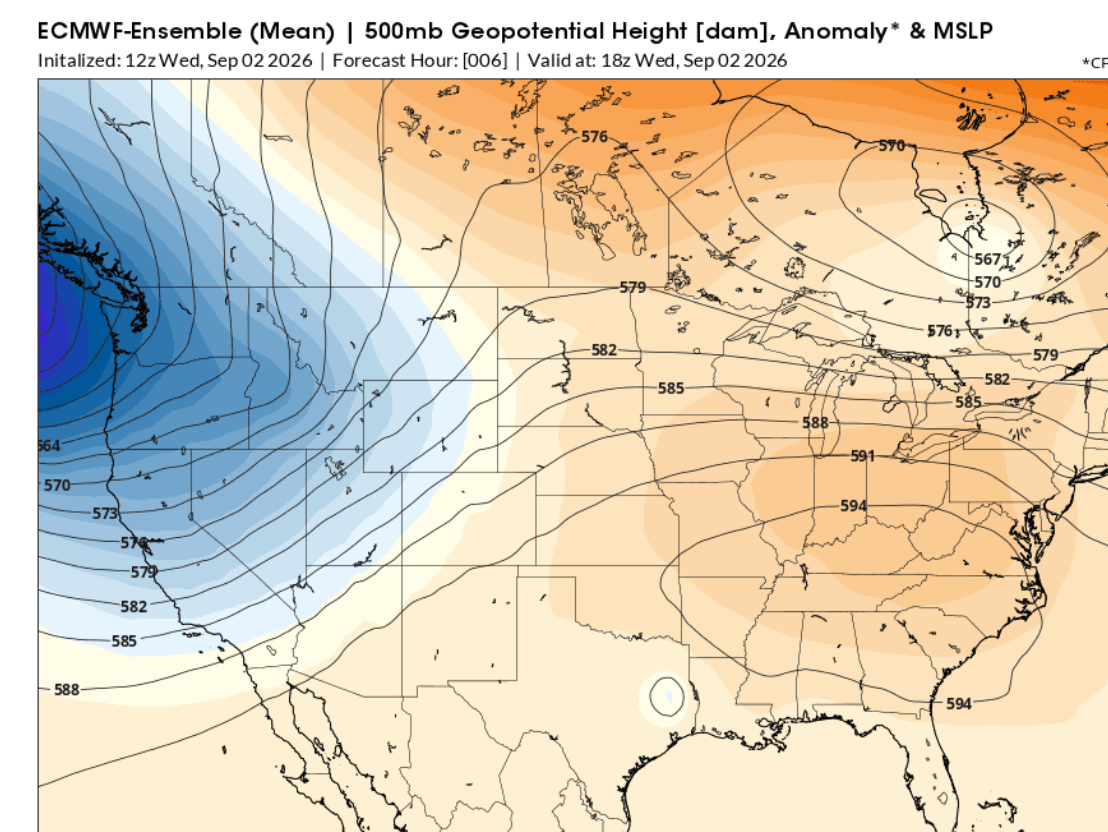
This heat dome is NOT going away!!!
This is what the expansive, rain suppressing heat dome looked like today, September 2, 2026 based on the last 12z run of the European Ensemble model. This is 500 mb which is around the mid point of the atmosphere based on its mass/weight. In this case
A 500 mb geopotential height of 594 on a summer weather map corresponds to an altitude of 5,940 meters (about 19,488 feet or 3.7 miles) above sea level.
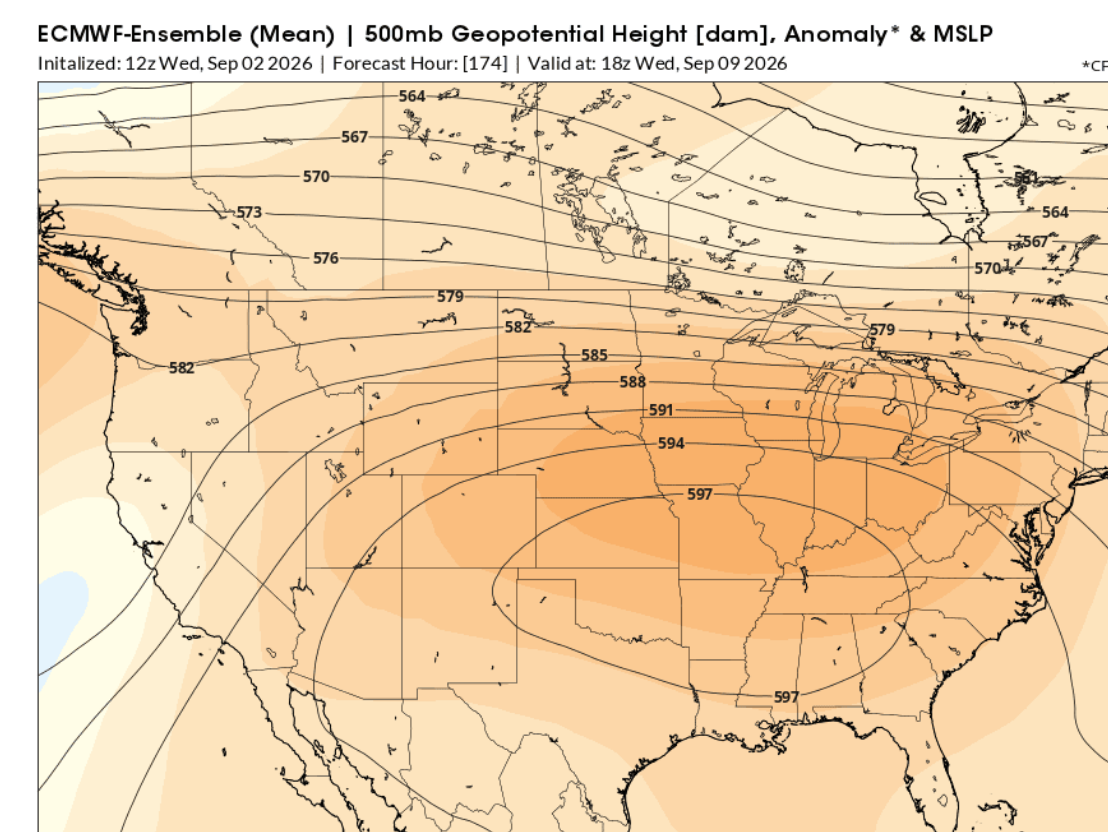
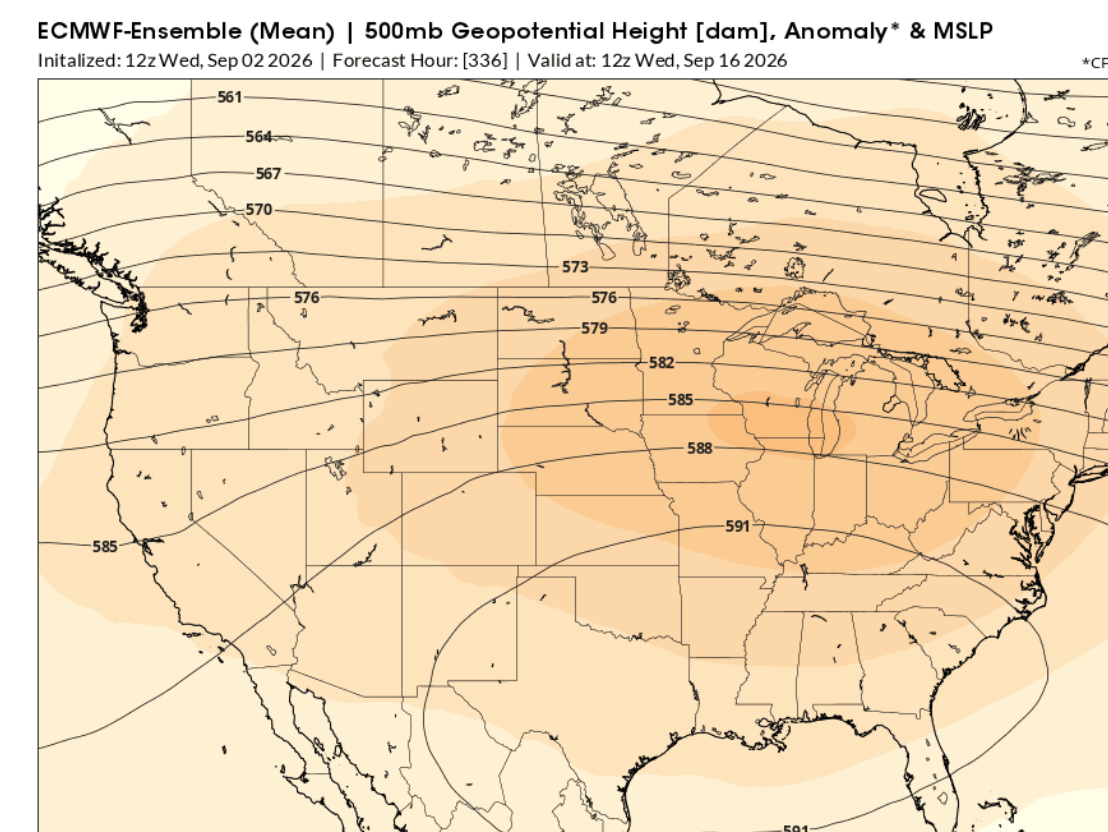
The hotter it is the less dense the air and the fatter the atmosphere becomes with the 594 contour (for 500 mb) only showing up when the atmosphere has really expanded from HEAT. Maps below
1. Wednesday(today) September 2, 2026: 594 closed contour.
2. Wednesday, September 9, 2026: 597 closed contour!!
3. Wednesday, September 16, 2026. Massive 591 contour! However, longer range models rarely dial in extremely anomalous temperatures accurately. They gradually revert towards the climatological average with time and they slowly lose skill to discern between that and the extreme weather coming up!!! So odds are high that it will be hotter than this forecast with the same pattern. And the pattern could change completely too!!!
https://tradingeconomics.com/commodity/natural-gas
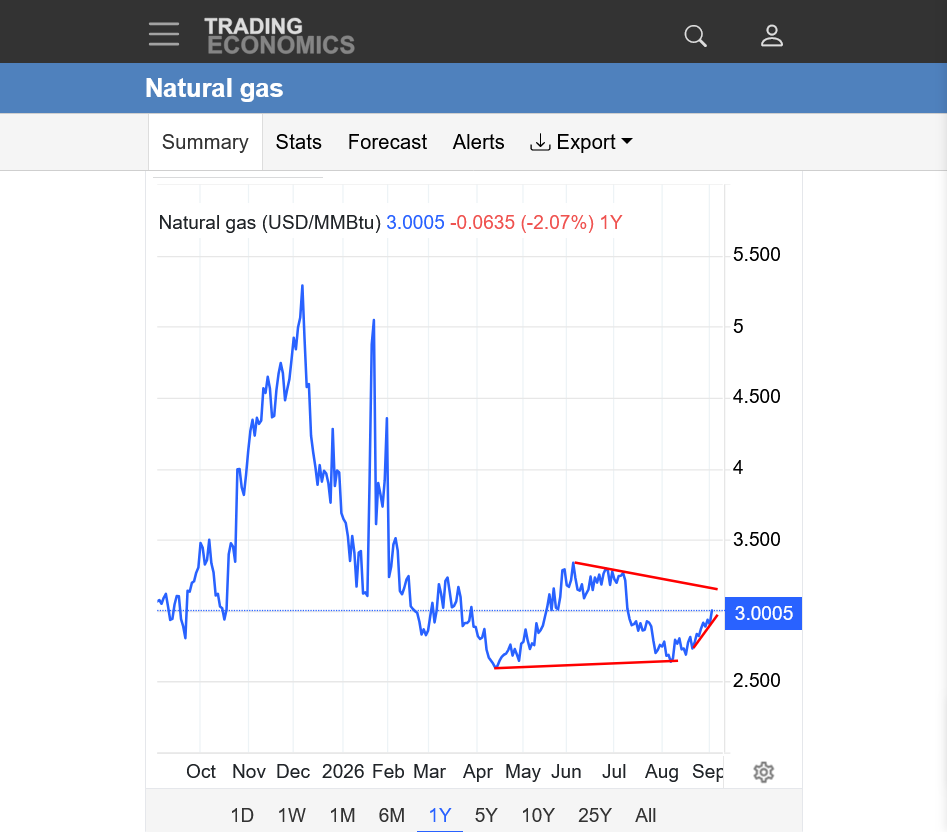
1 year below: Major low in April(seasonal). June high, lower high in July. Higher low in August with uptrend from the heat since then. Symmetrical triangle pattern with the higher lows and lower highs.
++++++++++++
7 day temps for Thursday's EIA storage report at 9:30 am.
https://www.cpc.ncep.noaa.gov/products/tanal/temp_analyses.php
HOT western half to TX. Mild Midwest to East. Especially HOT Southwest to TX.

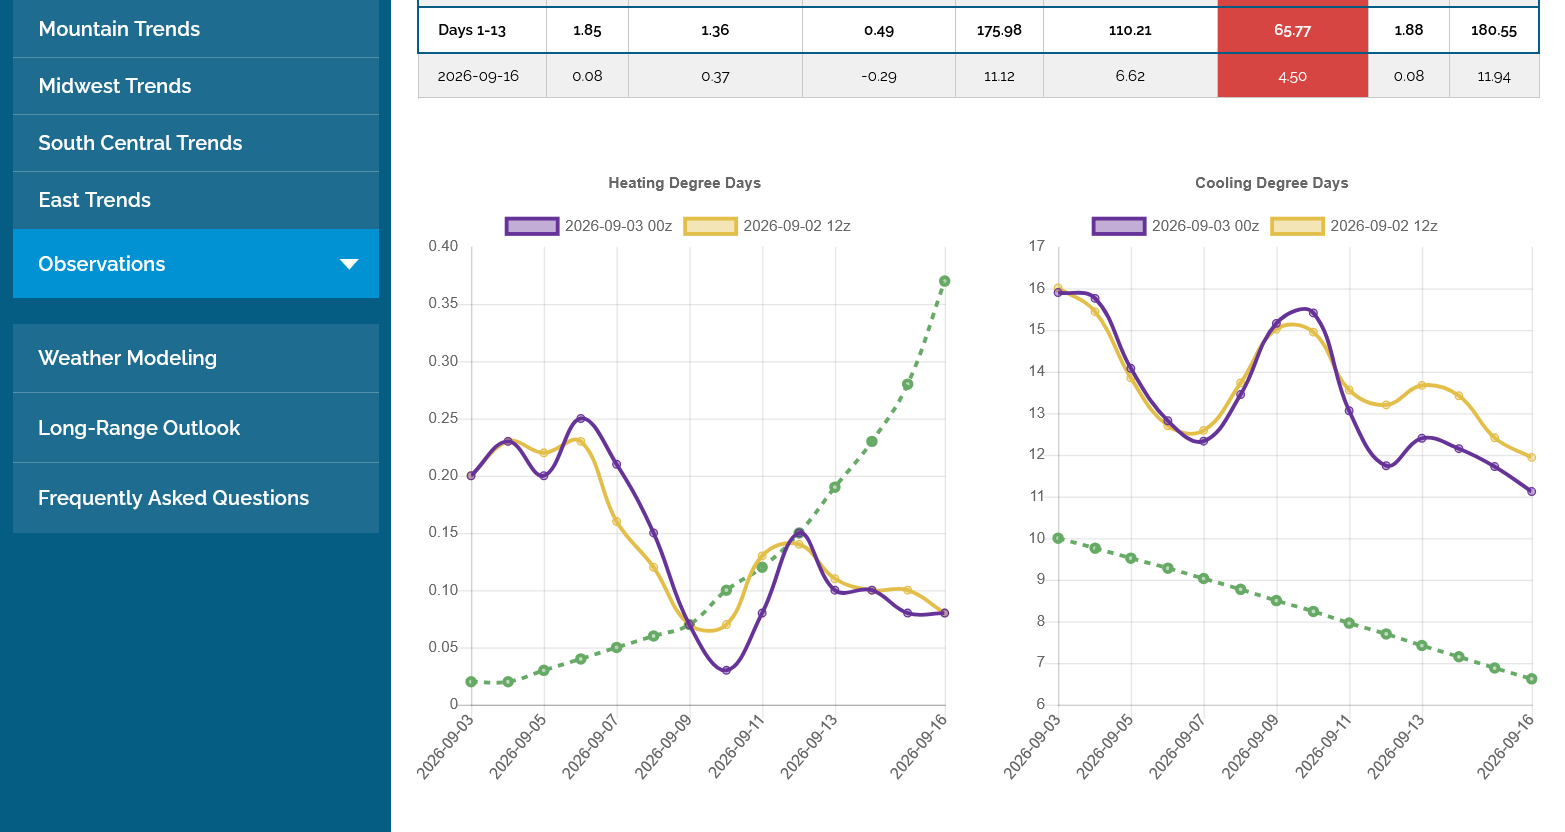
The last 0z European Ensemble market was -4.6 CDDs bearish which caused NG to drop back below $3. It was entirely from less hot week 2 individual days and not from a pattern change.
However, there are some signs of more cooling(less heat) very late in the period on some models runs.
Noon:
https://naturalgasintel.com/news/in-line-storage-injection-sends-natural-gas-futures-adrift/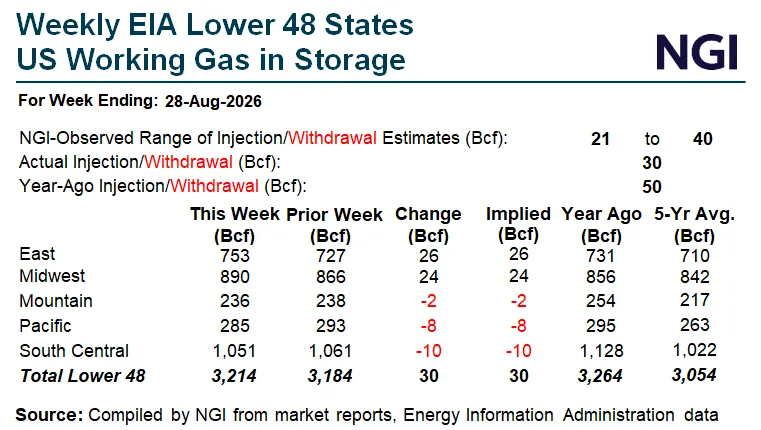
++++++++++++++++++++++
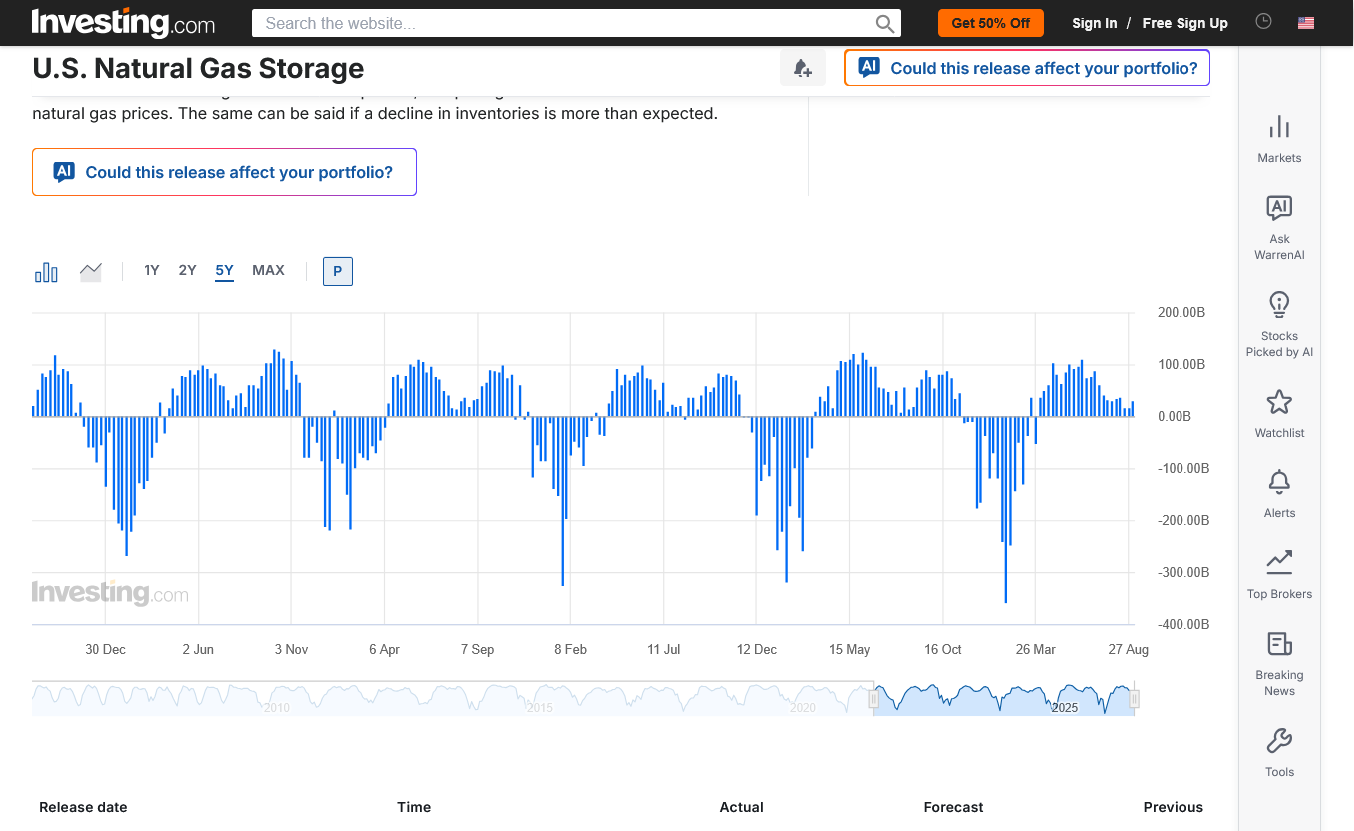
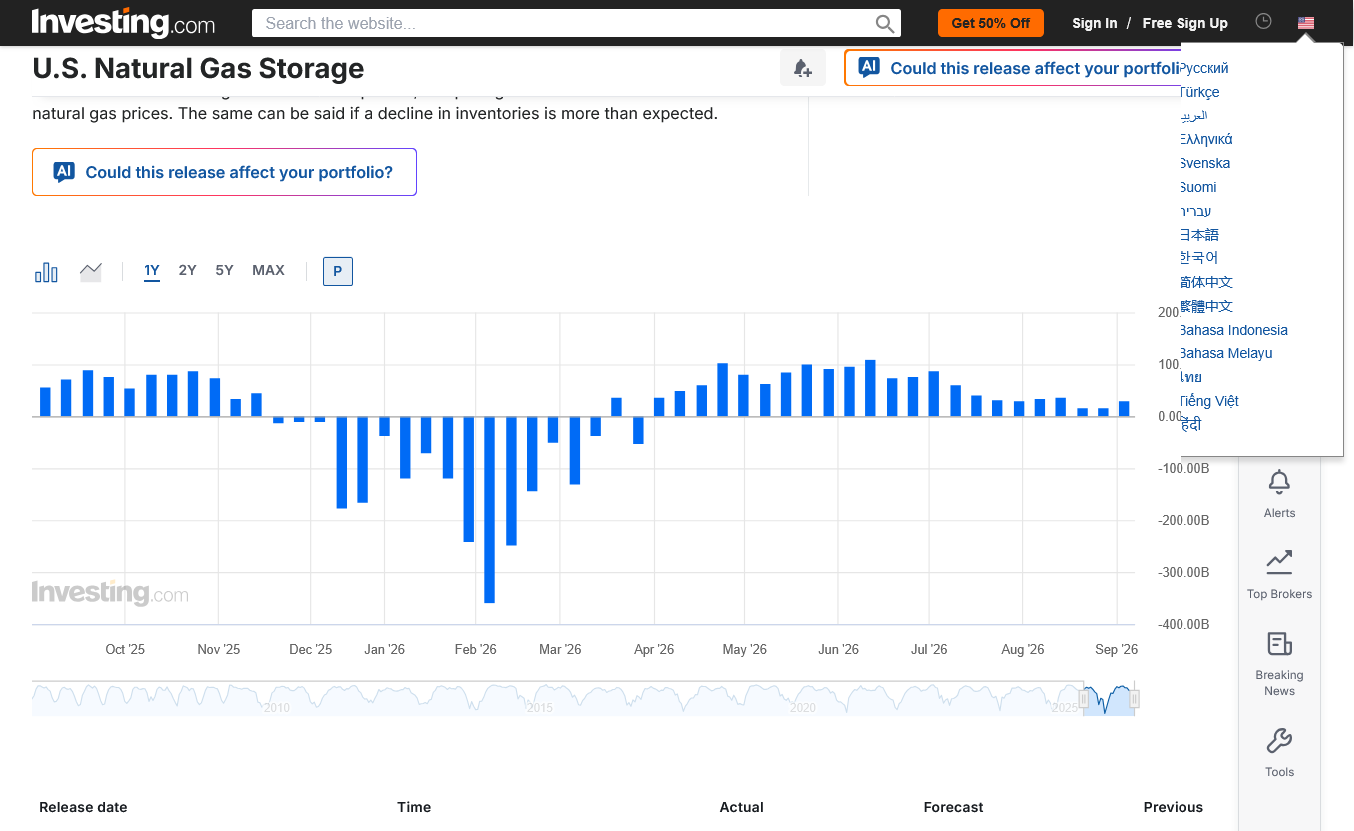
You can compare injection/withdrawal seasons at this wonderful link or you can just look at the last year.
https://www.investing.com/economic-calendar/natural-gas-storage-386
1. Injections/withdrawals the past 5 years.
2. The last1 year
++++++++++++
https://tradingeconomics.com/commodity/natural-gas
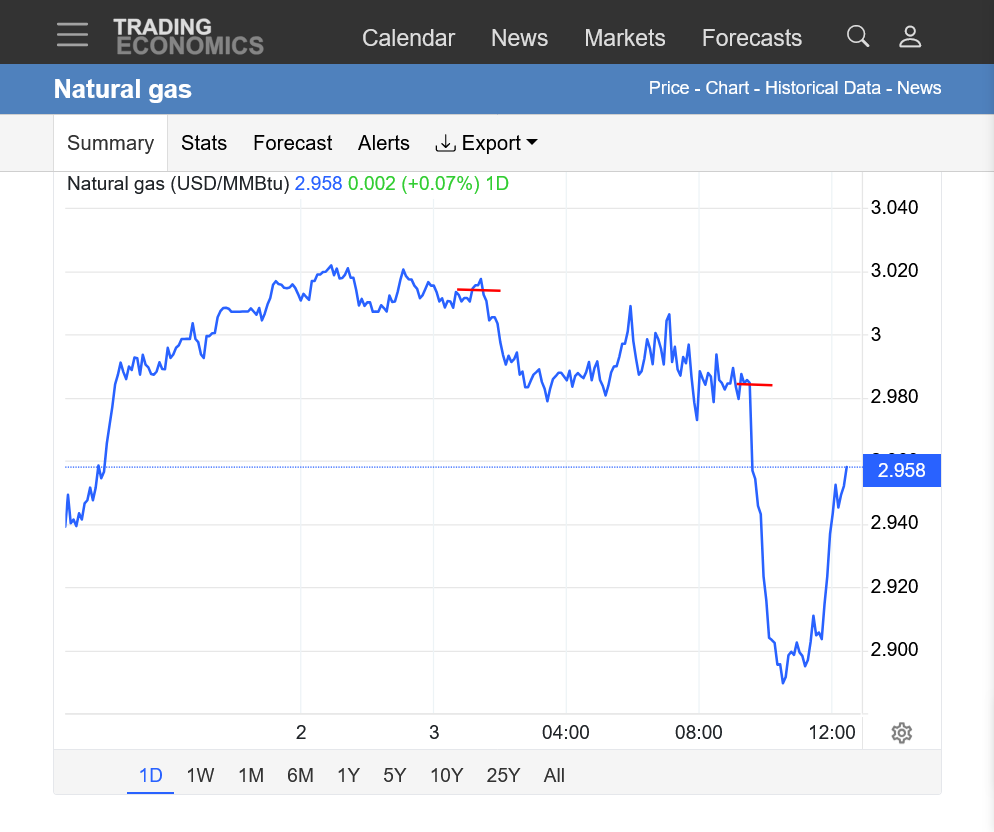
1 day graph of front month, October natural gas. Move about $3 early in the evening. 1st horizontal red line=less hot 0z weather models start coming out. 2nd horizontal red line=9:30am EIA storage date released. They say it was in line with expectations but the market's plunge profoundly suggested that it was BEARISH compared to expectations or else it was a buy the rumor/sell the fact reaction!
We've recovered most of the post report losses with 2 weeks worth of additional anomalous heat on the way.
https://tradingeconomics.com/commodity/natural-gas
+2.5 CDDs/slightly bullish for the last 0z European Ensemble model from hotter individual days in week 2, in the same weather pattern(cooling late-but close to parallel with the green line/climatology, while staying greatly elevated ABOVE the green line.
This will cause the next several EIA reports to show small injections for September(bullish) and cause the current surplus with the 5 year average to SHRINK!
From late September thru November is seasonally a very strong up in natural gas as speculators load up ahead of Winter and commercials/end users stock up.
Some of this is from the "self-fulfilling prophesy effect"! When a market expects something to happen because it usually does every year, traders will dial that into expectations and it make it a reality THAT YEAR!
AI Overview
+++++++++++++
This impact all markets and the Composite Man from Richard Wyckoff(entire market) at times.
Money flows are dumping in from rich people based on the principle of a "selffulfilling prophesy".
https://philonotes.com/2024/12/robert-k-mertons-theory-of-the-self-fulfilling-prophecy ...
+++++++++++++
Be selective in your trading.
Use the highest confidence trades and increase size based on confidence. Spend most of your time watching, analyzing and waiting for those times. You will miss tons of trades but the ones you pick will have a much higher % being winners and less account churning, less fees and less emotional draining and less losers.
Patience and confidence, along with analysis of the CORRECT elements that matter to the Composite Man from Richard Wyckoff who determines price.
https://medium.com/@Blocksavant/composite-man-ca18c9d2d5a5
++++++++++
But that's just me. Traders can decide for themselves how to trade!
After being bombarded with cooler(less hot) forecasts over the weekend, natural gas opened lower and stayed under pressure most of the night.
The last 0Z run of the European Ensemble model, however added +2 CDDs to the US forecast(purple/right line) and contributed to some bullishness early this morning. As mentioned previously, late Sept thru November is a strong up seasonal in natural gas that makes it a NEVER be short trade, just like April/May is a NEVER be short trade for me, outside of something that is extremely compelling.
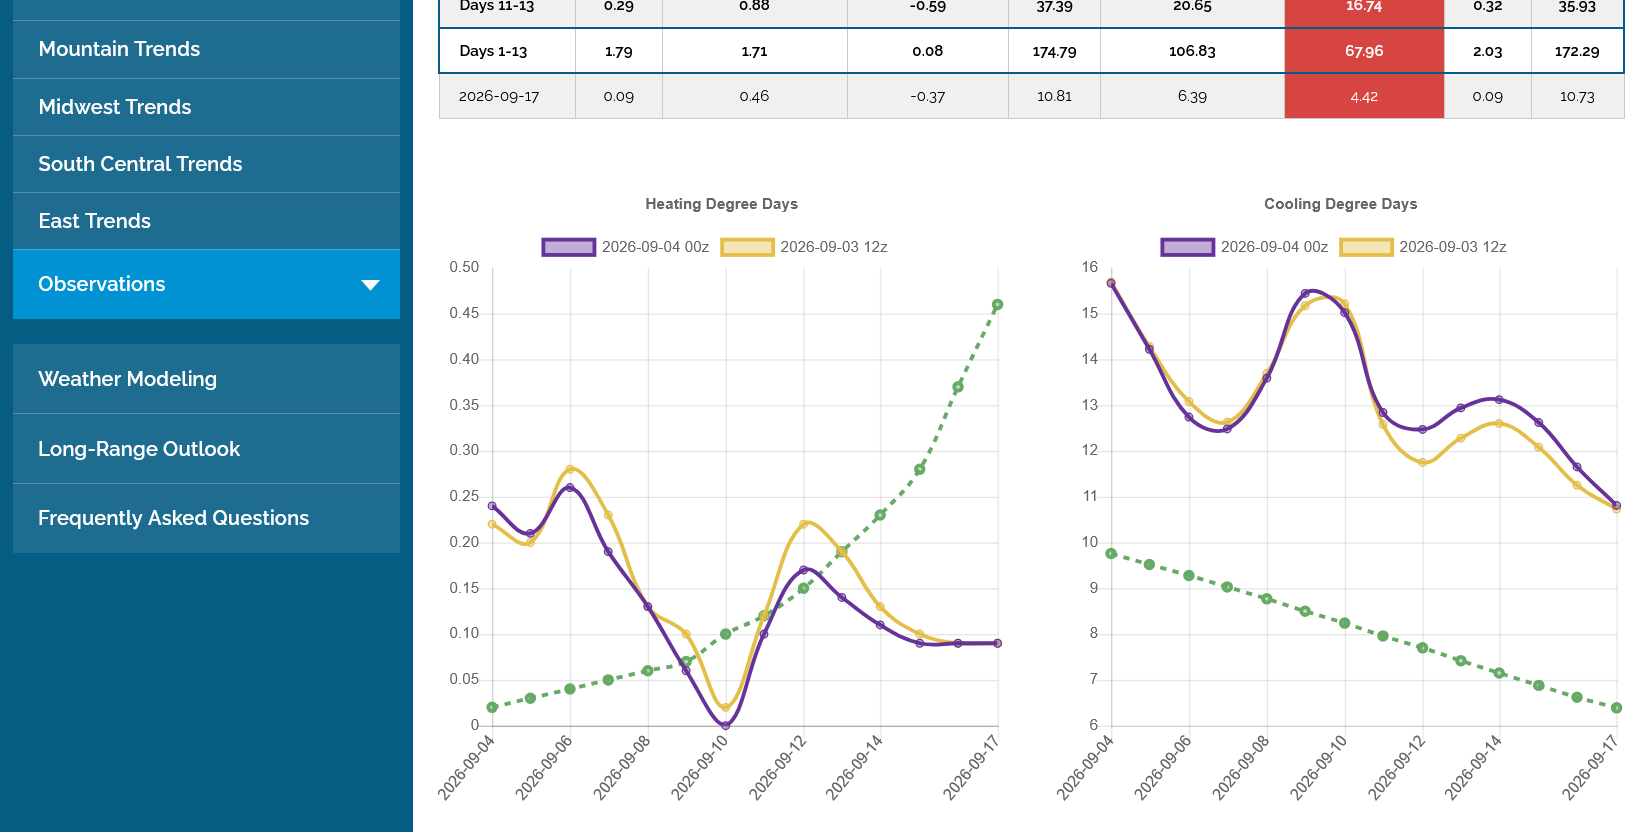
A perfect example of why is the graph below. Note the BEARISH convergence of CDDs in the forecast with the seasonal green line. The weather is turning LESS bullish/bearish but NG won't go down (it's around unch and above the open in light volume, holiday trading).
From our heat wave thread:
Re: Re: Re: Re: 9-6-26 Finally MAJOR Heat relief in sight!!!
By metmike - Sept. 7, 2026, 10:12 a.m.
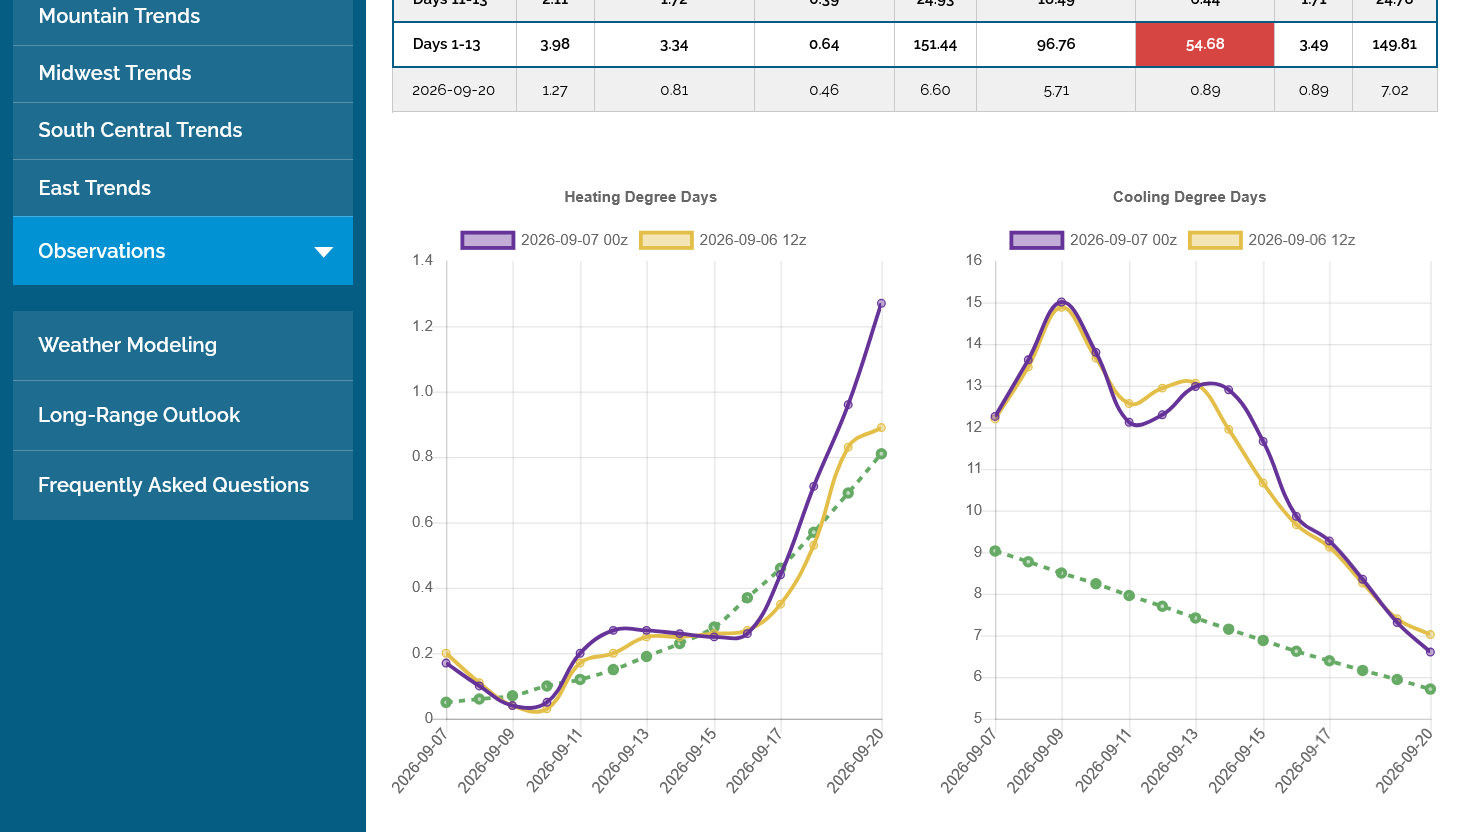
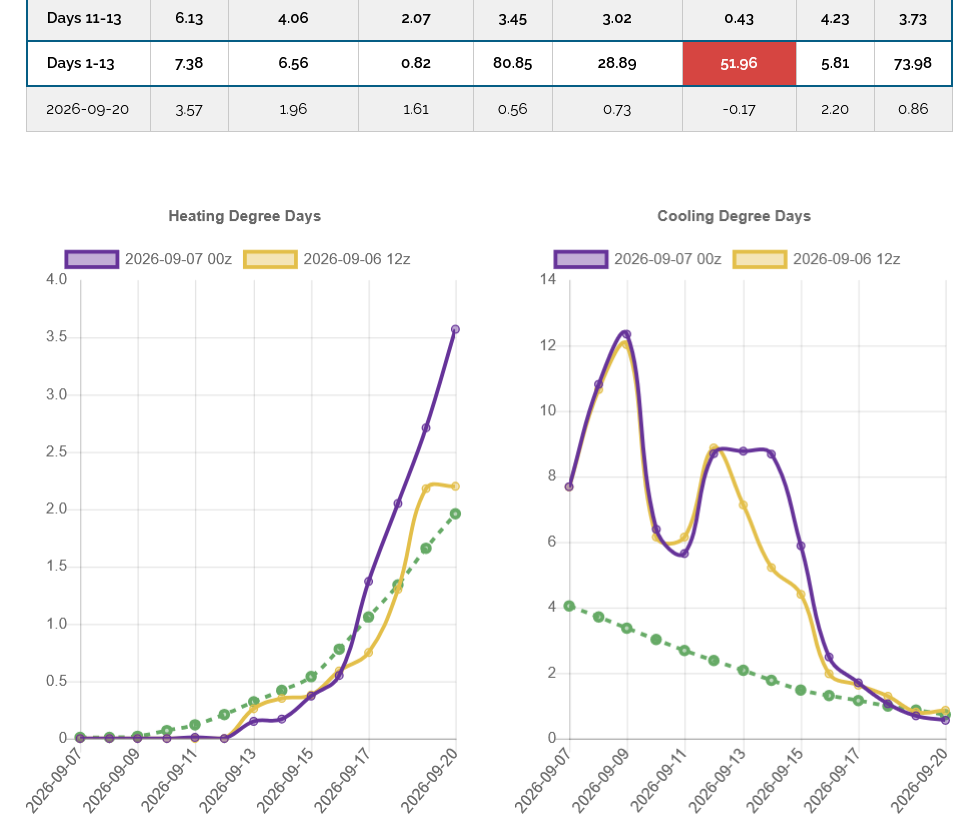
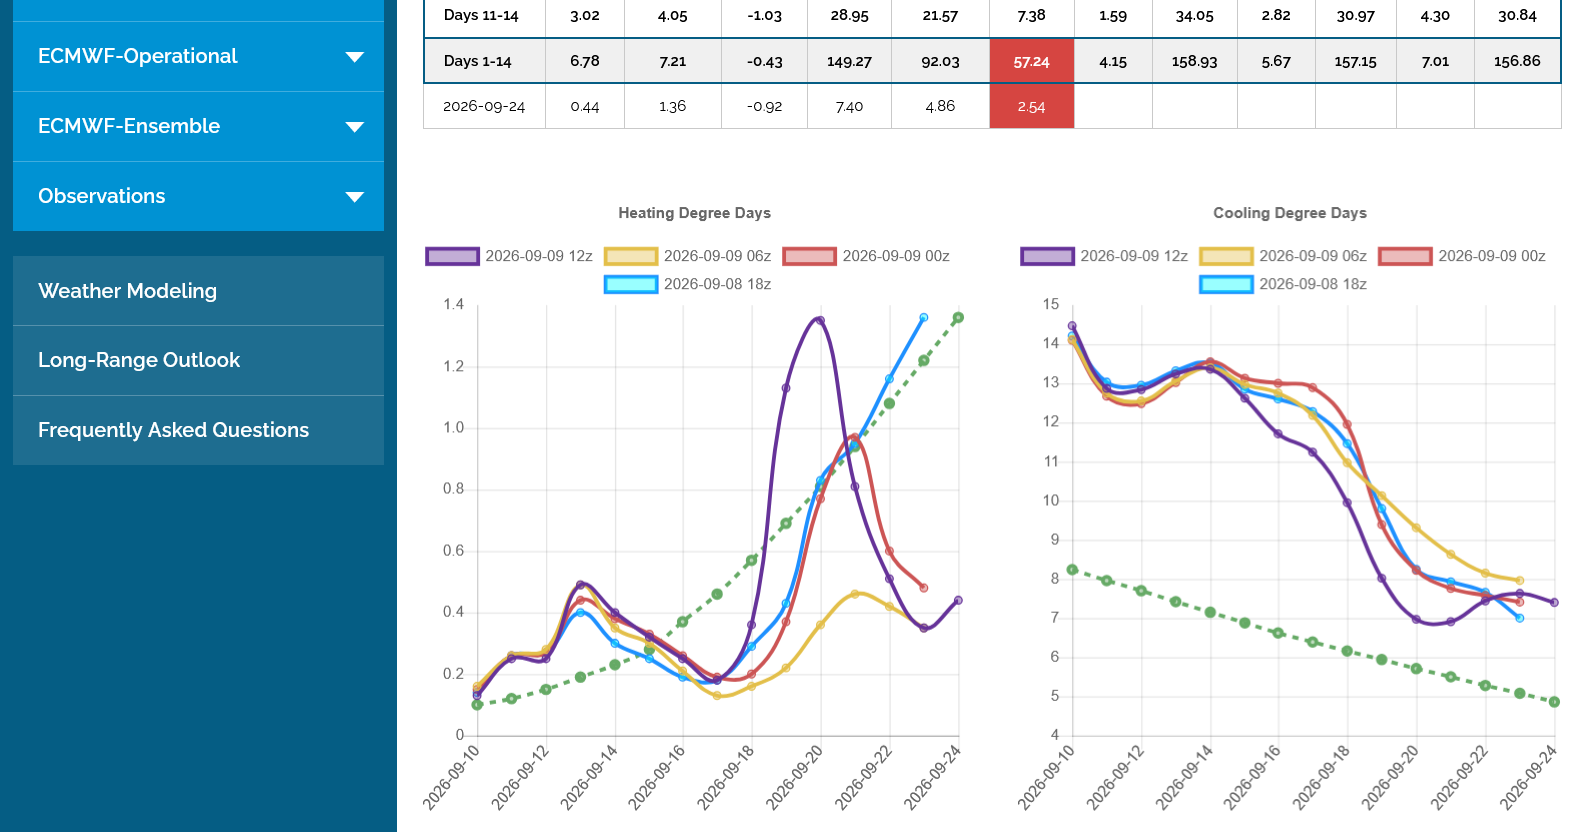
The last 0z European Ensemble model's CDDs were +8 CDDs vs the previous run with another SURGE IN HEAT as seen in the bump up in the middle of the graph on the right for the purple line.
This is a temporary/short term dynamic as the OVERALL pattern below continues to feature a steep drop in the down slope that takes the predicted CDDs from greatly elevated on the left(next couple of days) to almost average on the right, as the purple line CONVERGES with the green dashed line(climatological average-which is falling but not as fast as the actual temperatures will be falling).
+++++++++++=
https://tradingeconomics.com/commodity/natural-gas
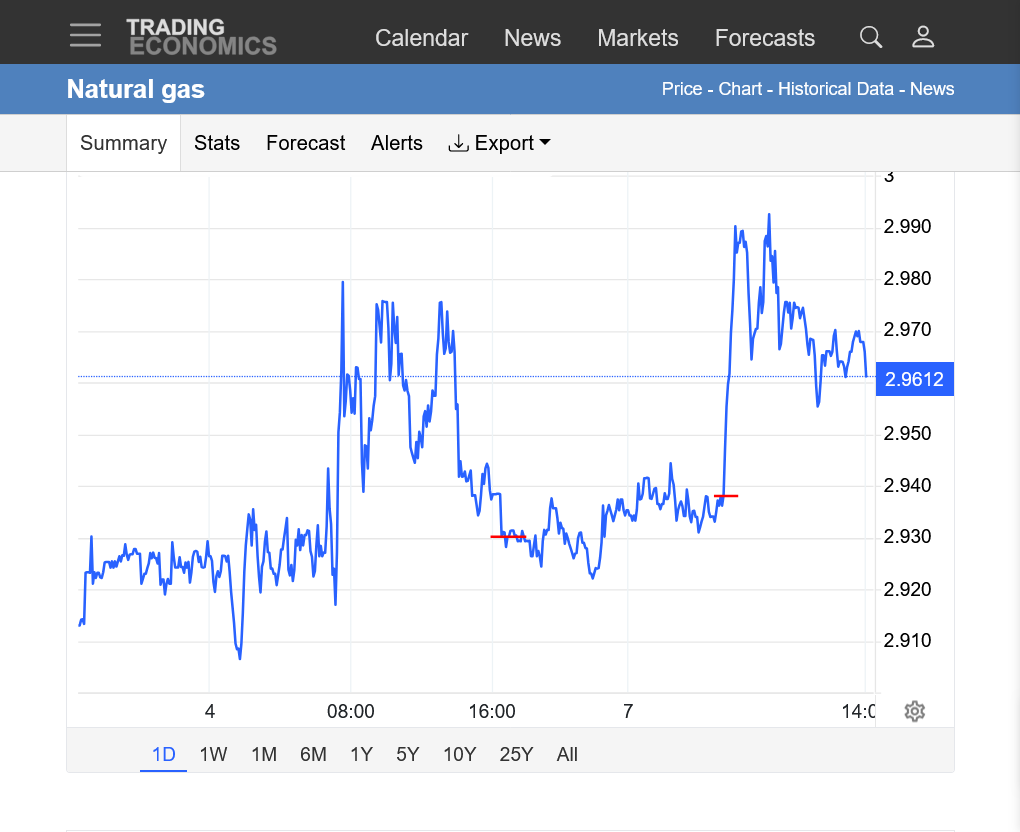
1 day below.
The 5pm Sunday open horizontal line in red. Also the red line that defines the time when ng took off like a rocket around 5:30 am CDT. It sure looks like some sort of news was released to cause such a sharp, knee jerk reaction like that but i have no idea what that was. Weather in mid-September is losing its impact with HDDs passing up CDDs on the top map for the entire country in early October(with both of them low).
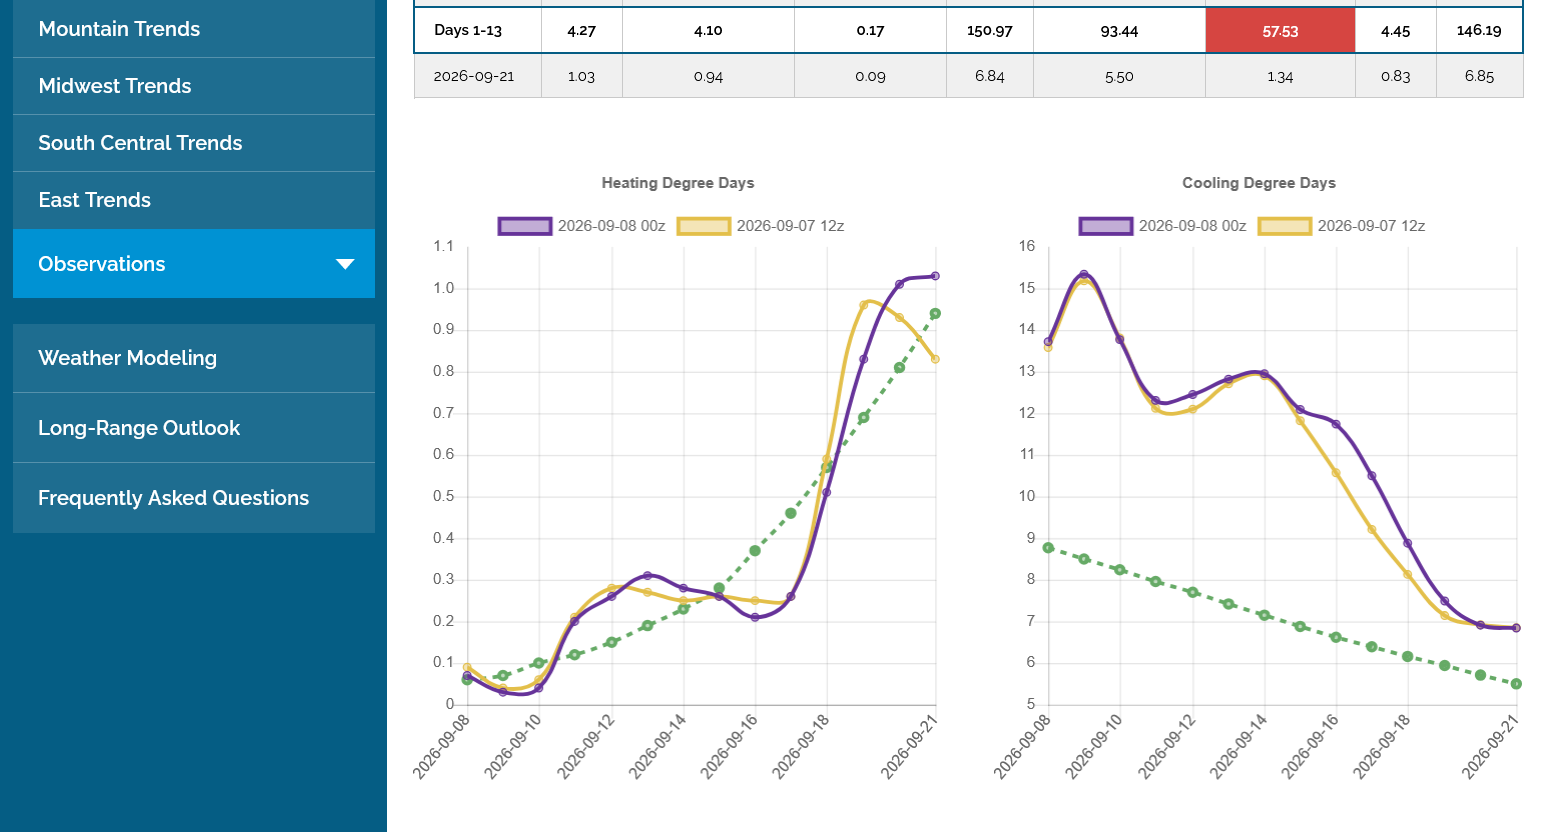
The last 0z European Ensemble model was +4.8 CDDs warmer. This helped NG bounce to the highs of the session. However, it was just from warmer individual days in a pattern change that features the lines below, on the right CONVERGING with the average green line as the heat goes from anomalous at the start of the 2 week period(left) to just seasonably warm(right). So LESS bullish compared to previous weeks in a time frame where CDDs are having rapidly waning impact on demand for natural gas from residential cooling.
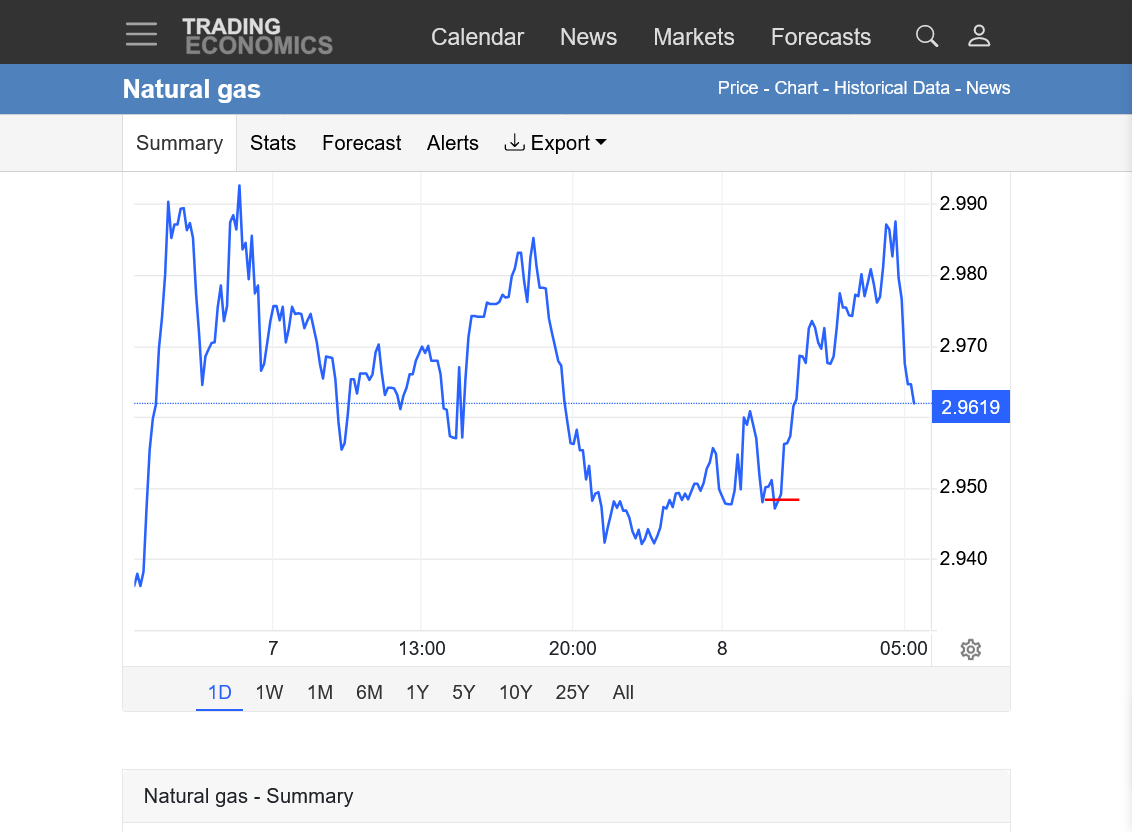
https://tradingeconomics.com/commodity/natural-gas
1. 1 day graph. Red line is when the hotter guidance started coming out.
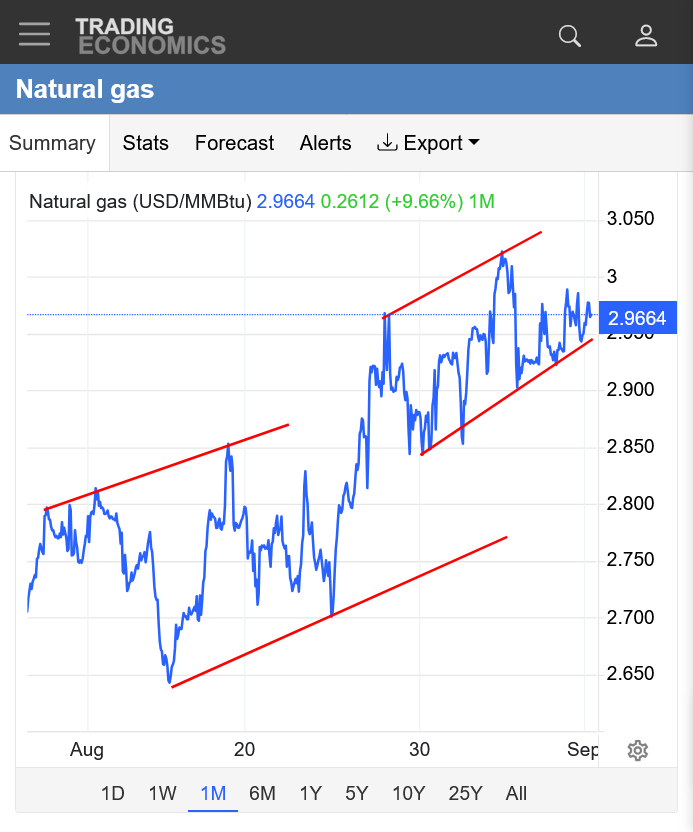
2. 1 month: UPTRENDING!
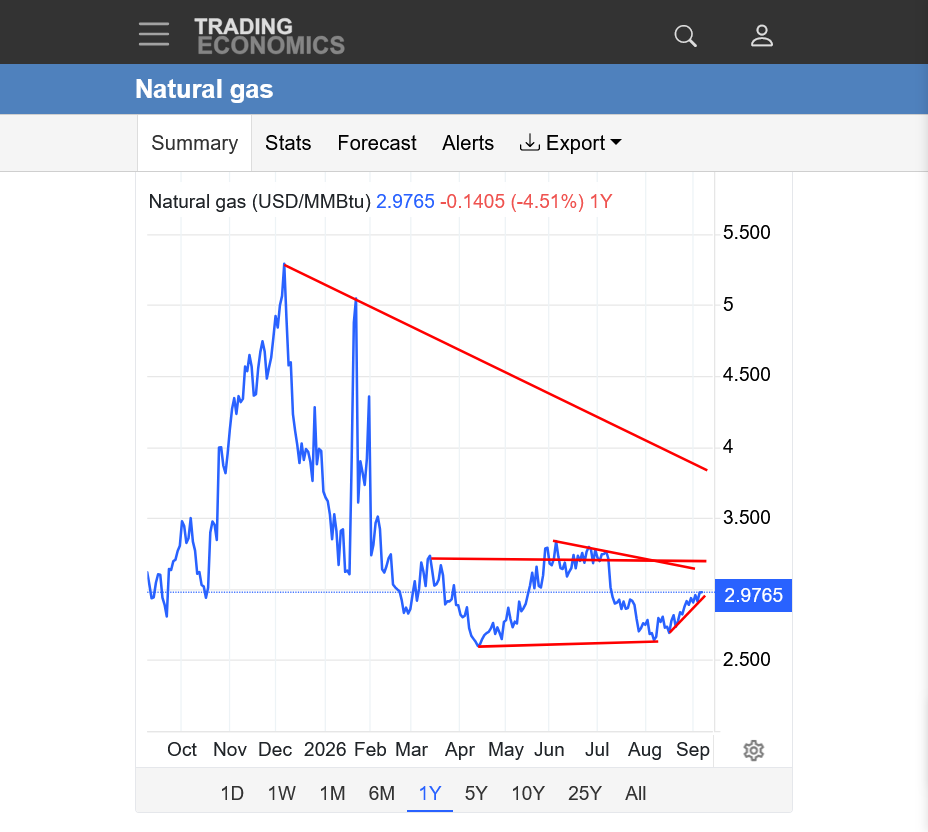
3. 1 year: Symmetrical triangle with lower highs and higher lows. Bulls have had the advantage from the intense heat and increasing demand recently. Temperatures will cool a great deal the next 2 weeks so weather is no long bullish.
++++++++++++
The EIA report this week will have one of the smallest September injections in history from the intense, near record heat last week!
The market traded this weather, starting in mid-August!
https://www.cpc.ncep.noaa.gov/products/tanal/temp_analyses.php

11am: Seasonals for natural gas ARE FLAT here but every year is different! Here in early September, we are having a pattern change from intense heat/bullish to seasonally warm/NOT bullish, which is a bearish change.
Seasonals turn sharply up ahead of the main demand season(Winter and HDDs).
https://charts.equityclock.com/natural-gas-futures-ng-seasonal-chart
https://tradingeconomics.com/commodity/natural-gas
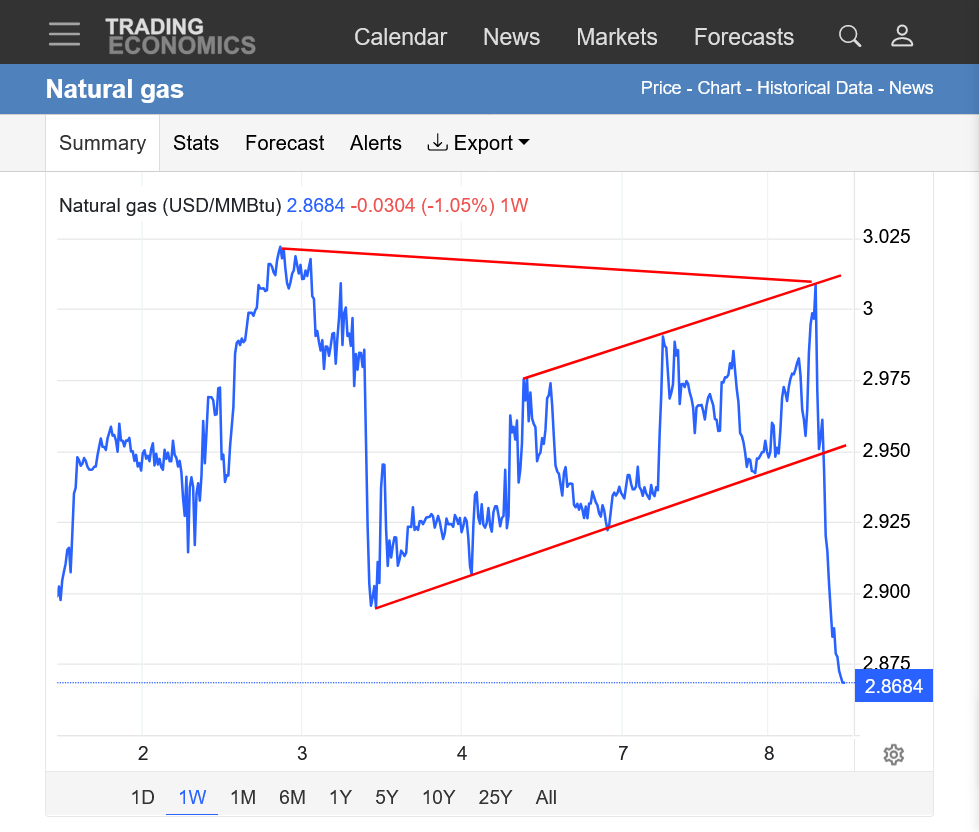
1. 1 week: Big traders took over with massive selling as if somebody flipped a switch at 7am this Tuesday, after testing $3.
Now down even more than the chart below, -$1,300+ from just 4 hours ago/the high.
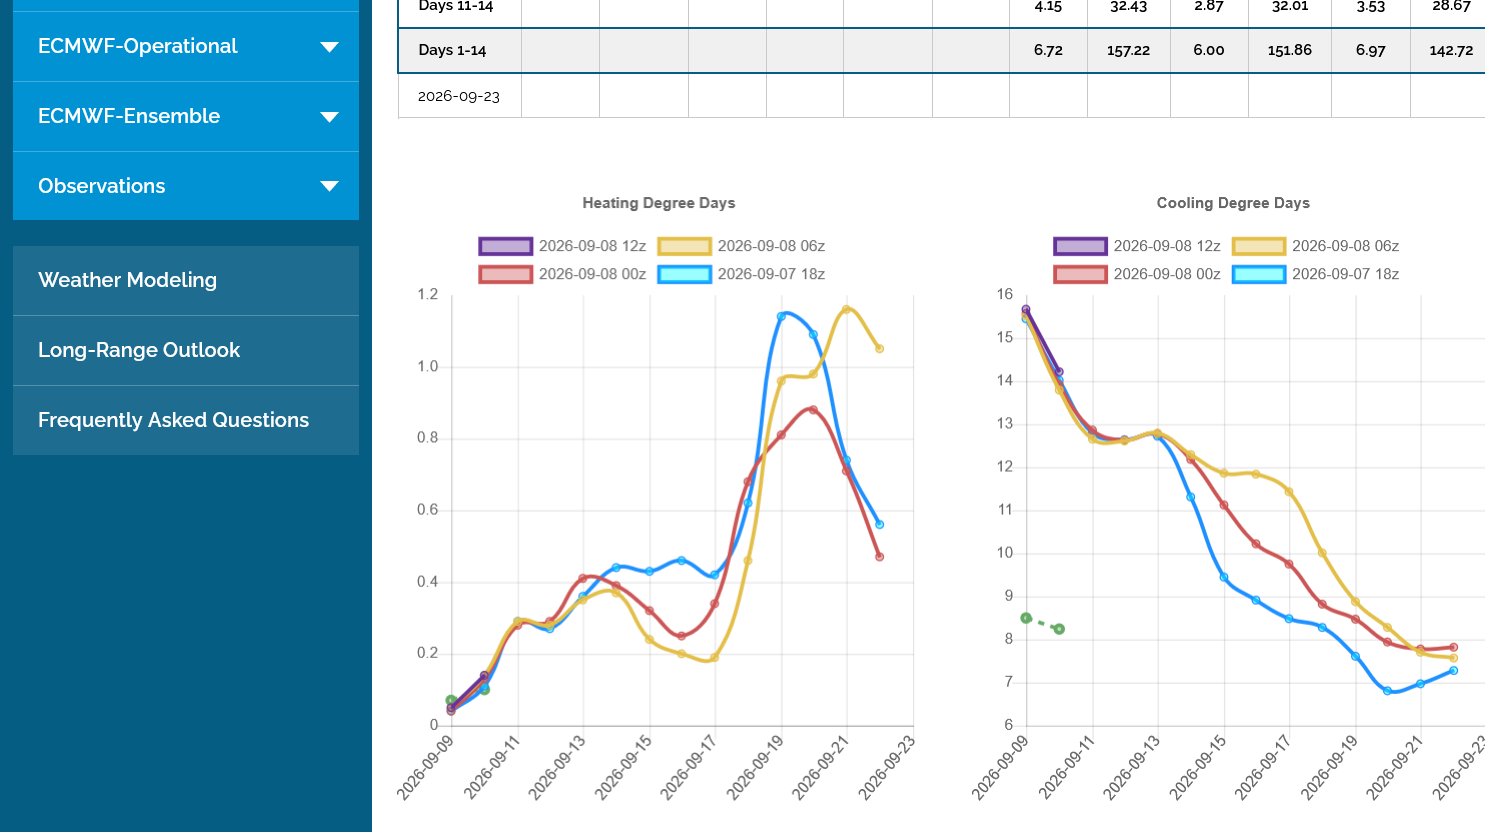
What's interesting is that the last 6z GEFS run in yellow on the right that was coming out when the crash started was +5.4 CDDs vs the previous run and +14 CDDs vs the run before that but those COOLER runs couldn't make NG go lower.
1. The timing mattered here. There was a different breed of (MUCH BIGGER) trader early this morning vs the smaller holiday speculator.
2. The TREND in temperatures is clearly steeply down AND BEARISH. All 3 lines are parallel because they are following the same pattern change with any differences just being from individual days IN THE SAME BEARISH PATTERN.
3. Trading natural gas in recent years has been challenging because it will sometimes behave the opposite of expected, then reverse to the expected. One would have thought that NG would be LOWER on Monday from the pattern change to much cooler over the weekend and not wait until Tuesday(after managing enough strength overnight to bounce just above $3).
The last 0z European Ensemble model purple/right) added +3 CDDs and it supported slightly higher prices overnight but the big traders came in selling during the day session.
Those +3 CDDs are just from warmer individual days in the exact same, MUCH COOLER pattern change that started over the weekend. Compared to previous near record heat, temperatures cooling down close to average is BEARISH weather on the relative basis that natural gas traders use to judge the significance of the latest weather forecasts.
For instance, is the number 50 big or not?
Yes if we are comparing it to 20 and that's bullish. No if we are comparing it to 100 and that same number is bearish!
Note below the green line which is the gradually falling, seasonal CDDs. The forecast line starts very elevated compared to that average but the steep down slope line in predicted temperatures takes us down to a seasonably warm level. Bearish convergence with the average, CDD line.
https://tradingeconomics.com/commodity/natural-gas
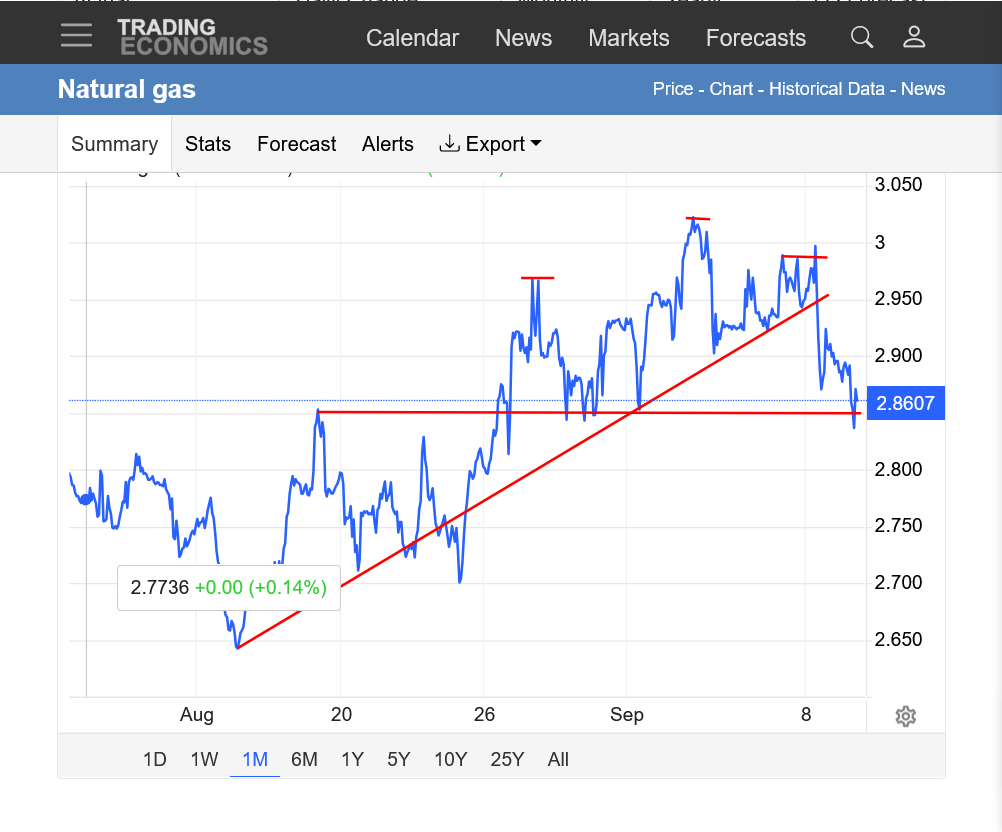
1. 1 month. Steep uptrend from long lasting, widespread heat has been decidedly broken with temperatures cooling. Potential head and shoulders top with us at the neck line??? Orrr, this could be a bull flag that finds support at a less steep uptrend from the previous lows.
Do you think maybe the funds are thinking a warm winter from El Nino?? with enough current supply???
cutworm,
That thought is exactly what I love about comments here. Something I was not thinking of.............yet. For sure that sort of mentality (speculating on the upcoming weather season) can start impacting speculative positions many months before the actual weather.
You and I have seen it happen many times in the grains with widespread drought, a La Nina and Cornbelt drought predicted in the growing season........months before the first kernel of corn is in the ground.
This is part of the UP seasonal from late September thru most of October in natural gas. This follows the law of self fulfilling prophesy.
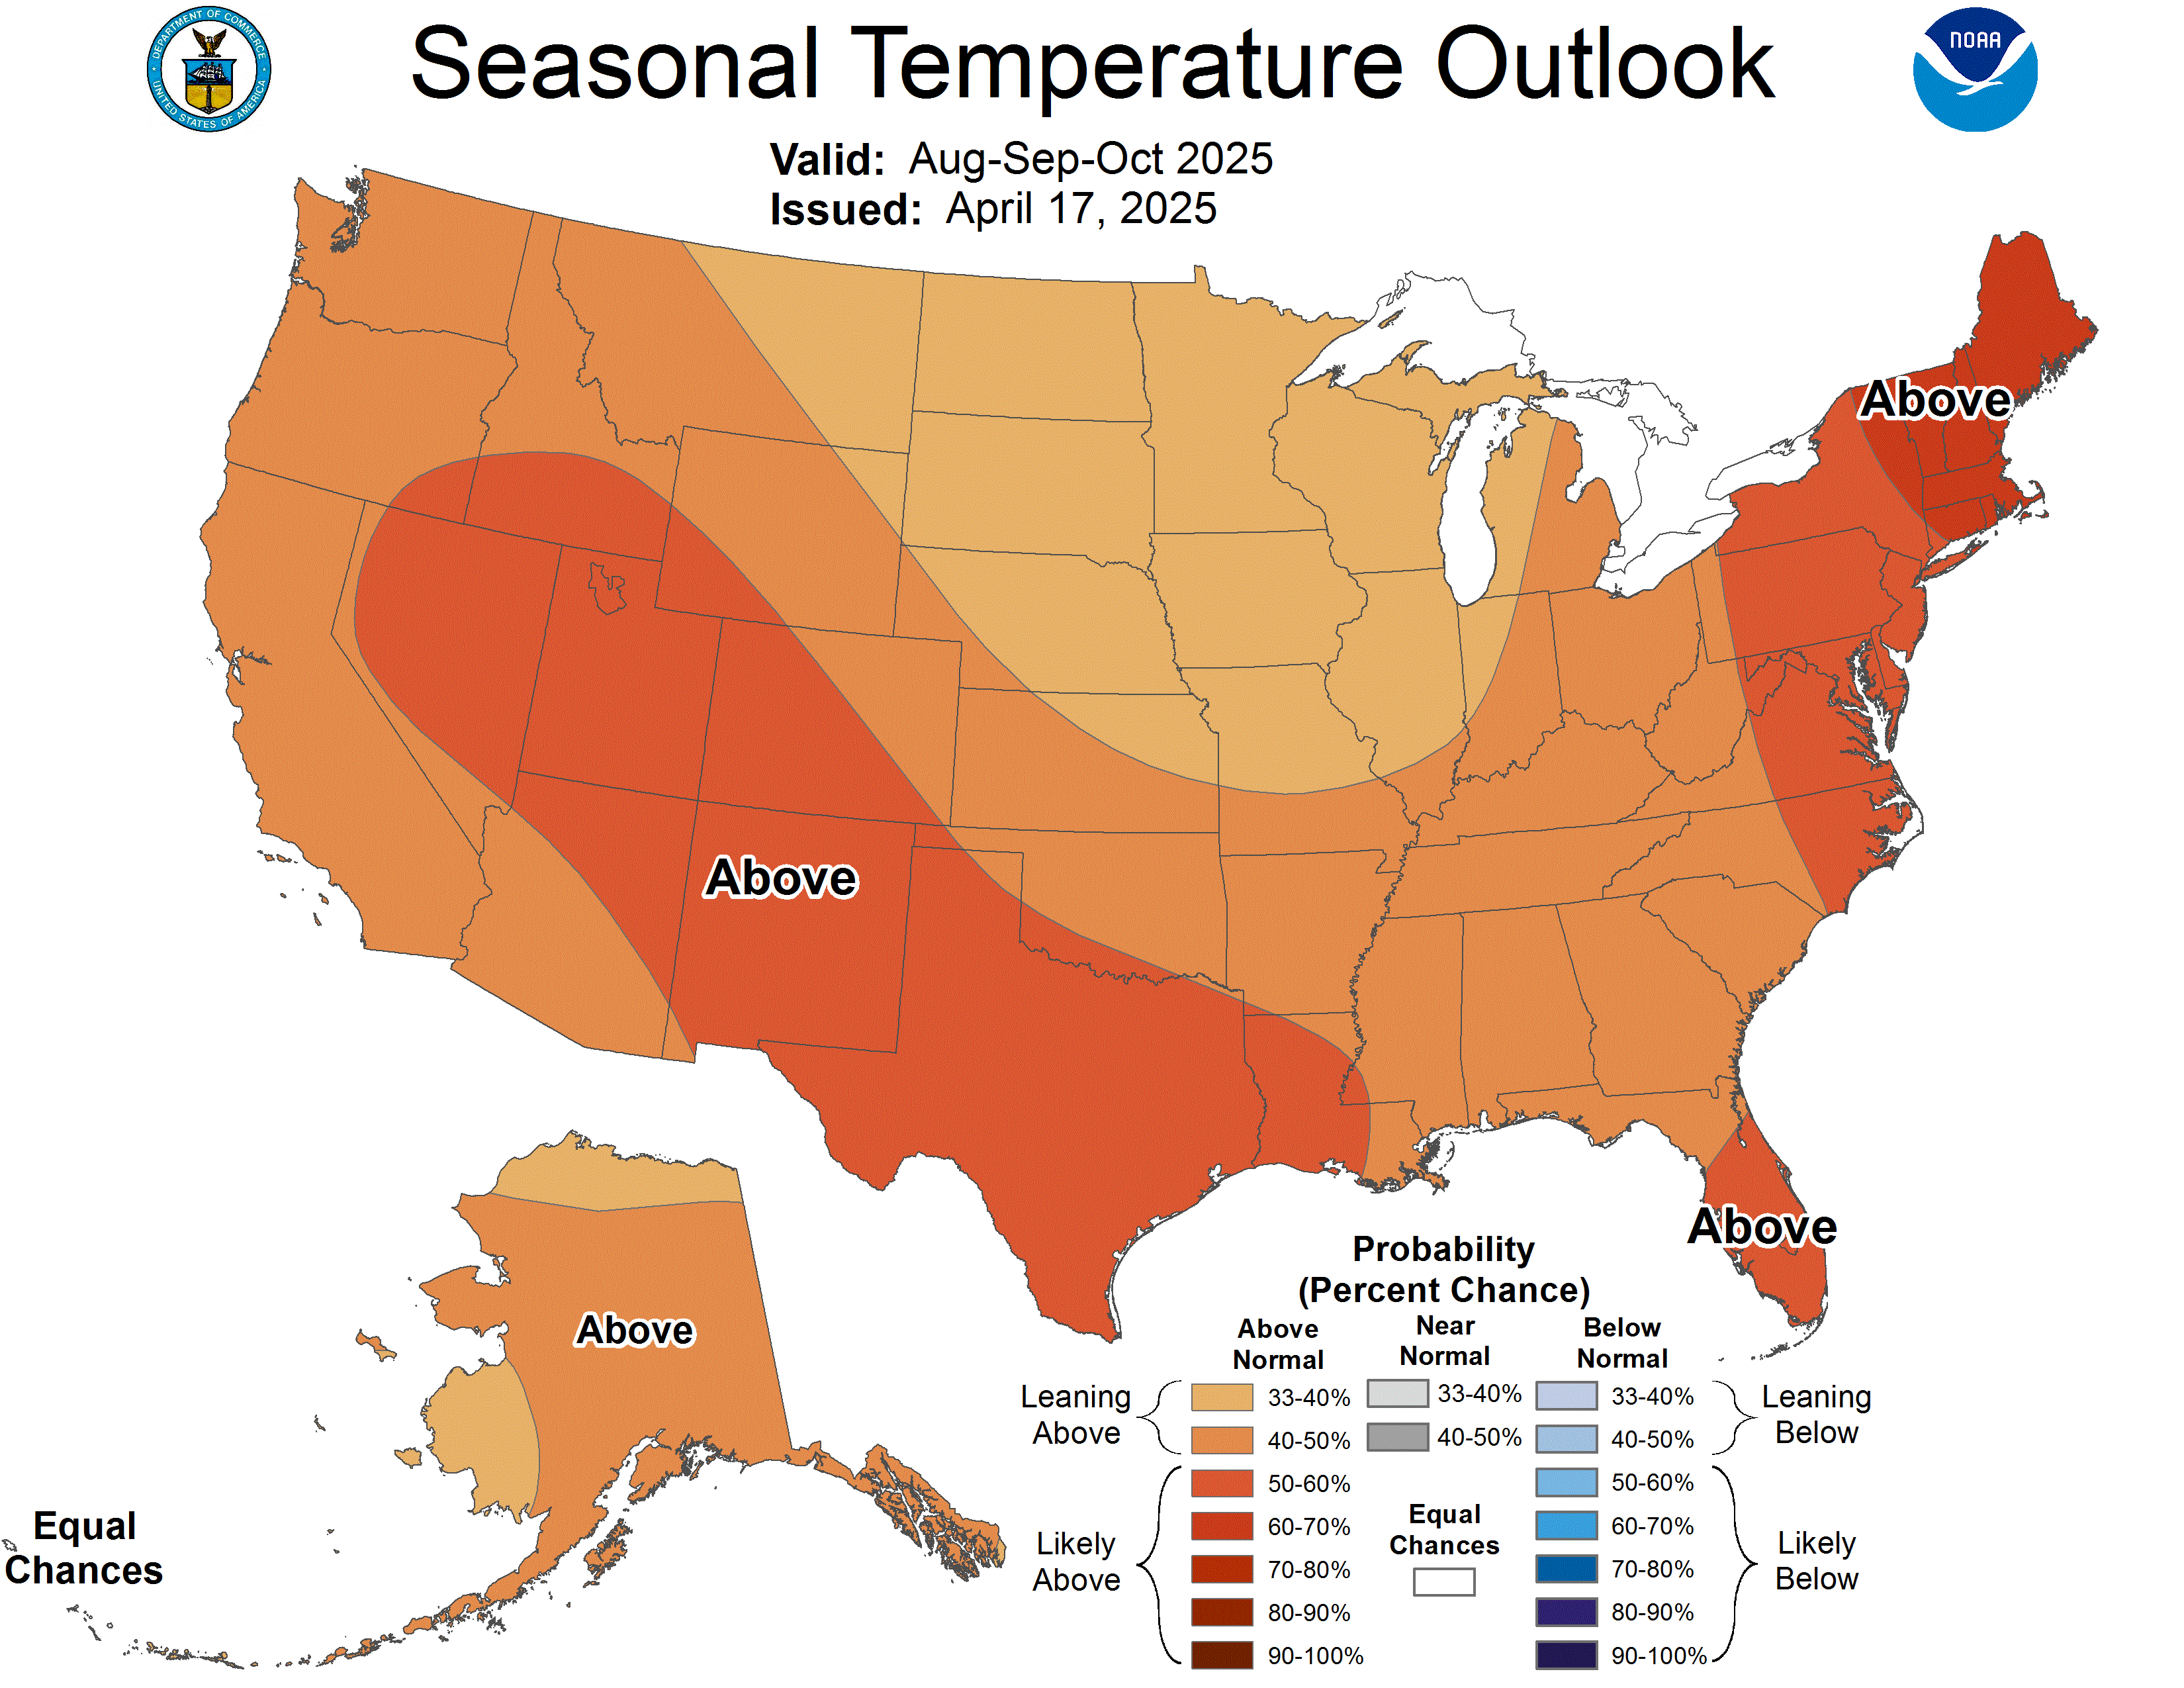
It's a bit early for trading Winter weather but not too early in bullish years when traders want to add that to the list of excuses to be long. No so this year since El Nino Winters have a strong tendency to be mild compared to La Nina Winters.
In early September, we can't say anything definitive about the Winter which is tradable with high probability.......but we can say what you just did. Spec longs will have less incentive to buy ahead of this Super El Nino Winter than they did in most Winters based purely on the long range Winter temperature forecast.
This was the last one. This would massively reduce the number of HDDs and the demand for natural gas for residential heating, which is the #1 demand source at any time of year.
https://www.cpc.ncep.noaa.gov/products/predictions/long_range/seasonal.php?lead=4
++++++++++++
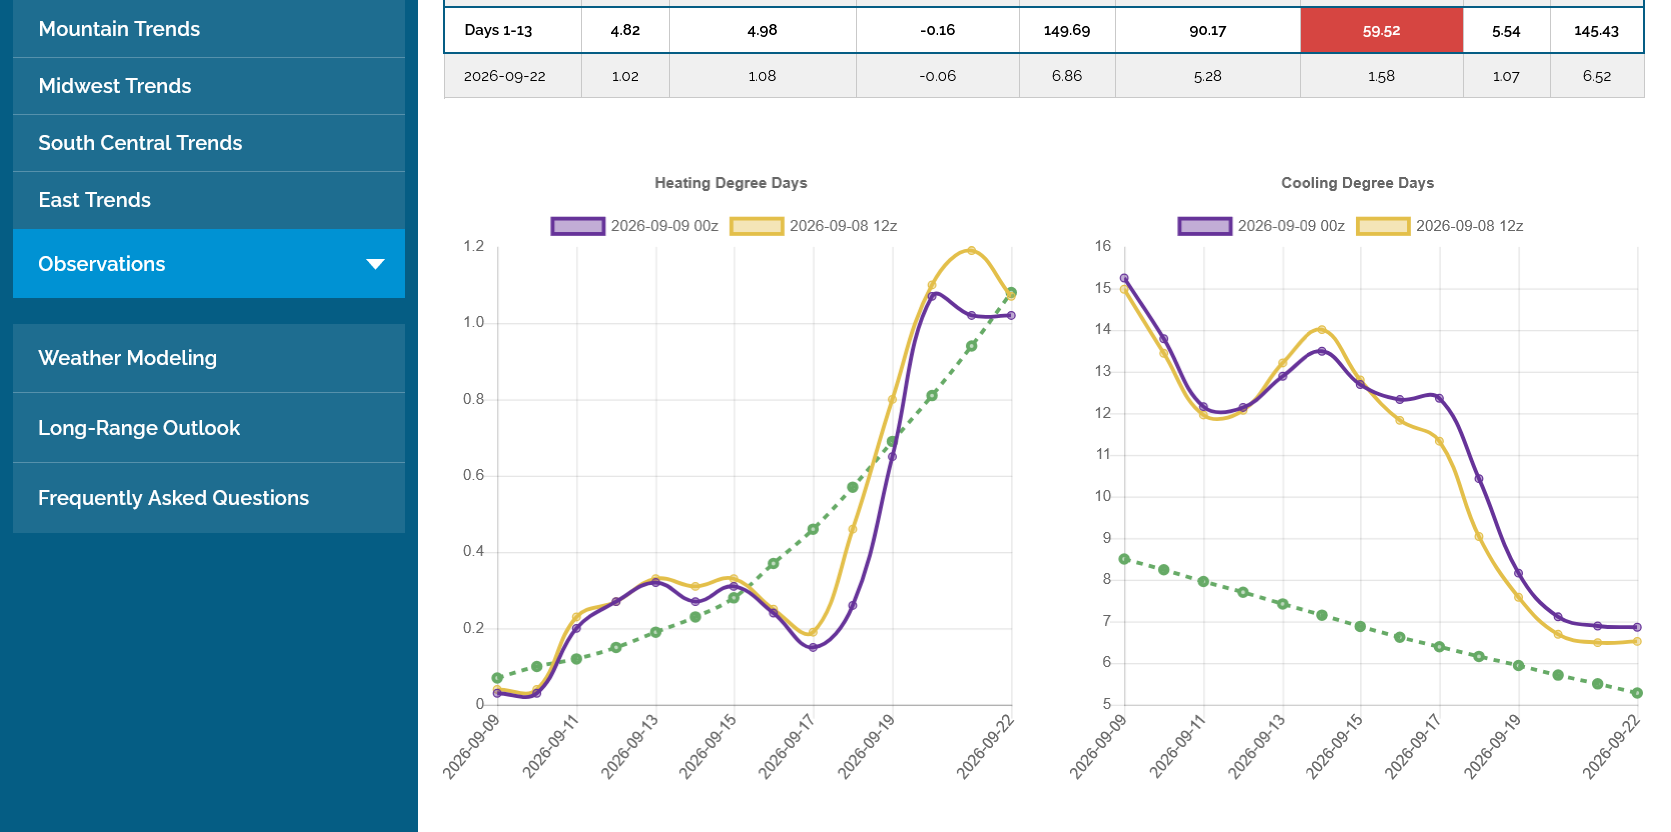
1. The last 12z GEFS was down almost a whopping -10 CDDs in purple on the right, even generating a few HDDs on the left from cold in the north. The CDDs that we do see later this month will all be coming from the South, which is normal.
2. Note the Midwest graph. CDDs on the right essentially drop close to 0/1 at the end of the period(normal/average) and HDDs on the left, actually spike above average from the cold hitting the Upper Midwest in week 2.
So the CDD season is DEAD/OVER! There's just not enough country left that can GET HOT to generate a bullish amount at the end of September.
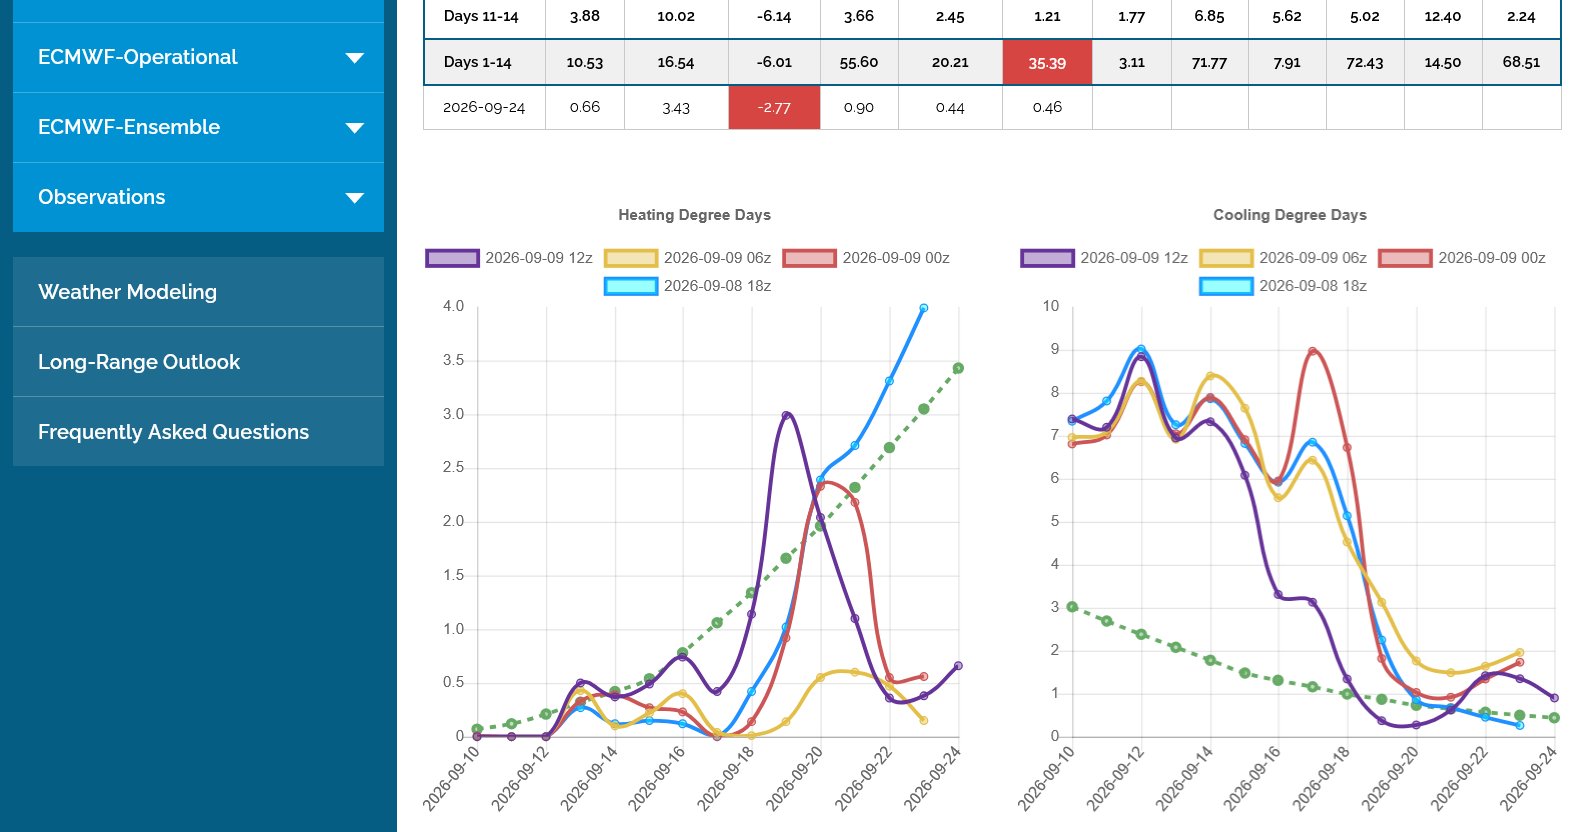
3. It is possible and has happened when we have significant cold in the north and significant heat in the south adding up to a cumulative CDDs + HDDs to actually matter. This is the type of pattern that makes that possible.
One of lowest September injections. Note the blue line on the graph below converging with the 5 year average line as the recent heat has been reducing the storage surplus.........which WAS bullish and cause the big rally until this week, when the pattern changed to much cooler.
for week ending September 4, 2026 | Released: September 10, 2026 at 10:30 a.m. | Next Release: September 17, 2026
| Working gas in underground storage, Lower 48 states Summary text CSV JSN | |||||||||||||||||||||||||
|---|---|---|---|---|---|---|---|---|---|---|---|---|---|---|---|---|---|---|---|---|---|---|---|---|---|
| Historical Comparisons | |||||||||||||||||||||||||
| Stocks billion cubic feet (Bcf) | Year ago (09/04/25) | 5-year average (2021-25) | |||||||||||||||||||||||
| Region | 09/04/26 | 08/28/26 | net change | implied flow | Bcf | % change | Bcf | % change | |||||||||||||||||
| East | 773 | 753 | 20 | 20 | 754 | 2.5 | 730 | 5.9 | |||||||||||||||||
| Midwest | 908 | 890 | 18 | 18 | 886 | 2.5 | 870 | 4.4 | |||||||||||||||||
| Mountain | 239 | 236 | 3 | 3 | 257 | -7.0 | 220 | 8.6 | |||||||||||||||||
| Pacific | 290 | 285 | 5 | 5 | 293 | -1.0 | 263 | 10.3 | |||||||||||||||||
| South Central | 1,044 | 1,051 | -7 | -7 | 1,143 | -8.7 | 1,024 | 2.0 | |||||||||||||||||
| Salt | 227 | 238 | -11 | -11 | 281 | -19.2 | 236 | -3.8 | |||||||||||||||||
| Nonsalt | 817 | 813 | 4 | 4 | 862 | -5.2 | 788 | 3.7 | |||||||||||||||||
| Total | 3,254 | 3,214 | 40 | 40 | 3,333 | -2.4 | 3,106 | 4.8 | |||||||||||||||||
| Totals may not equal sum of components because of independent rounding. | |||||||||||||||||||||||||
Working gas in storage was 3,254 Bcf as of Friday, September 4, 2026, according to EIA estimates. This represents a net increase of 40 Bcf from the previous week. Stocks were 79 Bcf less than last year at this time and 148 Bcf above the five-year average of 3,106 Bcf. At 3,254 Bcf, total working gas is within the five-year historical range.
For information on sampling error in this report, see Estimated Measures of Sampling Variability table below.
Note: The shaded area indicates the range between the historical minimum and maximum values for the weekly series from 2021 through 2025. The dashed vertical lines indicate current and year-ago weekly periods.
++++++++++++++
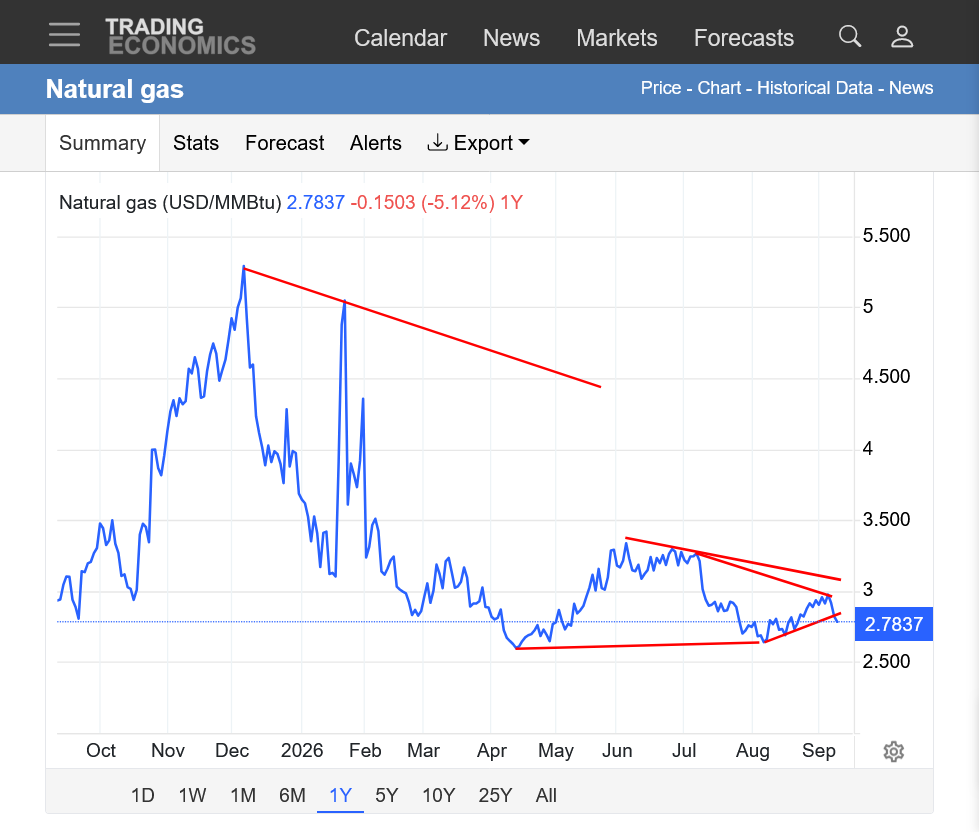
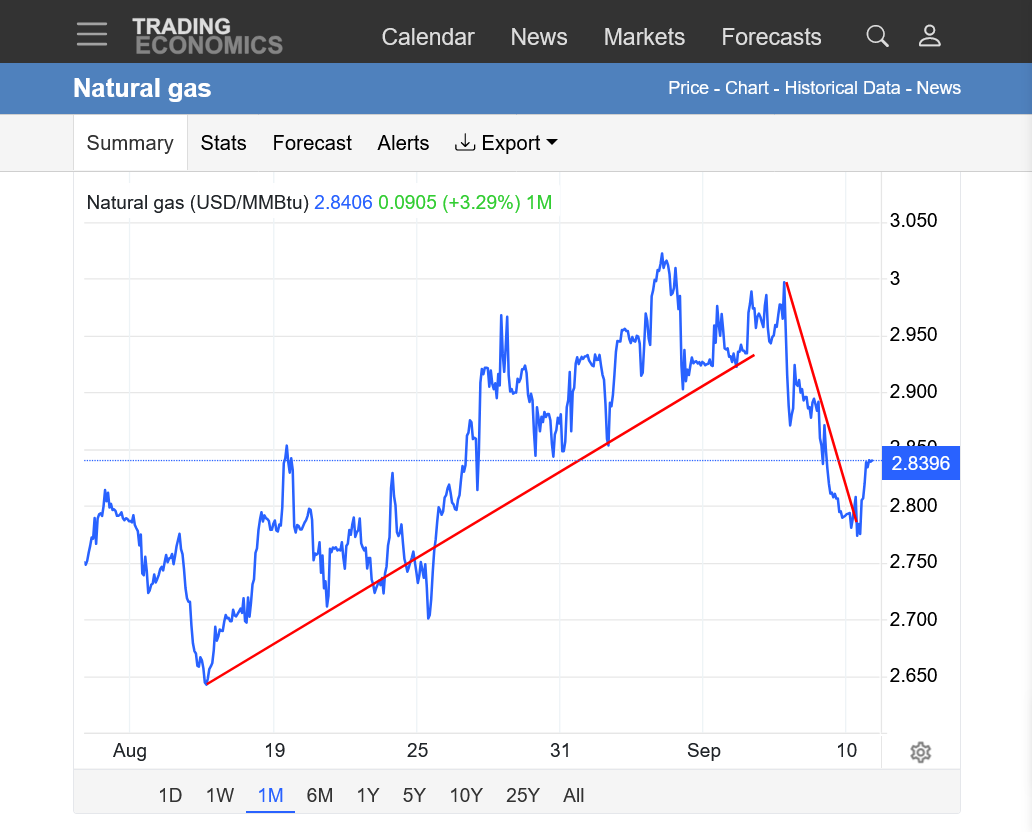
https://tradingeconomics.com/commodity/natural-gas
1. 1 year: Breaking the high heat(residential cooling demand that burns natural gas to generate electricity for AC use), steep up slope line this week.
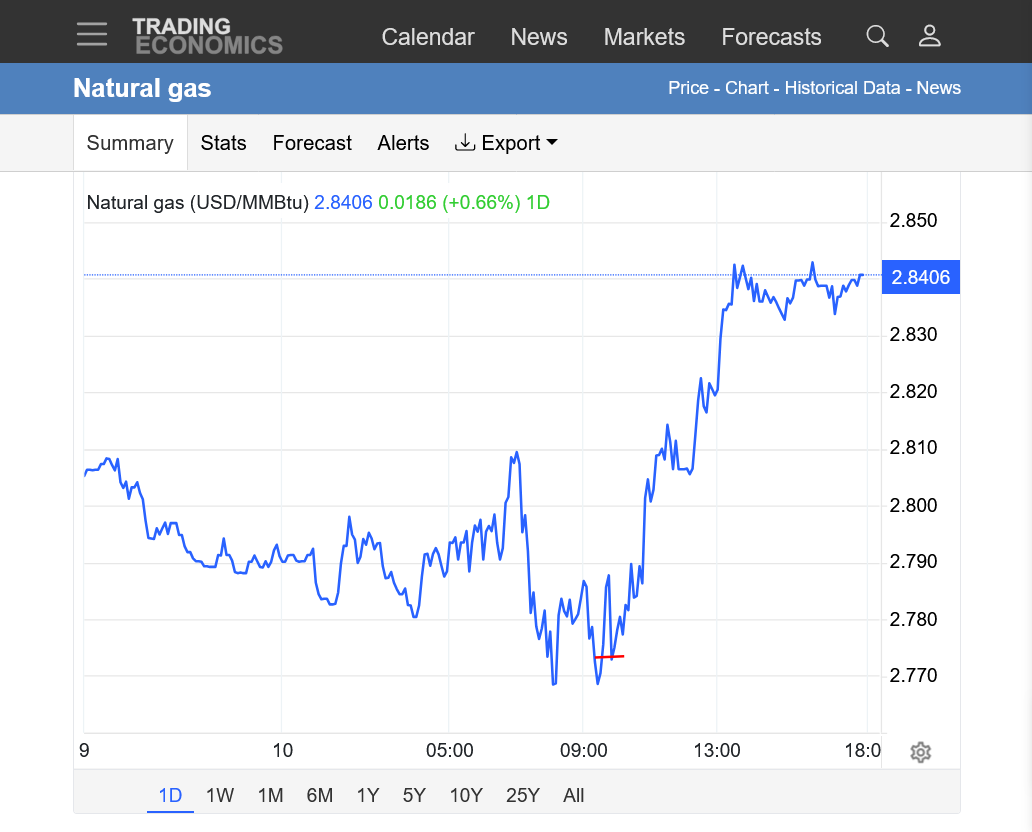
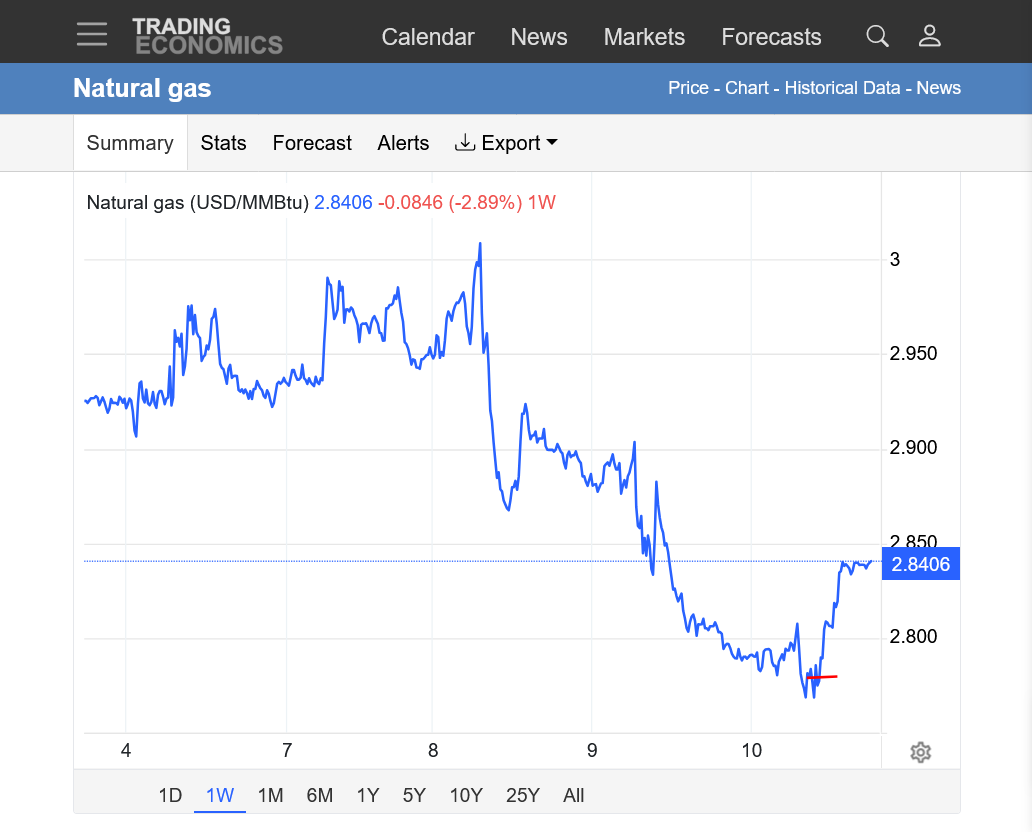
6pm: The release of the bullish EIA data put in the low for the session and week:
1. 1 day
2. 1 week
3. 1 month
We added a lot of week 1 heat over the weekend which probably helped natural gas to some modest gains overnight. However, just after 7:30am, the funds decided to do some selling and much of those gains have dried up.
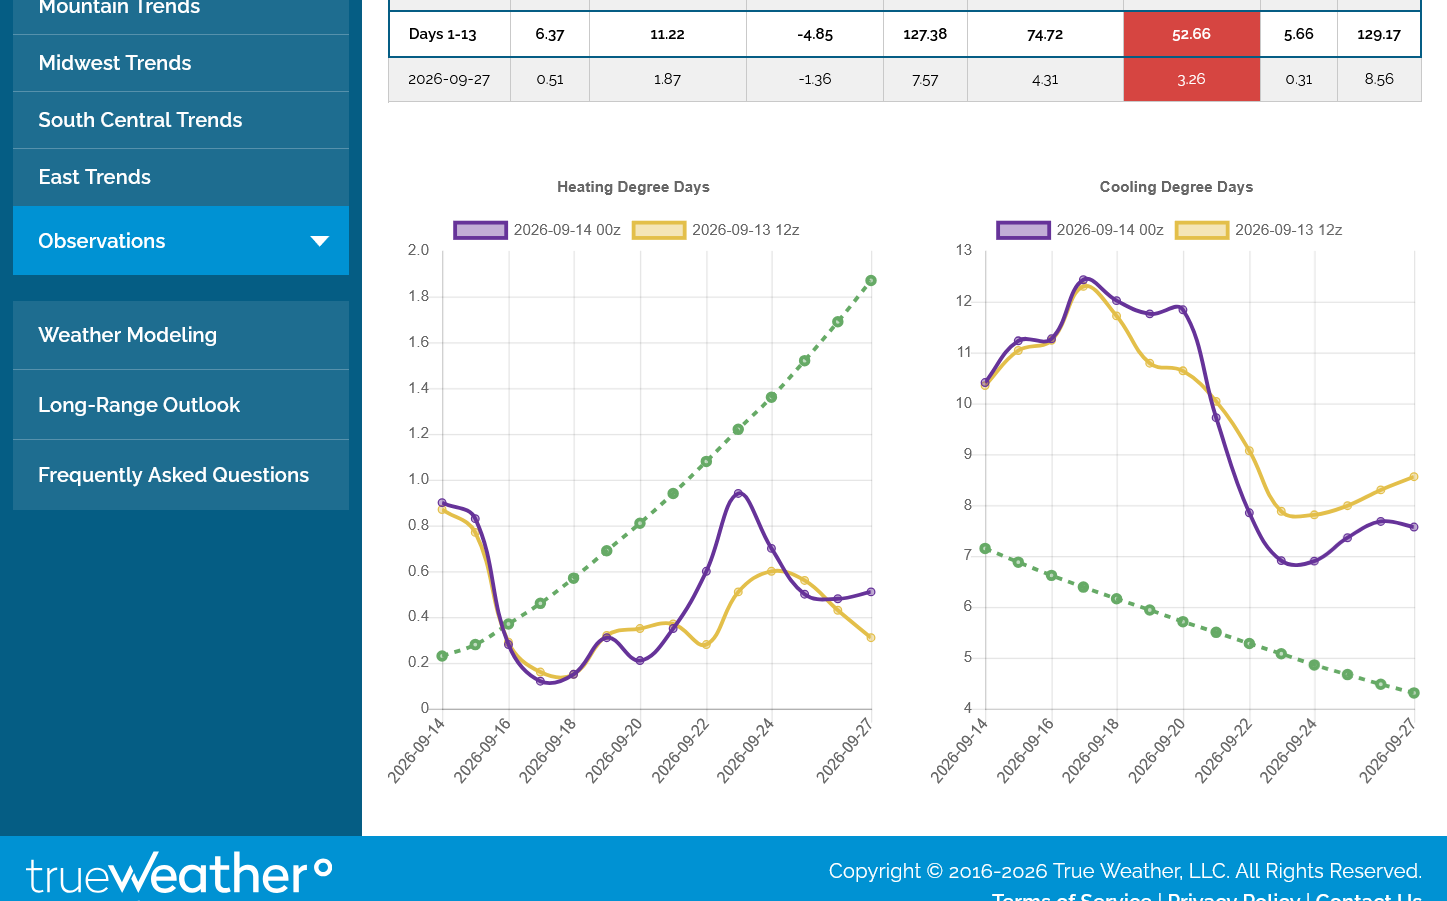
The last 0z European model was -2 CDDs(less hot) in week 2 (purple line on the right/below) at a time of year when demand for cooling is dropping like a rock. And the market knows that by the 2nd week of October, seasonal HDDs will surpass CDDs.
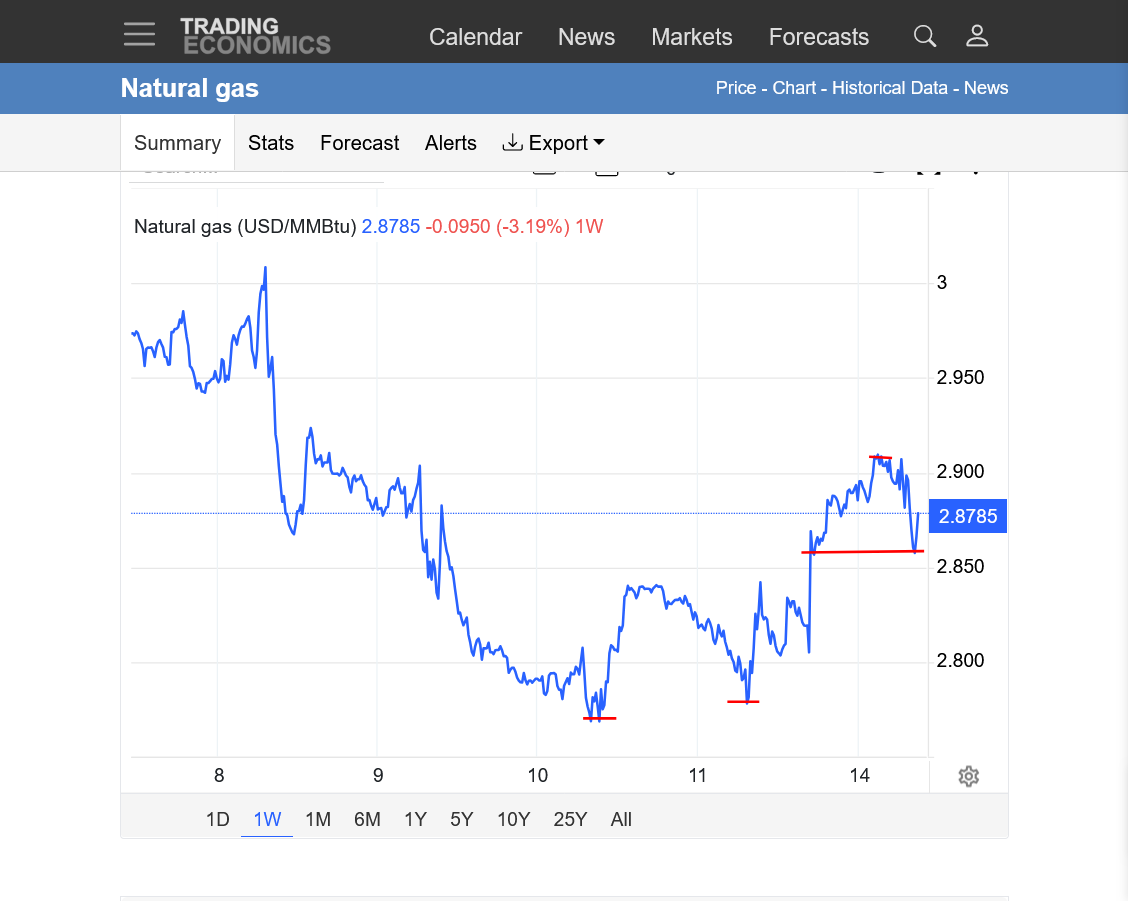
https://tradingeconomics.com/commodity/natural-gas
1. 1 week below. Low on the bottom on the release of the 9:30 EIA data on Thursday. Retest slightly higher low on Friday. Open Sunday night, modest rally from added weekend heat..... until just after 2am when the cooler 0z EE came out. Sharp drop just after 7:30am that tested the open and held.....so far.
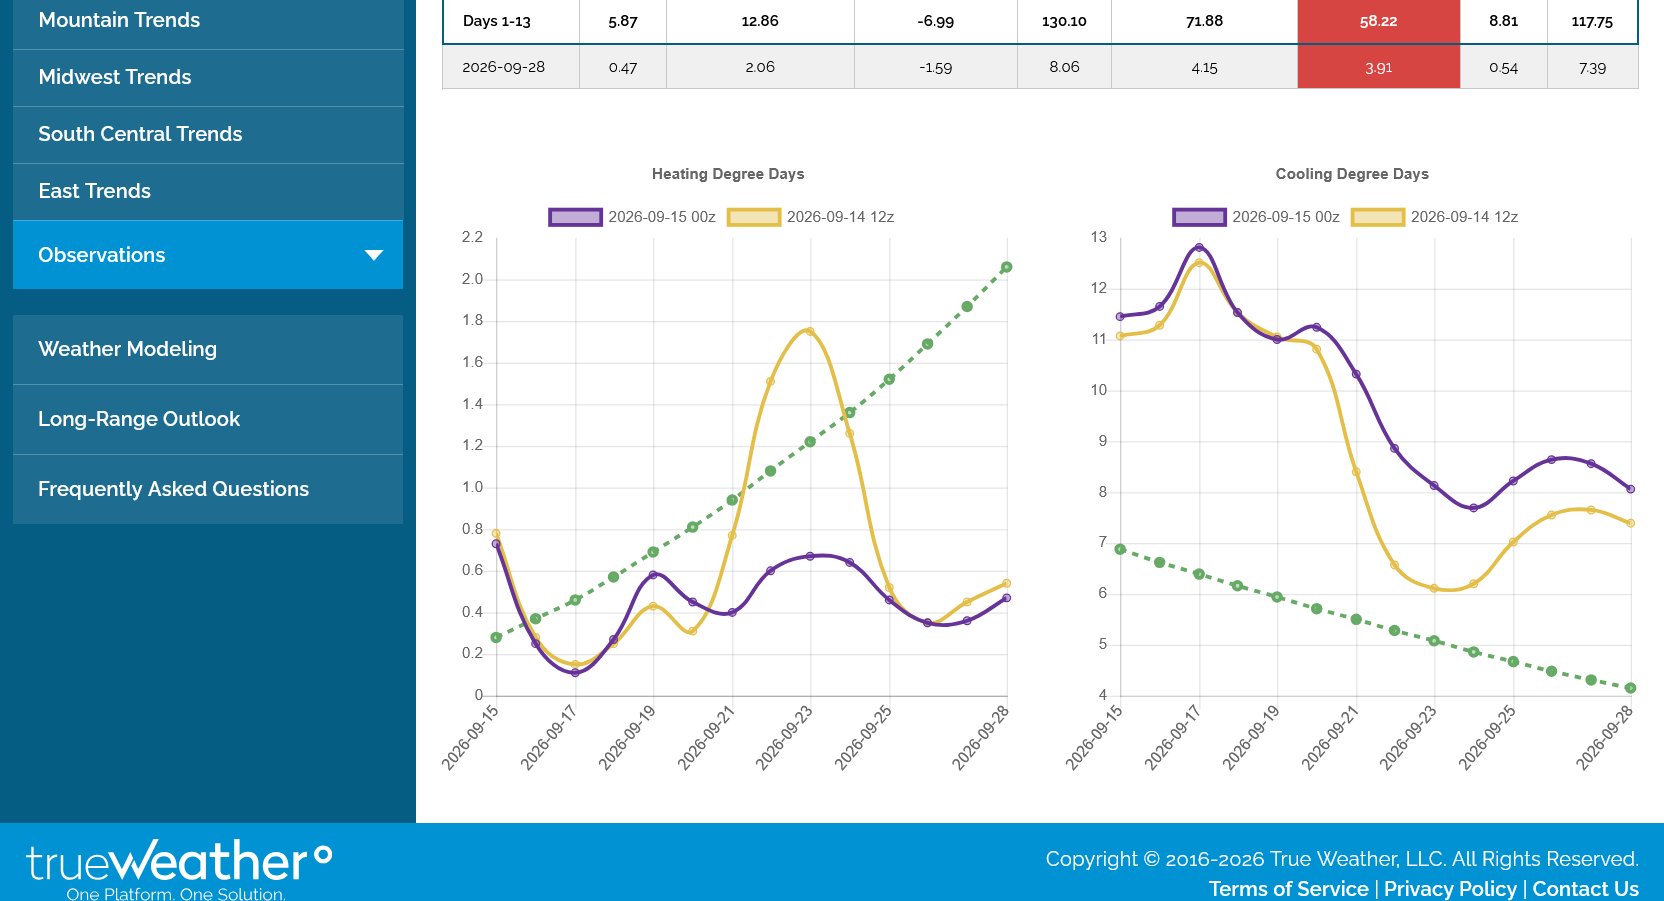
The last, overnight 0z European Ensemble model was a whopping +12 CDDs (purple/right) vs the previous run 12 hours earlier. This likely helped provide support for natural gas prices but we are talking late September weather. Speculators trading CDDs at this time of year are no longer dominating the market price. HDDs will be passing up CDDs during the 2nd week of October.
This change was mostly from individual week 2 days but potentially from the current pattern NOT changing to cooler as expected. Individual day changes impact on prices don't last, especially in September. Weather pattern changes can last for days and even many weeks with impact on ng prices but normally that would be during the core cooling and heating seasons.
However, NG has a STRONG UP SEASONAL from late Sept thru much of October that inspires a great deal of speculative buying(ahead of Winter) from the Law of a self full-filling prophesy.
Heat last week means another small injection compared to this time of year that usually features increasingly huge injections.
https://www.cpc.ncep.noaa.gov/products/tanal/temp_analyses.php

++++++++++
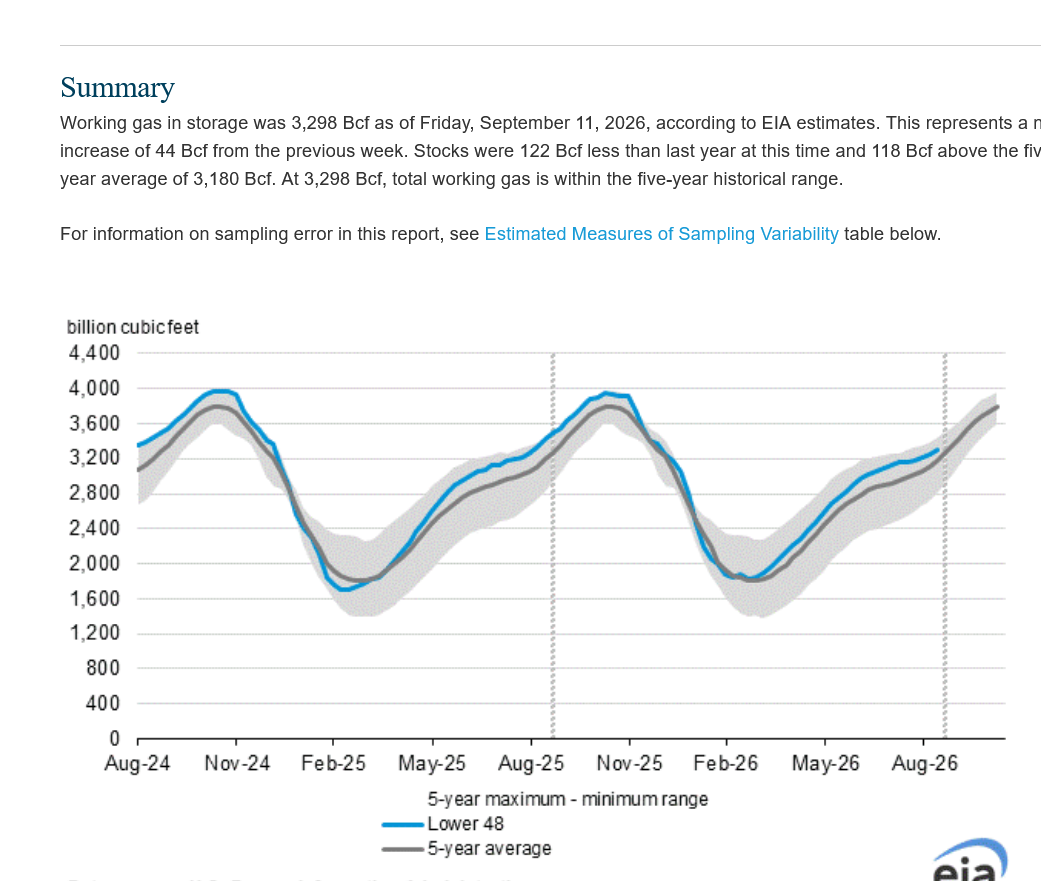
Note on the graph below that the blue line(2026 storage level) is converging with the 5 year average line in gray.
Both are increasing, as they always do during the injection season but the recent increases in 2026 are not keeping up with previous years.
This is because the intense heat is gobbling up excessive natural gas compared to average (burned to generate electricity that's used for residential cooling/AC).
++++++++++++++++++
New natural gas thread:
Natural gas 9-19-26
Started by metmike - Sept. 19, 2026, 6:05 p.