
Previous NG thread:
NG 3-18-26
56 responses |
Started by metmike - March 18, 2026, 7:05 p.m.
https://www.marketforum.com/forum/topic/118808/
+++++++++++++++++++
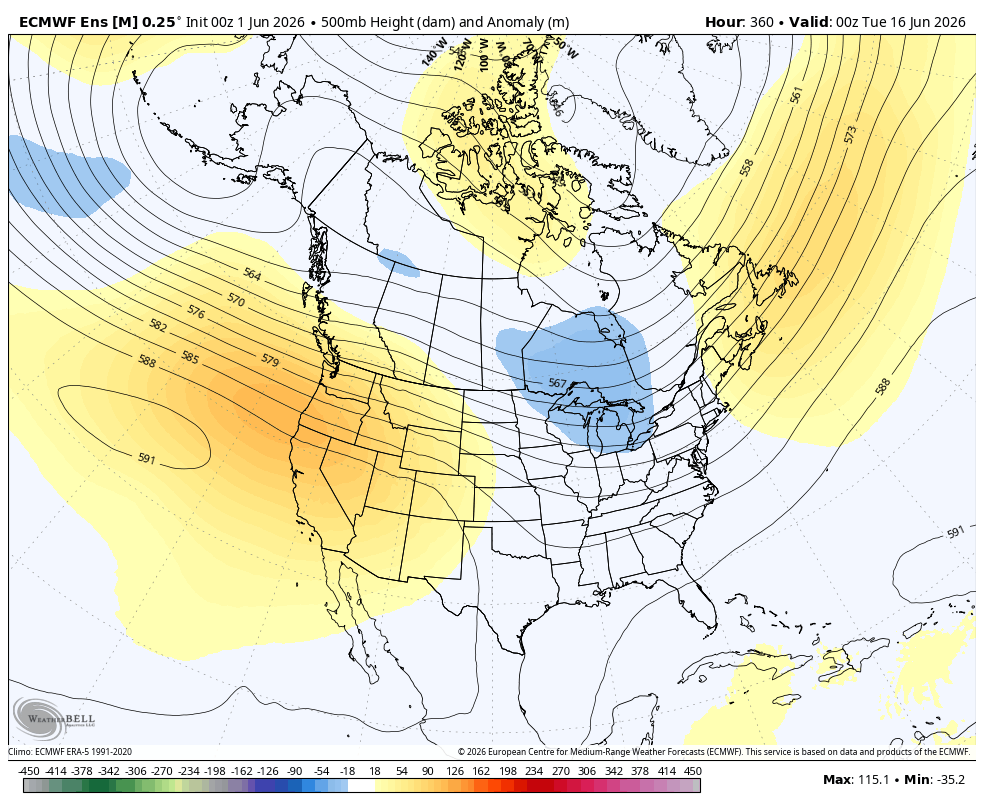
The late week 2 part of the European Ensemble model came out MUCH colder with a trough dropping in the Great Lakes which forces the heat ridge much farther west!
500mb map for June 15th below.
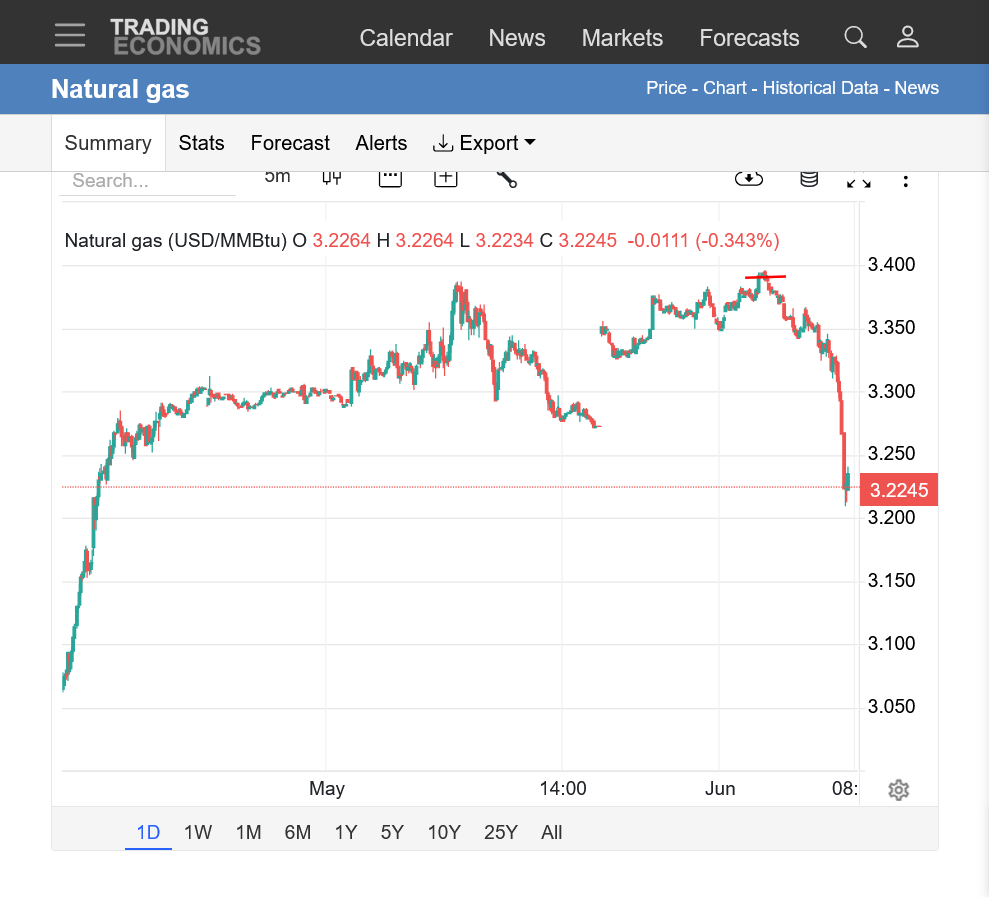
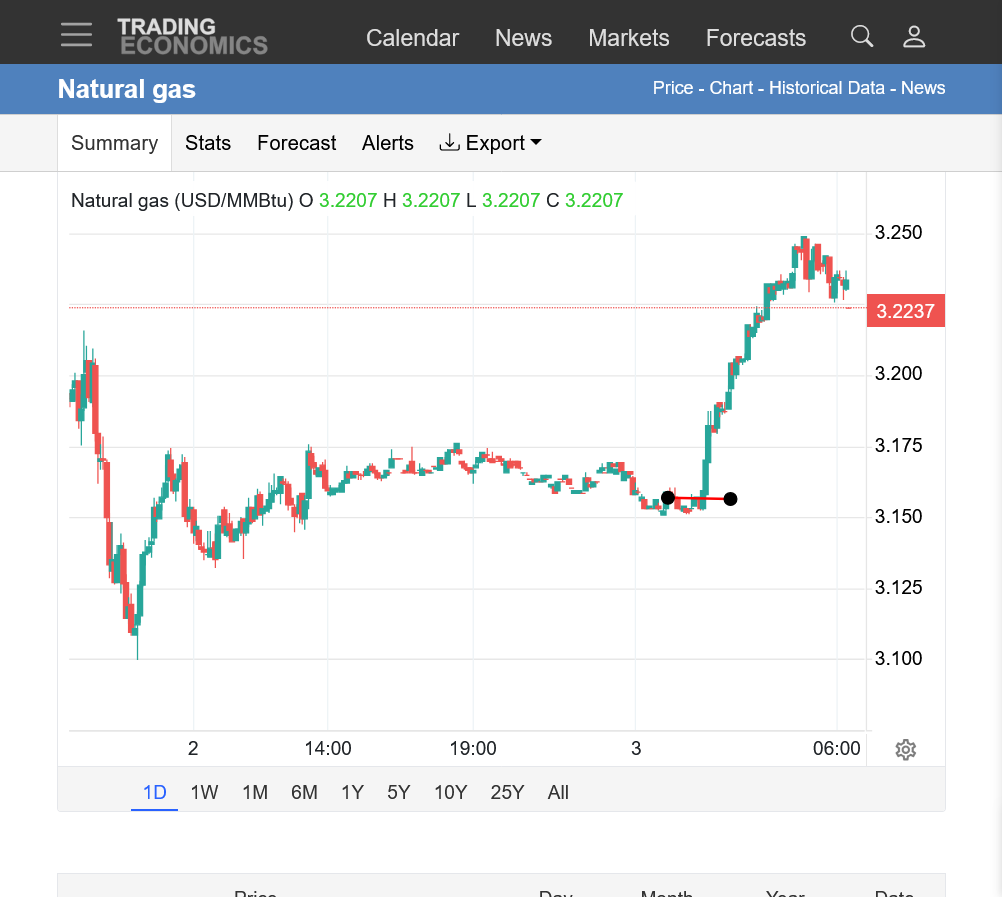
Note the line at the top/right which marked the time frame(around 2:30 am) with the end of the 0z European Ensemble model coming out and the selling commencing which accelerated when the big funds came in around 6am!
https://tradingeconomics.com/commodity/natural-gas
++++++++++++++++++==
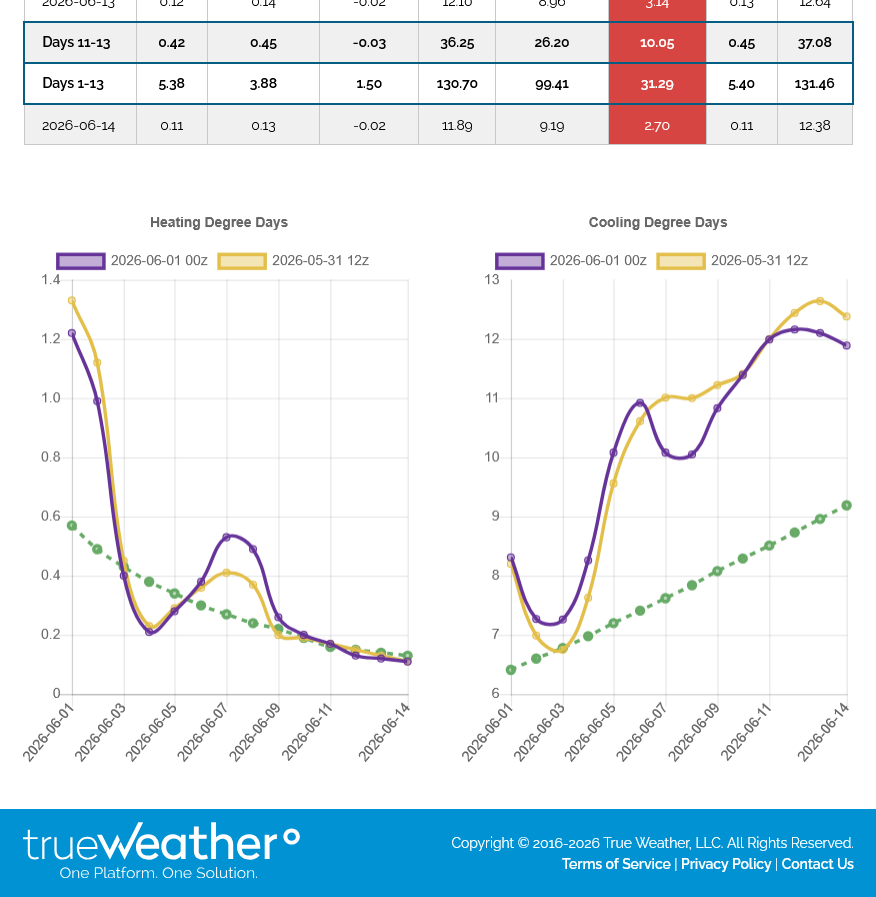
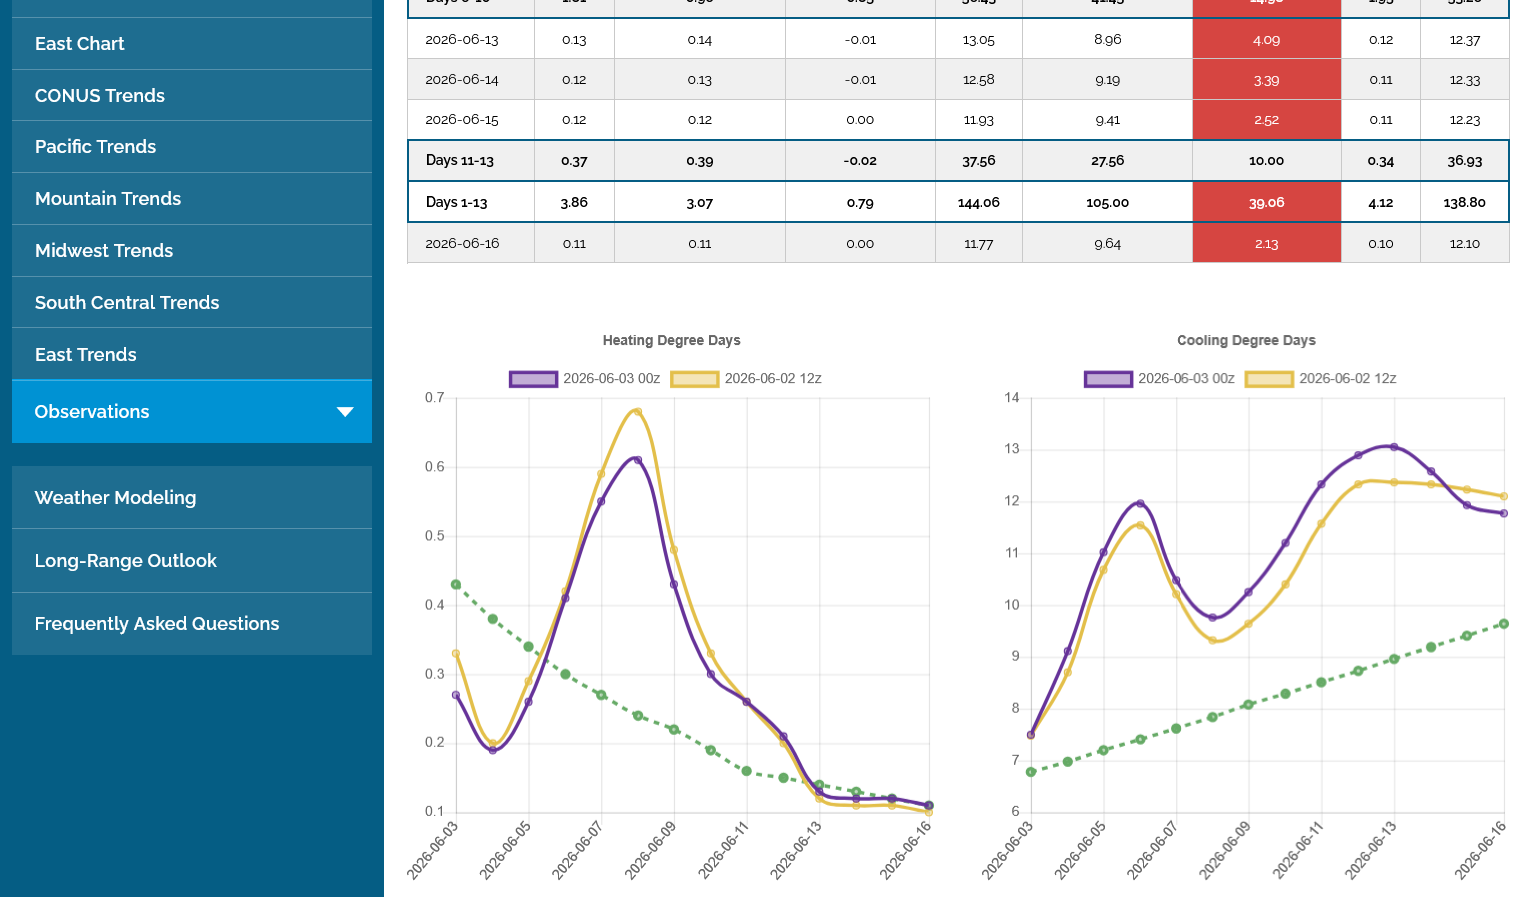
The actual CDDs below(right/purple was the last 0z run-12 hours after the previous run) have not responded yet because the cooler air is poised to drop down from Canada into the Midwest/Northeast at the end of the period. The trajectory of the CDD graph below from future runs will likely cause the plot to curve to the right and close the gap with the climatological average in green which is INCREASING linearly to the left.
+++++++++++++++++
7 day temps for this Thursdays 9:30am EIA NG storage number:
https://www.cpc.ncep.noaa.gov/products/tanal/temp_analyses.php

The 12z European Ensemble model was -4 CDDs vs the previous 0z run!
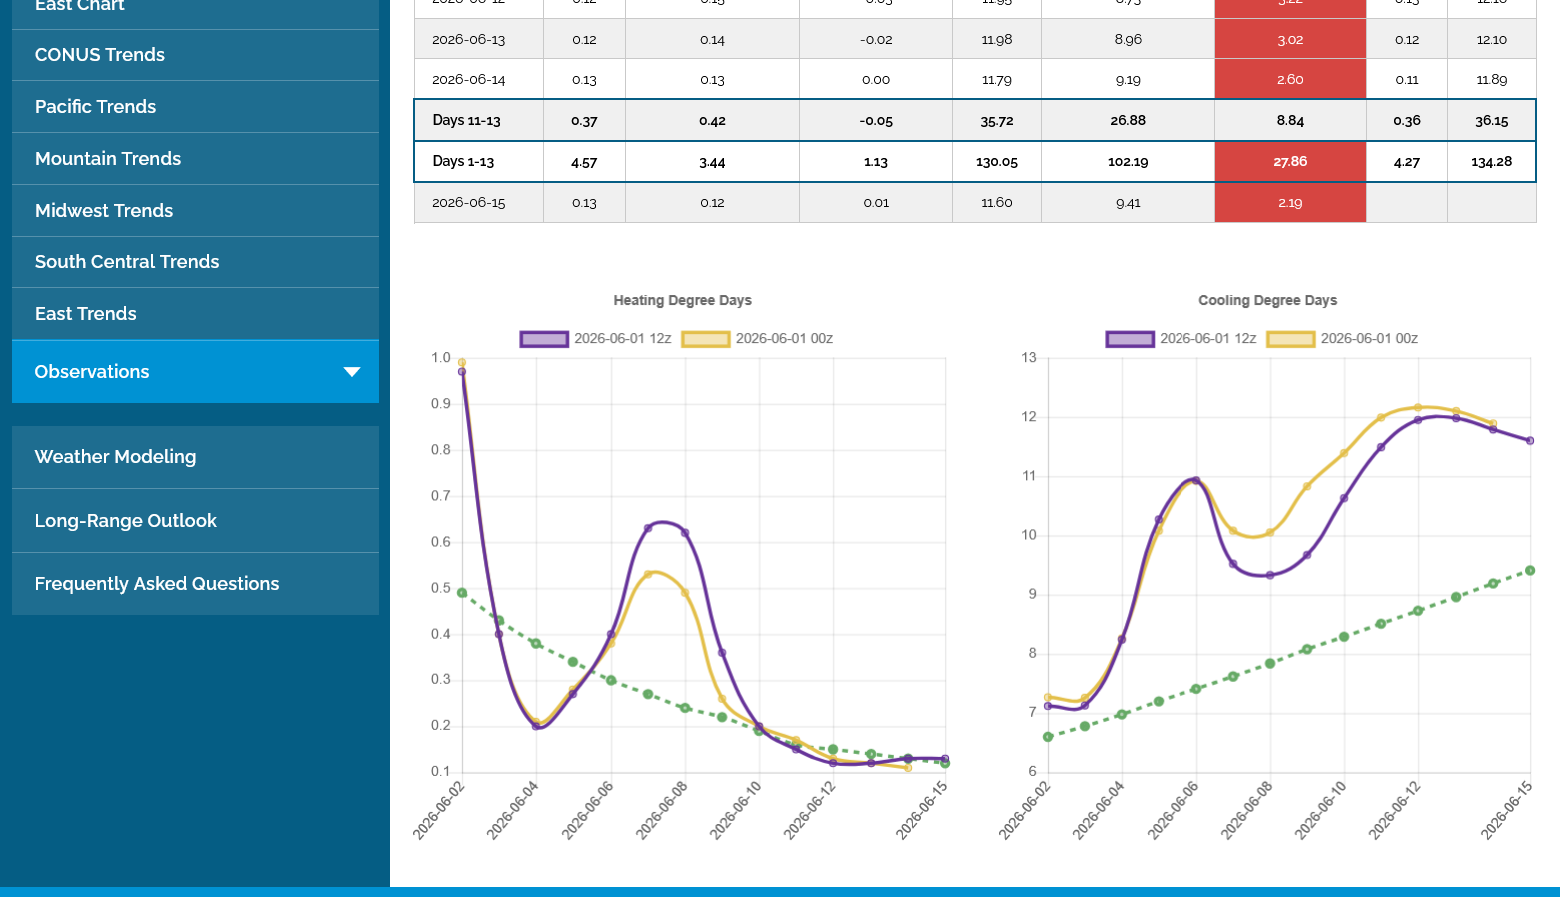
The 12z GEFS in brown also had some end of week 2 cooling but this model remains MUCH warmer than the EE model.
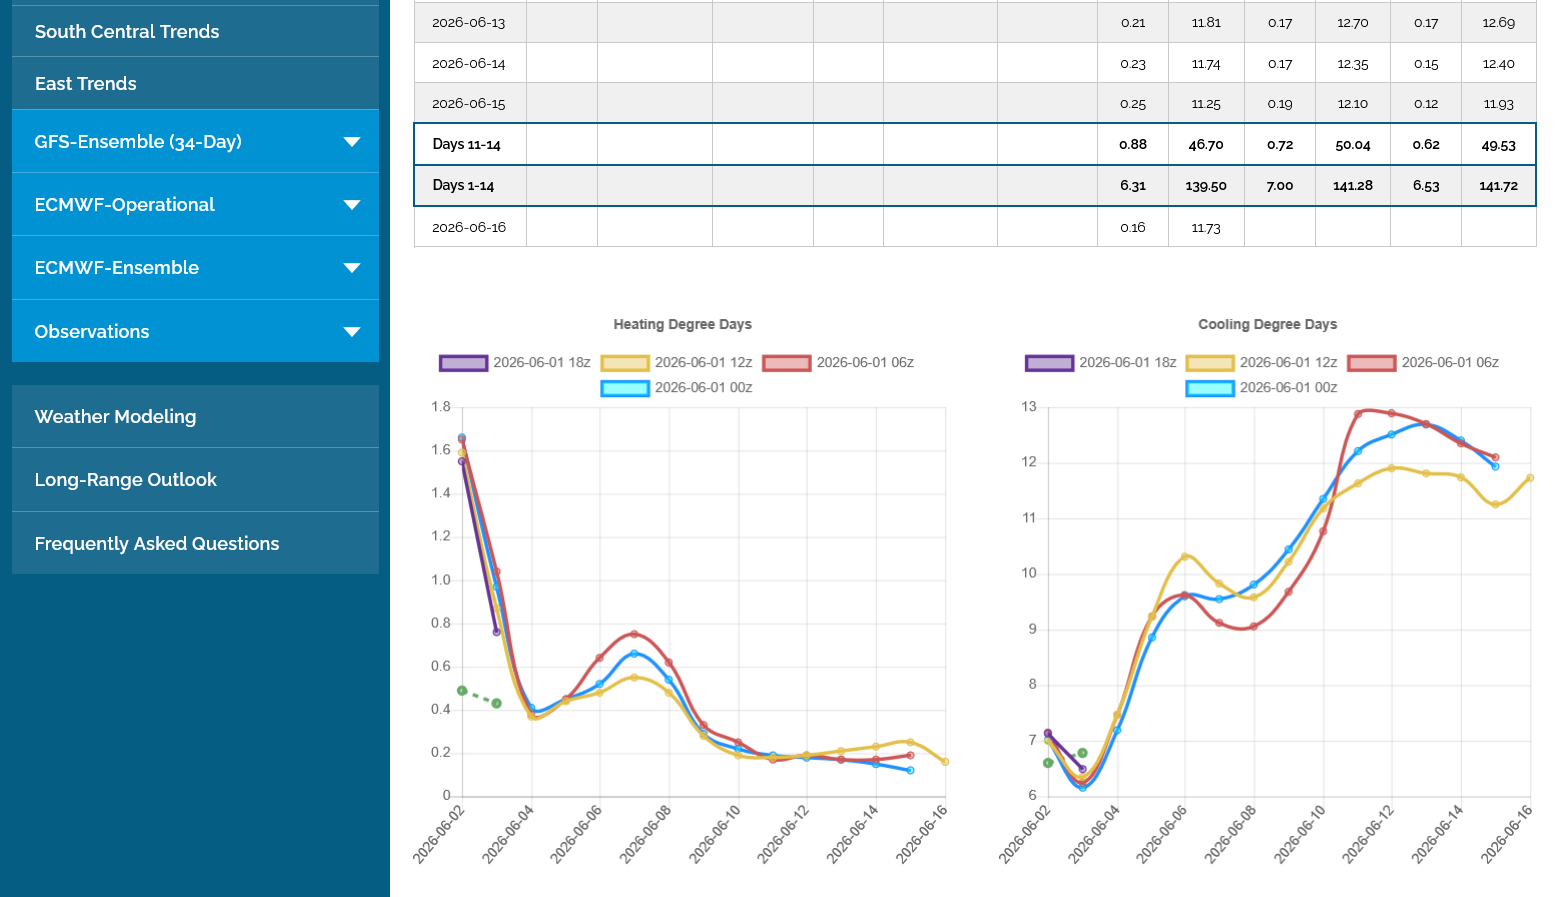
We actually added 4 CDDs overnight on the EE(purple/right) but maps are NOT so bullish.
June 16/17 below from the 0z EE model.

The last 0z European Ensemble model came out +5 CDDs warmer compared to the previous run (right purple line) and this attracted additional buying overnight from the time that came out. +$1,000/contract to the high.
https://tradingeconomics.com/commodity/natural-gas
1. 1 day: Big jump up around 2am +$1,000/contract
2. 1 week: Highs are in?
3.. 1 month; Uptrend still intact. Bull flag???
4. 1 year: Weather spikes from extreme cold followed by downtrend from mild end of HDD season, then seasonal bottom, then uptrend. Tested resistance this week. Was this the early Summer/late Spring top?
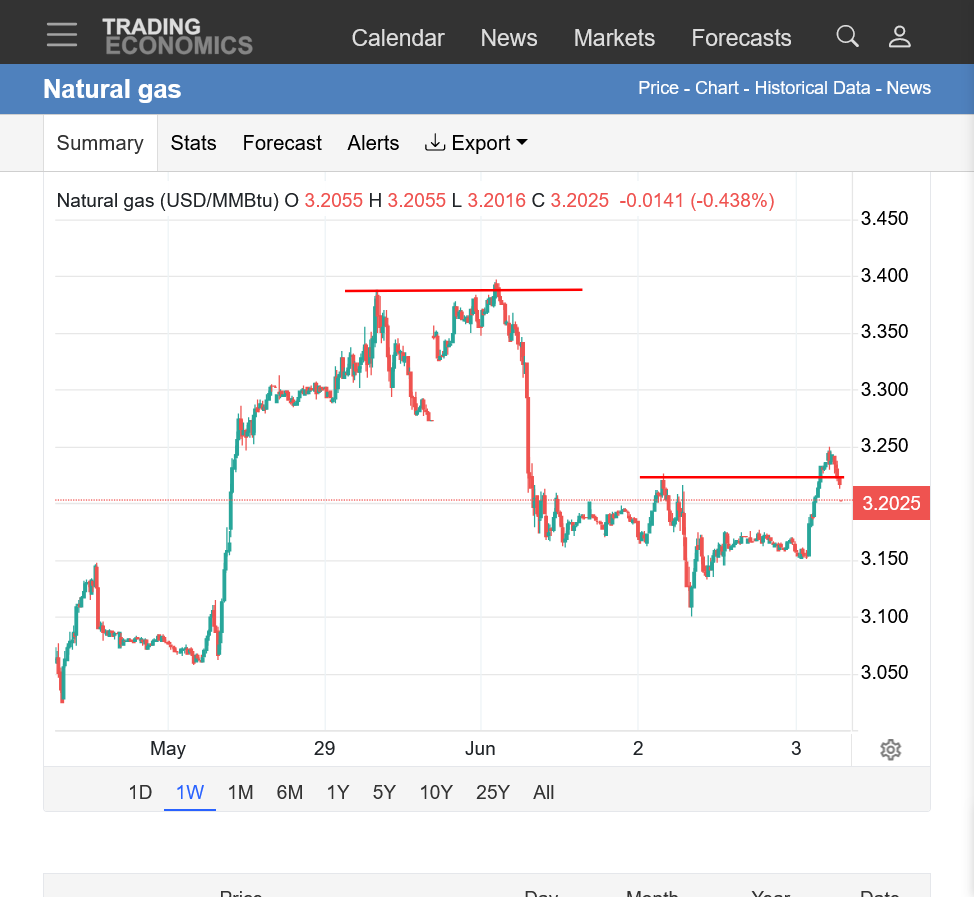
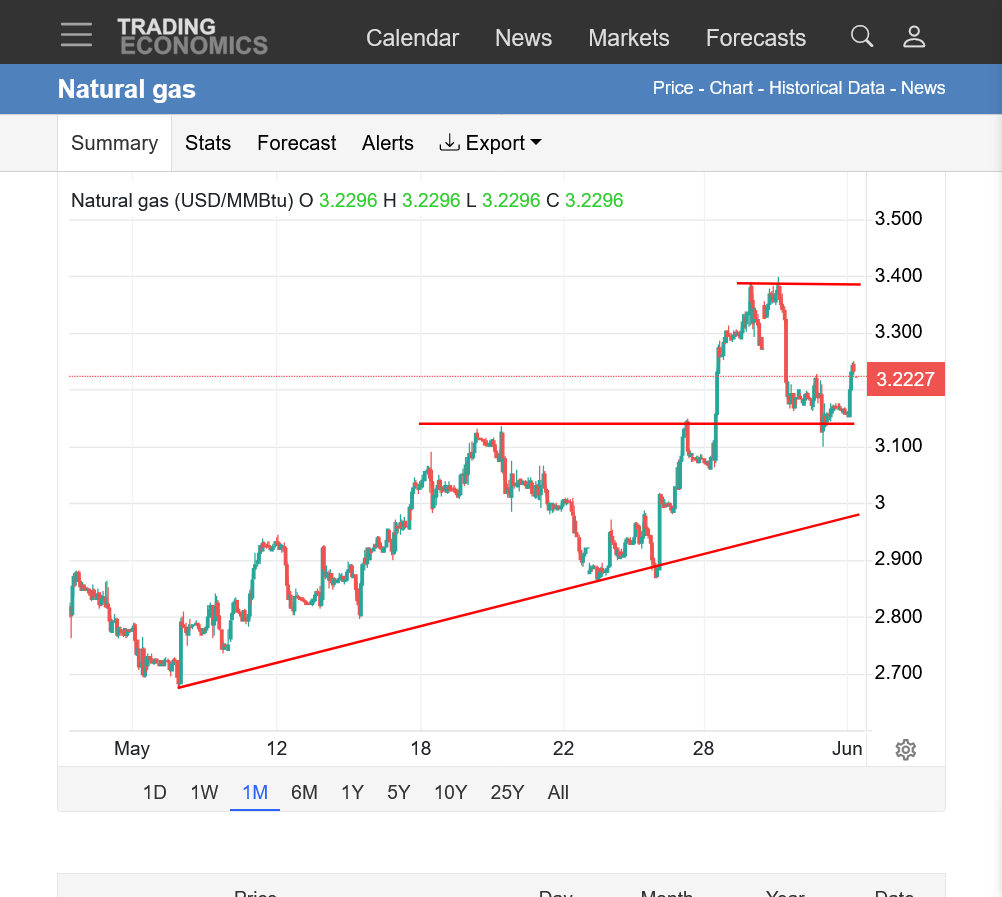
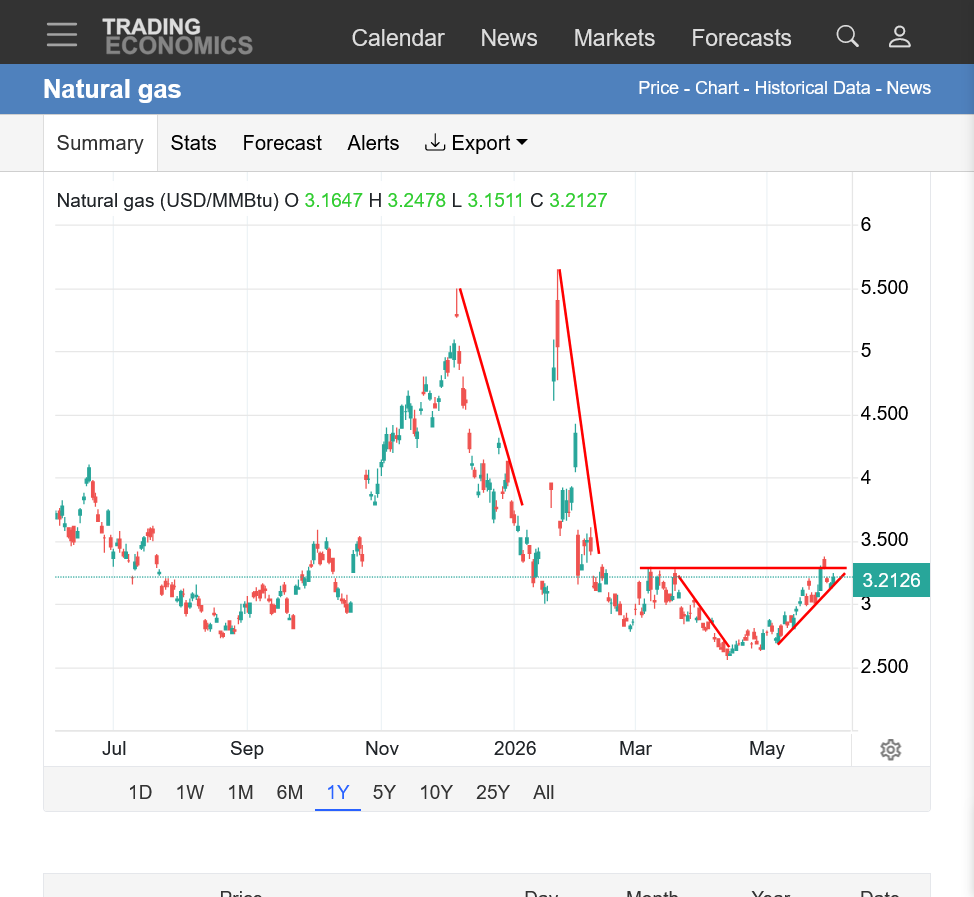
++++++++++++++
From the previous thread:
By metmike - March 25, 2026, 4:03 p.m.
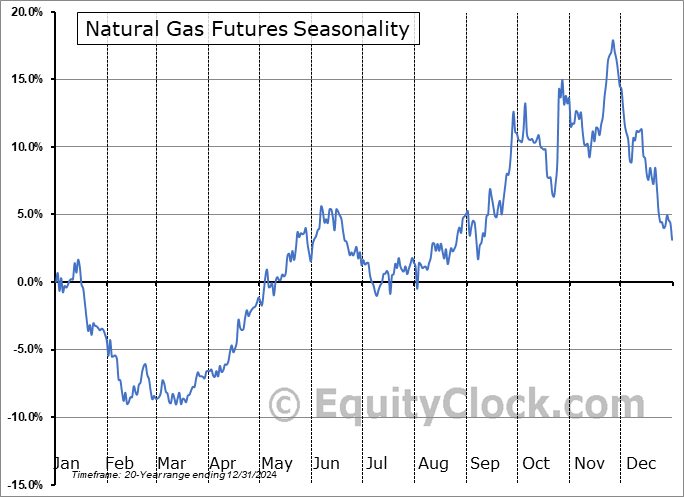
"Don't be short natural gas from late March thru May without a real good reason!"
https://charts.equityclock.com/natural-gas-futures-ng-seasonal-chart
++++++++
It's June now and there's a weaker seasonal LOWER this month.
++++++++++++++
Regardless of the temporary +5 CDDs on the last EE model above, the weather MAPS are more bearish at the end of week 2, so this move up will likely not go very far. This was the last 500 mb map at the end of week 2 below:

The EE was +4 CCDs overnight.
for week ending May 29, 2026 | Released: June 4, 2026 at 10:30 a.m. | Next Release: June 11, 2026
| Working gas in underground storage, Lower 48 states Summary text CSV JSN | |||||||||||||||||||||||||
|---|---|---|---|---|---|---|---|---|---|---|---|---|---|---|---|---|---|---|---|---|---|---|---|---|---|
| Historical Comparisons | |||||||||||||||||||||||||
| Stocks billion cubic feet (Bcf) | Year ago (05/29/25) | 5-year average (2021-25) | |||||||||||||||||||||||
| Region | 05/29/26 | 05/22/26 | net change | implied flow | Bcf | % change | Bcf | % change | |||||||||||||||||
| East | 480 | 447 | 33 | 33 | 493 | -2.6 | 473 | 1.5 | |||||||||||||||||
| Midwest | 573 | 539 | 34 | 34 | 574 | -0.2 | 560 | 2.3 | |||||||||||||||||
| Mountain | 218 | 213 | 5 | 5 | 204 | 6.9 | 164 | 32.9 | |||||||||||||||||
| Pacific | 298 | 292 | 6 | 6 | 260 | 14.6 | 232 | 28.4 | |||||||||||||||||
| South Central | 1,009 | 993 | 16 | 16 | 1,050 | -3.9 | 1,012 | -0.3 | |||||||||||||||||
| Salt | 310 | 305 | 5 | 5 | 338 | -8.3 | 305 | 1.6 | |||||||||||||||||
| Nonsalt | 699 | 688 | 11 | 11 | 712 | -1.8 | 707 | -1.1 | |||||||||||||||||
| Total | 2,578 | 2,483 | 95 | 95 | 2,581 | -0.1 | 2,440 | 5.7 | |||||||||||||||||
| Totals may not equal sum of components because of independent rounding. | |||||||||||||||||||||||||
Working gas in storage was 2,578 Bcf as of Friday, May 29, 2026, according to EIA estimates. This represents a net increase of 95 Bcf from the previous week. Stocks were 3 Bcf less than last year at this time and 138 Bcf above the five-year average of 2,440 Bcf. At 2,578 Bcf, total working gas is within the five-year historical range.
For information on sampling error in this report, see Estimated Measures of Sampling Variability table below.
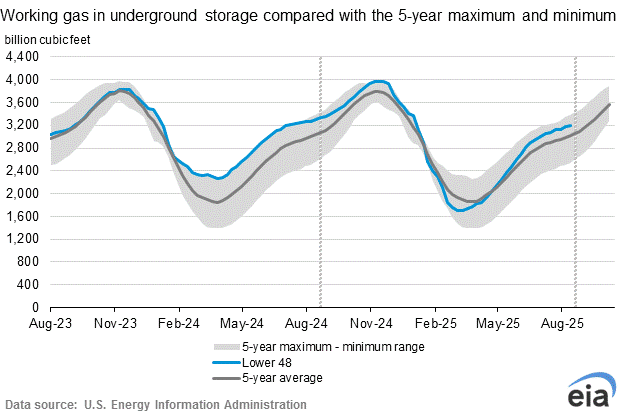
Note: The shaded area indicates the range between the historical minimum and maximum values for the weekly series from 2021 through 2025. The dashed vertical lines indicate current and year-ago weekly periods.
The last 0z EE model was -4 CCDs lower overnight and it pressured NG lower.
Could we have a double top in place and early Summer seasonal high in place?
The war in Iran has messed up the energy markets and created massive uncertainty from volatile whipsawing NEWS.
Im at a hotel right now on my IPad and can’t show the charts until late today or this weekend.
The cooling the last several days has been astounding!!!!
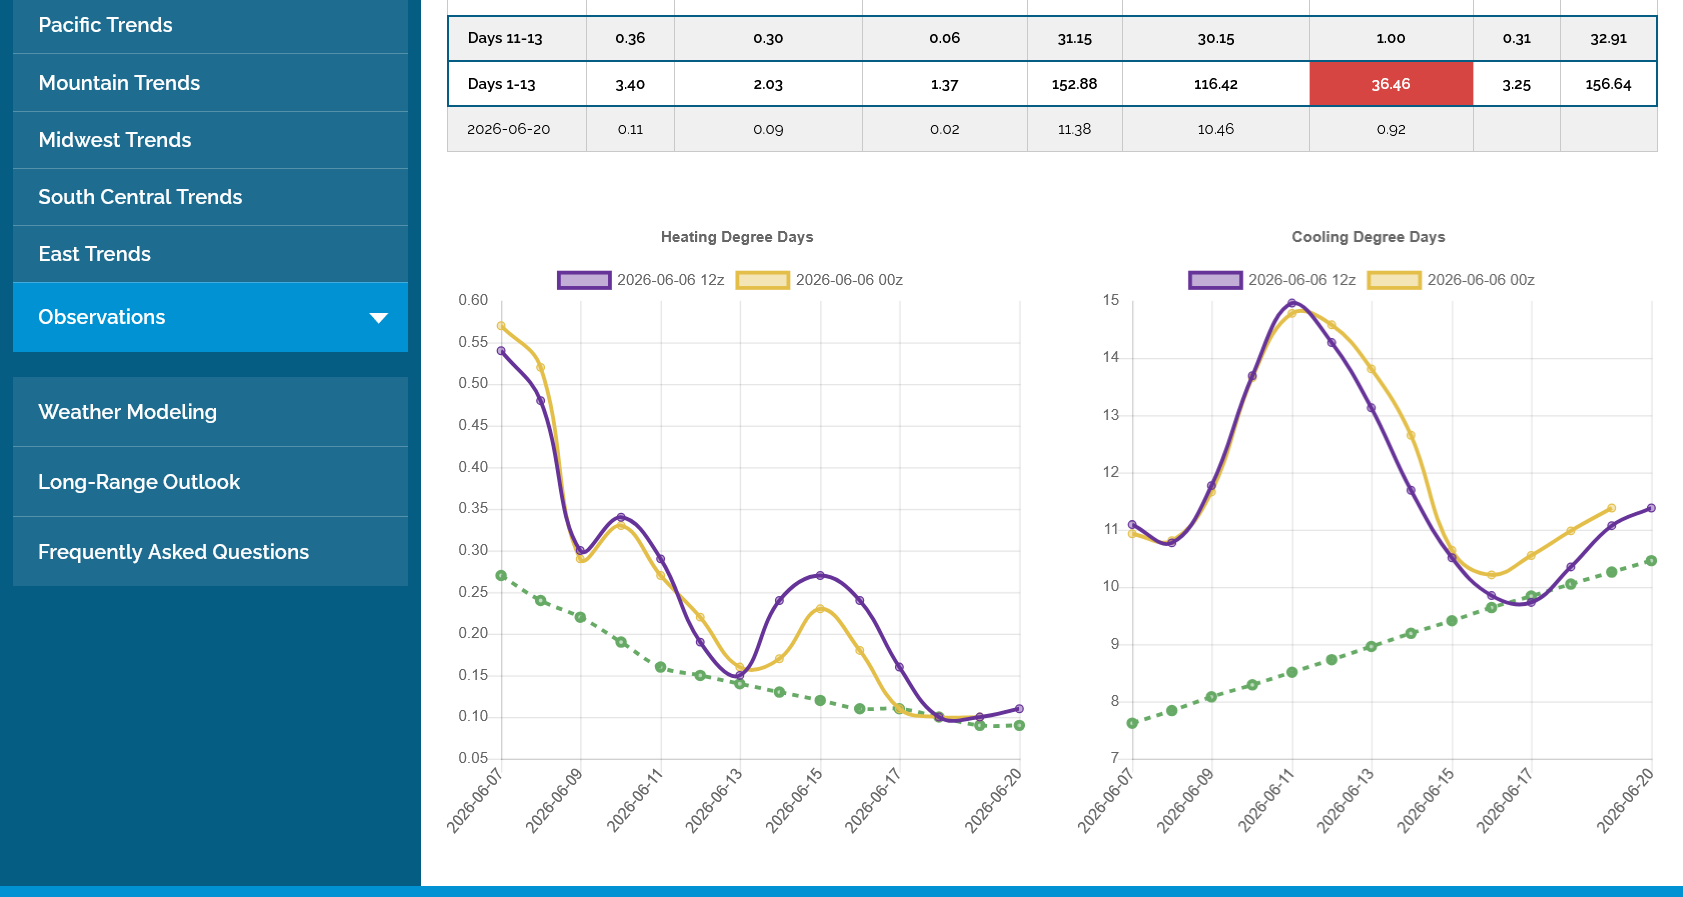
This last 12 European model (purple/right) was ANOTHER -4 CDDs compared to the previous run 12 hours earlier.
What looked like a period of intense heat with a major heat ridge in the center of the country in week 2 less than a week ago, now features cooling down close to average!!
1. Last 12 EE run.
2. oz run from 84 hours ago(3.5 days). Note how much higher the CDDs were above average (green line) in week 2!
3. 500 mb chart in 2 weeks from the EE model.
4. Temperature anomalies for week 2. Instead of near record heat in the middle of the country, now we have BELOW average temperatures..



I'll be riding go carts with the kids and grand kids when we open but I would think it could be sharply lower. I would also be interested in shorting with temps cooling off so much but the war in Iran and sharply higher crude market and worst global energy crisis in history make that a risky position..........especially on vacation.
The big cool snap might just last for a week, then heat back up?
CDDs have bounced up a tad since yesterday but I'll guess a lower open here over an hour before the open.
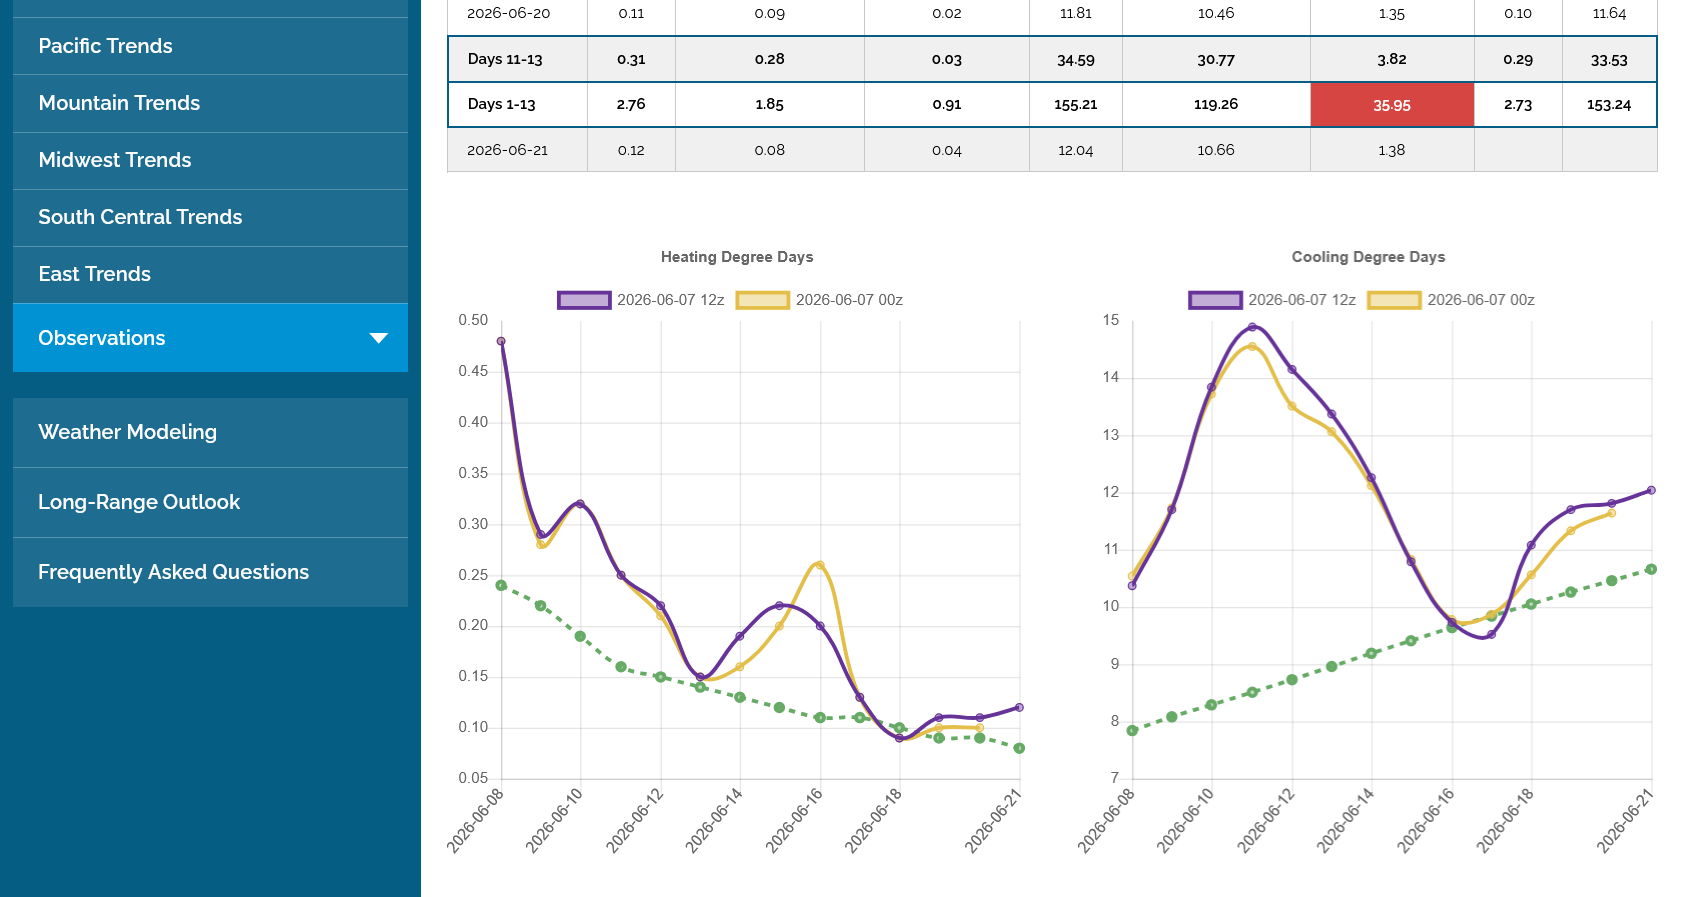
1. Purple/right was the last 12 EE model, +2CDDs vs the 0z run.
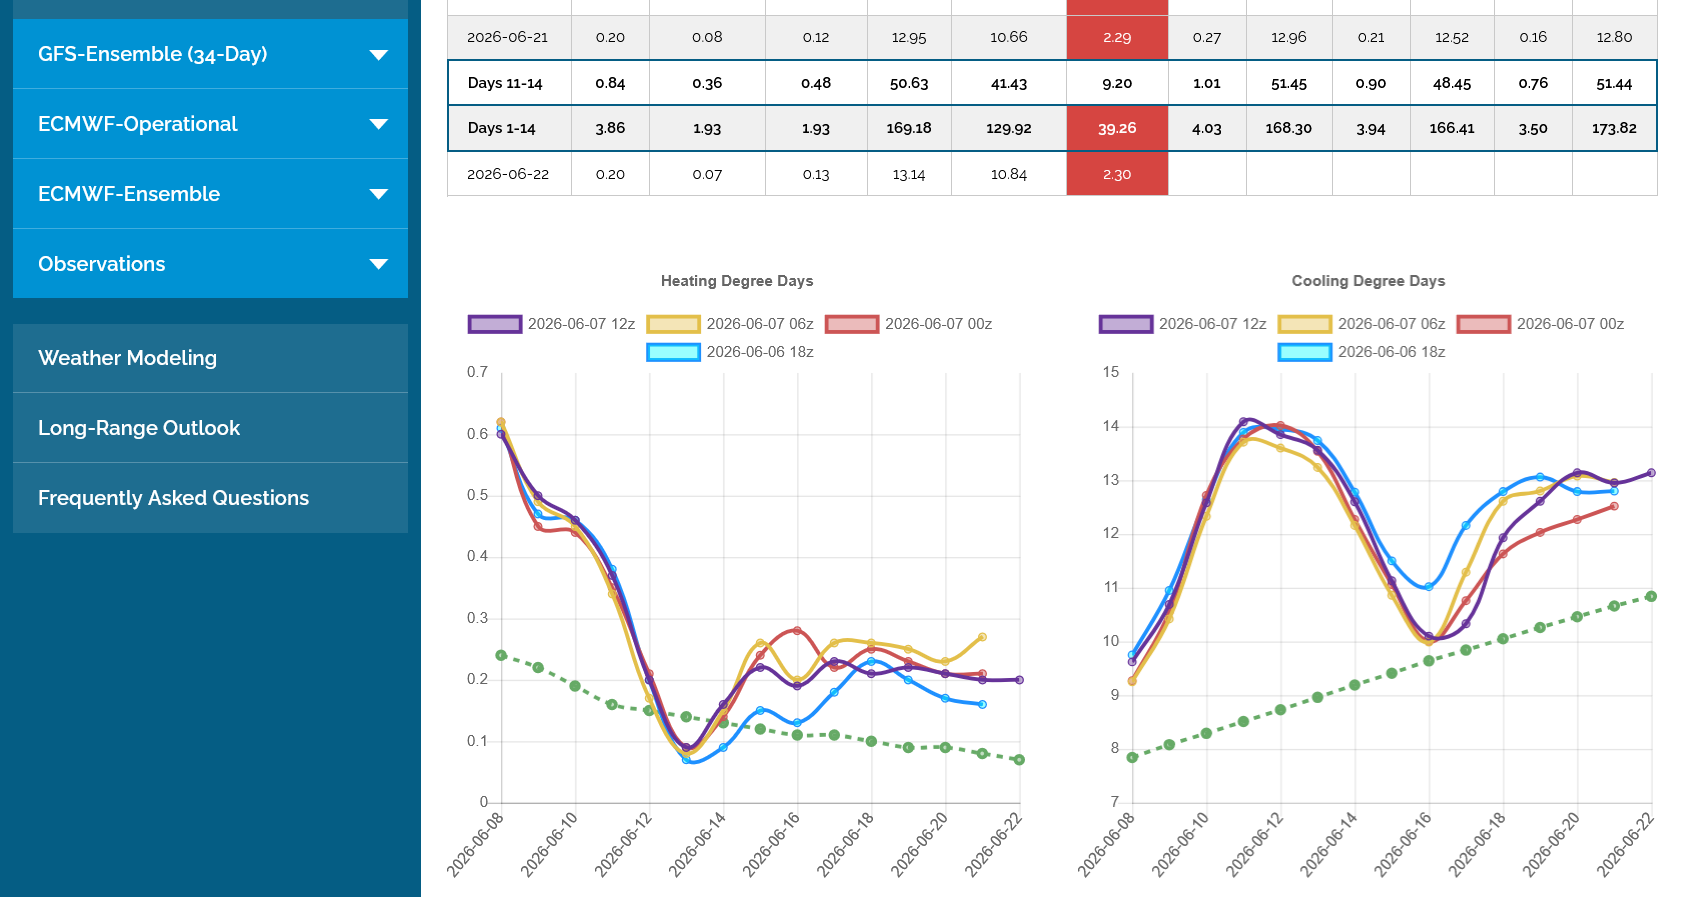
2. Here's the last 4 runs of the GEFS spaced 6 hours apart, last 12z run in purple.
8pm: We got a gap lower but not sharply lower. No follow thru either but unable to fill the small gap.
https://tradingeconomics.com/commodity/natural-gas
1. 1 day: Downside break away gap! Much cooler temps in the forecast over the weekend!
2. 1 week: Downside gap lower, top formation
3. 1 month: Downside gap lower, double top
4. 1 year: Weather spikes from cold weather blasts last Winter. Uptrend from seasonal low in April possibly being broken.........OR Failed just being tested. Break out from an ascending triangle/wedge?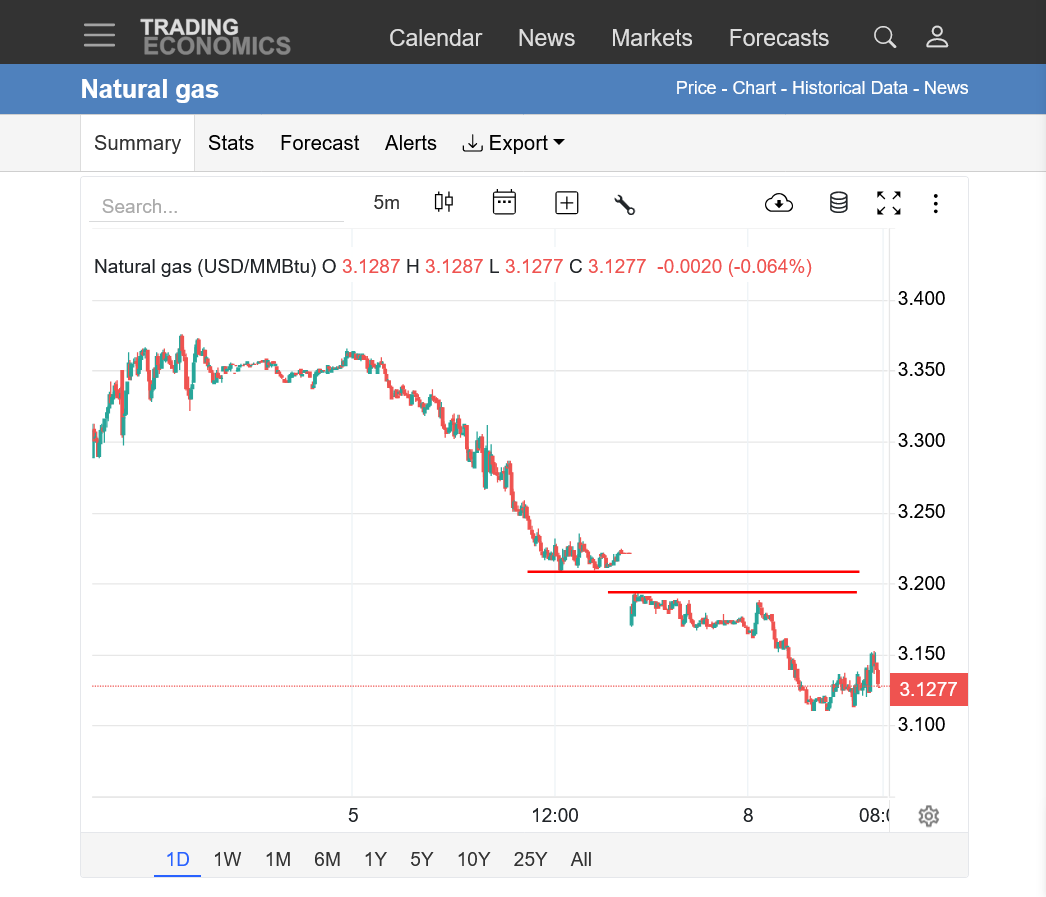
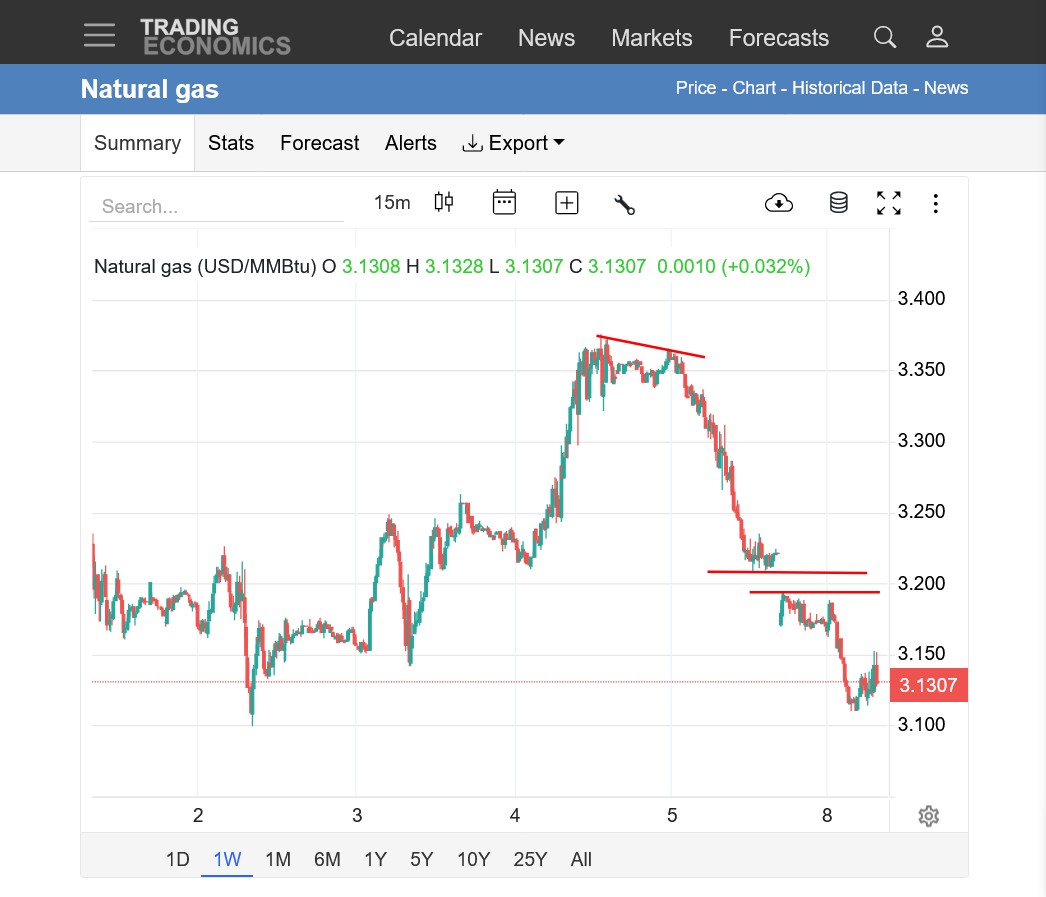
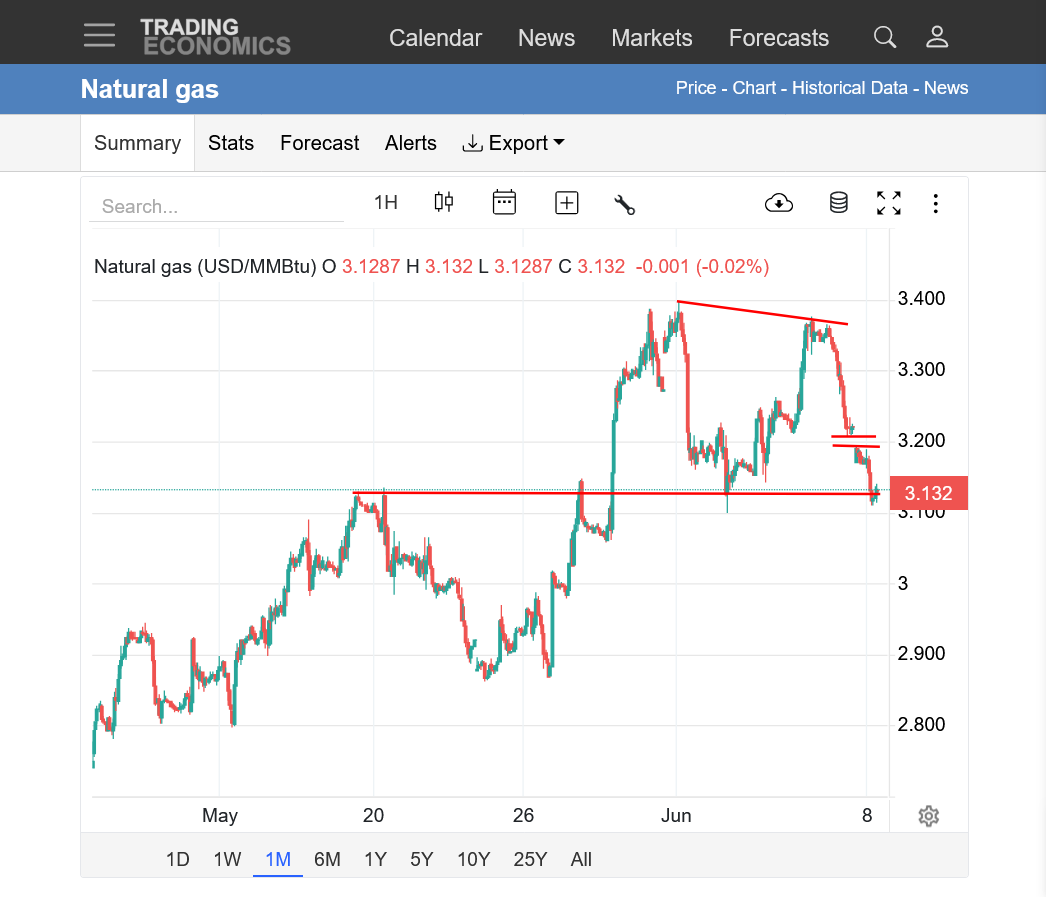
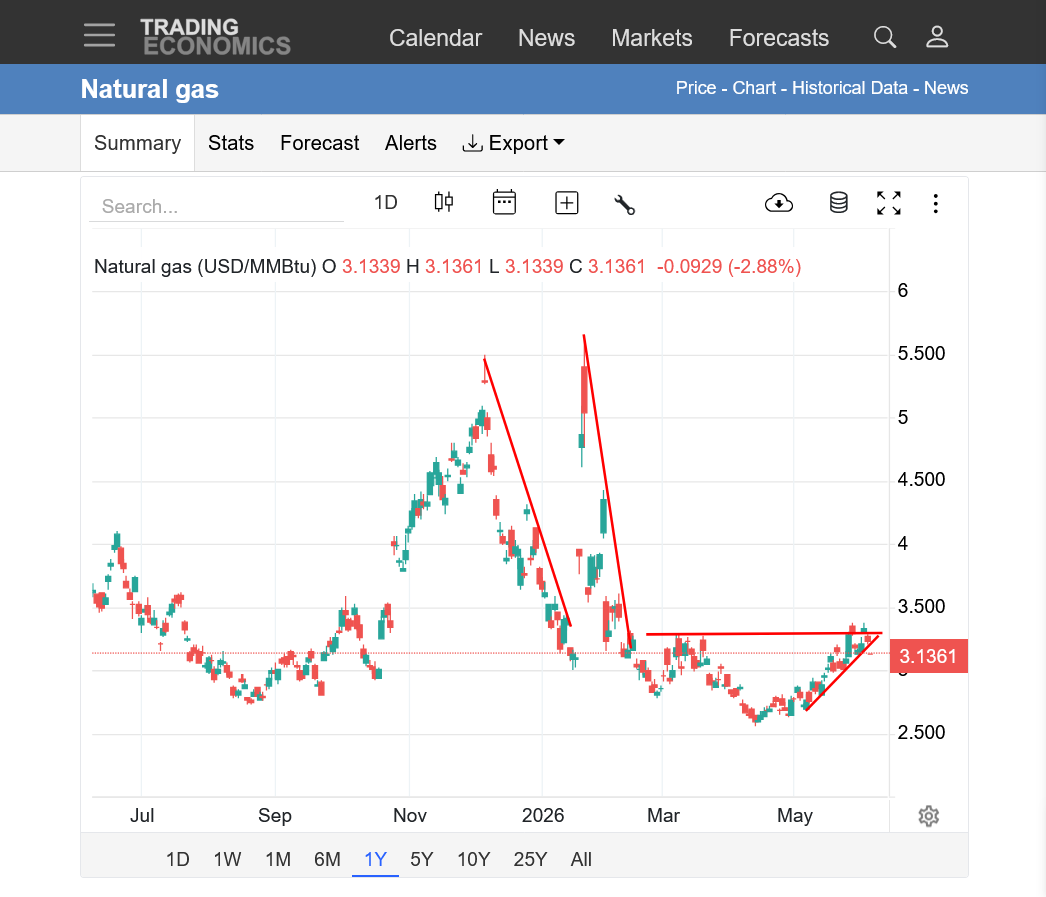
Natural gas has traded up to the top of the gap 2 times this morning. Basically filling the gap but with no follow thru. Looks like the remaining gap is 1 tick above today's high of 3.207.
A gap and crap like this is often associated with a selling EXHAUSTION, when the market runs out of sellers but mainly after extended moves lower, not just 1 day lower in a 2 month long UPTREND.
Not quite filling the gap(the top of the gap holding) is actually bearish considering where we are in the move and the time of year(seasonals) AND the cool shot coming this week!
https://tradingeconomics.com/commodity/natural-gas
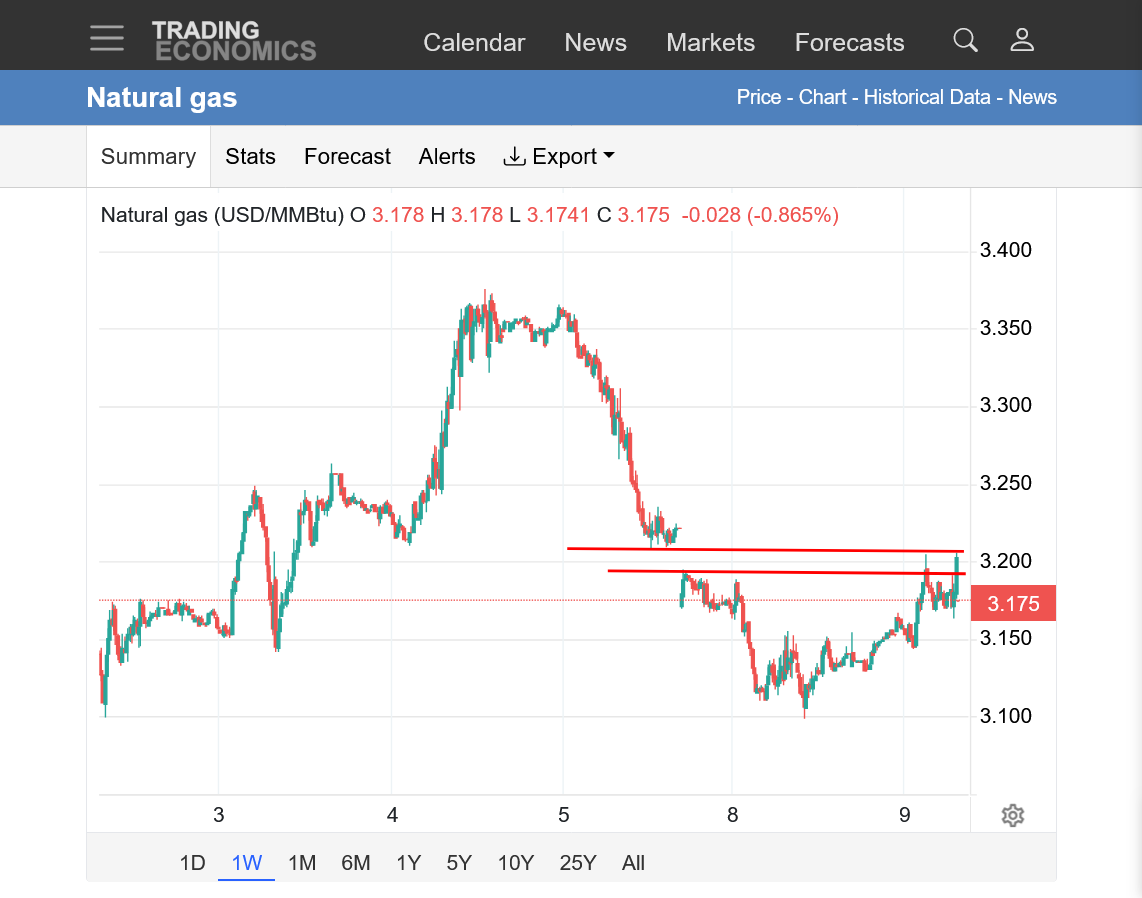
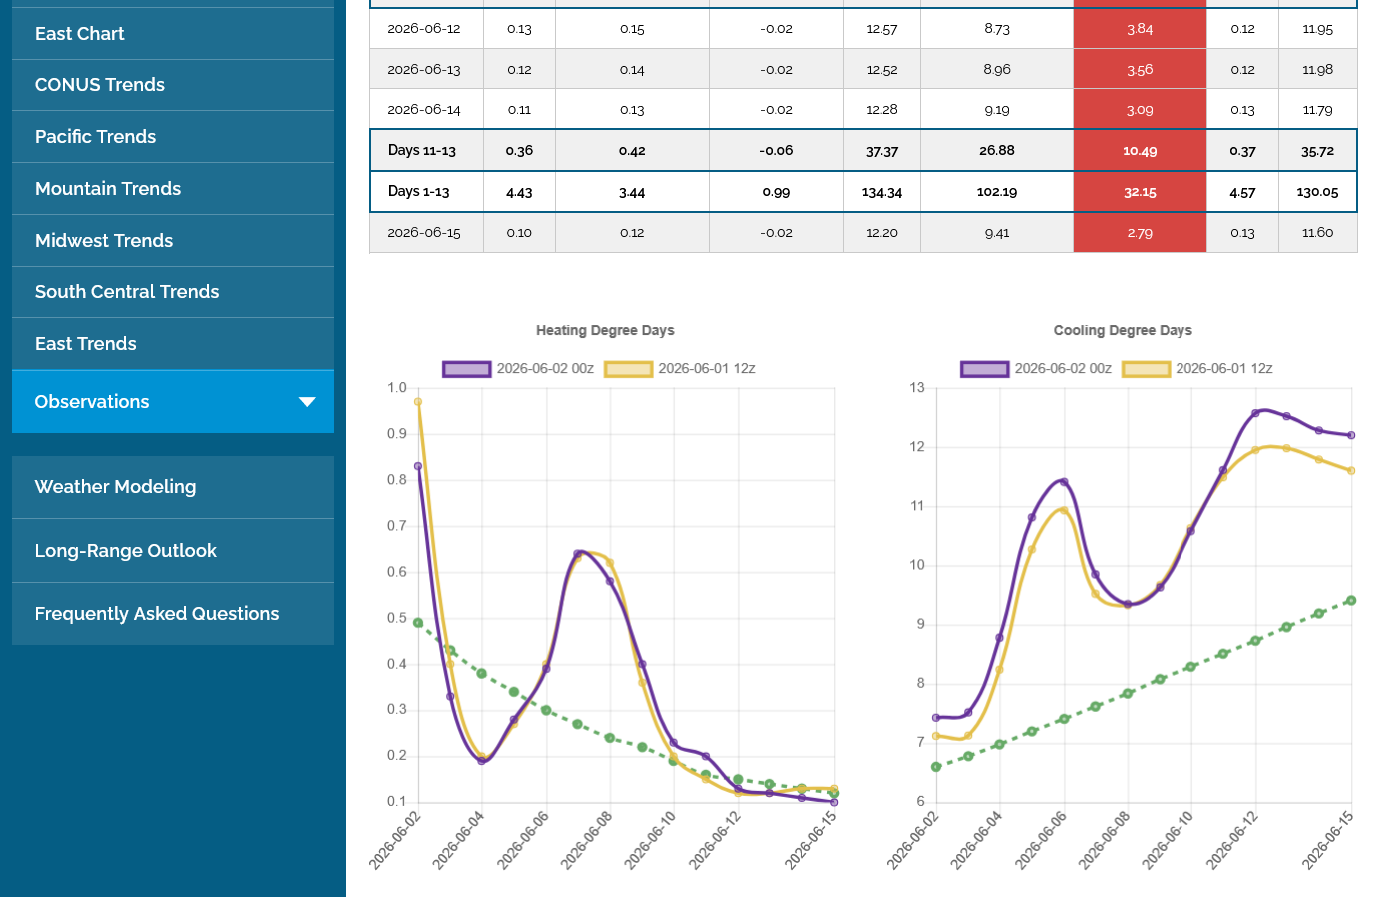
Helping the NG, which was already up a bit was the last 0z European Ensemble model in purple/right that was up another +5 CDDs vs the previous run 12 hours earlier.
What matters the most is the trajectory at the end of the period. Is it getting hotter or cooler??? Overall, compared to the previous day it's getting HOTTER.
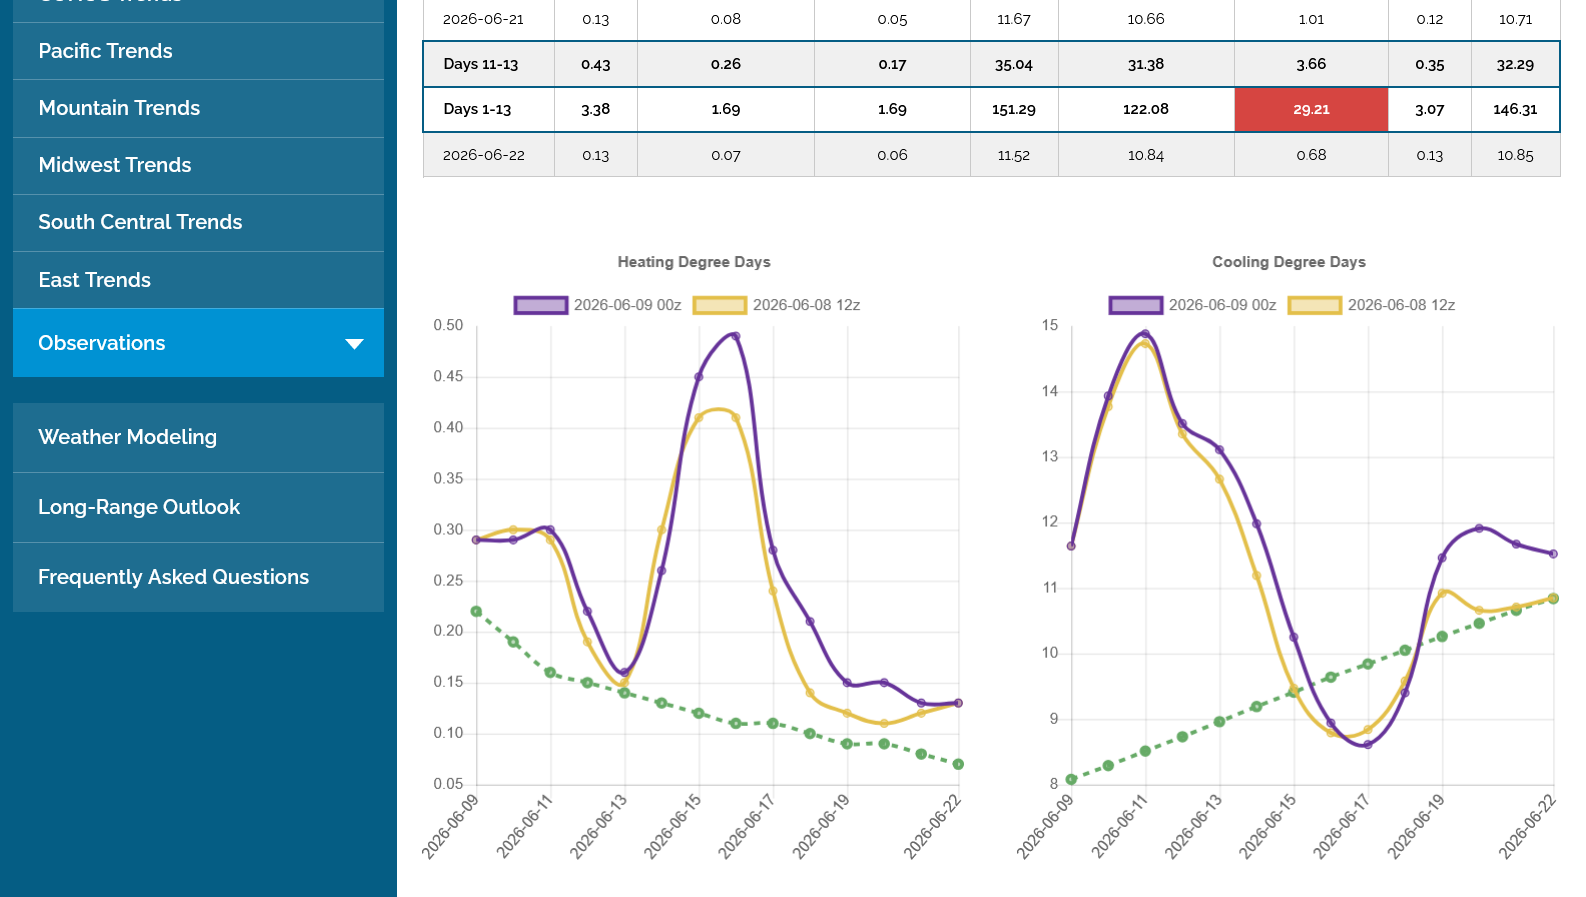
The last 0z EE (purple/right)was +5 CDDs HOTTER than the previous run!! This added heat, all in week 2 is BULLISH!
The 0z GEFS was the opposite, being -7 CDDs COOLER and bearish!
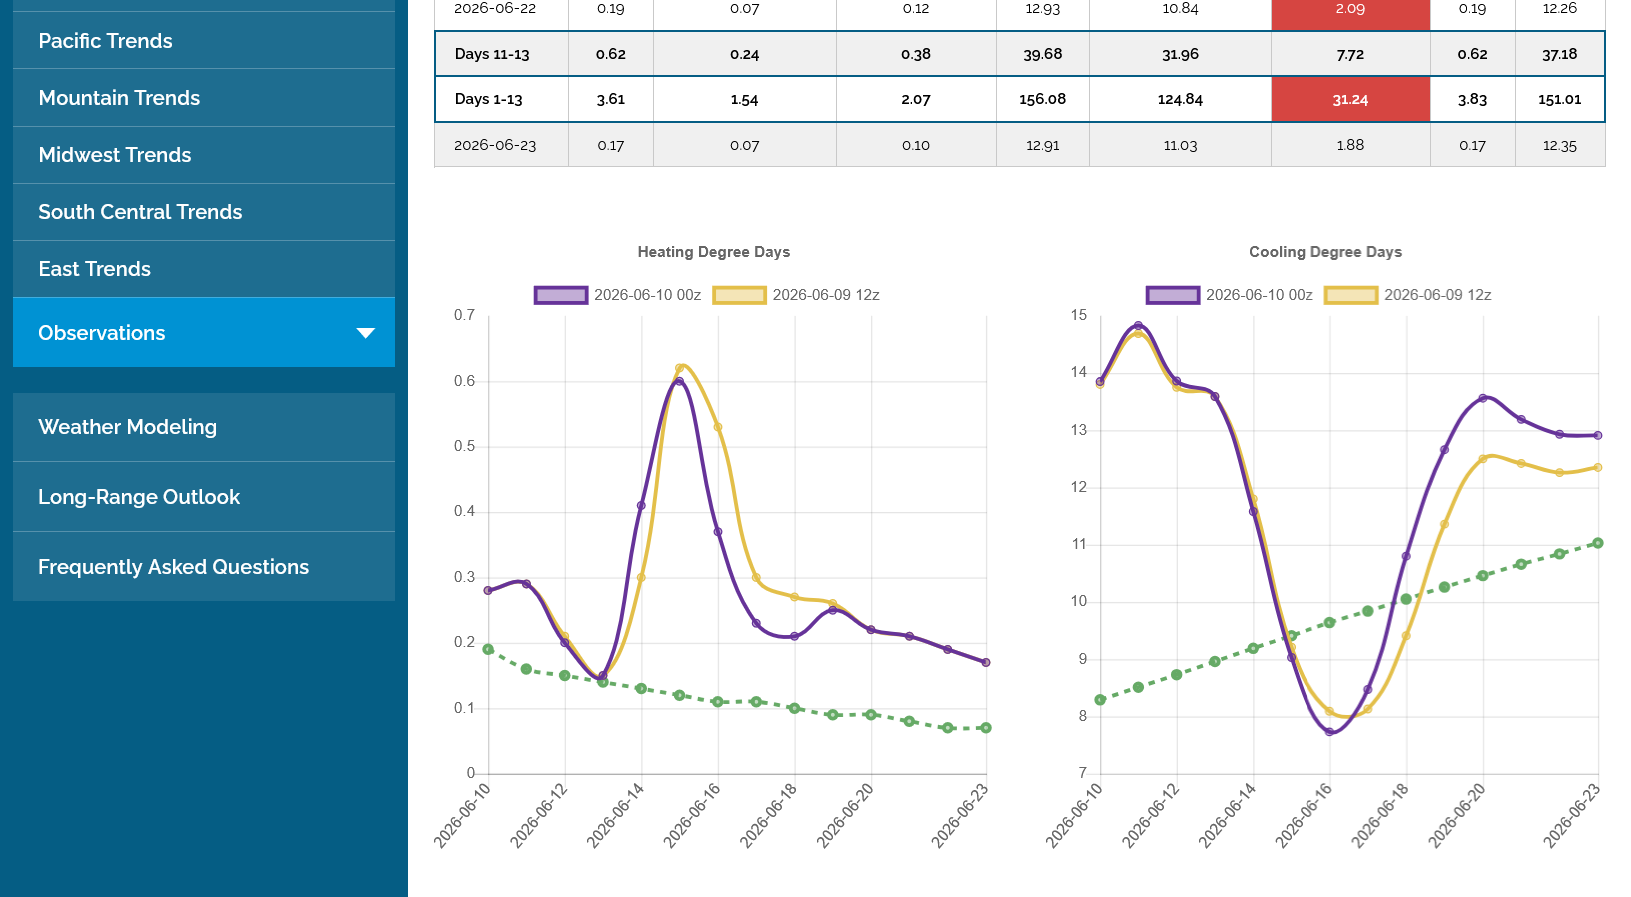
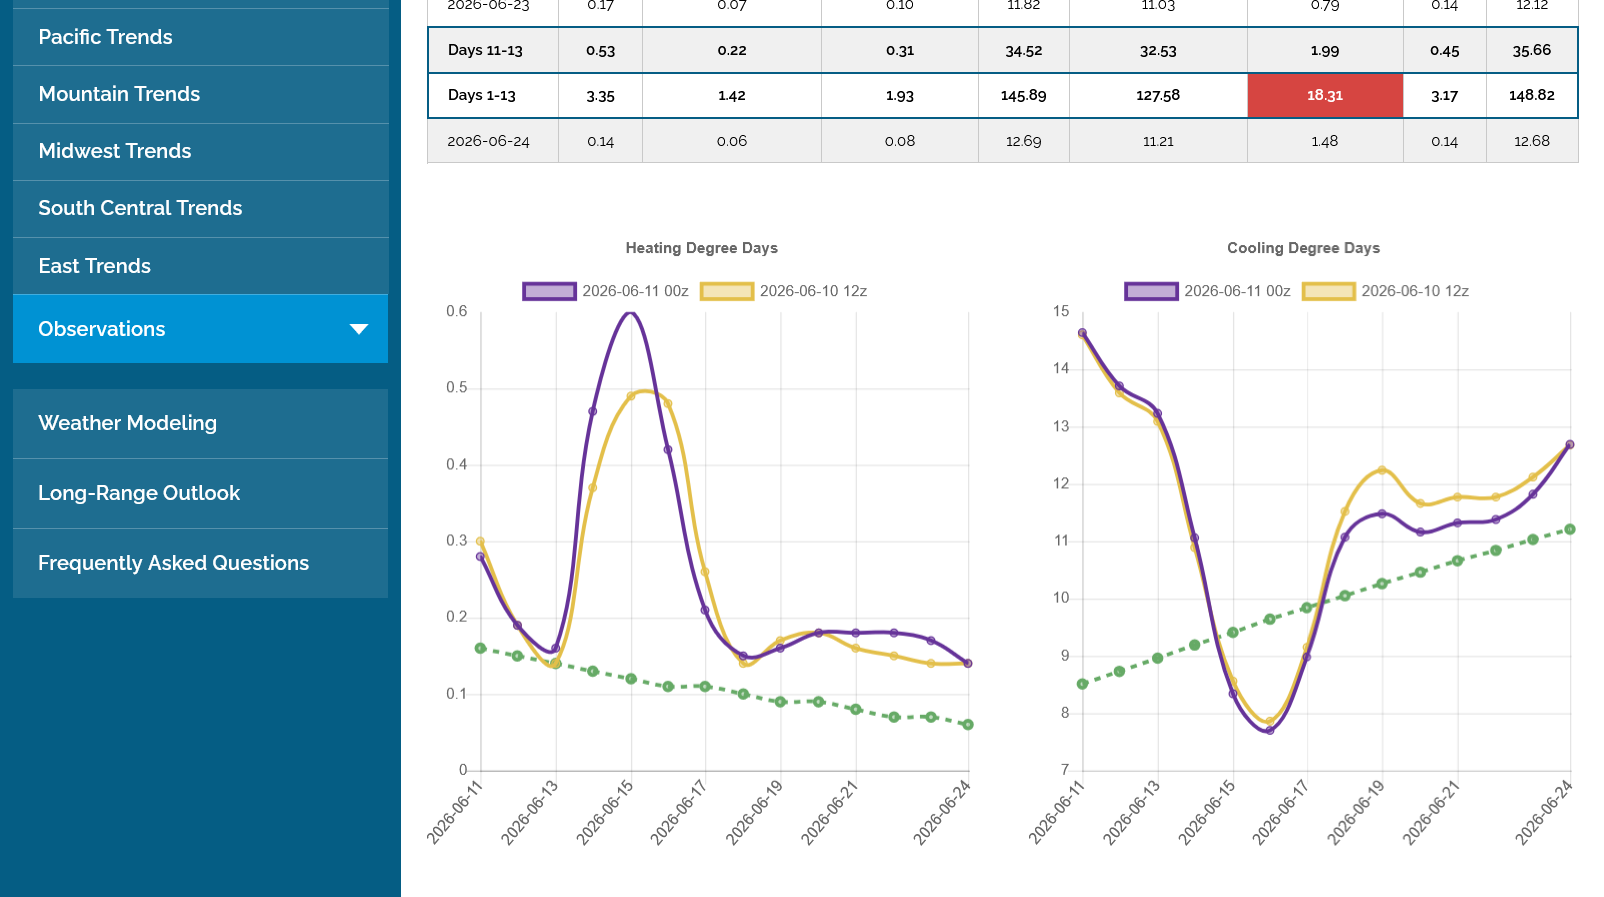
-3 CDDs for the last European Ensemble model which added to pressure of the market lower over night.

for week ending June 5, 2026 | Released: June 11, 2026 at 10:30 a.m. | Next Release: June 18, 2026
| Working gas in underground storage, Lower 48 states Summary text CSV JSN | |||||||||||||||||||||||||
|---|---|---|---|---|---|---|---|---|---|---|---|---|---|---|---|---|---|---|---|---|---|---|---|---|---|
| Historical Comparisons | |||||||||||||||||||||||||
| Stocks billion cubic feet (Bcf) | Year ago (06/05/25) | 5-year average (2021-25) | |||||||||||||||||||||||
| Region | 06/05/26 | 05/29/26 | net change | implied flow | Bcf | % change | Bcf | % change | |||||||||||||||||
| East | 514 | 480 | 34 | 34 | 526 | -2.3 | 503 | 2.2 | |||||||||||||||||
| Midwest | 610 | 573 | 37 | 37 | 604 | 1.0 | 587 | 3.9 | |||||||||||||||||
| Mountain | 222 | 218 | 4 | 4 | 209 | 6.2 | 171 | 29.8 | |||||||||||||||||
| Pacific | 304 | 298 | 6 | 6 | 265 | 14.7 | 239 | 27.2 | |||||||||||||||||
| South Central | 1,037 | 1,009 | 28 | 28 | 1,086 | -4.5 | 1,035 | 0.2 | |||||||||||||||||
| Salt | 322 | 310 | 12 | 12 | 349 | -7.7 | 311 | 3.5 | |||||||||||||||||
| Nonsalt | 715 | 699 | 16 | 16 | 736 | -2.9 | 723 | -1.1 | |||||||||||||||||
| Total | 2,686 | 2,578 | 108 | 108 | 2,691 | -0.2 | 2,535 | 6.0 | |||||||||||||||||
| Totals may not equal sum of components because of independent rounding. | |||||||||||||||||||||||||
Working gas in storage was 2,686 Bcf as of Friday, June 5, 2026, according to EIA estimates. This represents a net increase of 108 Bcf from the previous week. Stocks were 5 Bcf less than last year at this time and 151 Bcf above the five-year average of 2,535 Bcf. At 2,686 Bcf, total working gas is within the five-year historical range.
For information on sampling error in this report, see Estimated Measures of Sampling Variability table below.
Note: The shaded area indicates the range between the historical minimum and maximum values for the weekly series from 2021 through 2025. The dashed vertical lines indicate current and year-ago weekly periods.
+++++++++++++++
7 day temps below. HOT in the Plains where not many people live. COOL in the East with many large population centers.
https://www.cpc.ncep.noaa.gov/products/tanal/temp_analyses.php

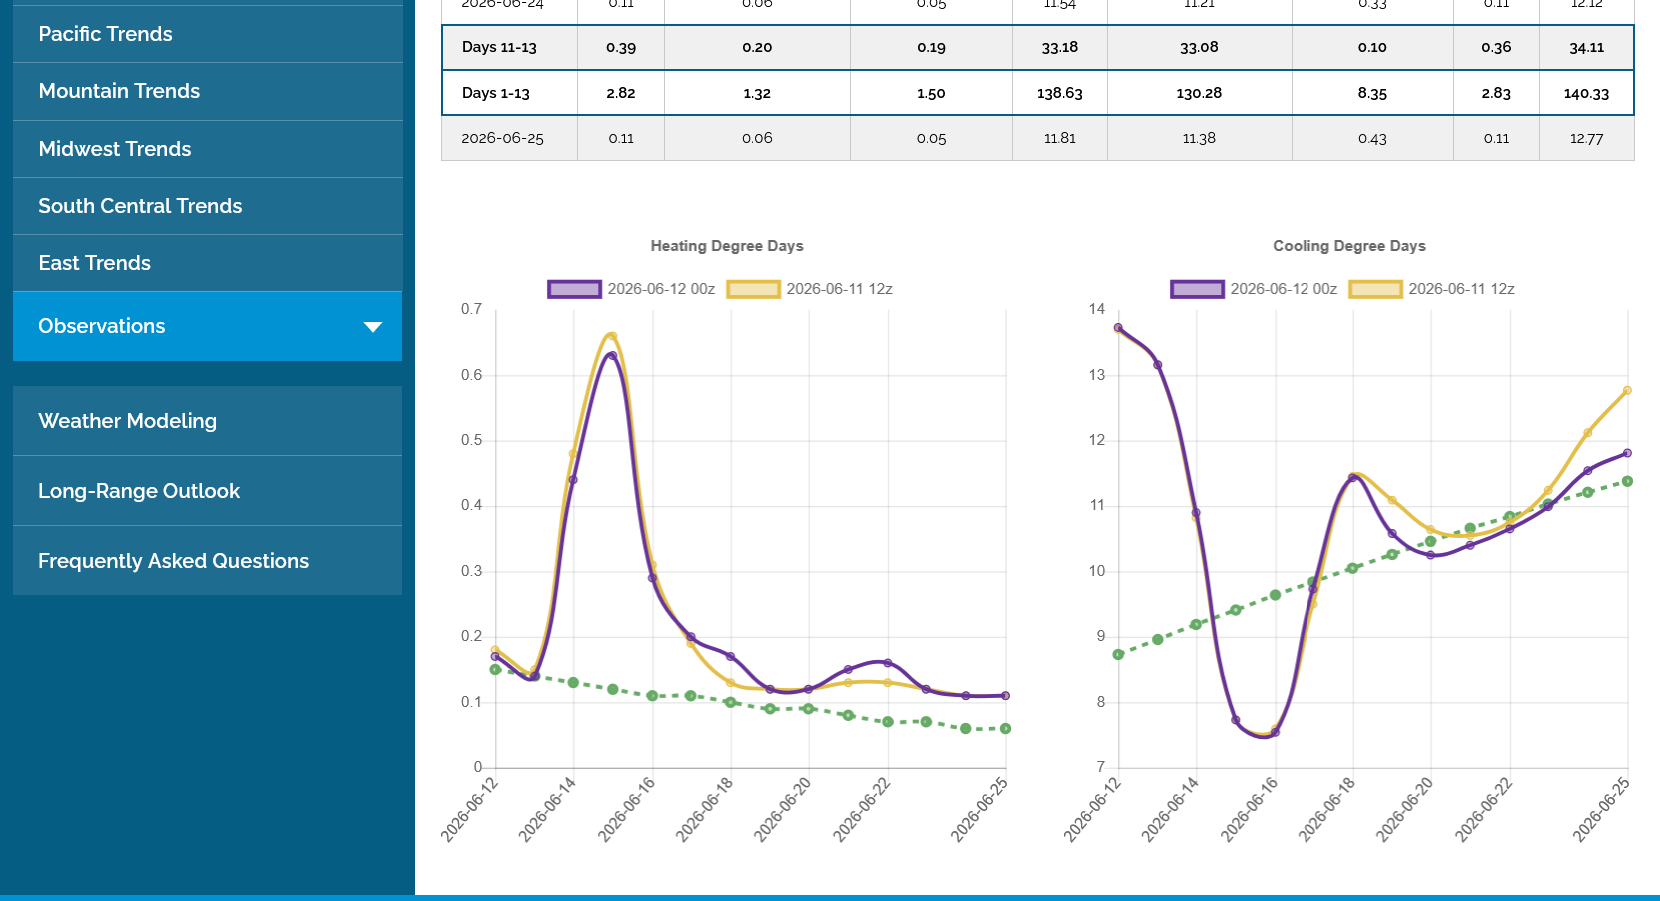
The last 0Z European Ensemble model was another -2 CDDs compared to the last 12z run but the market has reversed to slightly higher with $3 support holding and HOT July weather forecasts and an already big drop this week.
1. The last graph of CDDs on the right. Bearish!
2. The graph of CDDs from June 2nd(10 days ago) MUCH more bullish!!

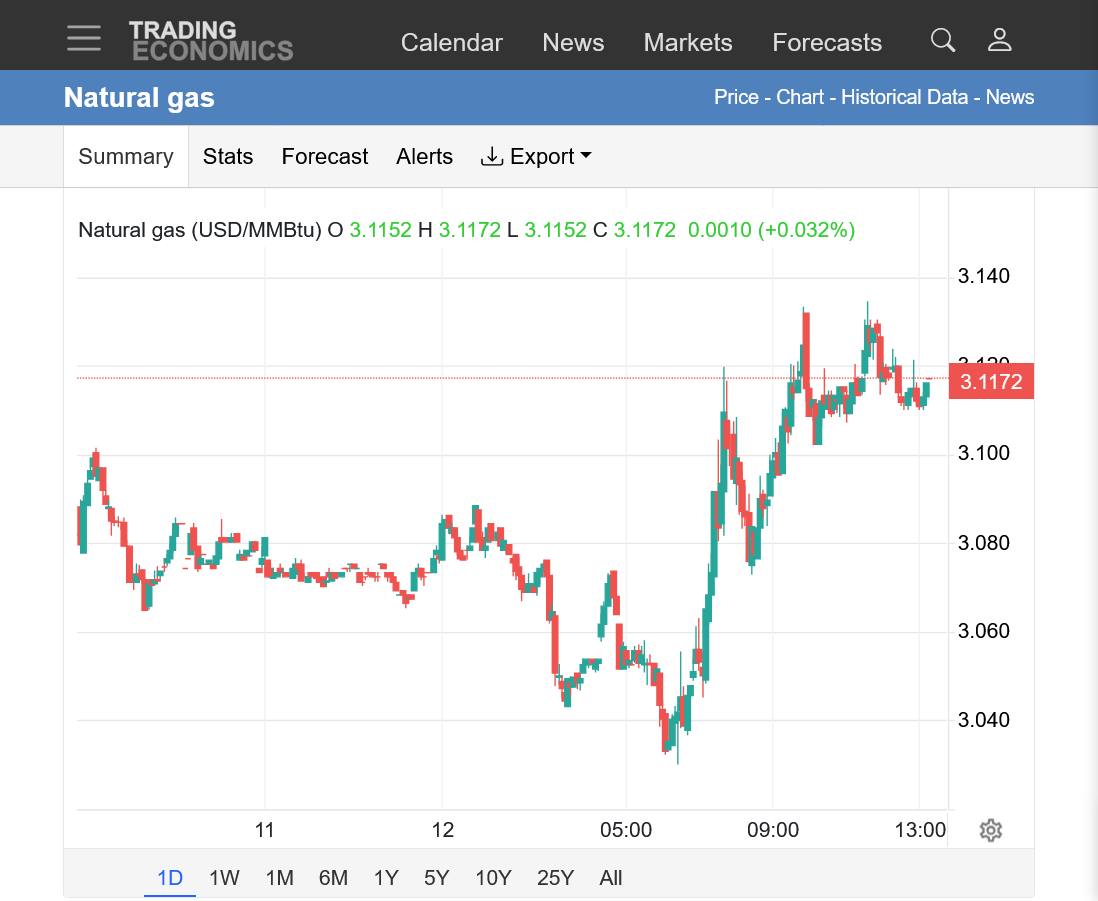
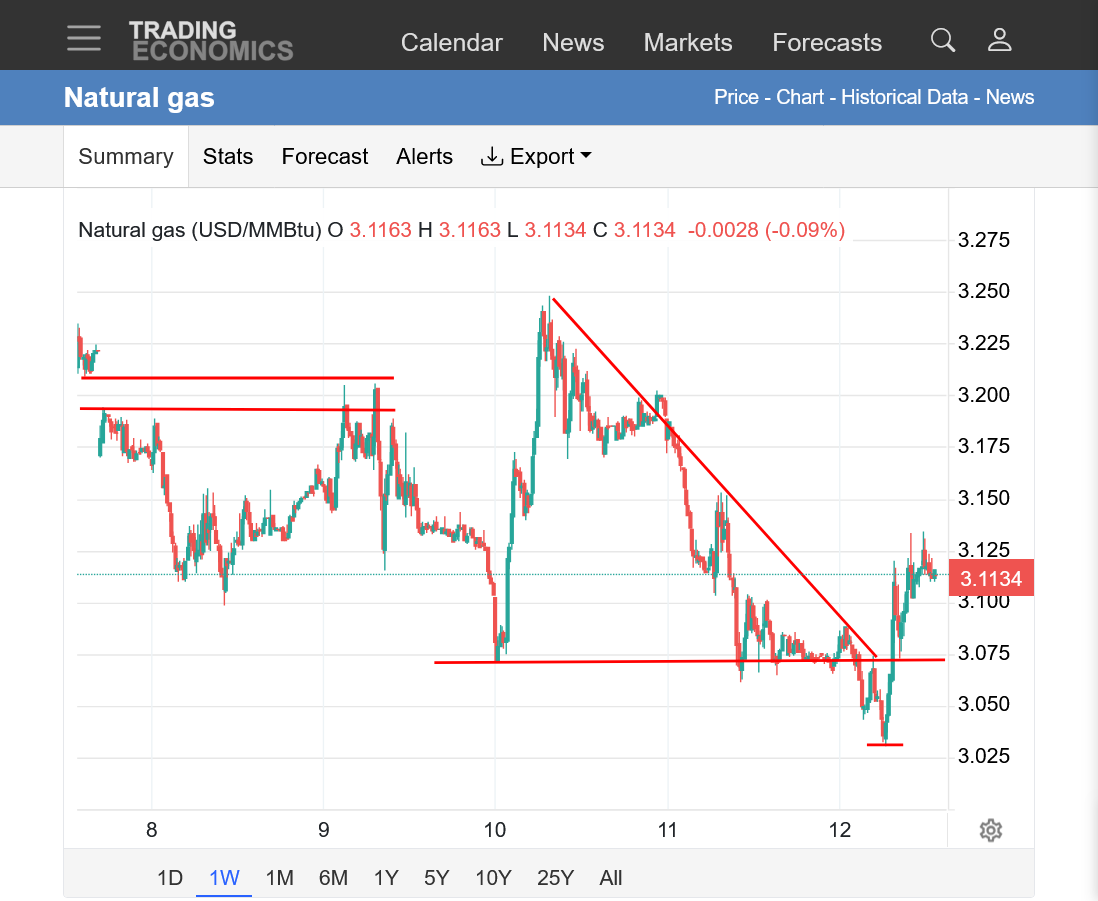
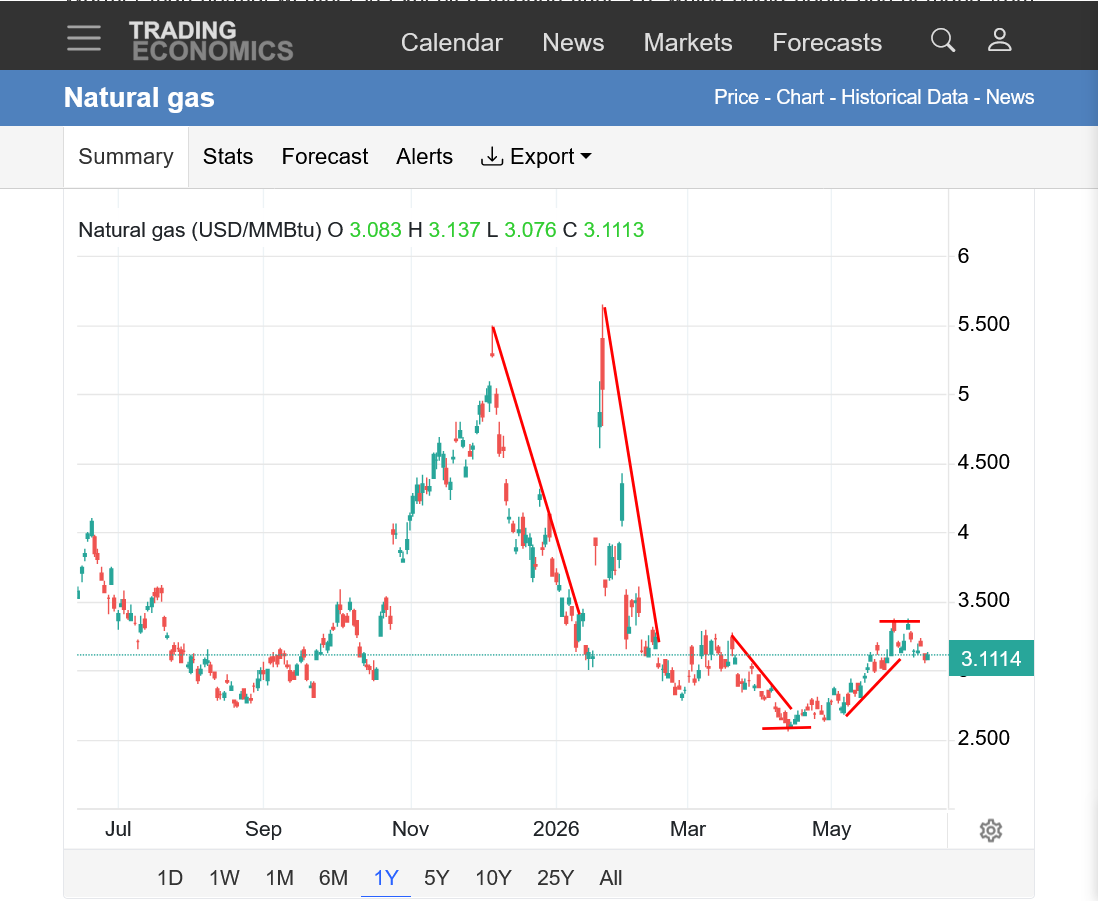
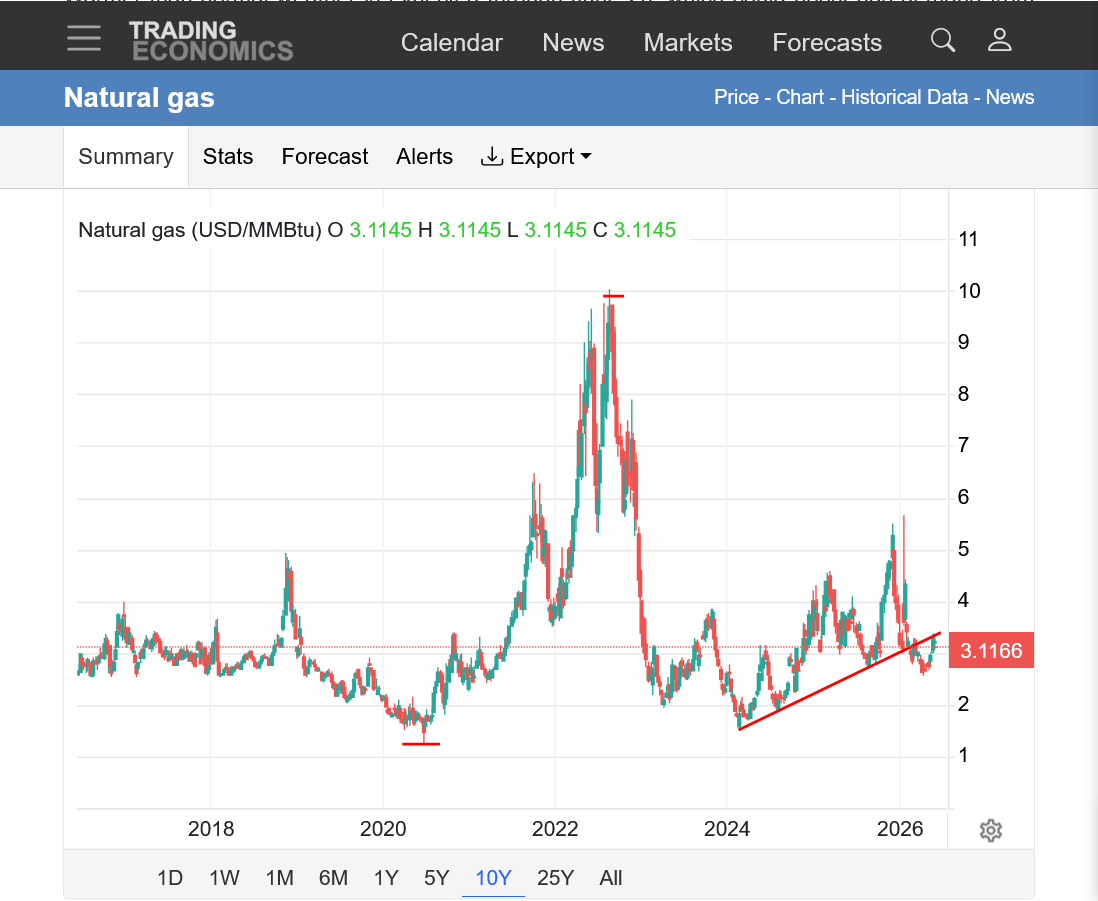
https://tradingeconomics.com/commodity/natural-gas
1. 1 day: Reversal up today after the most bearish EE of the month pressured overnight prices lower.
2. 1 week: Gap lower to start the week after last weekends weather forecast turned MUCH COOLER. Spike higher on Wednesday with a HOTTER forecast. Drop to new lows after the 2 week forecasts cooled off and a MEGA BEARISH EIA on Thursday. New lows early this morning, then a bounce to close slightly higher.
3. 1 year: Cold weather spikes last Winter. Downtrend at the end of the heating season from mild temps. Seasonal low in April. Seasonal strength and hot Summer forecasts thru May. Double top in June.
4. 10 years: 2020 COVID low. Summer 2022 Ukraine war high. Upward trending bias in recent years.
Re: Re: Re: Re: Re: Re: Re: Crude oil 5/24/26+
By tjc - June 12, 2026, 1:11 p.m.
"Looks" like today's reversal in NG put in a bottom. Long BOIL
+++++++++++
Thanks, tjc!
If the hot July forecast doesn't change, we should go up again as the HEAT gets closer, although the HEAT will be most intense in the Plains where not many people live.
Re: Re: Re: Re: Re: Re: Rain/Drought thread June 2026
By metmike - June 12, 2026, 12:34 p.m.
If week 2 forecasts keep the cool weather lingering longer and longer late in the period, instead of bringing the heat in, we can/will go lower.
There's also the uncertainty from the Iran war.
Seasonally, the 2nd half of June features weak prices historically for this particular time frame, which is just 1 negative element to consider amongst the many others here on June 14th.
The next EIA that gets released this Thursday at 9:30 am will be more bullish than the previous one because of the heat last week. We burned alot of NG to generate electricity for residential cooling/(air conditioning).
https://www.cpc.ncep.noaa.gov/products/tanal/temp_analyses.php
1. Temps last week for the next EIA report.
2. Temps the previous week for last weeks EIA report that saw a massive 3 digit injection(+108 Bcf).
https://www.marketforum.com/forum/topic/120595/#120747

++++++++++++++++++
This last 12z European Model Ensemble was -5 CDDs cooler against, so not surprisingly NG opened lower and is modestly lower at the moment.
The timing of the intense heat ridge keeps getting postponed, day after day on most forecasts. This is what has been pressuring ng prices lower the past week+ now.
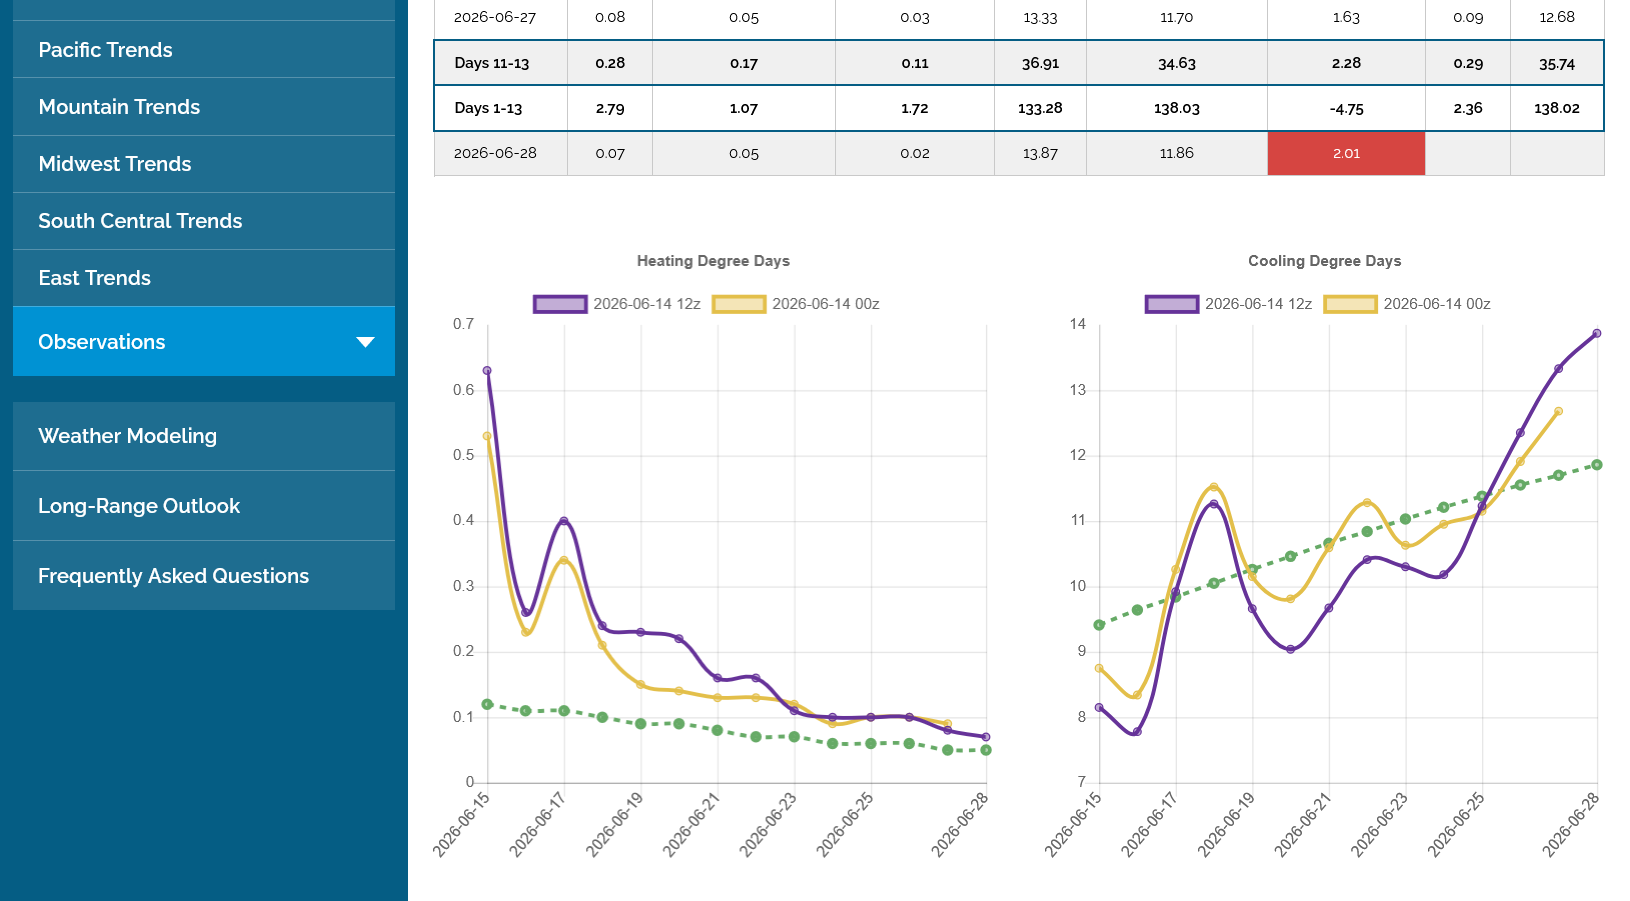
June 29 at 500 mb below with the prior week temperatures. Interesting that the center of the heat ridge is appearing in the Southeast at that time. This would have much different impacts than if its in the Plains.


BOIL boiling! Weather is forecasted warmer??
tjc,
I would call it uncertainty with regards to the upcoming weather with most of the cool short term and heat long term dialed in, along with $3 being rock solid support.
1. Will the cool continue to linger longer and add bearishness or
2. Will the hot July forecast get closer and cause a turn to bullish weather?
Unless the July forecast ends up being a bust, the heat will eventually get here.
Then, an important element will be the LOCATION of the heat. The more people underneath the heat ridge, the more ng gets burned to generate electricity for AC use in residential cooling.
So the farther east it is, the more bullish.
+++++++++++
With today's session, we can see the distinctive large fund activity that usually picks up around 6am.
It was at that time that we experienced the lows of the overnight session and funds started buying aggressively.
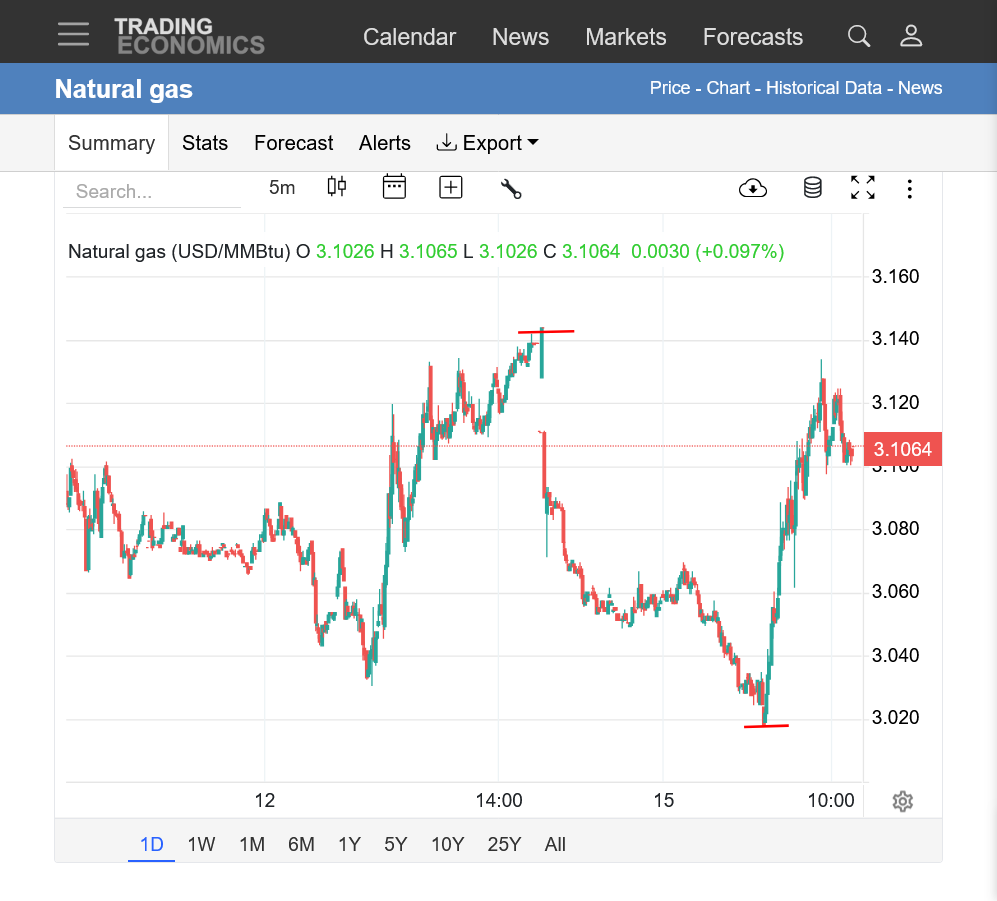
https://tradingeconomics.com/commodity/natural-gas
1. 1 day: Top horizontal line. Friday closed near the highs with expectations of the heat getting 2 days closer and being bullish on Sunday when we opened Instead, the forecast added 2 days of additional cool in week 2 over the weekend and DELAYED THE HEAT. So we opened LOWER on Sunday Night. This continued to pressure the market overnight.
Note the lows at 6am when the big funds started trading/buying. The last 6z GEFS coming out at that time was slightly warmer and that could have also been a minor factor(with $3 support). Active NG traders are extremely familiar with this big fund impact on many days around 6am. Sometimes it will gyrate up and down. Sometimes, like today the funds have the same idea and we go in 1 direction.
Adding alot of heat or taking a lot of it away will be a key factor for the price of natural gas for the next 2 months.
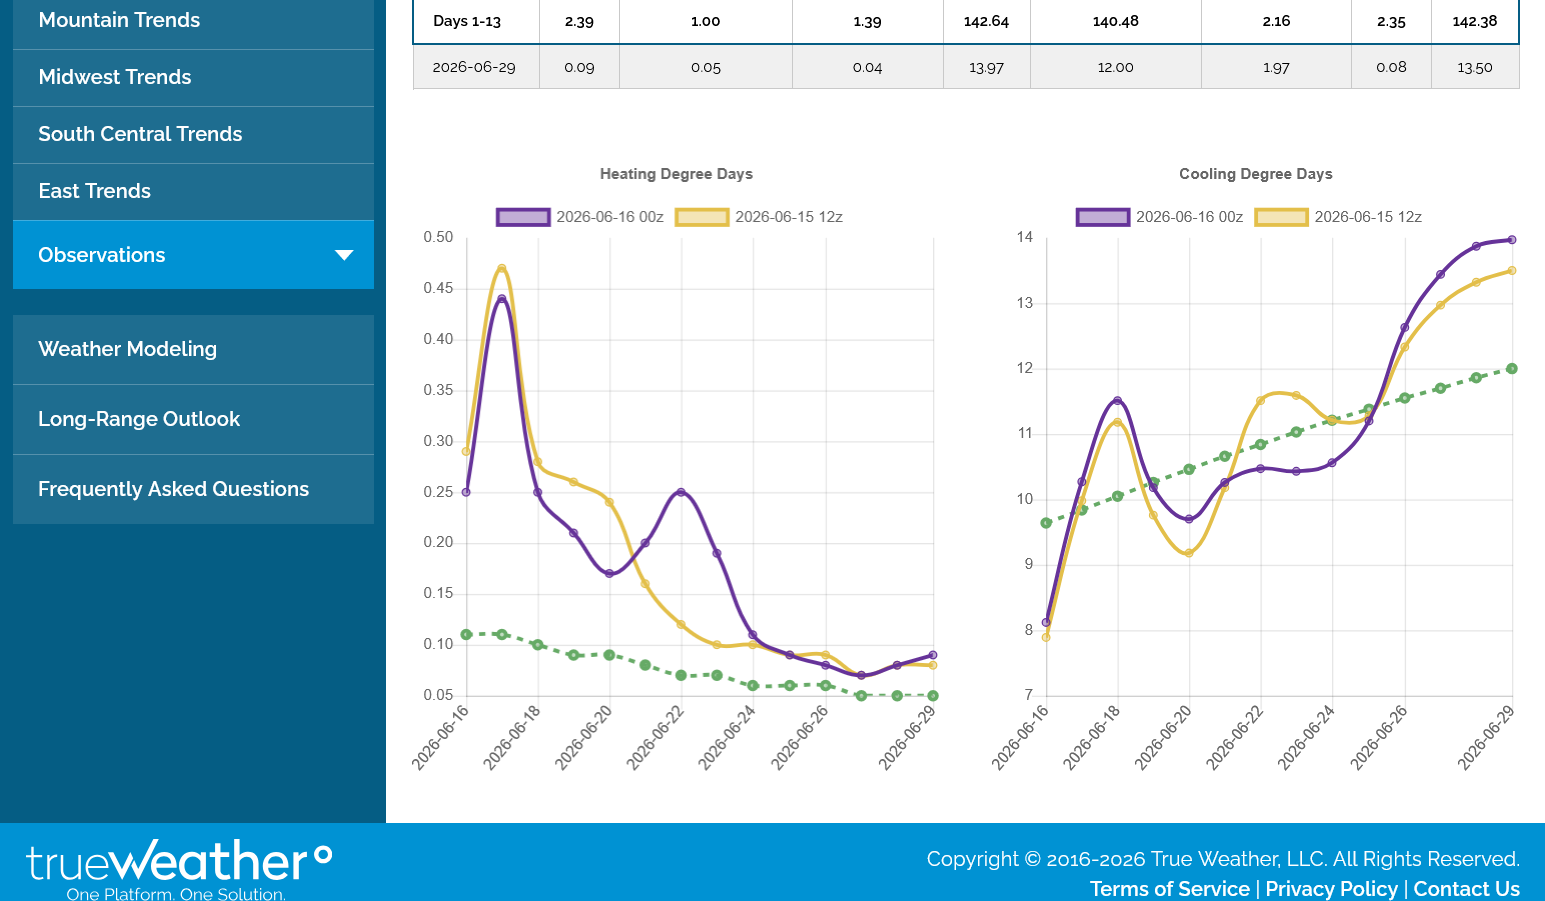
Some of the latest guidance is HOTTER for late week 2 and for July!
This was the last 0z run of the EE in purple on the right.
MetMike/WX
It is my 'understanding' that the NG traders are some of THE most elite traders. They have access to private weather forecasts and employ powerful trading platforms for trade execution. That said, there must be 'more' conclusive evidence of a dome/heat building, as ng/Boil has only firmed throughout the day. Any insight?
Sorry for the delay, tjc,
Yes, NG traders, by far respond the quickest and with the greatest magnitude to changes in the temperature forecast on models.
It's turned into a self reinforcing thing. They all know how everybody else is going to respond most of the time and do the same thing in anticipation.
Like everybody in all the markets, we/they are looking at the HOT July, especially on the European Ensemble extended(45 days).
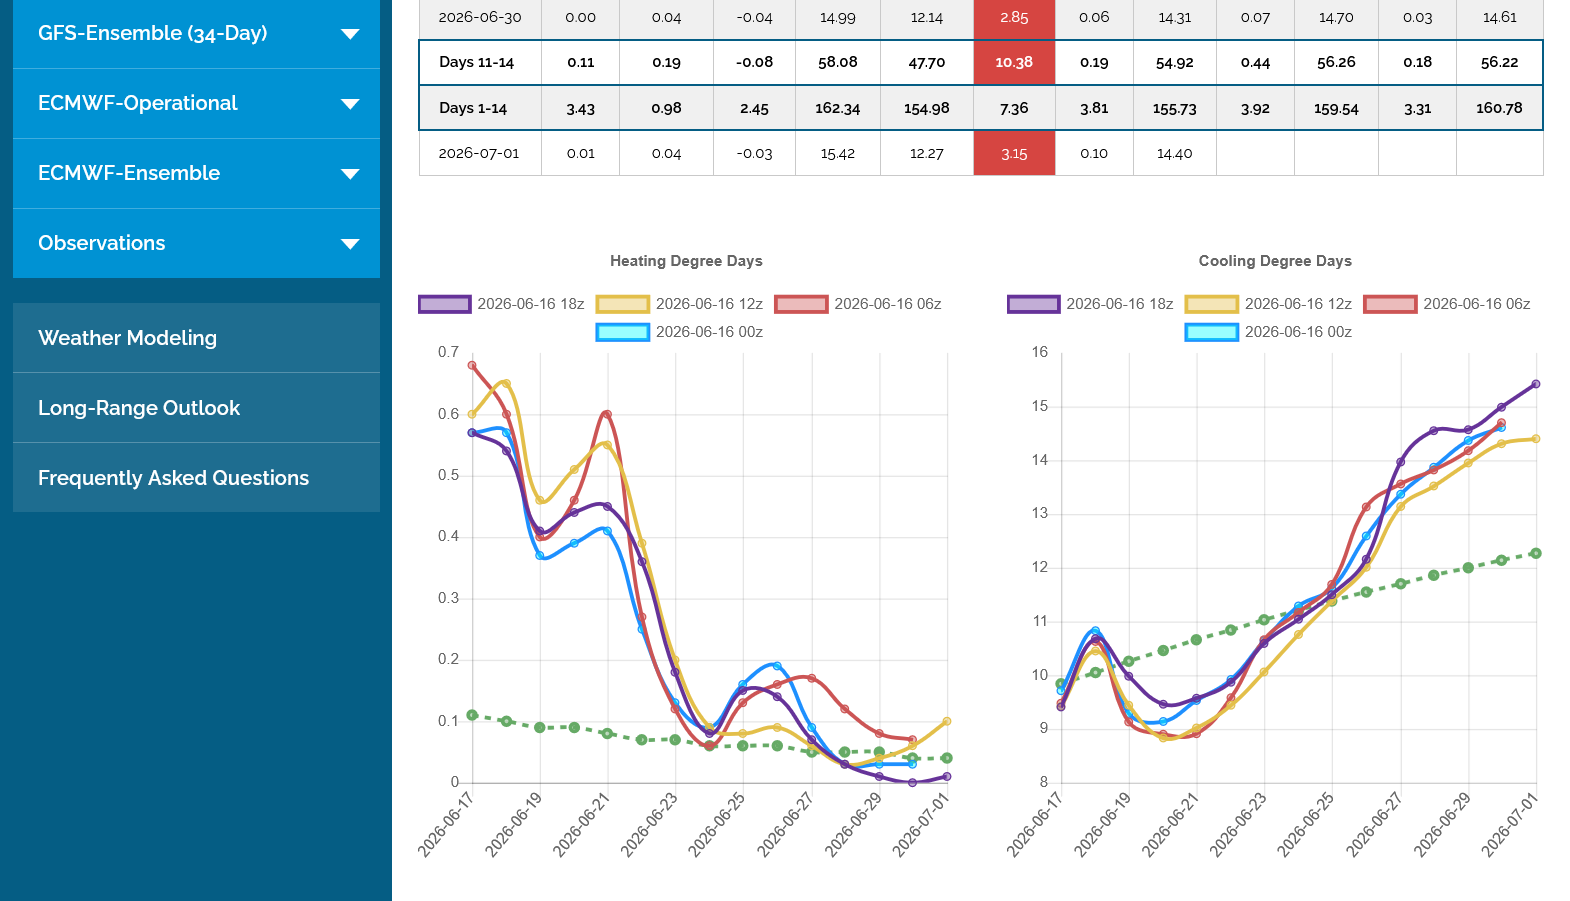
This was the last 18z GEFS in purple/right for CDDs, adding more heat. Note the trajectory upwards is much steeper than the green dashed line that represents the rapidly increasing seasonal heat during the 2nd half of June.
This model comes out 4 times a day compared to the European Ensemble that comes out just 2 times/day.
https://www.marketforum.com/forum/topic/120593/#120869
June 16: HOTTER AND DRIER in the Cornbelt for July on this model!!!


tjc,
You did a great job picking this bottom(so far) in natural gas. If the pattern change to much hotter evolves, the weather will continue potentially bullish..
The 0Z runs were actually a tad cooler but I consider this to be just run to run variation within a pattern change from cool to much HOTTER. The market is trading THE PATTERN right now.
As a result, we did have a blip down when the cooler guidance came out, then the market resumed its upward march. However, the reason to keep going higher today could be tested if the EE extended coming out in a couple of hours is less hot or delays the heat.
When the funds come in after 6am, the cooler days in the week 2 forecast could serve as selling ammo!
On the graph below, purple/right. The last 3 data points are lower but within the same week 2 pattern change. However, it's something to watch because the models have consistently delayed the return of the BIG heat in week 2 compared to their forecast in week 3. This might be a sign that the week 3+ models have too much heat.
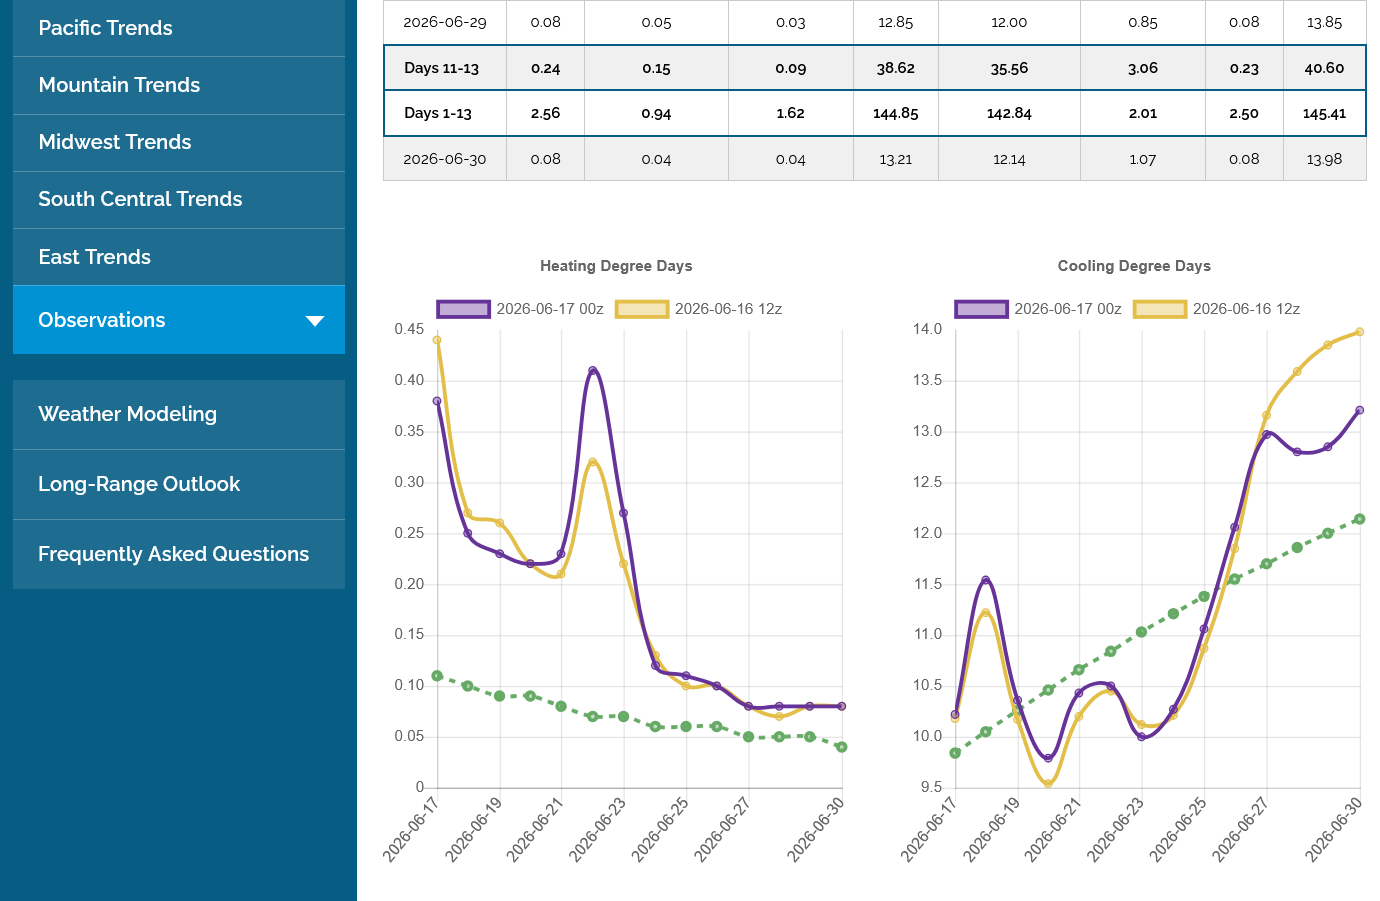
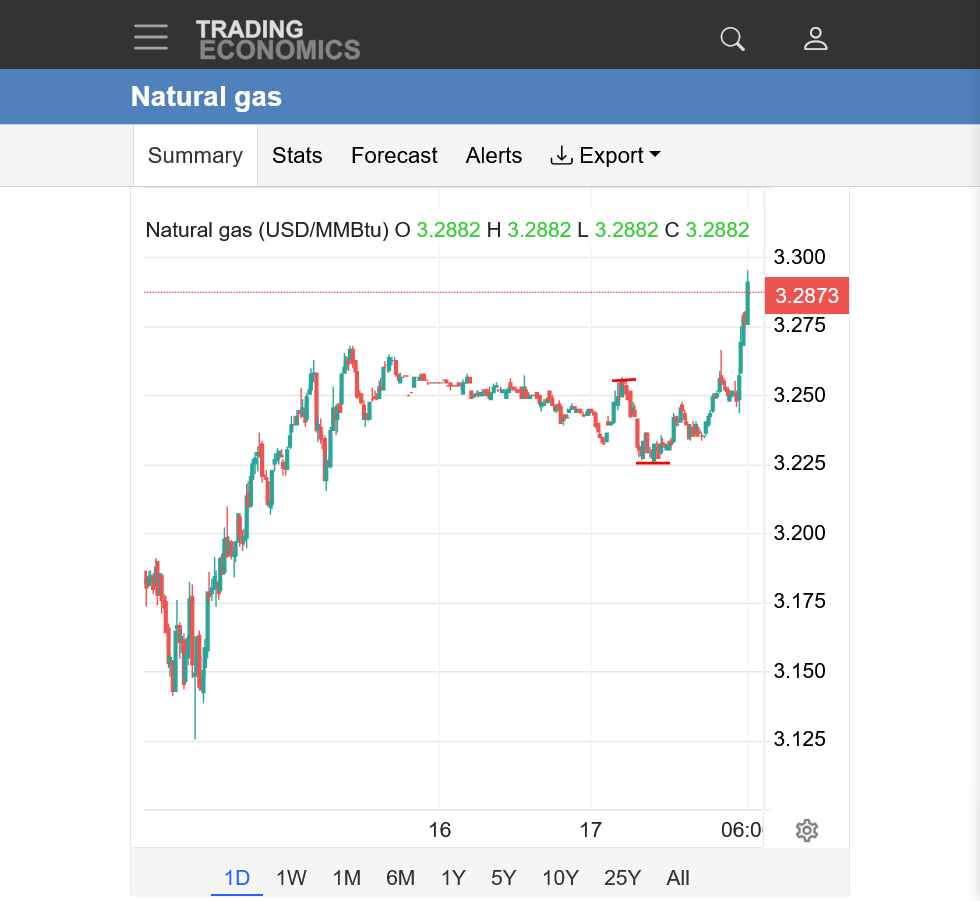
Cooler days with a similar solution came out between horizontal lines below indicating a brief drop in prices from some minor selling pressure.
https://tradingeconomics.com/commodity/natural-gas
++++++++
Sure enough, shortly after the funds came in after 6am, they decided to sell, likely from the cooler days on the overnight forecasts.
This includes the last 2 GEFS runs.
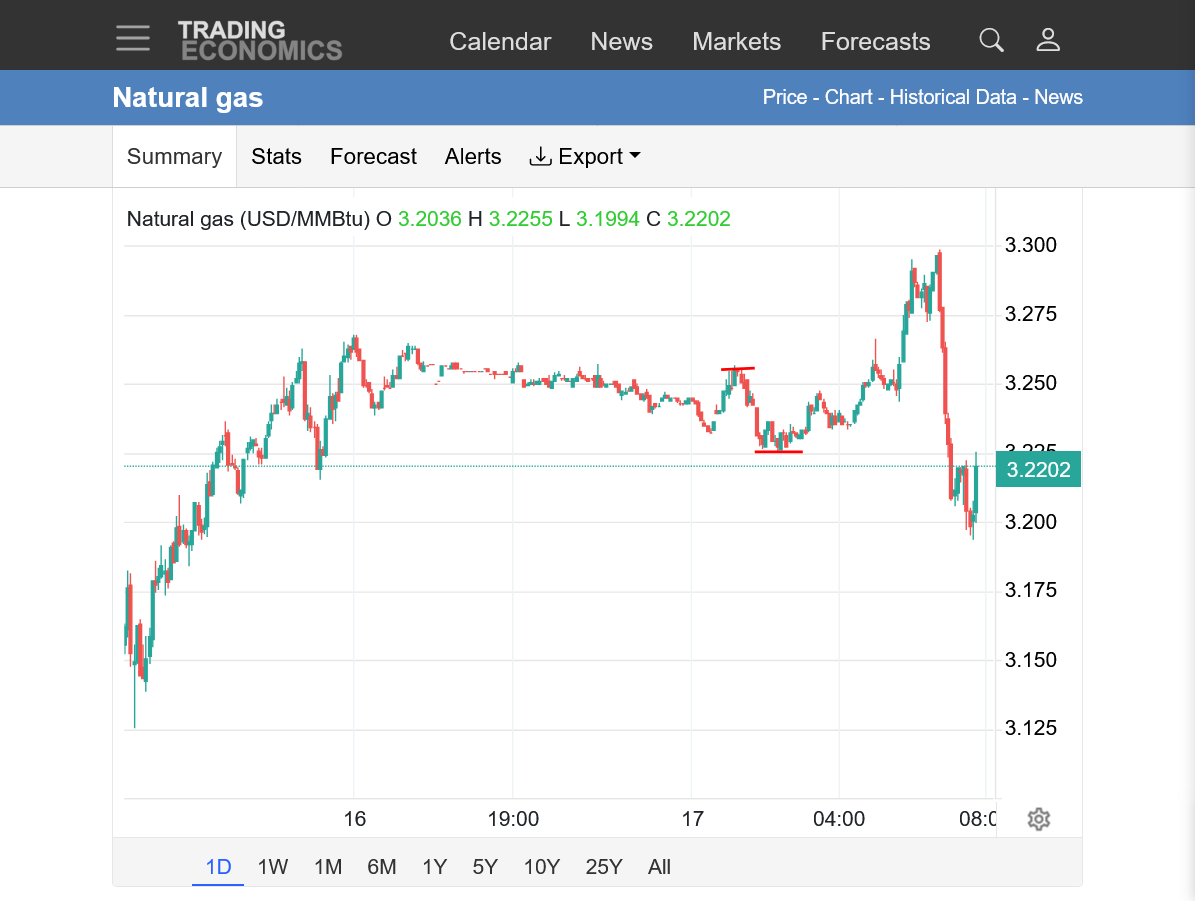
Added on 'dip'.
Thanks, tjc!
The same thing mentioned in this post goes for natural gas too.
Re: Re: Re: Re: Re: GRAINS June 14,
By metmike - June 17, 2026, 11:23 a.m.
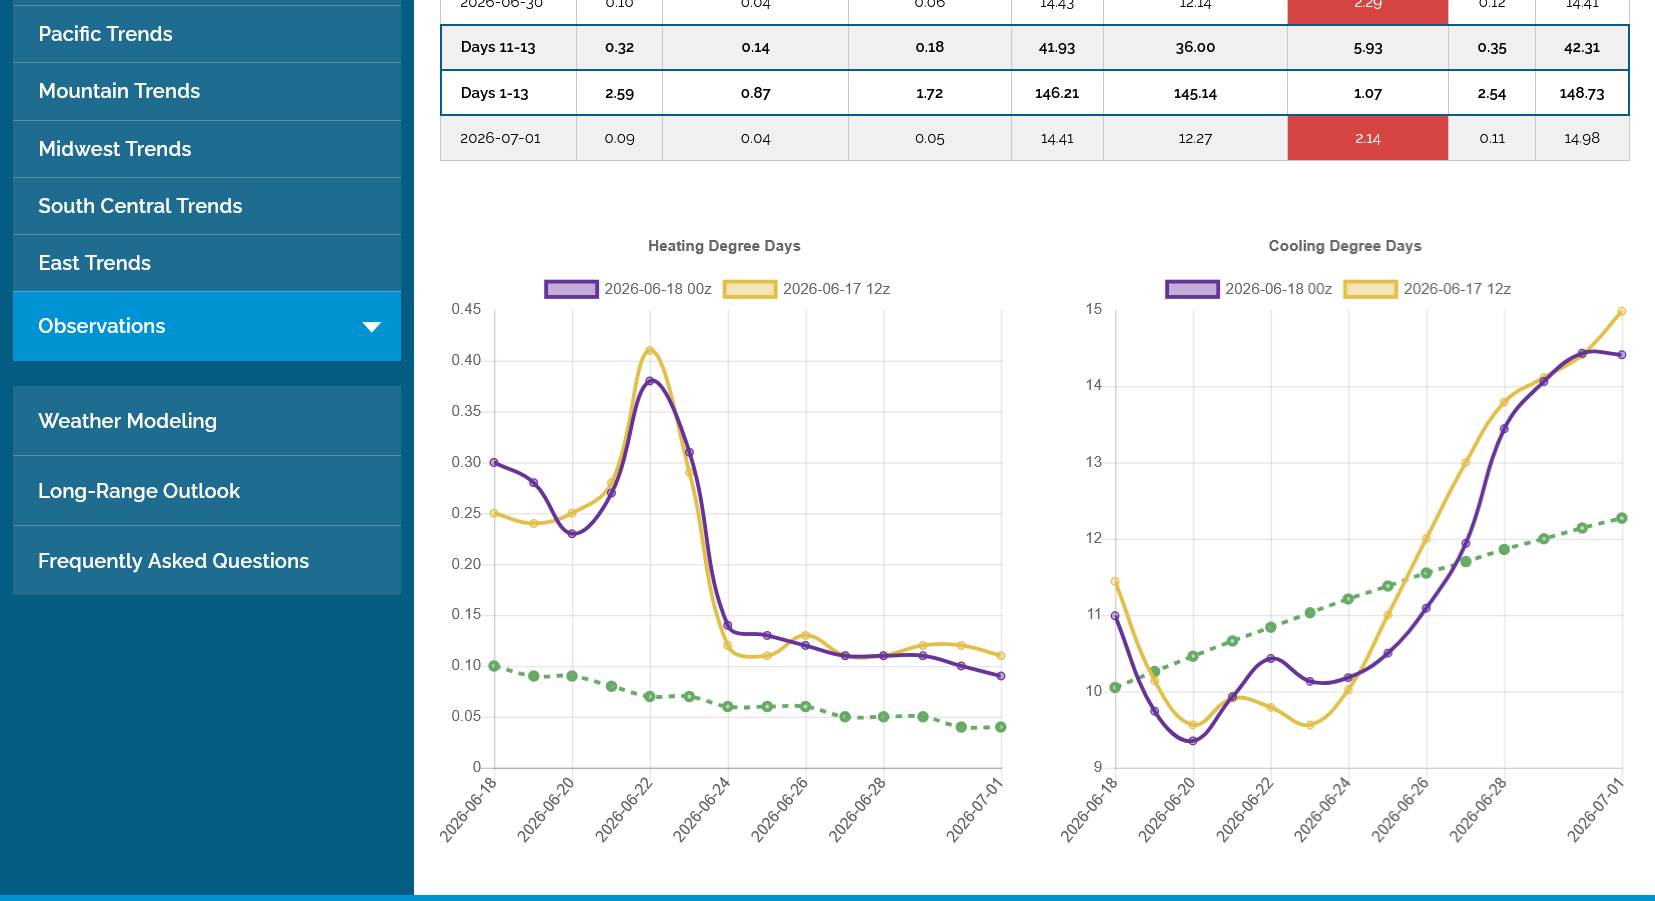
The models over the last 10 days have been TOO hot and have started the heat too soon. A month ago, the really hot Summer was supposed to be here right now, for instance. It keeps getting delayed by a day. Then another day. Then another day as the models get fresher data and correct for their previous too hot bias.
I think they will be right in the end but maybe not.
If we keep taking away heat from the forecast the rest of this week, this correction will not be a correction. It's a resumption of the downtrend after the top.
This last 0z EE Model (purple/right for CDDs) continued the trend of cooling individual days but keeping the same hot trajectory up slope which is the expected much hotter pattern change in July.
With an extra day of being closed for the Juneteenth holiday tomorrow, there is a great deal of added risk because of the potential pattern change in week 2.
The ending part of the week 2 forecast usually changes the most. With 3 additional days of potential changes for that period, if they are all in the same direction (cooler or hotter) it's the recipe for a gap higher or lower on Sunday Night.
Considering the upward trajectory of the CDD's right now, the gap higher has an edge but it's Thursday.
On Sunday, the market won't care about old weather forecasts, especially 3 day old weather forecasts!!!
Good morning
I 'noticed' the flurry of trading shortly after 7est. Rather hectic and NOT one direction. Reaction kinda positive, but sure was evidence of 'get me out of longs' also. The "magical" three day weekends.
Note: Futures WILL trade tonight, normal opening with 1est close; not boil (or at least I dont think so).
What time might be the 'last' major weather trading period? TY
Here at 11:06, big surge in ng/boil. "Must" be weather report?
Thanks, cutworm!
tjc,
The EIA natural gas weekly storage report is released on Thursday's at 9:30 am and trading usually gets volatile just before and especially after when the number is a surprise. It was a bullish surprise this time.
Coming after last week's massive injection and BIG bearish surprise.
https://www.investing.com/economic-calendar/natural-gas-storage-386
Latest Release Jun 18, 2026
Actual 73.00B
Forecast 82.00B
Previous 108.00B
++++++++++
for week ending June 12, 2026 | Released: June 18, 2026 at 10:30 a.m. | Next Release: June 25, 2026
| Working gas in underground storage, Lower 48 states Summary text CSV JSN | |||||||||||||||||||||||||
|---|---|---|---|---|---|---|---|---|---|---|---|---|---|---|---|---|---|---|---|---|---|---|---|---|---|
| Historical Comparisons | |||||||||||||||||||||||||
| Stocks billion cubic feet (Bcf) | Year ago (06/12/25) | 5-year average (2021-25) | |||||||||||||||||||||||
| Region | 06/12/26 | 06/05/26 | net change | implied flow | Bcf | % change | Bcf | % change | |||||||||||||||||
| East | 532 | 514 | 18 | 18 | 558 | -4.7 | 529 | 0.6 | |||||||||||||||||
| Midwest | 638 | 610 | 28 | 28 | 634 | 0.6 | 614 | 3.9 | |||||||||||||||||
| Mountain | 226 | 222 | 4 | 4 | 215 | 5.1 | 177 | 27.7 | |||||||||||||||||
| Pacific | 309 | 304 | 5 | 5 | 273 | 13.2 | 239 | 29.3 | |||||||||||||||||
| South Central | 1,053 | 1,037 | 16 | 16 | 1,108 | -5.0 | 1,050 | 0.3 | |||||||||||||||||
| Salt | 325 | 322 | 3 | 3 | 350 | -7.1 | 312 | 4.2 | |||||||||||||||||
| Nonsalt | 728 | 715 | 13 | 13 | 758 | -4.0 | 737 | -1.2 | |||||||||||||||||
| Total | 2,759 | 2,686 | 73 | 73 | 2,788 | -1.0 | 2,608 | 5.8 | |||||||||||||||||
| Totals may not equal sum of components because of independent rounding. | |||||||||||||||||||||||||
Working gas in storage was 2,759 Bcf as of Friday, June 12, 2026, according to EIA estimates. This represents a net increase of 73 Bcf from the previous week. Stocks were 29 Bcf less than last year at this time and 151 Bcf above the five-year average of 2,608 Bcf. At 2,759 Bcf, total working gas is within the five-year historical range.
For information on sampling error in this report, see Estimated Measures of Sampling Variability table below.
Note: The shaded area indicates the range between the historical minimum and maximum values for the weekly series from 2021 through 2025. The dashed vertical lines indicate current and year-ago weekly periods.
++++++++
I predicted that it would be more BULLISH this time (on Sunday) but apparently the market was not anticipating it to be THIS bullish.
https://www.marketforum.com/forum/topic/120595/#120807
By metmike - June 14, 2026, 6:25 a.m.
+++++++++++++=
There's little doubt that was the main factor for us to break out to new daily highs after the release of that data.
https://tradingeconomics.com/commodity/natural-gas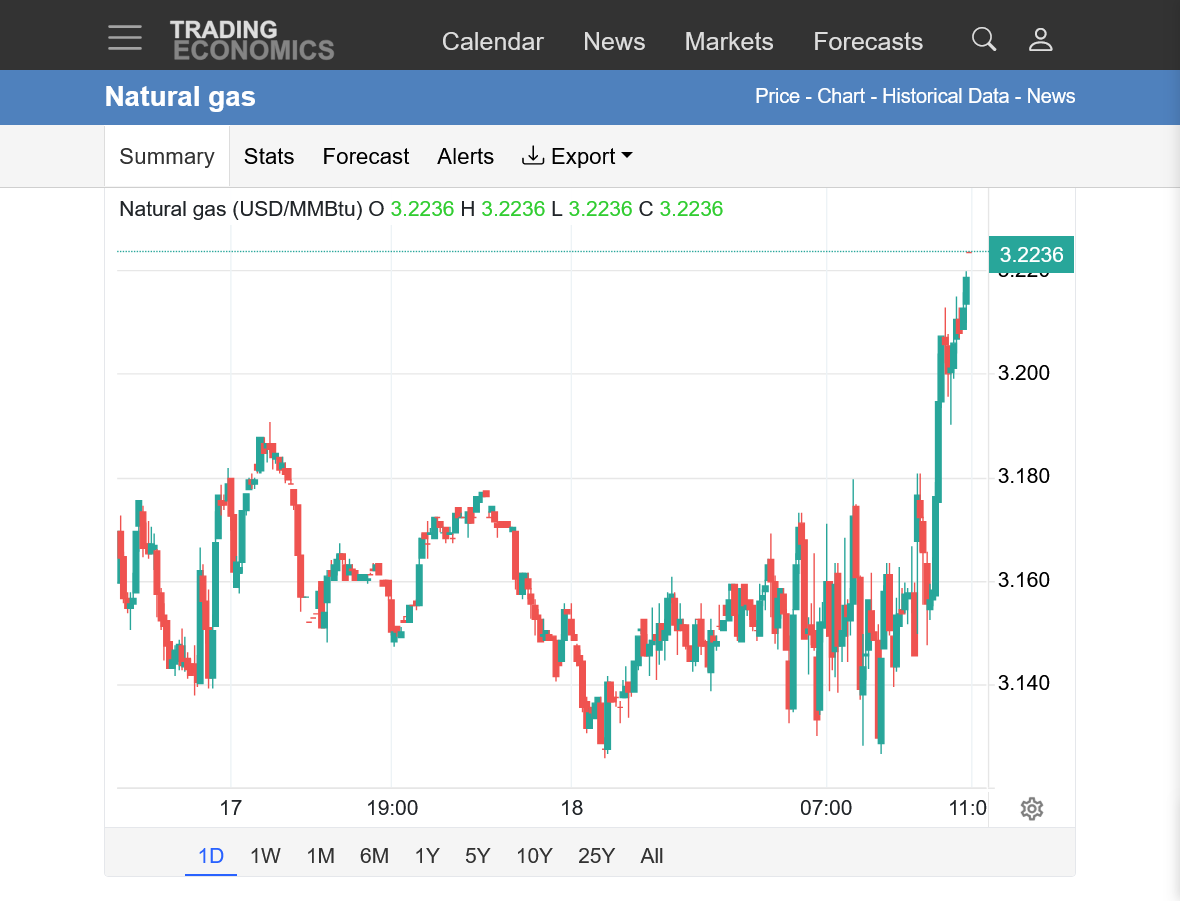
In addition, the July forecast from this last EE model was a bit HOTTER! It now goes out to the first couple of days in August. Not helping the grains much today. Probably because there's too much rain the next 2 weeks BEFORE the ridge builds in and the ridge has been forecast for many weeks and keeps getting pushed back. And the GEFS for July is not as bullish. And it take MAJOR adversity to rally grains in July.
Do note the location of this heat. Heat in the East and South is the MOST bullish for natural gas where people grow(live). Heat in the center of the country is where crops grow(live) and would be the most bullish for crops.
If this actually happens, the rains will eventually dry up and it WILL be bullish grains. This forecast can change a great deal in 3 days.
European Ensemble 500 mb map day 46. Week 6 temps(7 days) + Rain anomaly days 16-46(weeks 3-4-5-6)


With regards to the price gyrations that start around 7am EDT(6am CDT) most days. That's the big funds entering the session. They will often have completely different ideas than the overnight crowd.
The last 12z EE model shaved off another 2 CDDs in purple on the left from cooler individual days.
However, note the upward trajectory which is what matters the most in a major pattern change. Not model to model, individual days in the same pattern change.
However, the models have had a HOT bias the last few weeks and they will often update with more cooler days than hotter days.......even as the Heat slowly gets closer.
Small gap higher on the open that has held!
The purple line on the right was the last 12z European Ensemble model run for CDDs which was almost the same as the previous one 12 hours earlier. The dashed green line is the slowly warming average that will peak in mid-Jully.
Lots of week 2 heat on the way!!
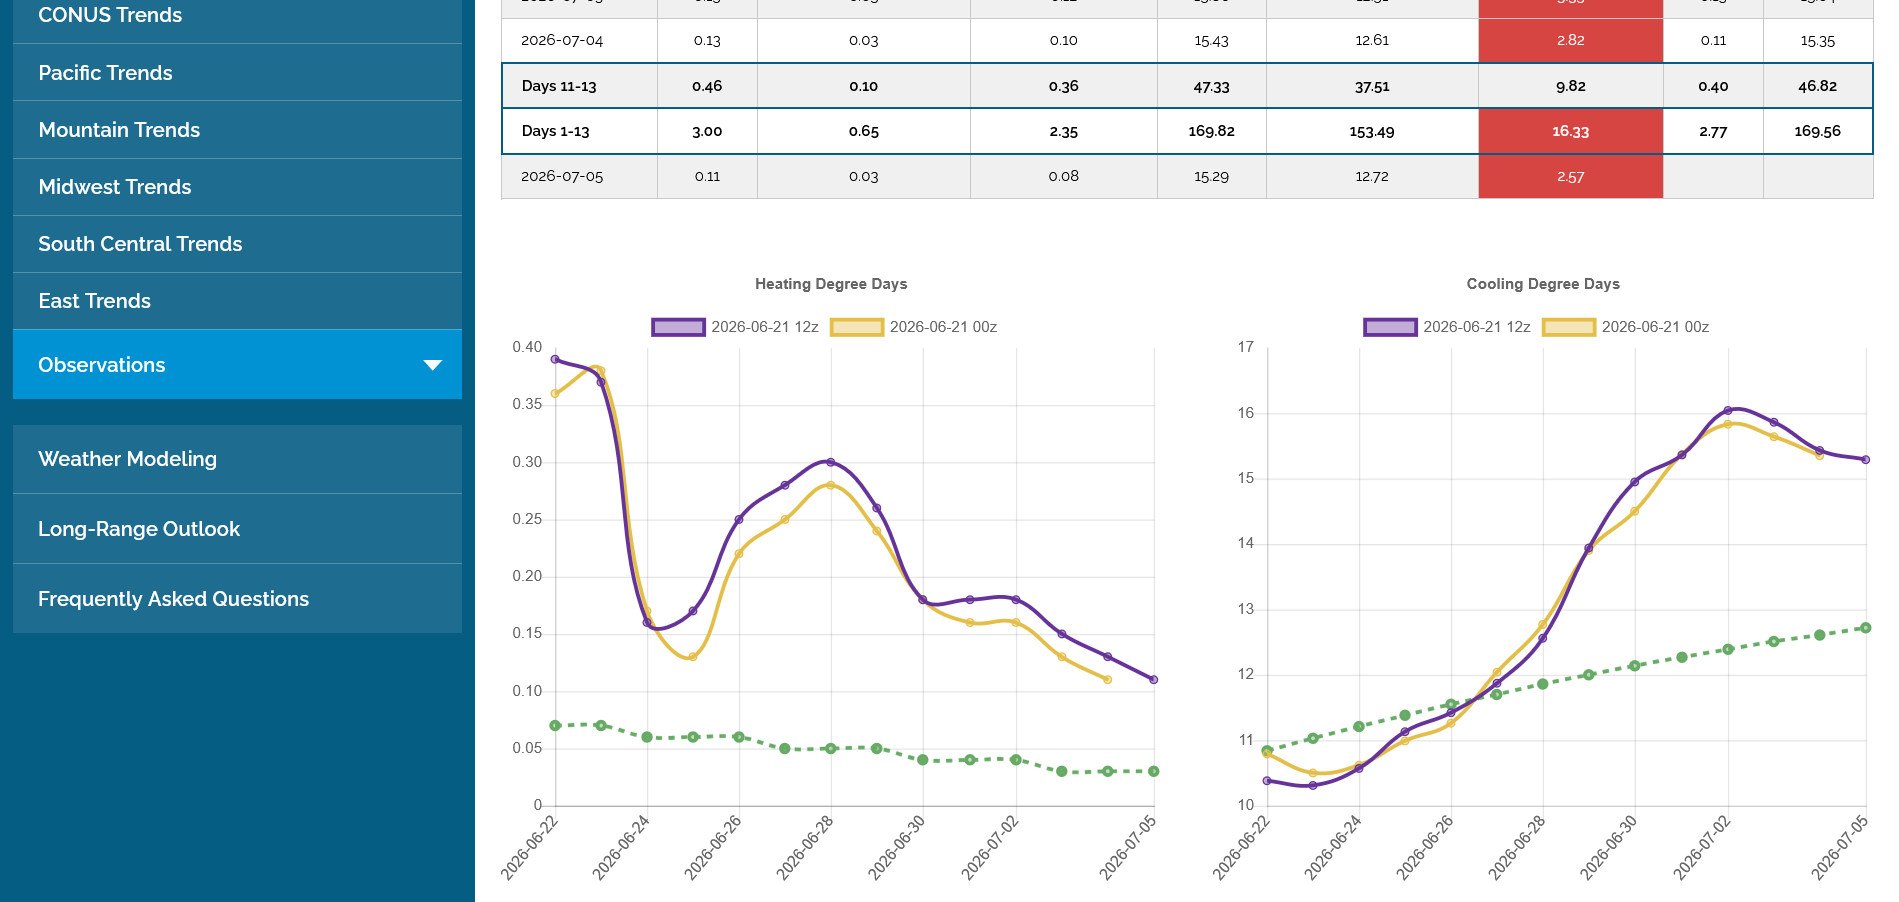
After the price peaked around 3:30am, the price was under pressure for the rest of the session. Eventually closing the bullish gap higher and finishing near unchanged.
So the technical formation becomes a gap and crap buying exhaustion.
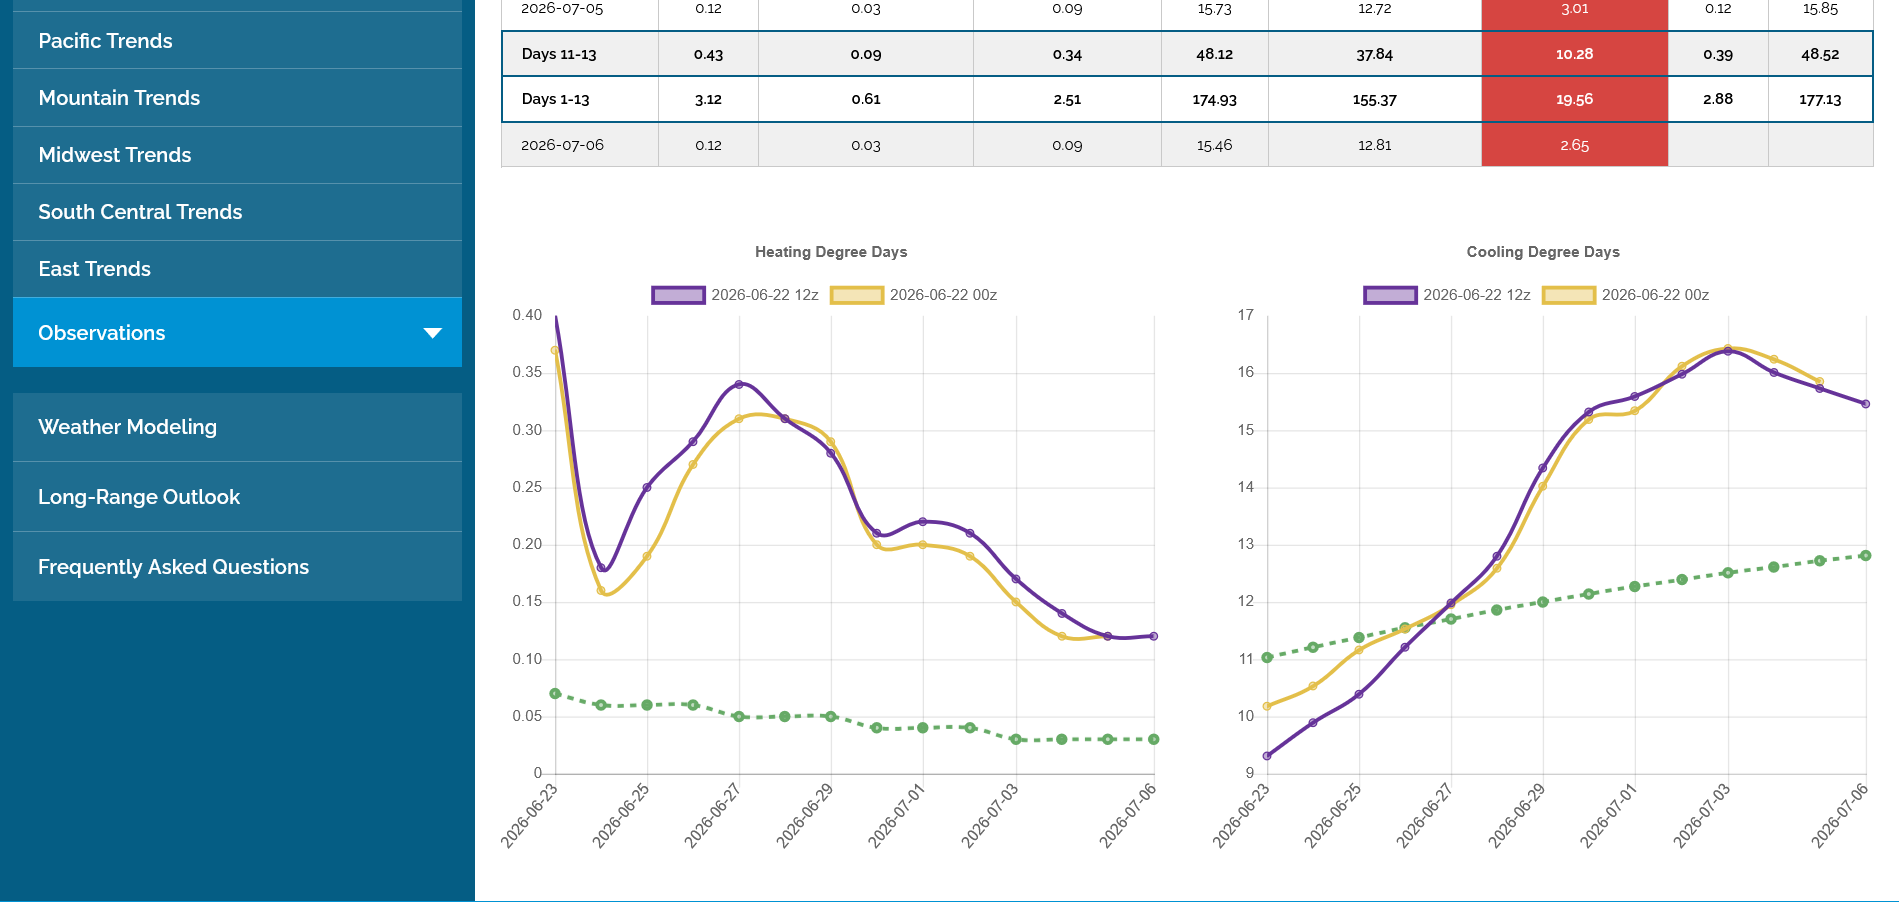
This last 12z EE in purple on the right was -2 CDDs/bearish compared to the previous run 12 hours earlier which added to the selling pressure. The 12z GEFS that came out a couple hours earlier was -3 CDDs.
Regardless, the pattern in week 2 will feature MUCH MORE heat and that is likely to define the month of July.
https://tradingeconomics.com/commodity/natural-gas
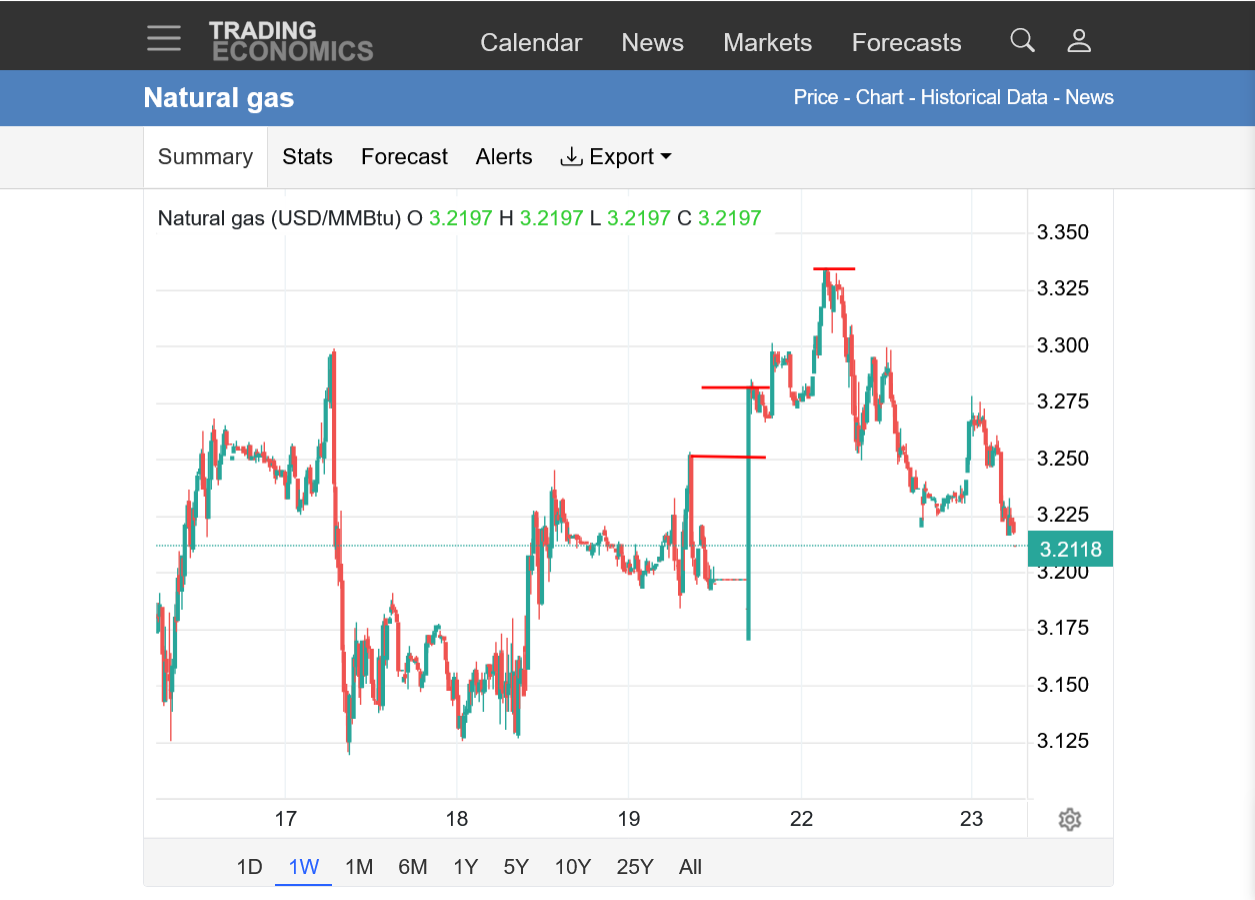
1, 1 week: The long green up bar is an error! Gap higher on Sunday night. Potential upside break away gap from upcoming heat in July THAT FAILED! Top at 3:30 am Monday morning. Filled the gap during Monday's trade, partly from less heat in the weather forecast, turning the gap into a buying exhaustion (gap and crap) formation, suggestion that the current big heat is already dialed into the price. Currently on the weekly lows.
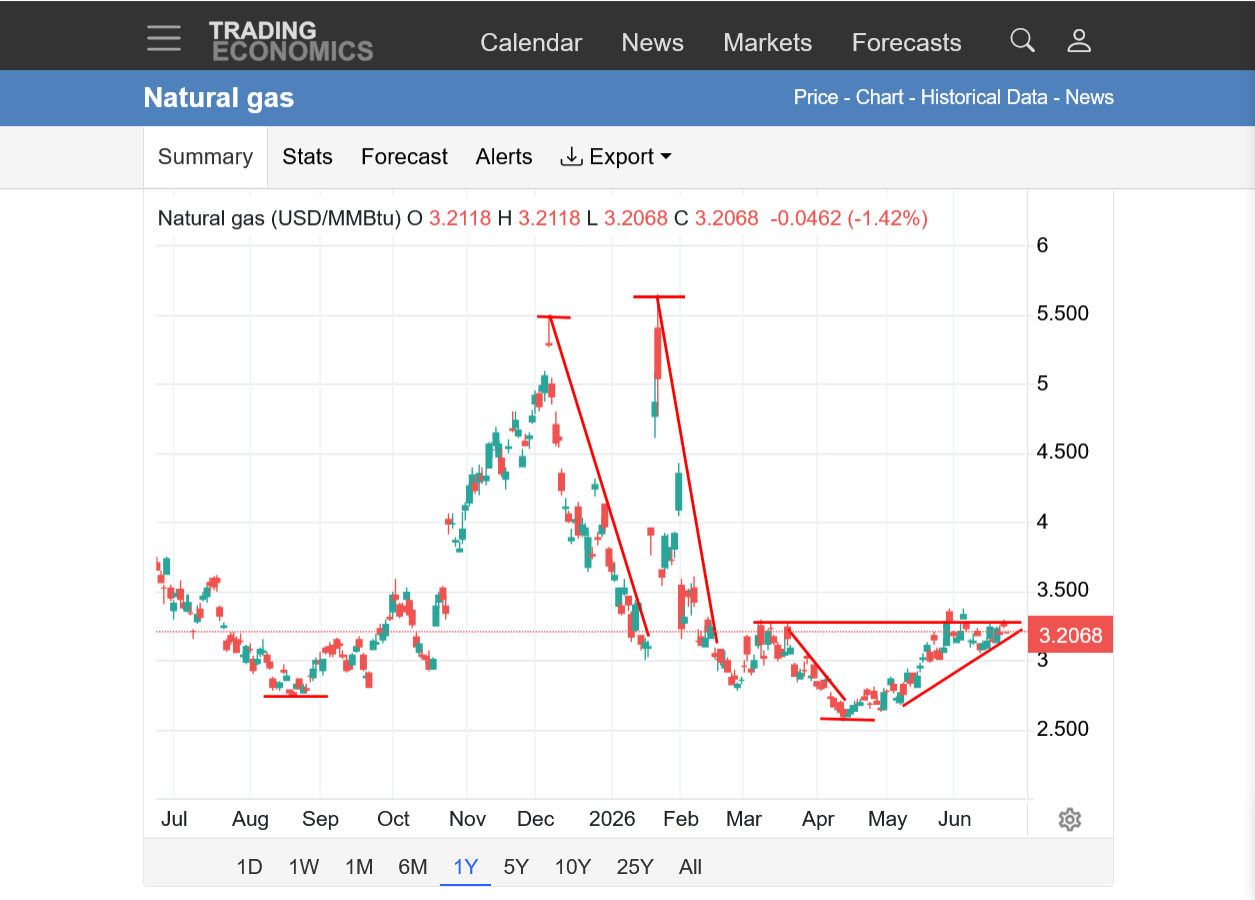
2. 1 year: Extreme cold weather spikes up and down during the HDD season(residential heating in Winter is by far the biggest demand variable for ng). Sustained trend lower in March from a very mild/bearish end to the HDD season, resulting in a LATE, reliable seasonal low in April. Uptrend line since then is still intact but being challenged with potential resistance holding here from the above gap and crap rejection of the bulls. Also a potential ascending triangle/wedge signature with a break out in either direction determining price direction. Uncertainty with big heat in July being bullish but long in the tooth, with a small down seasonal during the 2nd half of June.
A huge change in CDDs this week would likely determine direction.
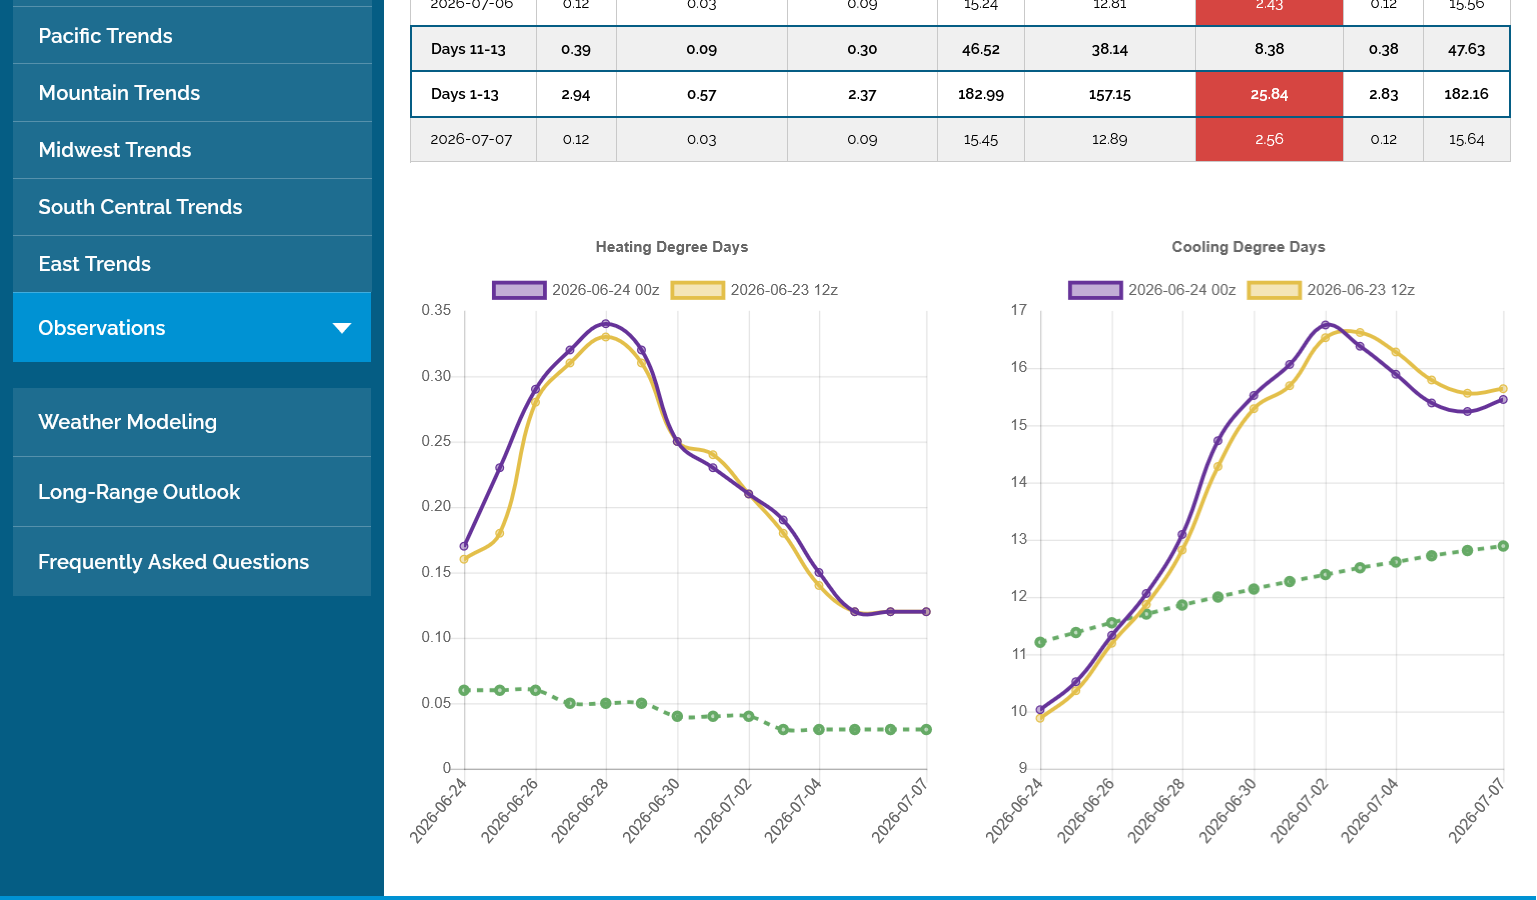
The last European Ensemble model for CDDs in purple/right had the same total even though individual days had changes(a bit hotter, then not quite as hot).
Turning HOT next week, then the heat dome shifts to the Plains, where it could turn very bullish for the C and S market.
+++++++++++++++
1. Day 8 below for 500 mb.
2. Day 14 below


Latest July forecast from the last European Ensemble model updated this morning.


++++++++++++
Temperatures for tomorrow's EIA storage report:
HOT West, very warm entire East Coast, very cool Midwest to offset some of that.
https://www.cpc.ncep.noaa.gov/products/tanal/temp_analyses.php

As cutworm mentioned last week, NG seasonals are a bit bearish during the 2nd half of June but this isn't the most powerful seasonal of the year. This upcoming heat could cause counter seasonal price action. However, this intense heat has been traded for a while too.
EIA reaction was a bearish, very brief spike down, then back higher on the upcoming bullish heat getting closer.
for week ending June 19, 2026 | Released: June 25, 2026 at 10:30 a.m. | Next Release: July 2, 2026
| Working gas in underground storage, Lower 48 states Summary text CSV JSN | |||||||||||||||||||||||||
|---|---|---|---|---|---|---|---|---|---|---|---|---|---|---|---|---|---|---|---|---|---|---|---|---|---|
| Historical Comparisons | |||||||||||||||||||||||||
| Stocks billion cubic feet (Bcf) | Year ago (06/19/25) | 5-year average (2021-25) | |||||||||||||||||||||||
| Region | 06/19/26 | 06/12/26 | net change | implied flow | Bcf | % change | Bcf | % change | |||||||||||||||||
| East | 558 | 532 | 26 | 26 | 585 | -4.6 | 553 | 0.9 | |||||||||||||||||
| Midwest | 672 | 638 | 34 | 34 | 661 | 1.7 | 639 | 5.2 | |||||||||||||||||
| Mountain | 227 | 226 | 1 | 1 | 222 | 2.3 | 183 | 24.0 | |||||||||||||||||
| Pacific | 312 | 309 | 3 | 3 | 280 | 11.4 | 246 | 26.8 | |||||||||||||||||
| South Central | 1,066 | 1,053 | 13 | 13 | 1,136 | -6.2 | 1,062 | 0.4 | |||||||||||||||||
| Salt | 325 | 325 | 0 | 0 | 352 | -7.7 | 312 | 4.2 | |||||||||||||||||
| Nonsalt | 741 | 728 | 13 | 13 | 784 | -5.5 | 750 | -1.2 | |||||||||||||||||
| Total | 2,835 | 2,759 | 76 | 76 | 2,884 | -1.7 | 2,683 | 5.7 | |||||||||||||||||
| Totals may not equal sum of components because of independent rounding. | |||||||||||||||||||||||||
Working gas in storage was 2,835 Bcf as of Friday, June 19, 2026, according to EIA estimates. This represents a net increase of 76 Bcf from the previous week. Stocks were 49 Bcf less than last year at this time and 152 Bcf above the five-year average of 2,683 Bcf. At 2,835 Bcf, total working gas is within the five-year historical range.
For information on sampling error in this report, see Estimated Measures of Sampling Variability table below.
Note: The shaded area indicates the range between the historical minimum and maximum values for the weekly series from 2021 through 2025. The dashed vertical lines indicate current and year-ago weekly periods.
+++++++++++++
The front month, July expires on Friday!
NG opened flat, and since has modestly rallied. "Better" weather forecasts for extended heat??
Thanks, tjc!
I actually forgot about the energy markets, thanks for the reminder.
This summarizes the weather coming up to some extent:
By metmike - June 28, 2026, 5:03 p.m.
+++++++++++
Major heat this week for sure but that's not changed for several days! Same forecast right now for this week.
6-25-26 MAJOR heat wave coming next week
Started by metmike - June 25, 2026, 3:49 p.m.
https://www.marketforum.com/forum/topic/121123/
Re: Re: Re: Re: Re: : 6-25-26 MAJOR heat wave coming next week
By metmike - June 28, 2026, 6:51 p.m.
++++++++++++++++=
NG is still in an uptrend but below the highs. There is nothing big from updated weather models. The overall forecast is still bullish, however to maximize the bullishness, the heat ridge should be over the east or south where more people live, instead of the Plains/Rockies.
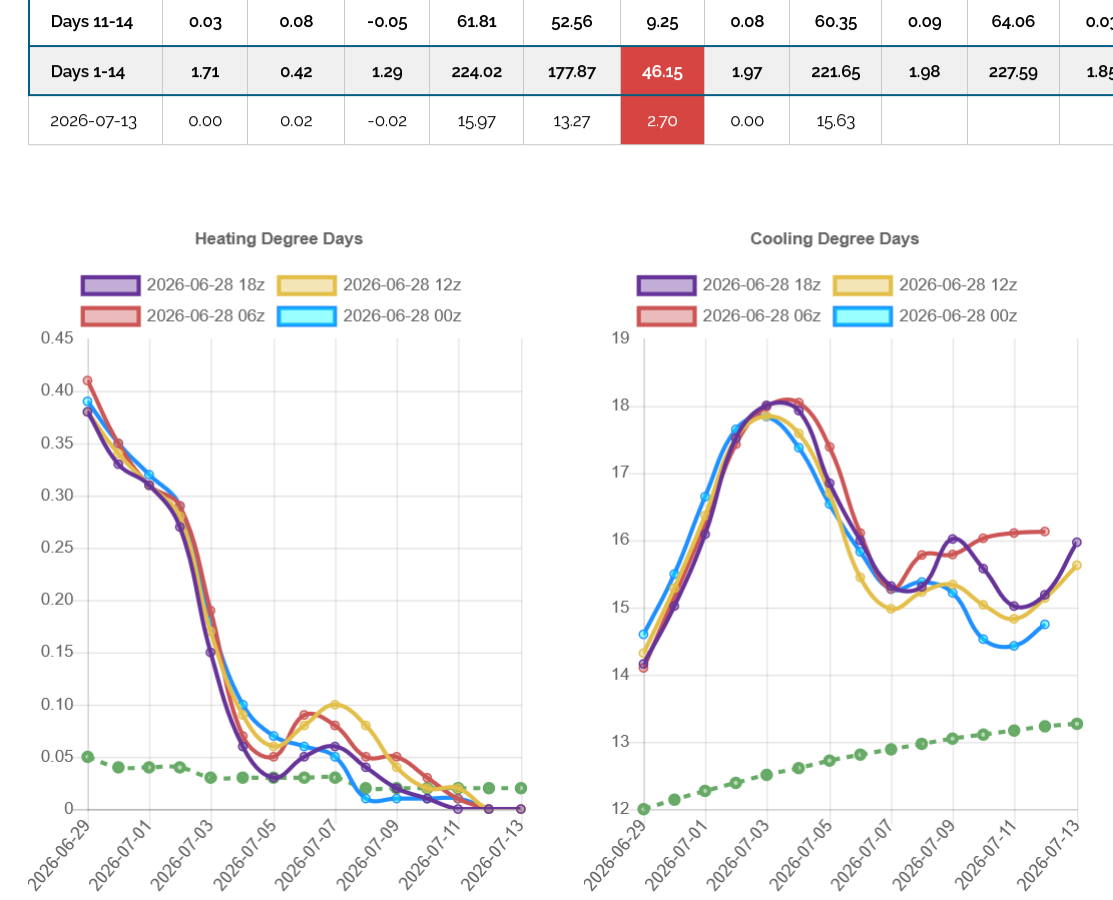
Here's the last 4 runs of the GEFS model, the last 18z run just came out in purple was 2.4 deg. F hotter with its CDDs than the previous 12z run but still -3.5 CDDs LESS hot than the run before that in red.
All the changes and uncertainty come during the last 6 days of the forecast. The heat peaks with uniform agreement late this week. Then the heat ridge shifts west in week 2, where less people live.
However, even in week 2, the CDDs are well above the slowly increasing seasonal average in green that tops out in mid-July, around a week after the end of this period shown below.
6am Sunday 6-29-26:
The overnight 0z European model was +2 CDDs(hotter) that gave us a wimpy bounce but not close to the highs. The lack of reaction indicates that the bullishness of the near term heat is all dialed in.
The changes are all for individual days. Cooler near term, hotter after that but the same trajectory and pattern as before. Again, we need the heat ridge farther east and south, where the most people live to maximize bullishness.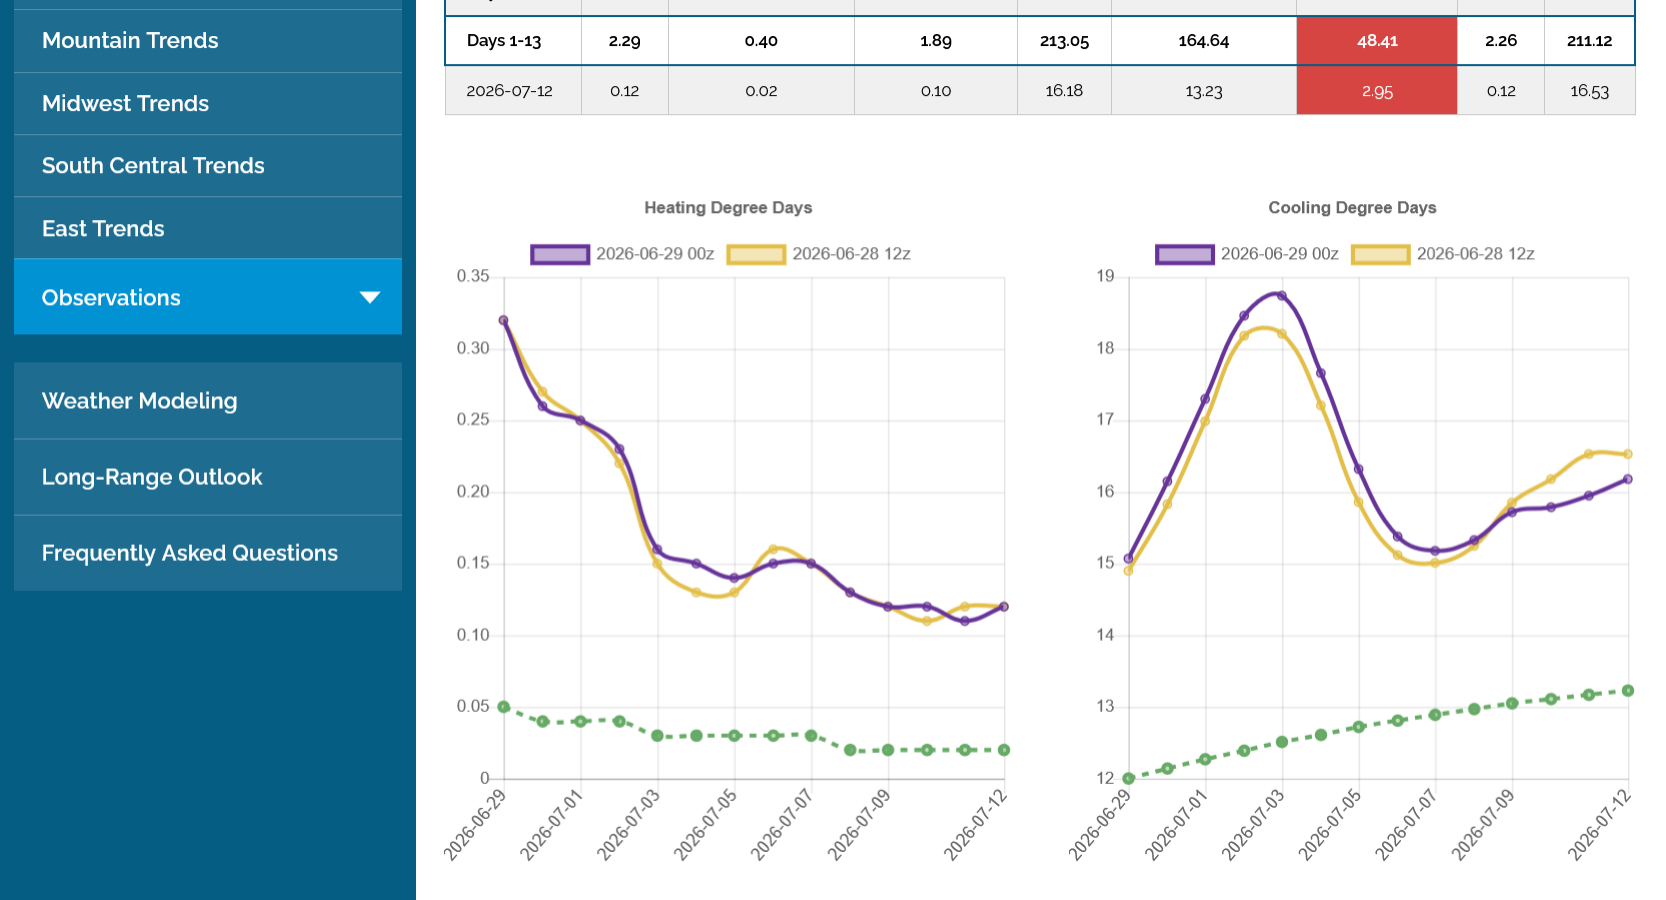
I posted the BEARISH changes from the Canadian model the past week at the grain market link below that also apply to the (LESS BULLISH) natural gas weather in week 2 because of the increasingly cooler look to the solutions during that period.
Re: Re: Re: Re: Re: GRAINS June 14,
By metmike - June 29, 2026, 4:23 p.m.
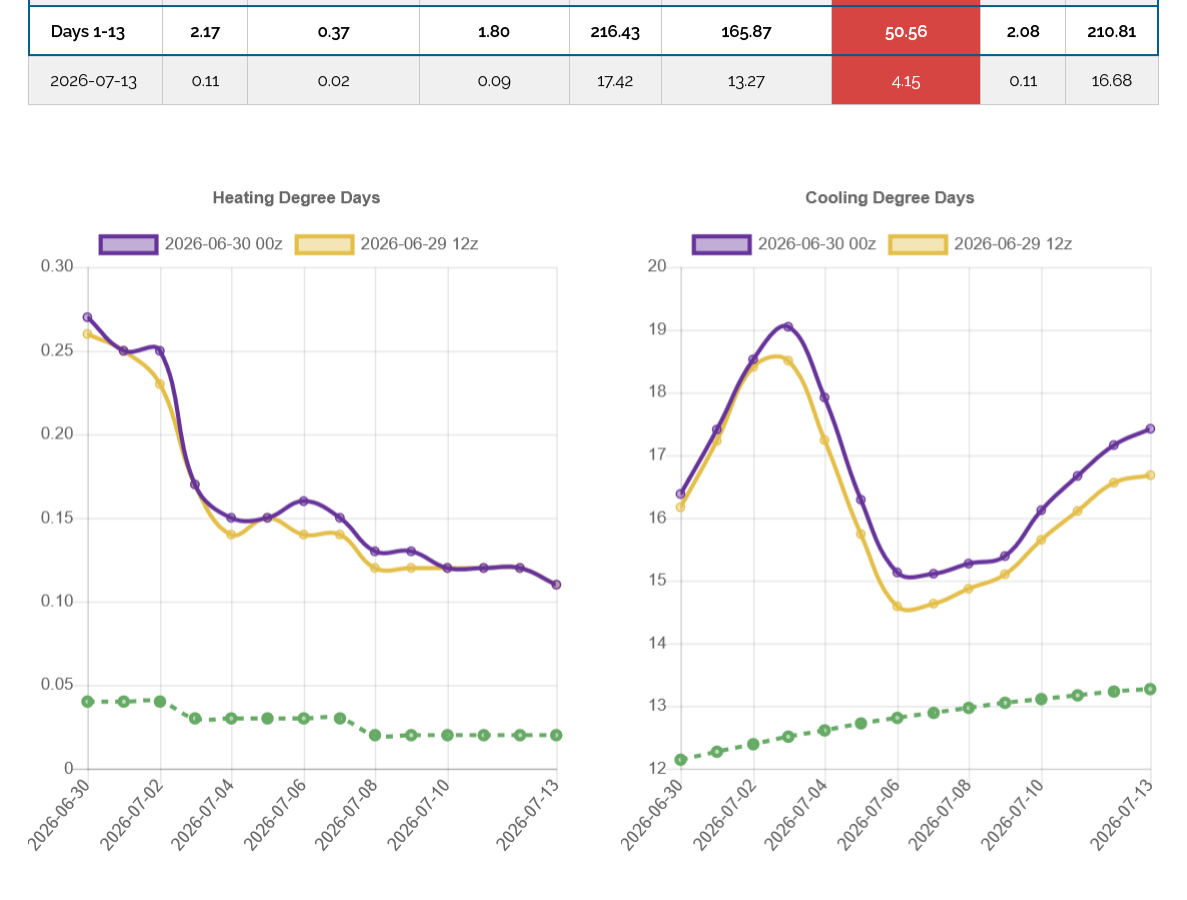
The last 0z European Ensemble model in purple/right that started coming out just before around 1:30 am this morning was a whopping +5.6 CDDs hotter than the previous run.
This added heat was spread out over the entire forecast.
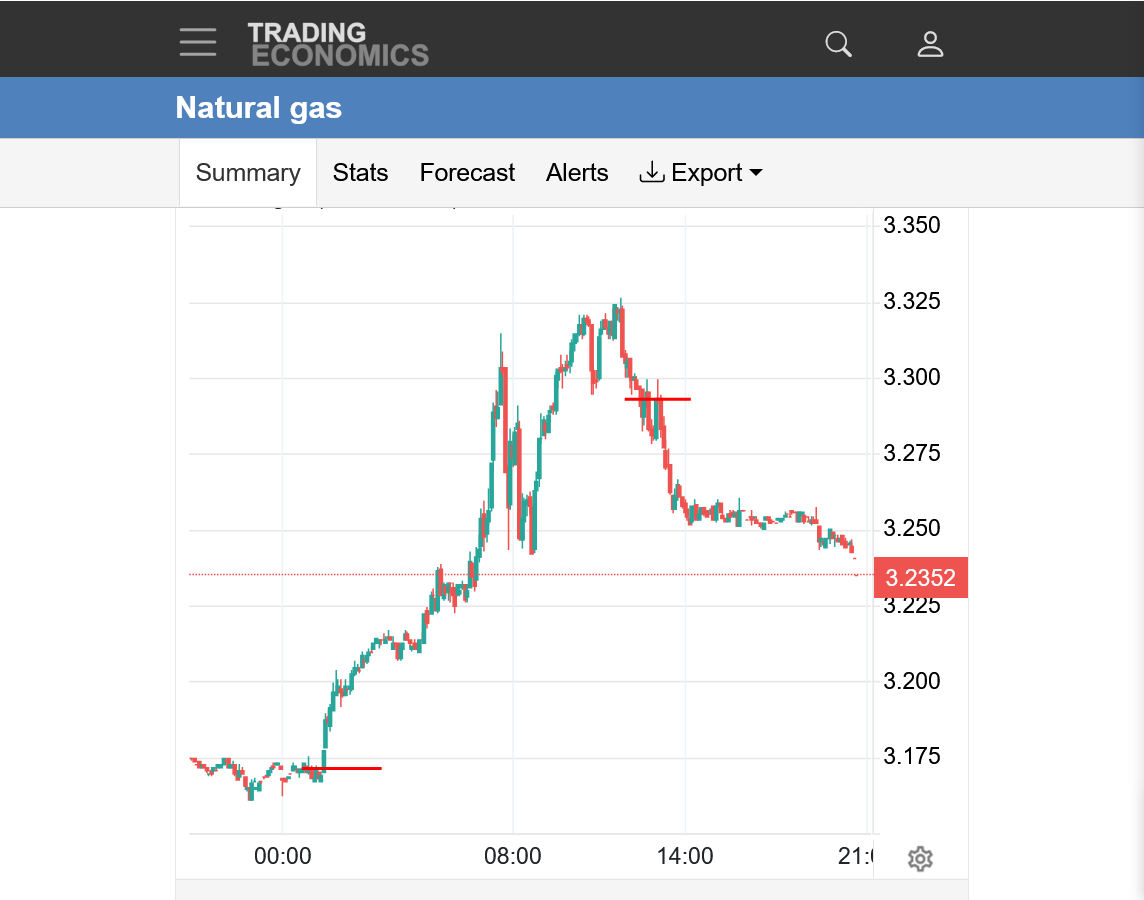
We can see on the price chart below of the last day, with the red horizontal line EXACTLY when that STARTED coming out! Prices continued higher by $1,400/contract without a correction over the following 6 hours after that.
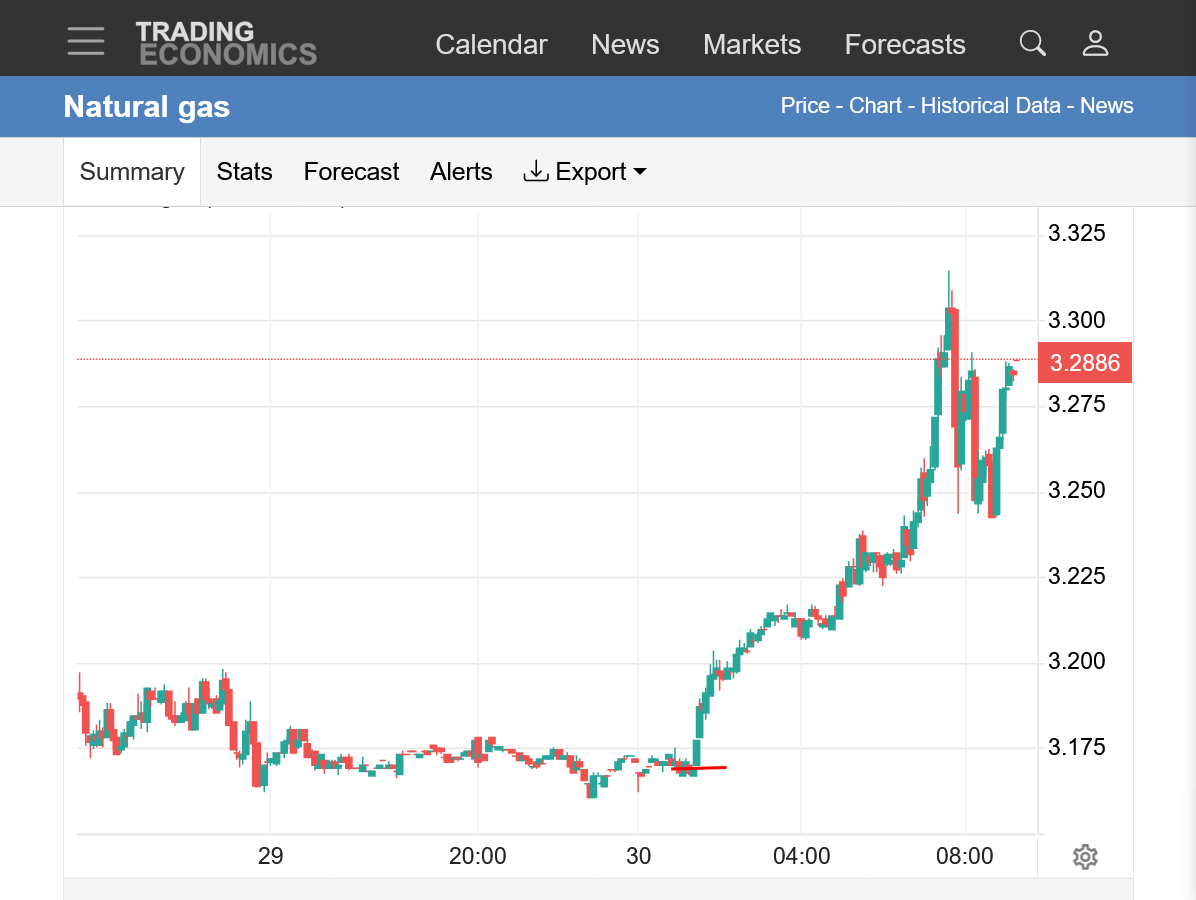
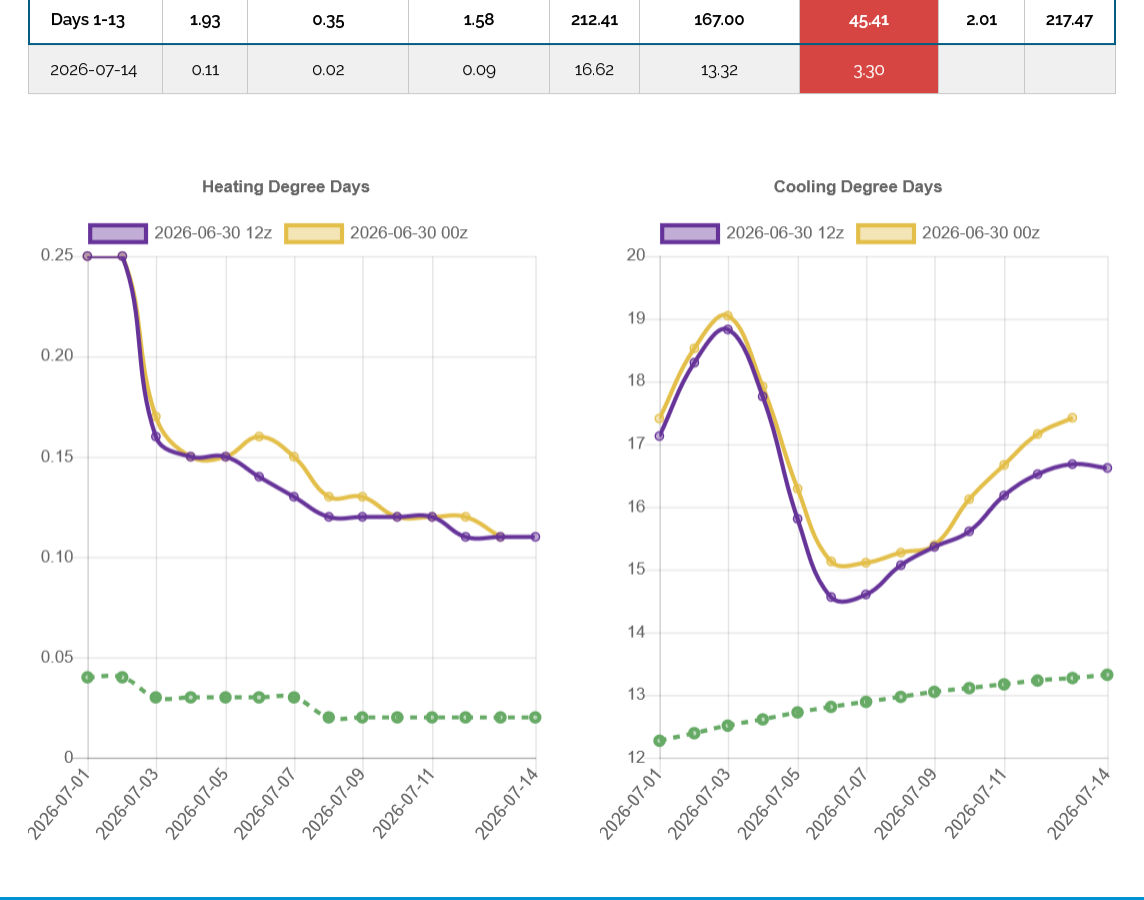
Starting late morning with the 12z GEFS (that was -6 CDDs cooler than the previous run) the guidance got cooler again and NG gave up some of the overnight gains.
This was the last 12z EE model that was -5 CDDs.
https://tradingeconomics.com/commodity/natural-gas
There's the huge overnight rally on the hotter 0z model output, marked by the 1st horizontal line. Then we've been under selling pressure since the 12z guidance(12 hours later) came out early this afternoon marked by the 2nd horizontal line.
6-30-26, 9pm:
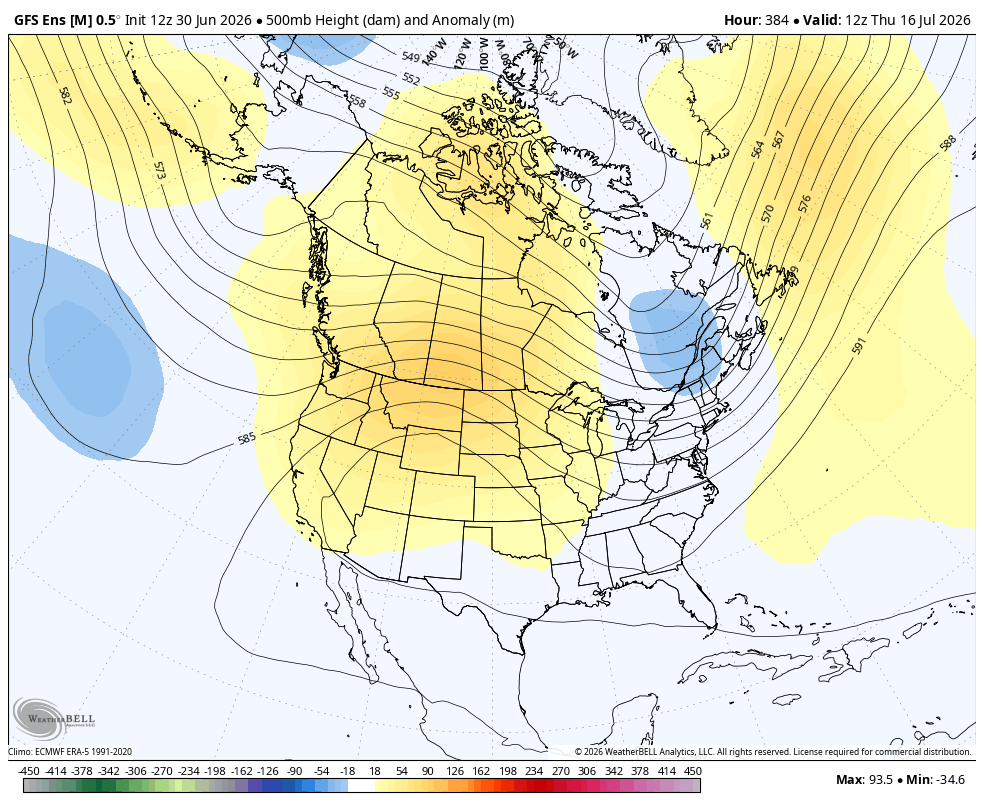
1. This was the last 500 mb map of this last 18z GEFS run on July 16th.
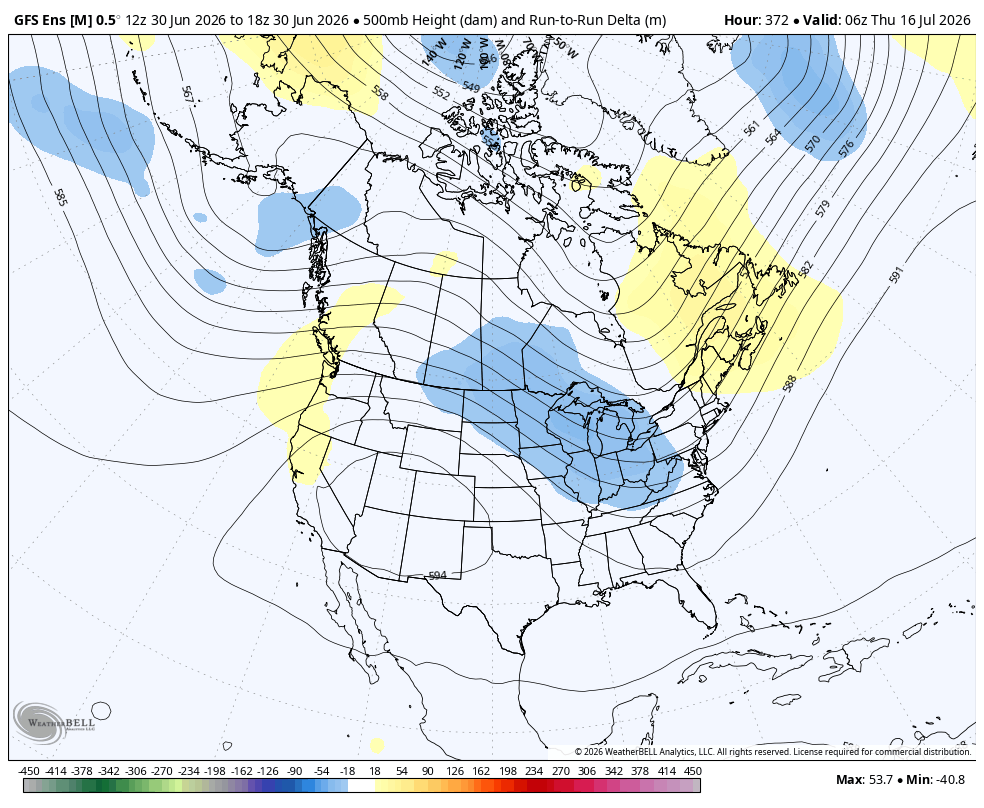
2. This was just the change from the previous 12z run. Bearish! Lower 500 mb heights (in blue) across the entire Cornbelt. Strengthening northwest flow. Cooler temps.
Sorry for the late post on this. We had a heating and air guy here trying to figure out where the huge condensation leak is gushing from the upstairs AC(we have 3 units in the house), Water is coming thru the ceiling of our 2nd floor(that unit is on the 3rd floor) at the rate of 20 gallons/day.
You would be amazed at how much moisture that a huge air conditioner takes out of the air when the dewpoint is at 75+ degrees.
Cool temperatures = robust injection for Summer = people not acclimated to the first major heat wave of Summer this week!
https://www.cpc.ncep.noaa.gov/products/tanal/temp_analyses.php

++++++++++++++++++
Latest Release Jul 02, 2026
https://www.investing.com/economic-calendar/natural-gas-storage-386
Actual 87.00B
Forecast 81.00B
Previous 76.00B
++++++++++++++
for week ending June 26, 2026 | Released: July 2, 2026 at 10:30 a.m. | Next Release: July 9, 2026
| Working gas in underground storage, Lower 48 states Summary text CSV JSN | |||||||||||||||||||||||||
|---|---|---|---|---|---|---|---|---|---|---|---|---|---|---|---|---|---|---|---|---|---|---|---|---|---|
| Historical Comparisons | |||||||||||||||||||||||||
| Stocks billion cubic feet (Bcf) | Year ago (06/26/25) | 5-year average (2021-25) | |||||||||||||||||||||||
| Region | 06/26/26 | 06/19/26 | net change | implied flow | Bcf | % change | Bcf | % change | |||||||||||||||||
| East | 587 | 558 | 29 | 29 | 600 | -2.2 | 574 | 2.3 | |||||||||||||||||
| Midwest | 706 | 672 | 34 | 34 | 685 | 3.1 | 664 | 6.3 | |||||||||||||||||
| Mountain | 230 | 227 | 3 | 3 | 227 | 1.3 | 189 | 21.7 | |||||||||||||||||
| Pacific | 313 | 312 | 1 | 1 | 286 | 9.4 | 252 | 24.2 | |||||||||||||||||
| South Central | 1,086 | 1,066 | 20 | 20 | 1,147 | -5.3 | 1,069 | 1.6 | |||||||||||||||||
| Salt | 330 | 325 | 5 | 5 | 343 | -3.8 | 307 | 7.5 | |||||||||||||||||
| Nonsalt | 756 | 741 | 15 | 15 | 803 | -5.9 | 762 | -0.8 | |||||||||||||||||
| Total | 2,922 | 2,835 | 87 | 87 | 2,945 | -0.8 | 2,747 | 6.4 | |||||||||||||||||
| Totals may not equal sum of components because of independent rounding. | |||||||||||||||||||||||||
Working gas in storage was 2,922 Bcf as of Friday, June 26, 2026, according to EIA estimates. This represents a net increase of 87 Bcf from the previous week. Stocks were 23 Bcf less than last year at this time and 175 Bcf above the five-year average of 2,747 Bcf. At 2,922 Bcf, total working gas is within the five-year historical range.
For information on sampling error in this report, see Estimated Measures of Sampling Variability table below.
Note: The shaded area indicates the range between the historical minimum and maximum values for the weekly series from 2021 through 2025. The dashed vertical lines indicate current and year-ago weekly periods.
Why isn't the hot forecast impacting natural gas?
Mainly because the location of the heat dome for the rest of this month will be in the Rockies/Plains where not that many people live and NOT in the East, like it was last week.
The weekly EIA natural gas storage report this Thursday will feature a MUCH smaller injection than any so far this Summer. Widespread heat in the eastern 1/2 of the country last week where people were cranking up the AC, using electricity generated from burning natural gas.
Plenty of humidity to go with those above average temperatures (+2-4 deg. F) with especially warm nights.
https://www.cpc.ncep.noaa.gov/products/tanal/temp_analyses.php

This last 0z European Ensemble model was BULLISH with +7 CDDs in purple compared to the previous run. This gave us a pop after midnight with no follow thru.
NG and BOIL appear to be firming! Grains on/near highs of the day. Does this suggest strengthening, movement eastward of dome?
Nope. The dome is not going to impact the east on any forecasts.
it will temporarily shift into the Midwest, especially the WCB at the end of week 1, then go back west. The Midwest will burn up a lot of NG during this heat wave.
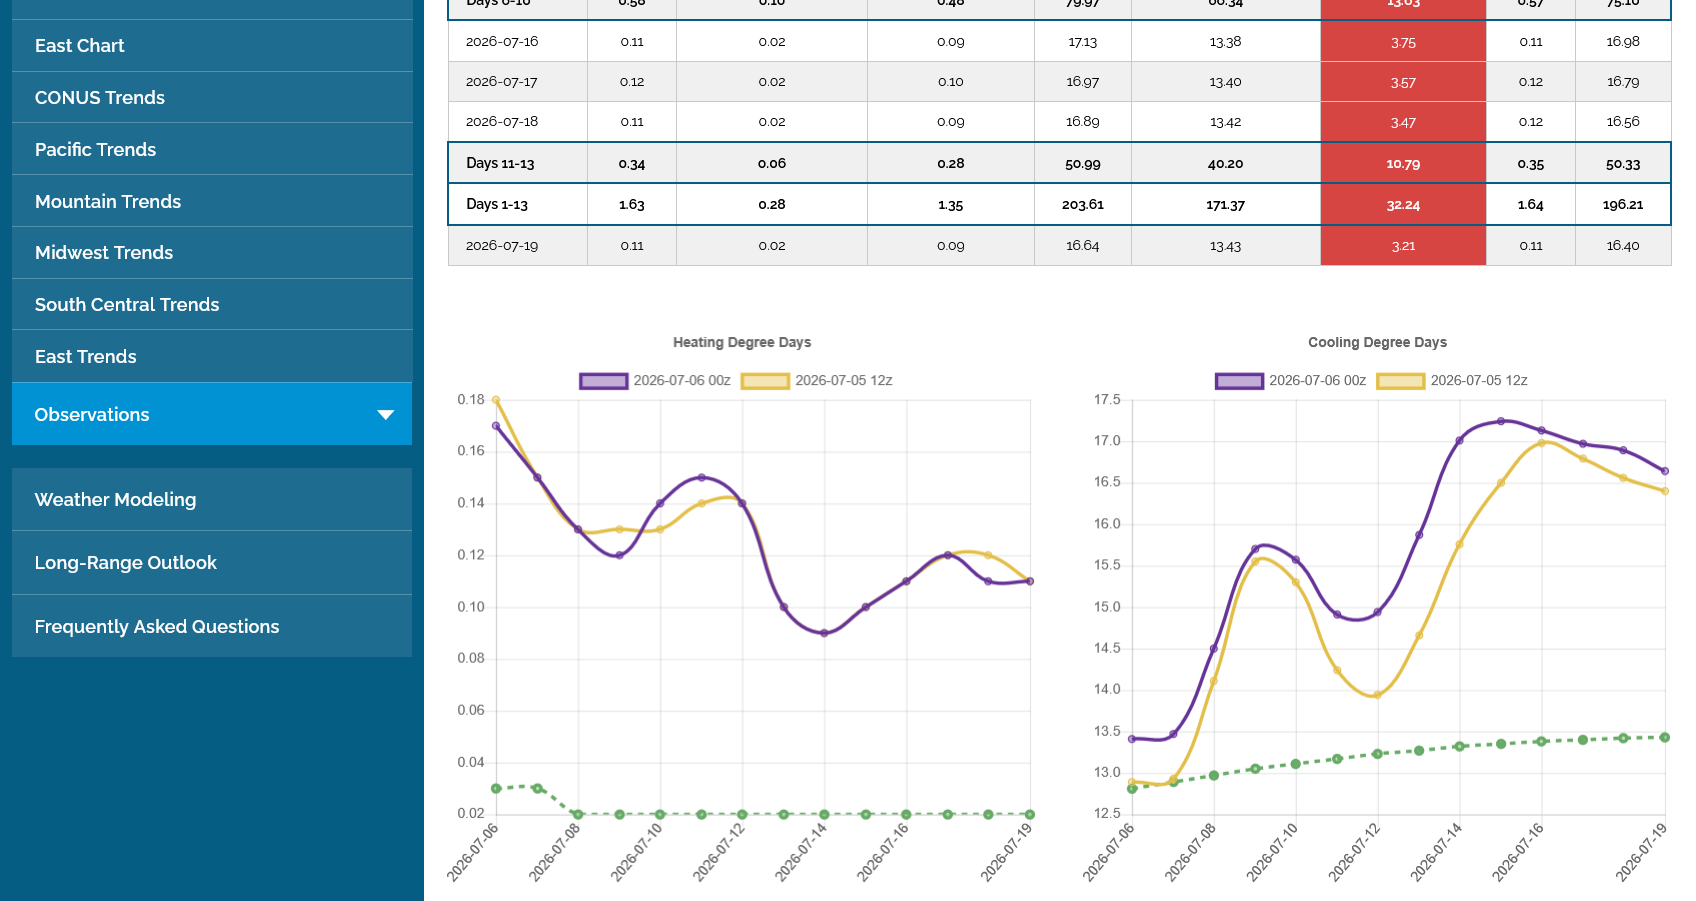
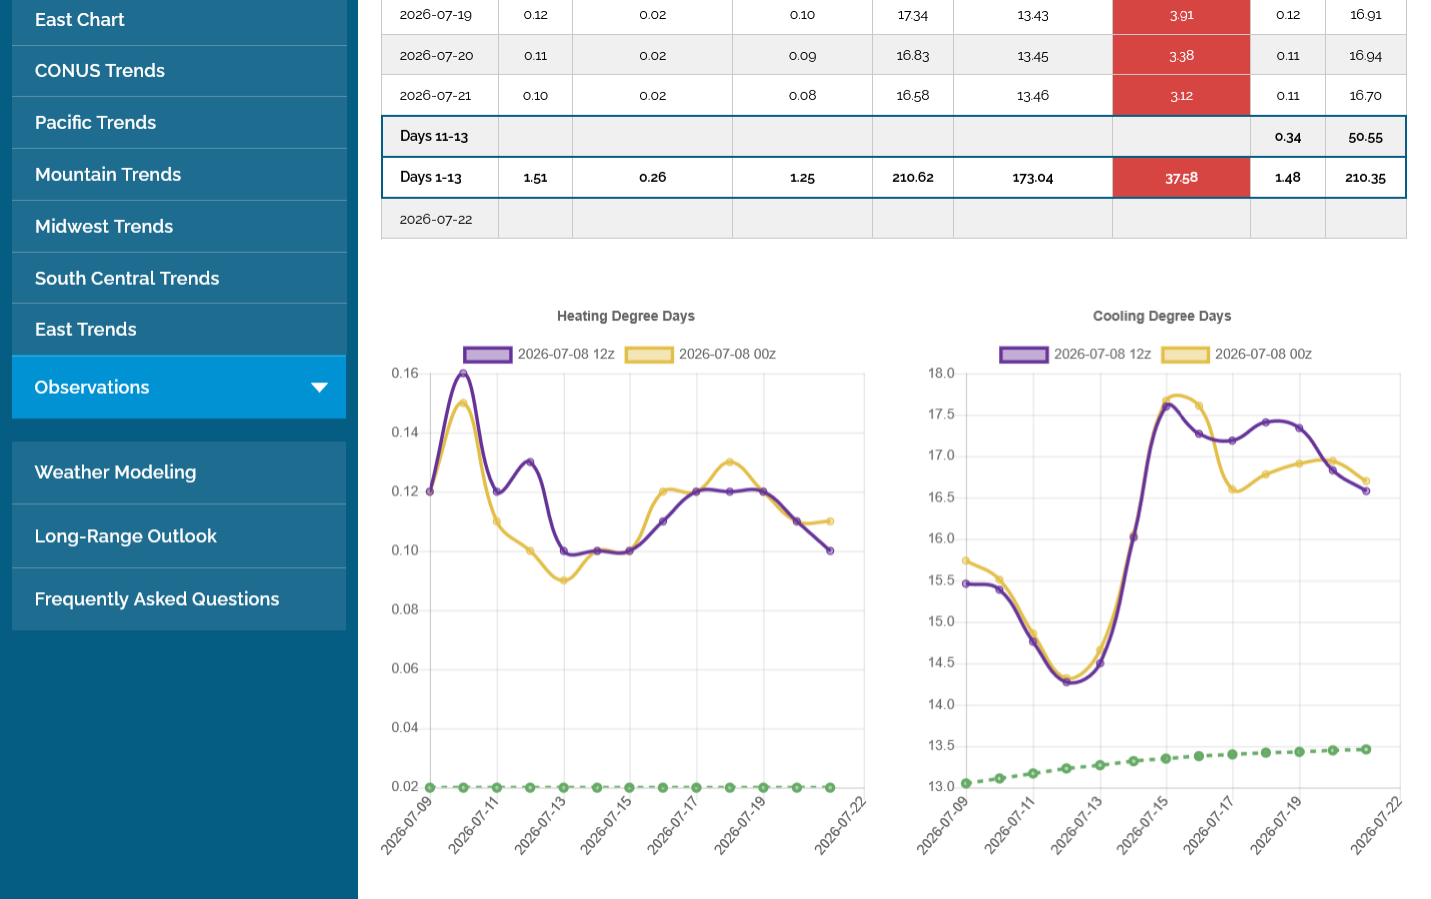
Last 12z European Ensemble model-puple about the same. HUGE spike up/peak in CDDs early next week from the Midwest heat dome, then heat magnitude slowly wanes.
+++++++++++++++
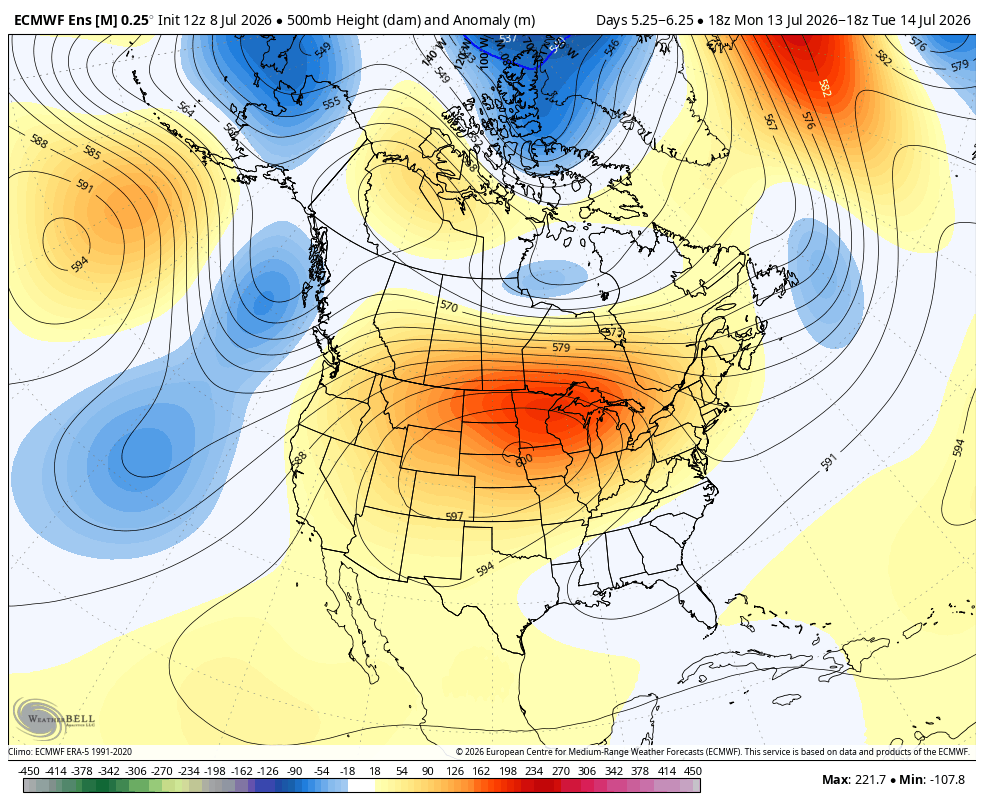
This is the peak in the dome next Tuesday, July 14th from the just out 12z European Ensemble model prediction.
Extremely impressive 600 dm center at 500 mb. However, the market has known this for 3 days now and that dome only lasts for several days next week before the center shifts southwest.
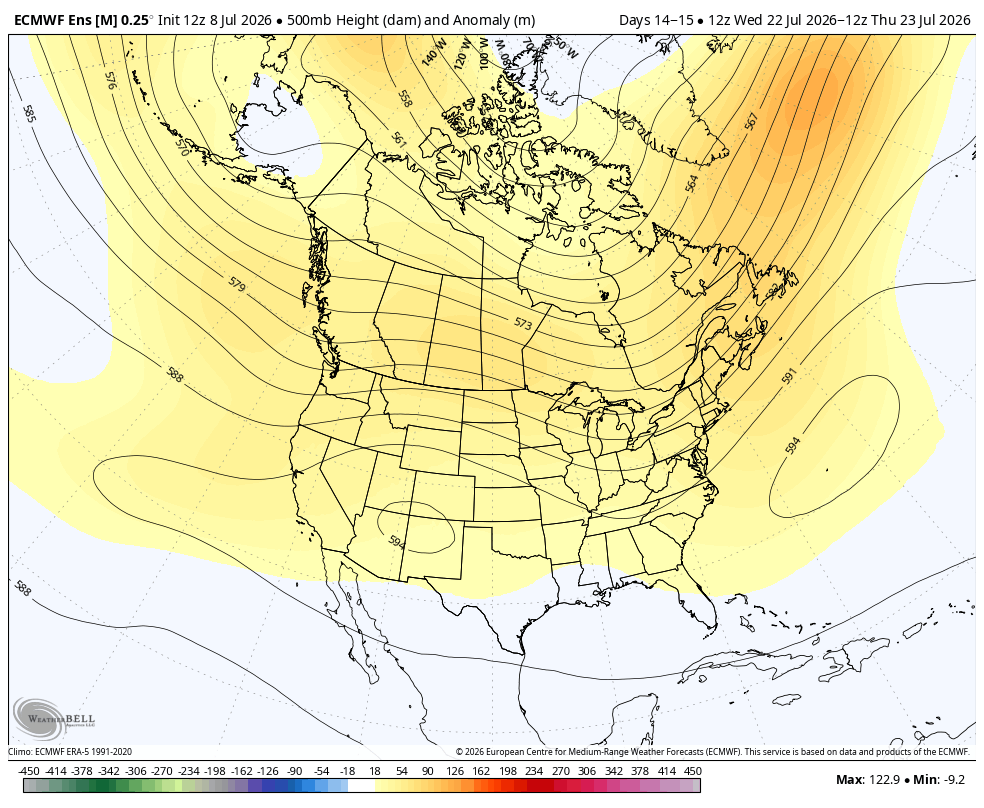
This is what the same 500 mb forecast looks like on July 23rd, 9 days later. This too has been the exact same forecast since Sunday for the end of the 2 week period, so for now it's dialed into market expectations.
Also, there is weak troughing for the East which will cause temps to be close to average.
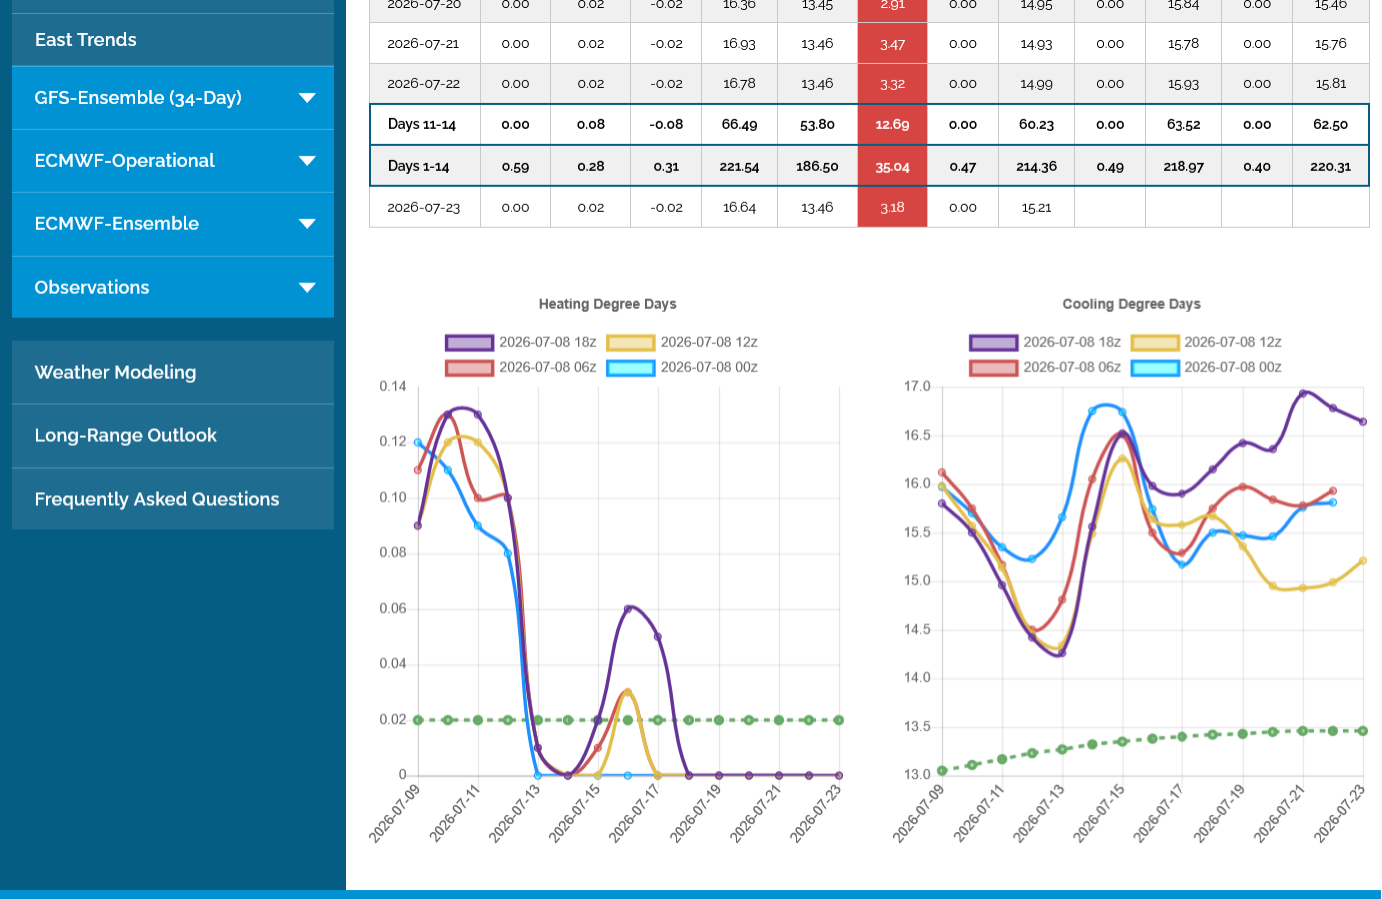
10pm: This last 18z GEFS in purple was a whopping +7 CDDs vs the previous 12z run. All from extra week 2 heat which shows temperatures getting hotter then, no leveling off as the previous 3 runs showed. The price of NG responded by........doing nothing!
The way NG and BOIL are acting, the summer heat has ended--for good.
No reaction to a much hotter forecast was a big tip off yesterday evening to the crash lower this morning.
The EIA report showed a smaller injection than the previous one but not nearly as low as I expected from last week's major heat/humidity wave (that fell short of expectations everywhere except the East Coast because of wet soils).
6-25-26 MAJOR heat(humidity) wave coming next week
Started by metmike - June 25, 2026, 3:49 p.m.
https://www.marketforum.com/forum/topic/121123/
++++++++++++
https://www.marketforum.com/forum/topic/120595/#121363
+++++++++
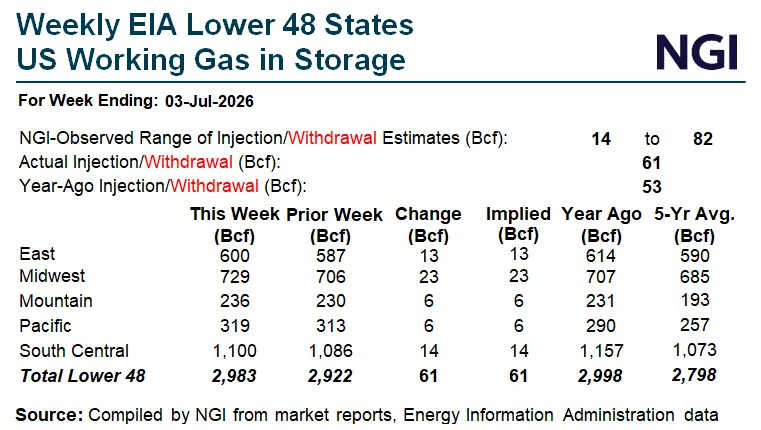
for week ending July 3, 2026 | Released: July 9, 2026 at 10:30 a.m. | Next Release: July 16, 2026
| Working gas in underground storage, Lower 48 states Summary text CSV JSN | |||||||||||||||||||||||||
|---|---|---|---|---|---|---|---|---|---|---|---|---|---|---|---|---|---|---|---|---|---|---|---|---|---|
| Historical Comparisons | |||||||||||||||||||||||||
| Stocks billion cubic feet (Bcf) | Year ago (07/03/25) | 5-year average (2021-25) | |||||||||||||||||||||||
| Region | 07/03/26 | 06/26/26 | net change | implied flow | Bcf | % change | Bcf | % change | |||||||||||||||||
| East | 600 | 587 | 13 | 13 | 614 | -2.3 | 590 | 1.7 | |||||||||||||||||
| Midwest | 729 | 706 | 23 | 23 | 707 | 3.1 | 685 | 6.4 | |||||||||||||||||
| Mountain | 236 | 230 | 6 | 6 | 231 | 2.2 | 193 | 22.3 | |||||||||||||||||
| Pacific | 319 | 313 | 6 | 6 | 290 | 10.0 | 257 | 24.1 | |||||||||||||||||
| South Central | 1,100 | 1,086 | 14 | 14 | 1,157 | -4.9 | 1,073 | 2.5 | |||||||||||||||||
| Salt | 329 | 330 | -1 | -1 | 339 | -2.9 | 302 | 8.9 | |||||||||||||||||
| Nonsalt | 771 | 756 | 15 | 15 | 817 | -5.6 | 771 | 0.0 | |||||||||||||||||
| Total | 2,983 | 2,922 | 61 | 61 | 2,998 | -0.5 | 2,798 | 6.6 | |||||||||||||||||
| Totals may not equal sum of components because of independent rounding. | |||||||||||||||||||||||||
Working gas in storage was 2,983 Bcf as of Friday, July 3, 2026, according to EIA estimates. This represents a net increase of 61 Bcf from the previous week. Stocks were 15 Bcf less than last year at this time and 185 Bcf above the five-year average of 2,798 Bcf. At 2,983 Bcf, total working gas is within the five-year historical range.
For information on sampling error in this report, see Estimated Measures of Sampling Variability table below.
Note: The shaded area indicates the range between the historical minimum and maximum values for the weekly series from 2021 through 2025. The dashed vertical lines indicate current and year-ago weekly periods.
+++++++++++
+++++++++++++++
Incredible plunge of $2,000/contract+ today!
https://tradingeconomics.com/commodity/natural-gas
1. 1 week: WOW! Down $3,500 since yesterdays high.
2. 1 month WOW!
3. 1 year: Ascending triangle/wedge from the April 2026 seasonal low. Powerful downside break out thru the 3 month uptrend today!
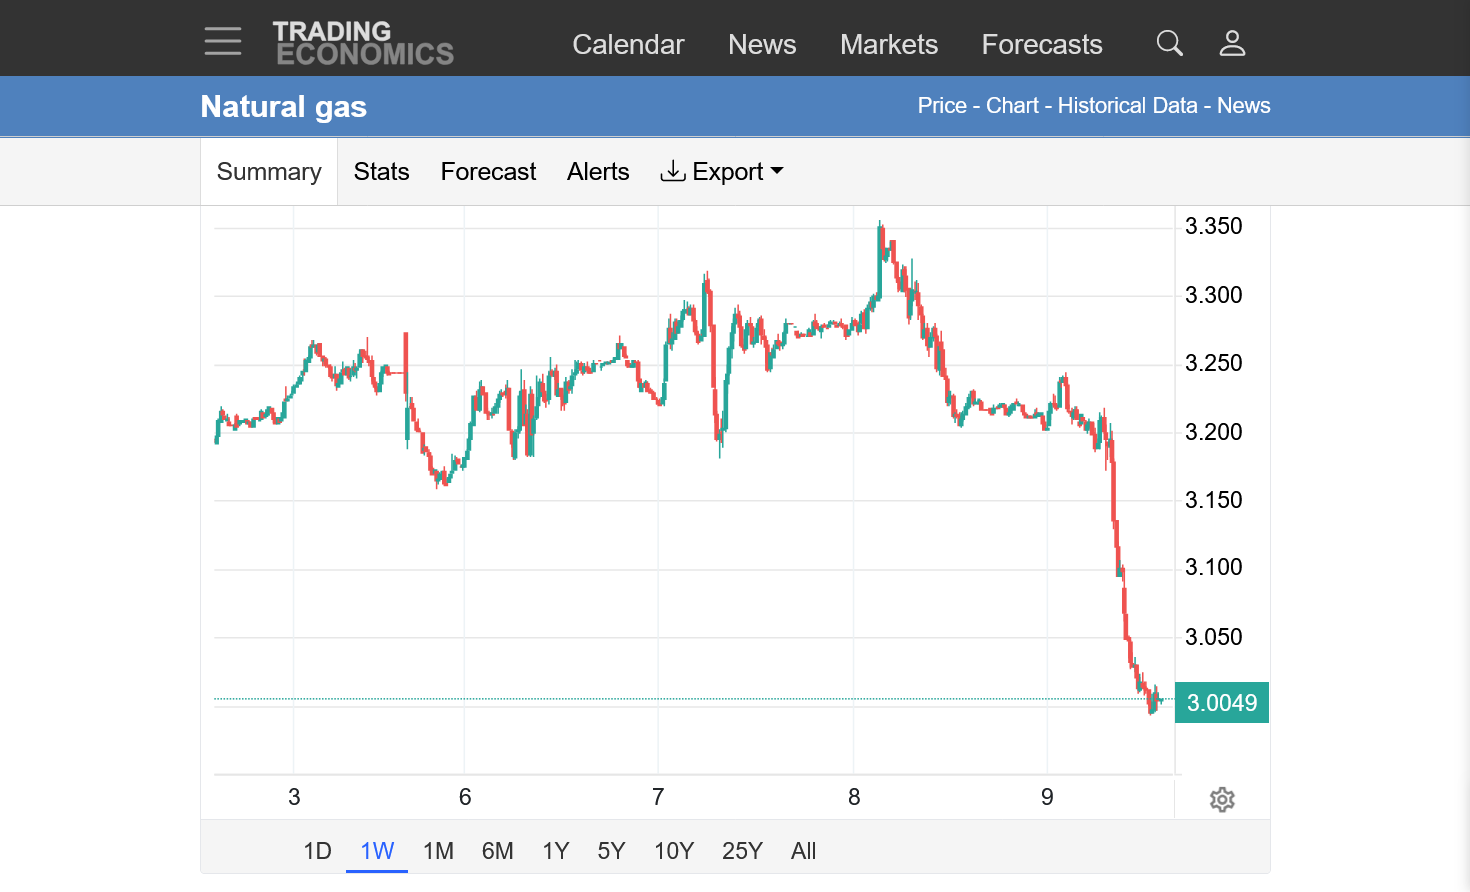
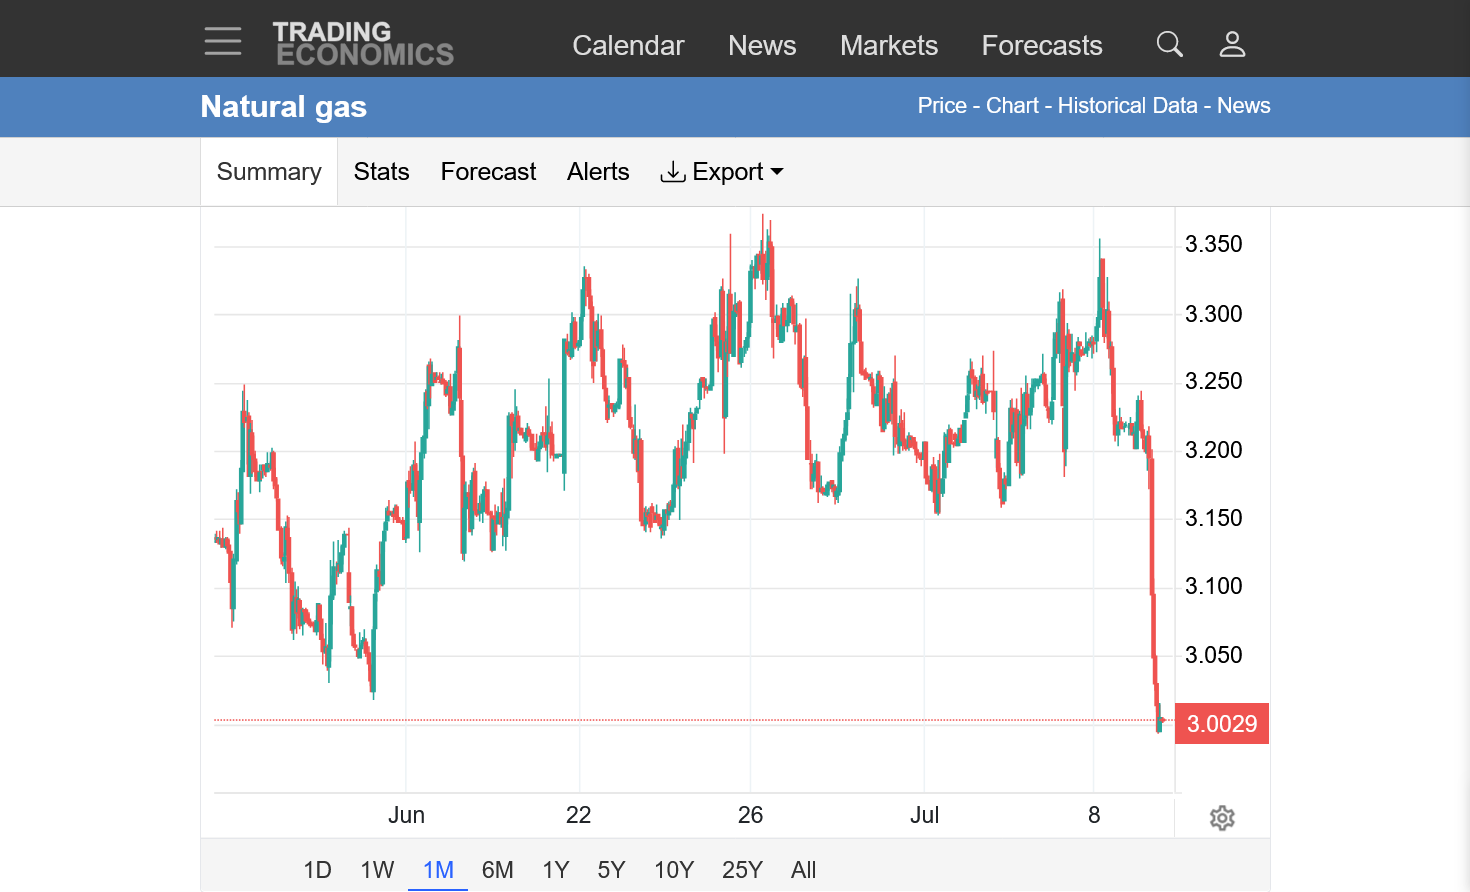
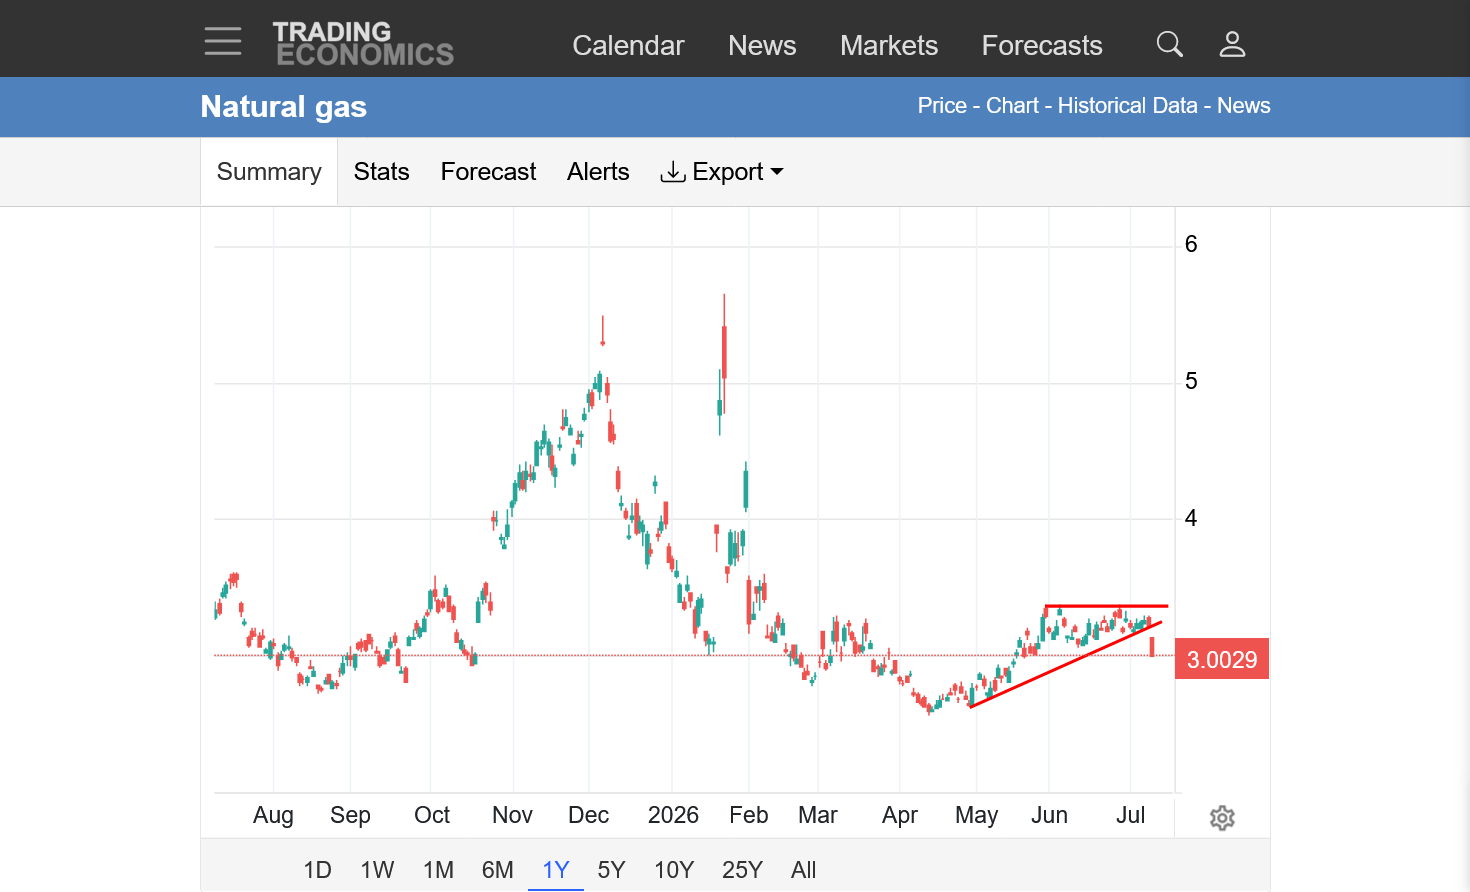
The downside collapse in price continued BELOW $3 this morning.
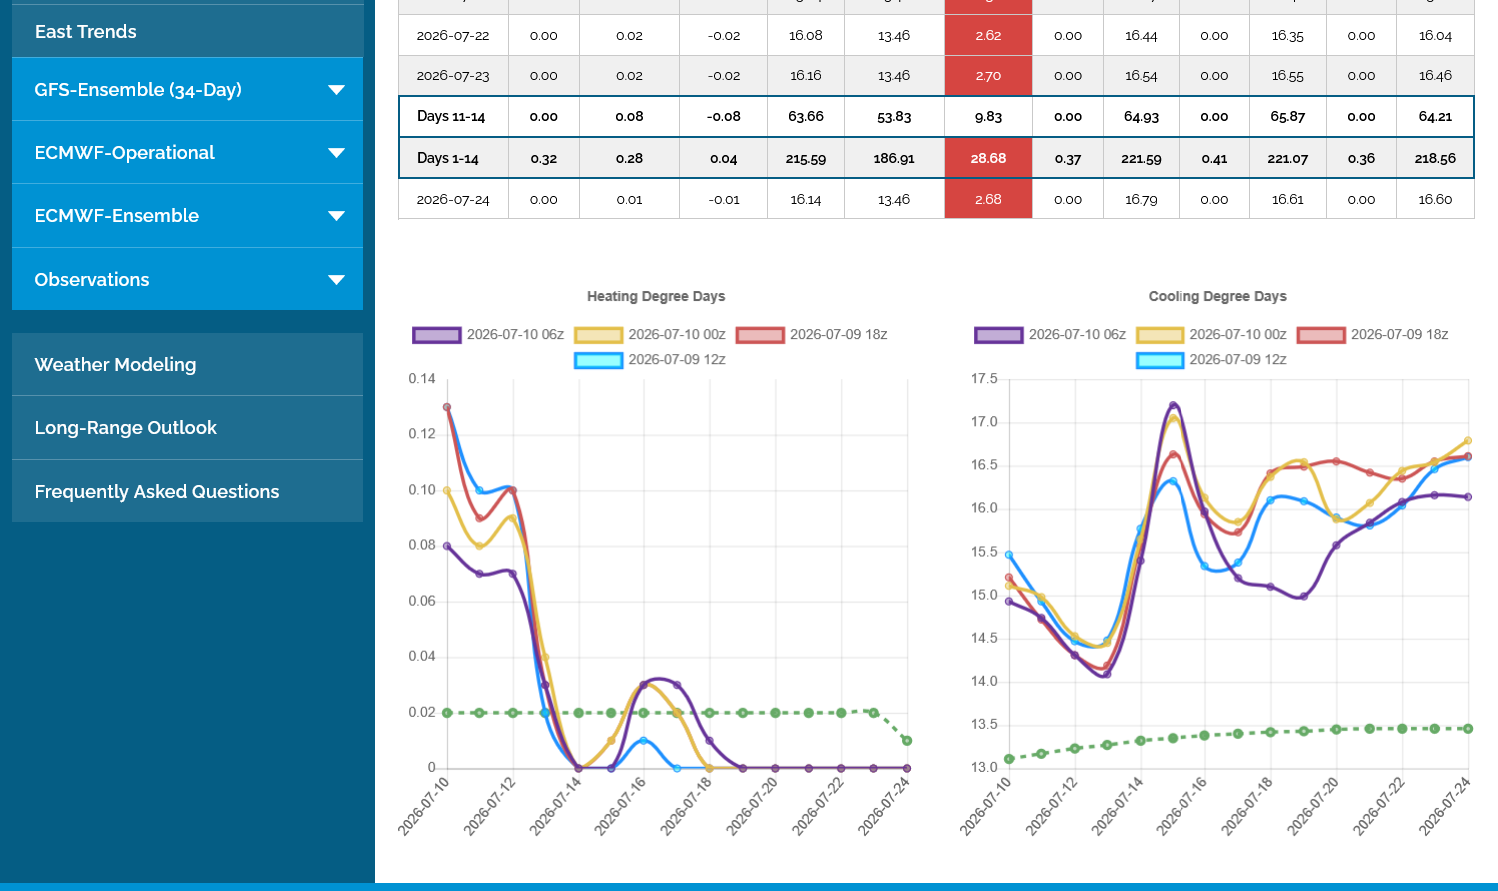
The last 0z European Model being -3 CDDs bearish in purple, compared to the previous run, could have contributed. The forecast is still HOT, just not AS hot as before.
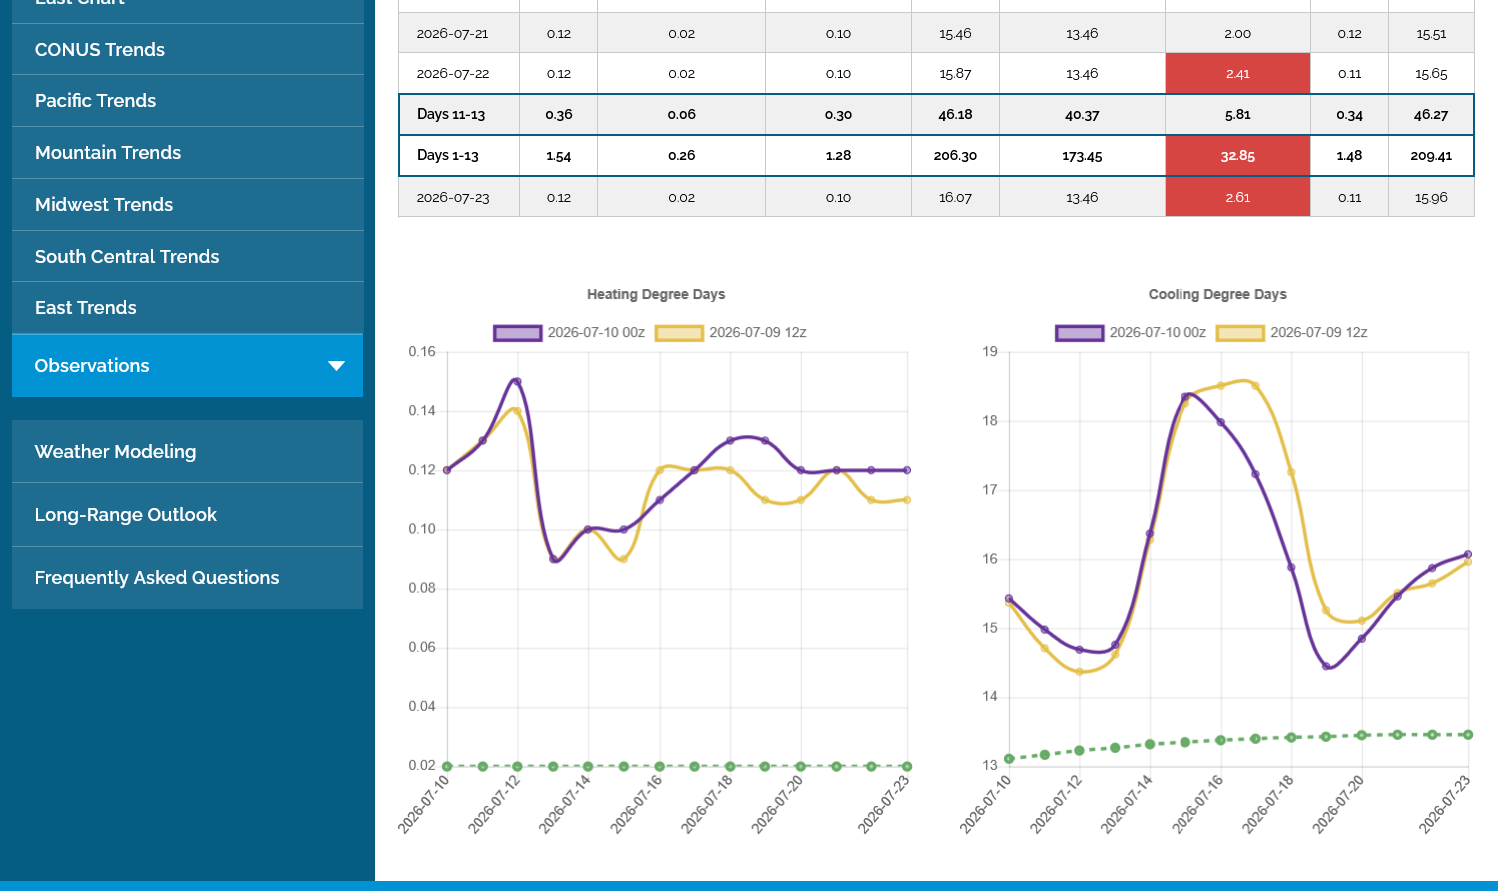
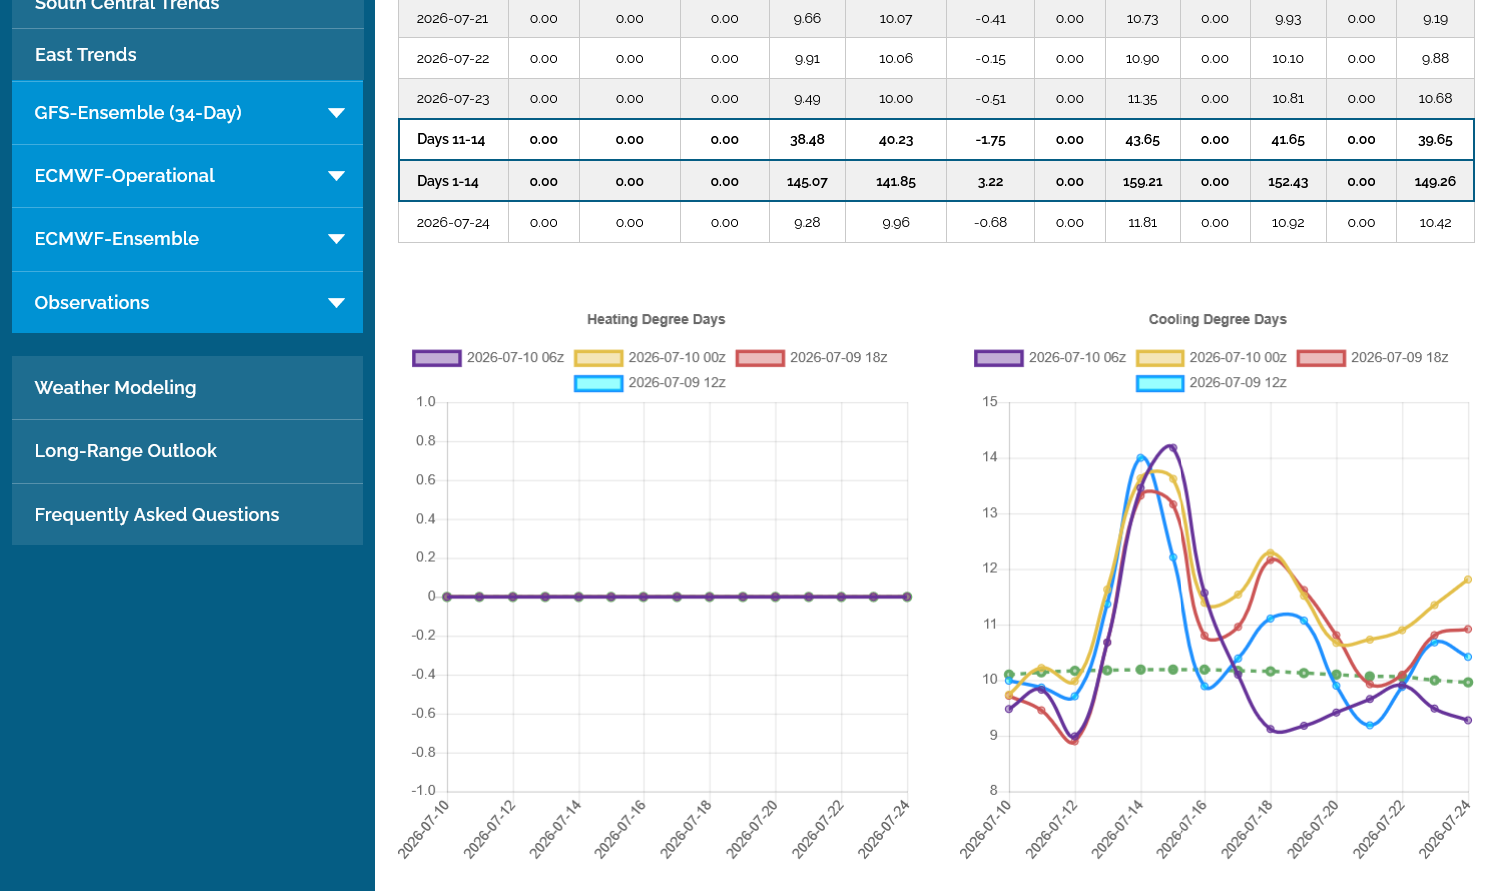
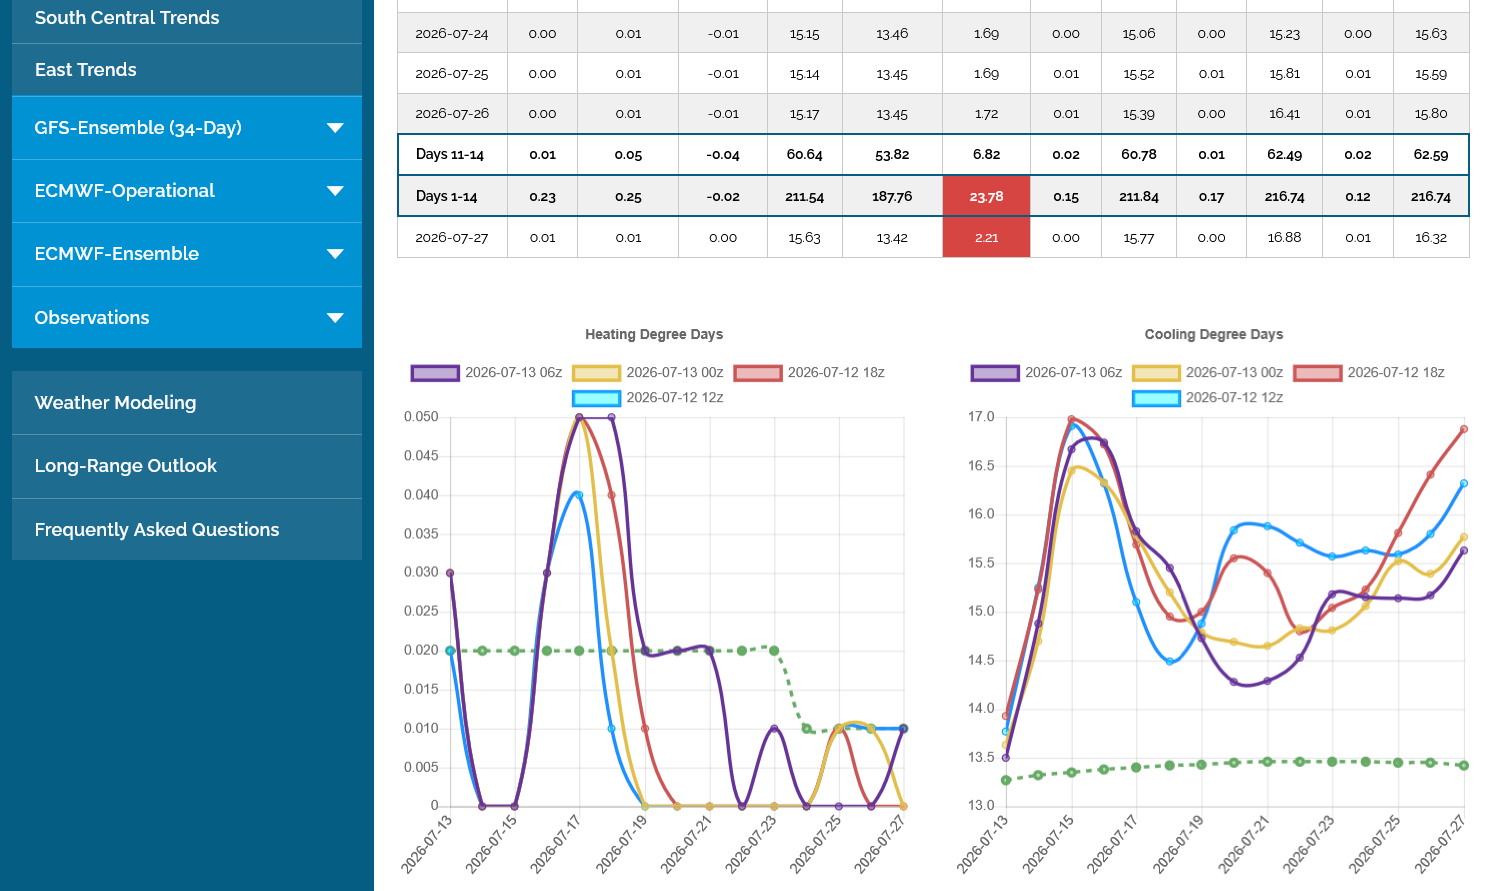
This last 6z GEFS in purple, continued the cooling trend, especially in the Midwest(2nd graph) where CDDs actually PLUNGE below average for week 2:
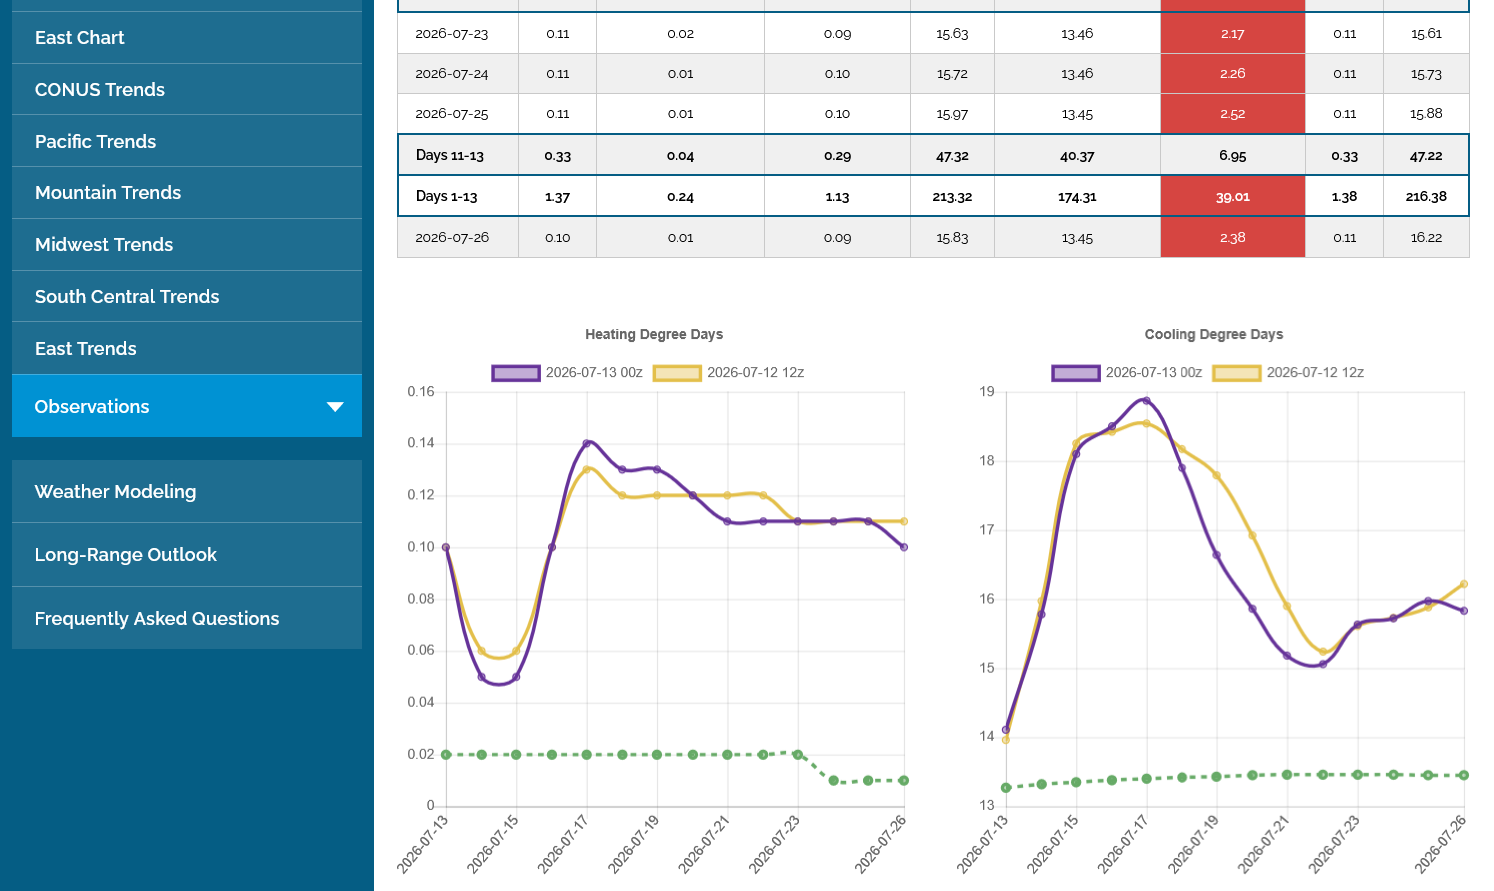
Prices continued to be under pressure overnight from cooler temperatures in the forecast. The last 0z European Ensemble model (purple/right) was another -3 CDDs compared to the previous 0z run. It's certainly NOT cool but continues to be LESS hot.
++++++++++
The last 2 runs of the GEFS were also LESS hot by -5 CDDs, compared to the previous 2 runs.
The weekly EIA for natural gas comes out at 9:30 am this morning. These were the temperatures last week for that report:
Very warm to hot in most places as we approached the seasonal peak in temperatures in the Northern Hemisphere. The peak is right now. So it's no coincidence that we're having heat domes and record heat at the hottest time of year that are slightly hotter because of global warming.
Regardless, the heat below was still impressive for the magnitude and how widespread. A +4 deg. anomaly along the East Coast where so many people live used up a lot of natural gas that's burned to generate electricity. I would think this will be out lowest injection of the year but have not been following the injections that close.
Also, the market spiked higher on this heat back in June. As Joe. K used to say here "They call it futures not PASTures"
https://www.cpc.ncep.noaa.gov/products/tanal/temp_analyses.php

+++++++++++++
Must have been MORE than expected as the price of ng crashed after the release. Again, the market traded a low number weeks ago when the extended forecast weather models had it.
for week ending July 10, 2026 | Released: July 16, 2026 at 10:30 a.m. | Next Release: July 23, 2026
| Working gas in underground storage, Lower 48 states Summary text CSV JSN | |||||||||||||||||||||||||
|---|---|---|---|---|---|---|---|---|---|---|---|---|---|---|---|---|---|---|---|---|---|---|---|---|---|
| Historical Comparisons | |||||||||||||||||||||||||
| Stocks billion cubic feet (Bcf) | Year ago (07/10/25) | 5-year average (2021-25) | |||||||||||||||||||||||
| Region | 07/10/26 | 07/03/26 | net change | implied flow | Bcf | % change | Bcf | % change | |||||||||||||||||
| East | 614 | 600 | 14 | 14 | 626 | -1.9 | 604 | 1.7 | |||||||||||||||||
| Midwest | 749 | 729 | 20 | 20 | 727 | 3.0 | 705 | 6.2 | |||||||||||||||||
| Mountain | 240 | 236 | 4 | 4 | 234 | 2.6 | 198 | 21.2 | |||||||||||||||||
| Pacific | 319 | 319 | 0 | 0 | 294 | 8.5 | 262 | 21.8 | |||||||||||||||||
| South Central | 1,103 | 1,100 | 3 | 3 | 1,163 | -5.2 | 1,074 | 2.7 | |||||||||||||||||
| Salt | 324 | 329 | -5 | -5 | 336 | -3.6 | 295 | 9.8 | |||||||||||||||||
| Nonsalt | 779 | 771 | 8 | 8 | 828 | -5.9 | 778 | 0.1 | |||||||||||||||||
| Total | 3,024 | 2,983 | 41 | 41 | 3,045 | -0.7 | 2,843 | 6.4 | |||||||||||||||||
| Totals may not equal sum of components because of independent rounding. | |||||||||||||||||||||||||
Working gas in storage was 3,024 Bcf as of Friday, July 10, 2026, according to EIA estimates. This represents a net increase of 41 Bcf from the previous week. Stocks were 21 Bcf less than last year at this time and 181 Bcf above the five-year average of 2,843 Bcf. At 3,024 Bcf, total working gas is within the five-year historical range.
For information on sampling error in this report, see Estimated Measures of Sampling Variability table below.
Note: The shaded area indicates the range between the historical minimum and maximum values for the weekly series from 2021 through 2025. The dashed vertical lines indicate current and year-ago weekly periods.