Previous thread:
NG 2/2/26-
52 responses |
Started by WxFollower - Feb. 2, 2026, 1:18 a.m.
Sadly, we have to start out this new thread with this. As a result, natural gas prices spiked higher.
https://www.axios.com/2026/03/18/israel-strikes-iran-natural-gas-infrastructure
+++++++++++
Natural gas, immediately following the war had been trading in sympathy with rising crude prices but they came to its senses and had been trading back to US demand/supply fundamentals until this strike happened.
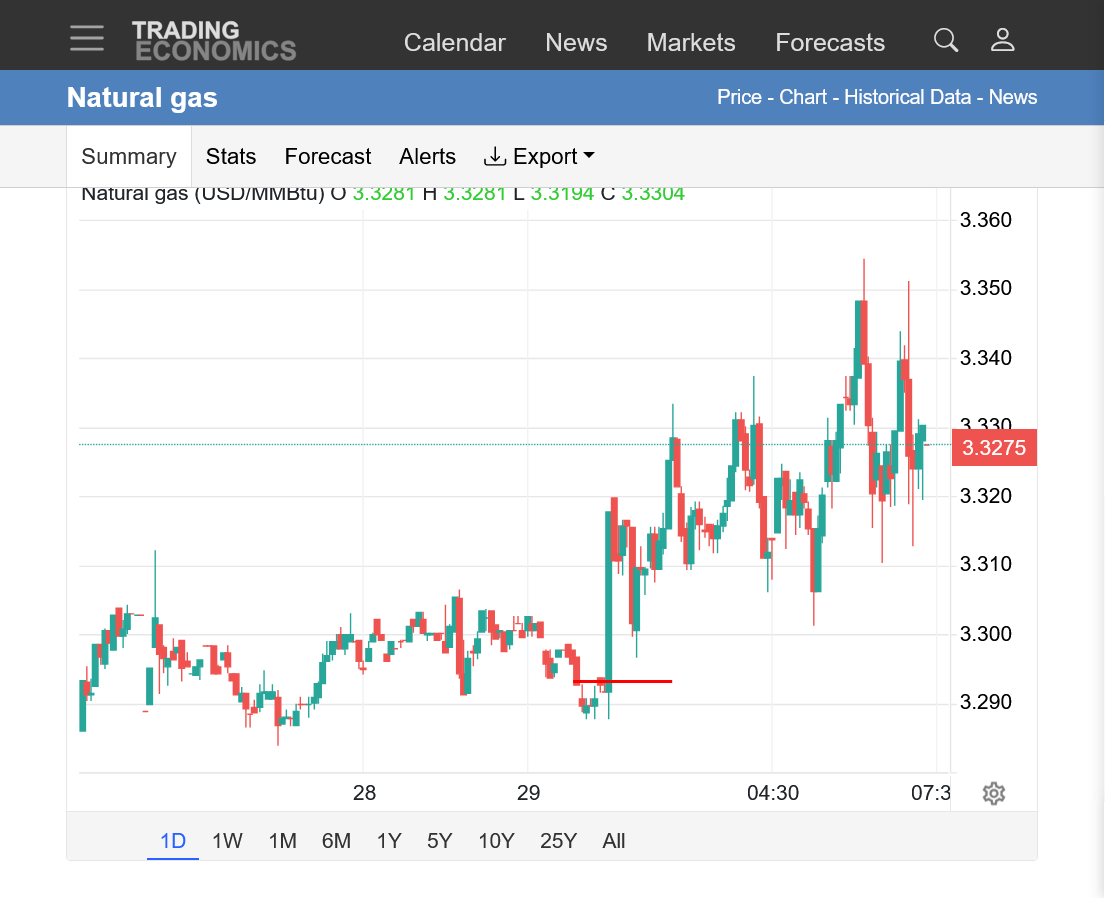
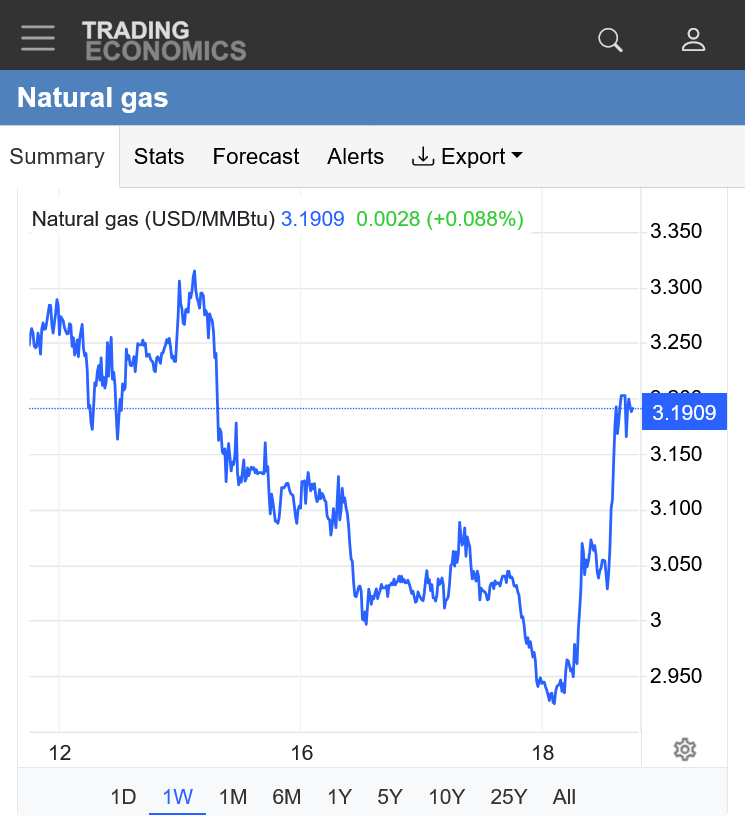
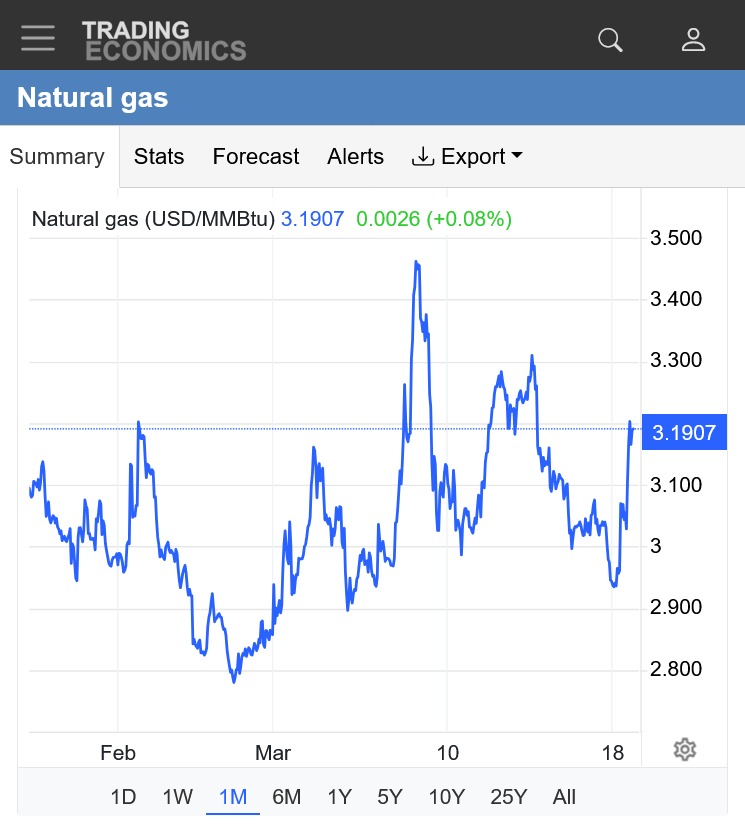
https://tradingeconomics.com/commodity/natural-gas
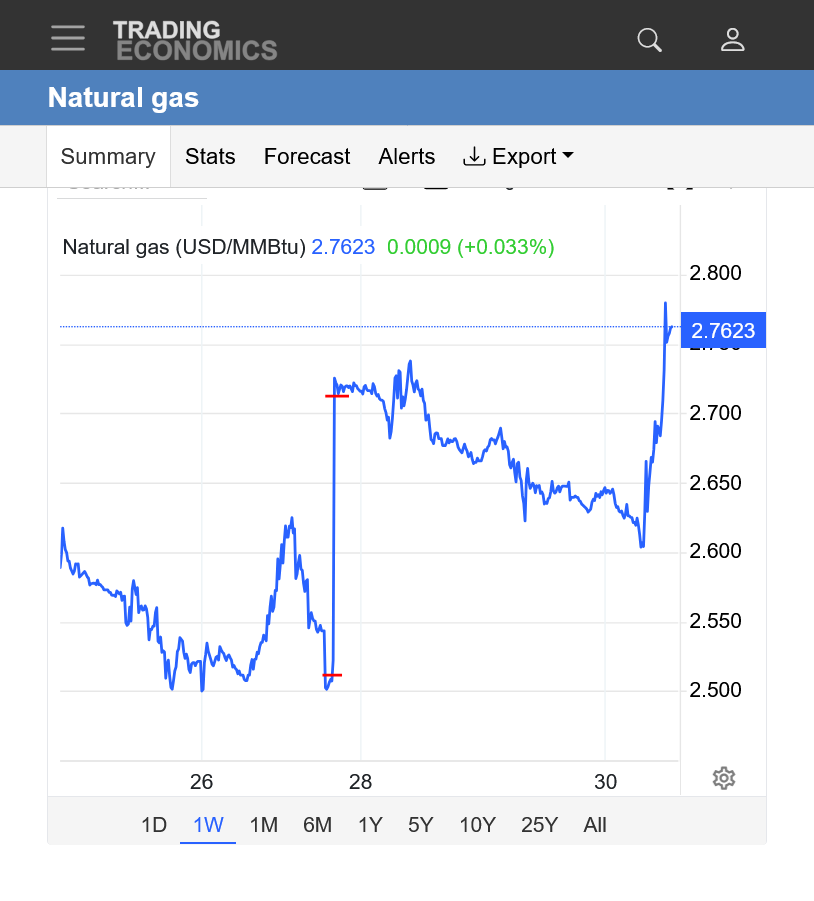
1. 1 week
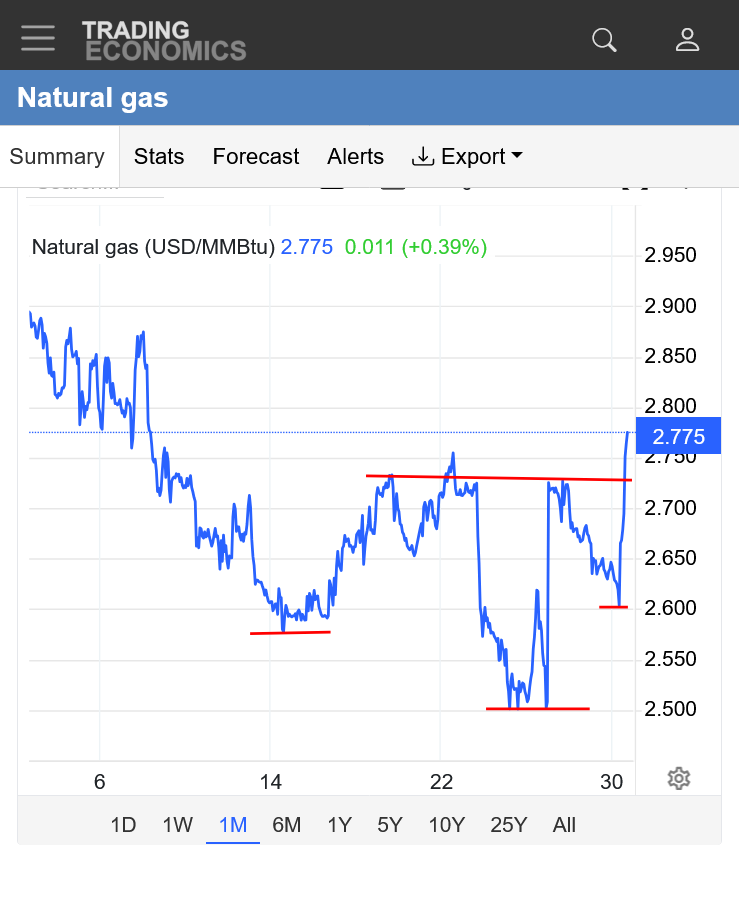
2. 1 month
+++++++
April Nymex natural gas futures rebounded Wednesday after testing a two-week low, drawing support from a global energy rally sparked by an Israeli strike on Iran’s South Pars gas field and subsequent retaliatory attacks.
Extremely mild temperatures for the eastern half of the country with numerous high population centers that were NOT using much natural gas for residential home heating.
We should have an early season injection!!! Maybe the biggest one for so early in the season?
https://www.cpc.ncep.noaa.gov/products/tanal/temp_analyses.php

Natural gas joined crude on DT’s announcement of a 5 day delay in attacking Iran’s power grids and plunged >4%!
Thanks very much, Larry!
I apologize for ignoring my favorite market, instead paying more attention to markets impacted by the war in Iran.
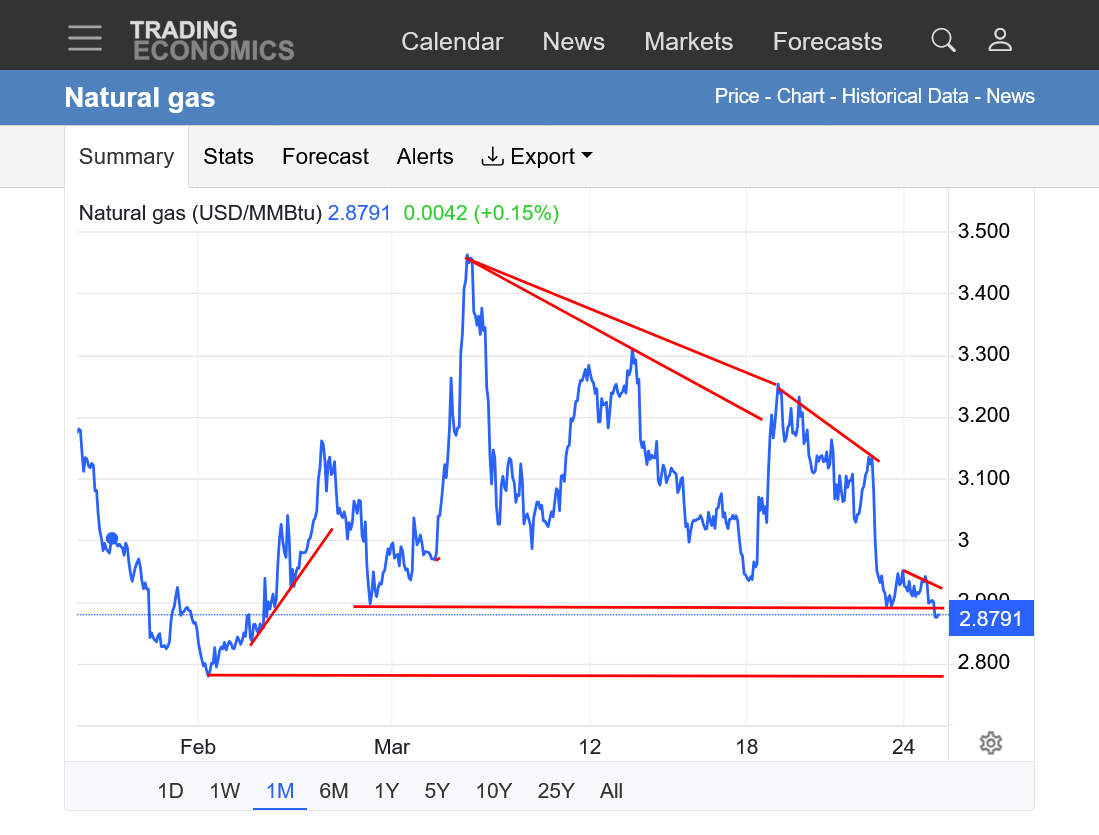
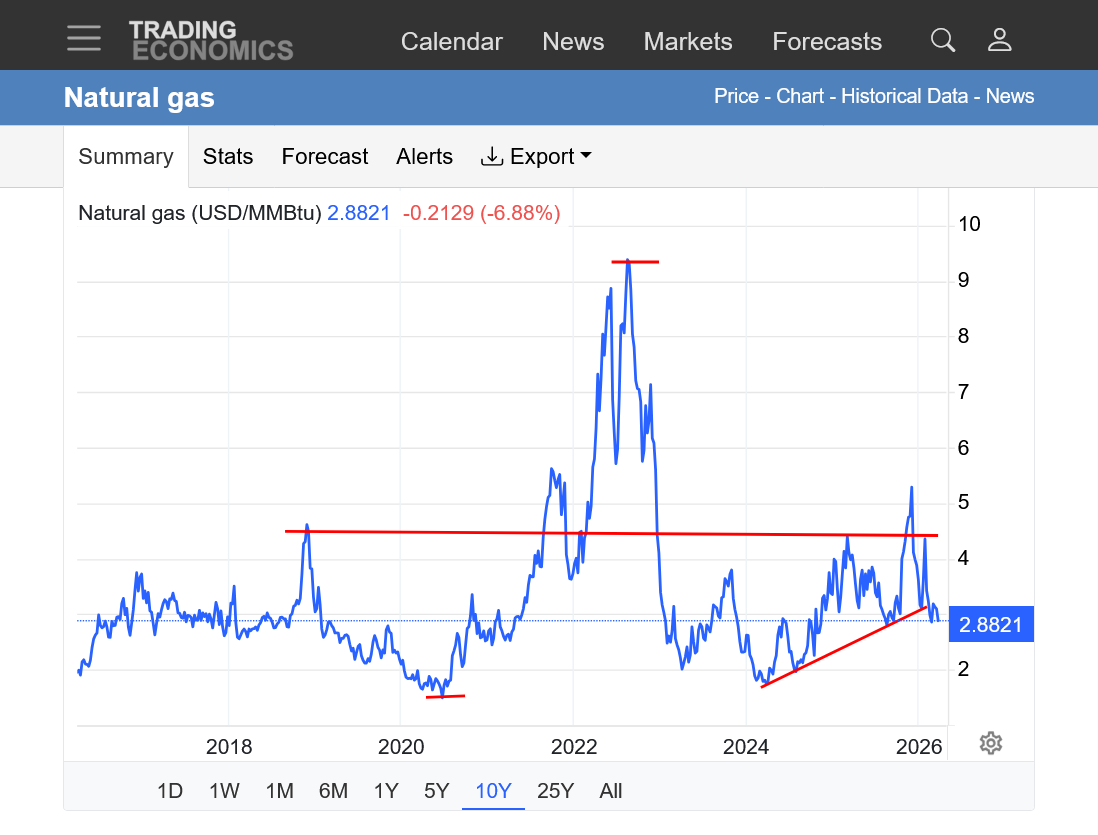
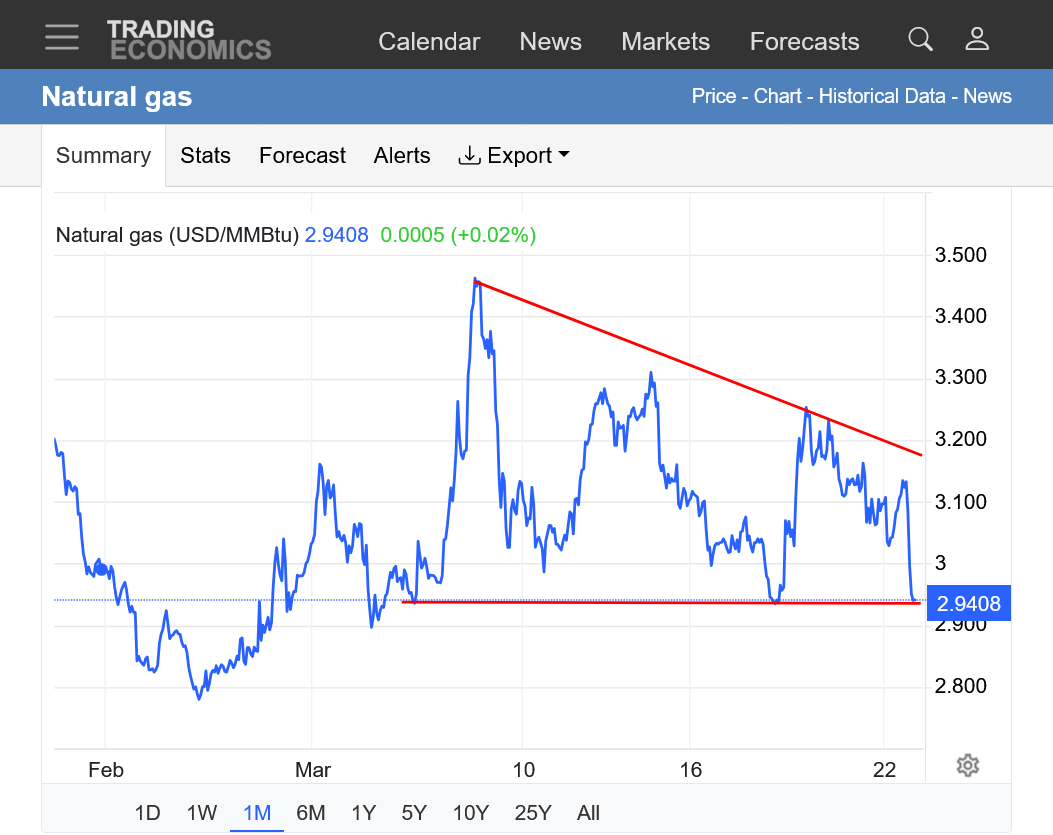
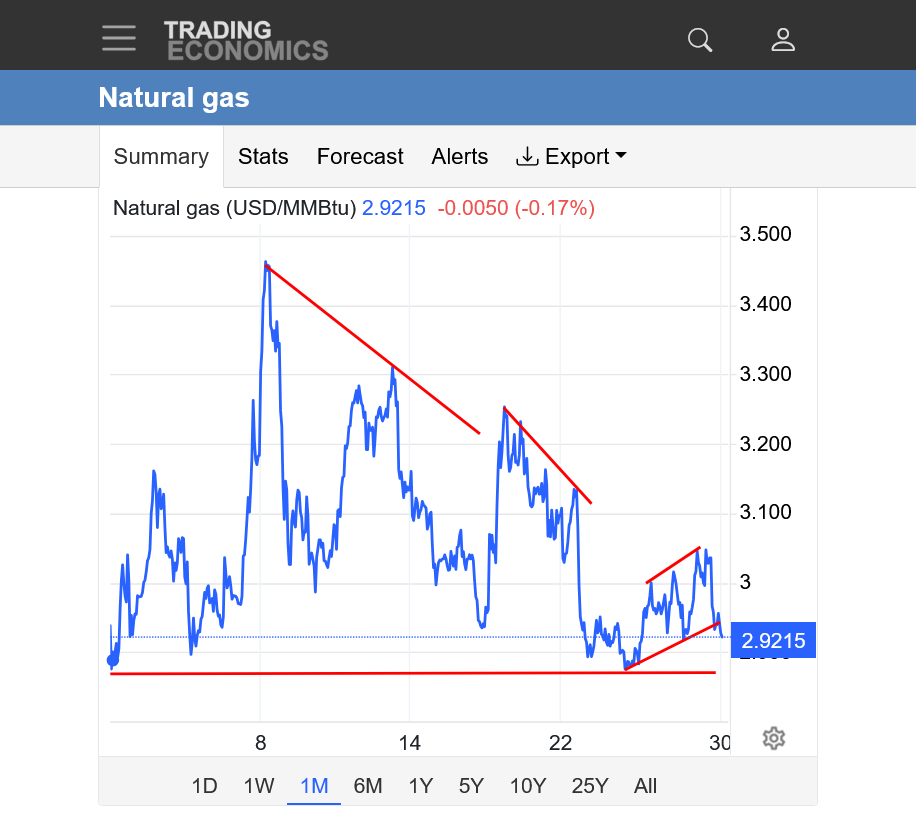
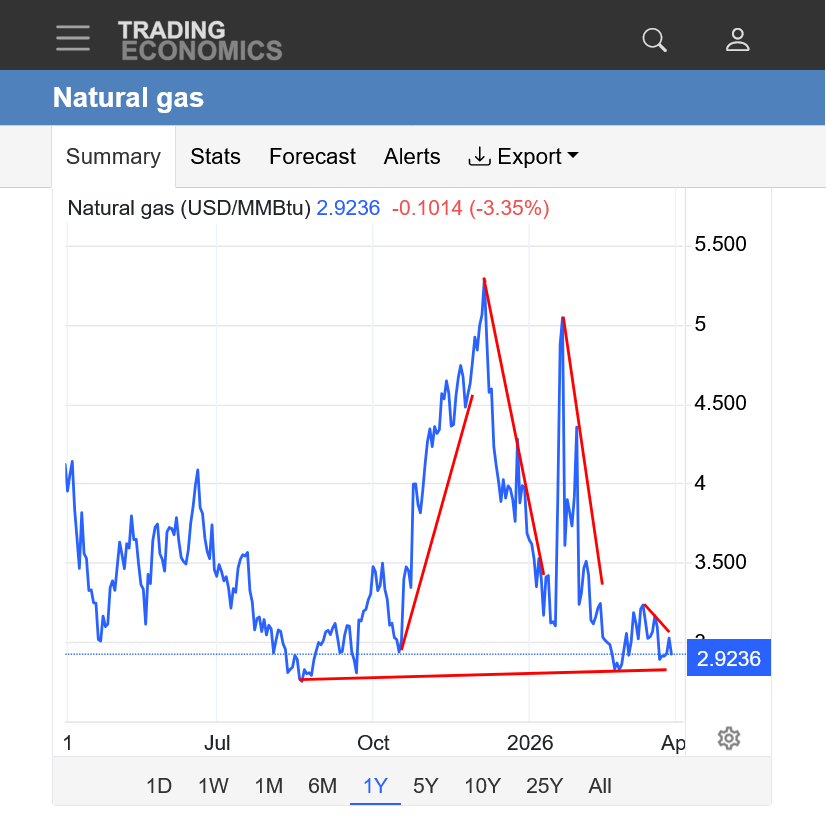
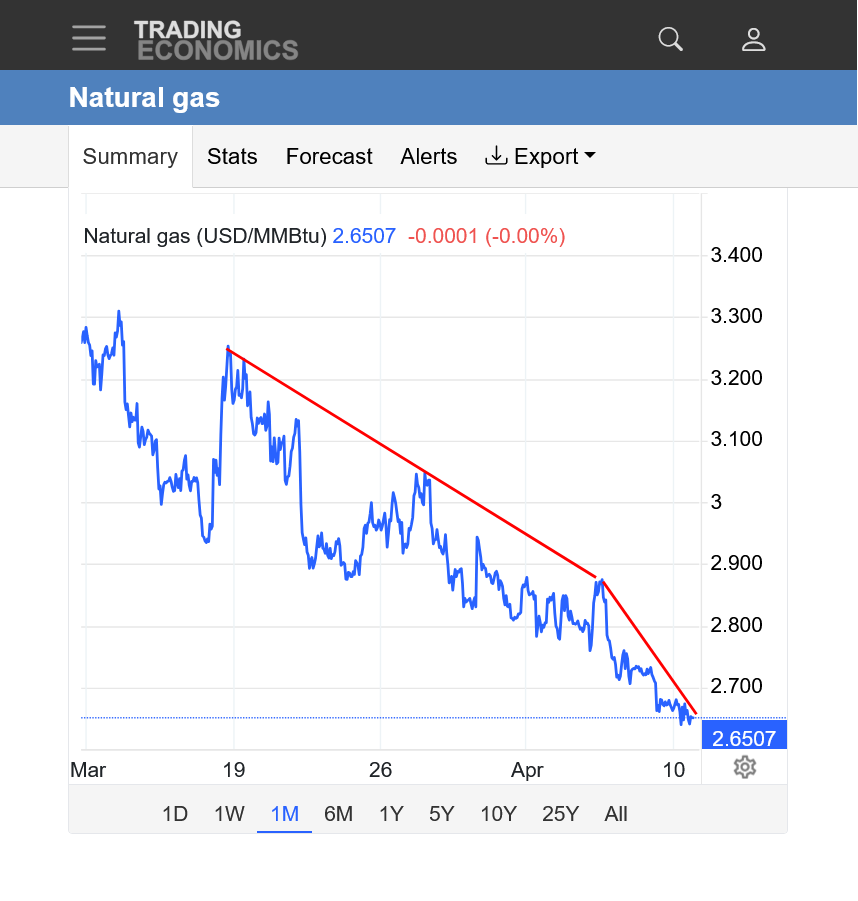
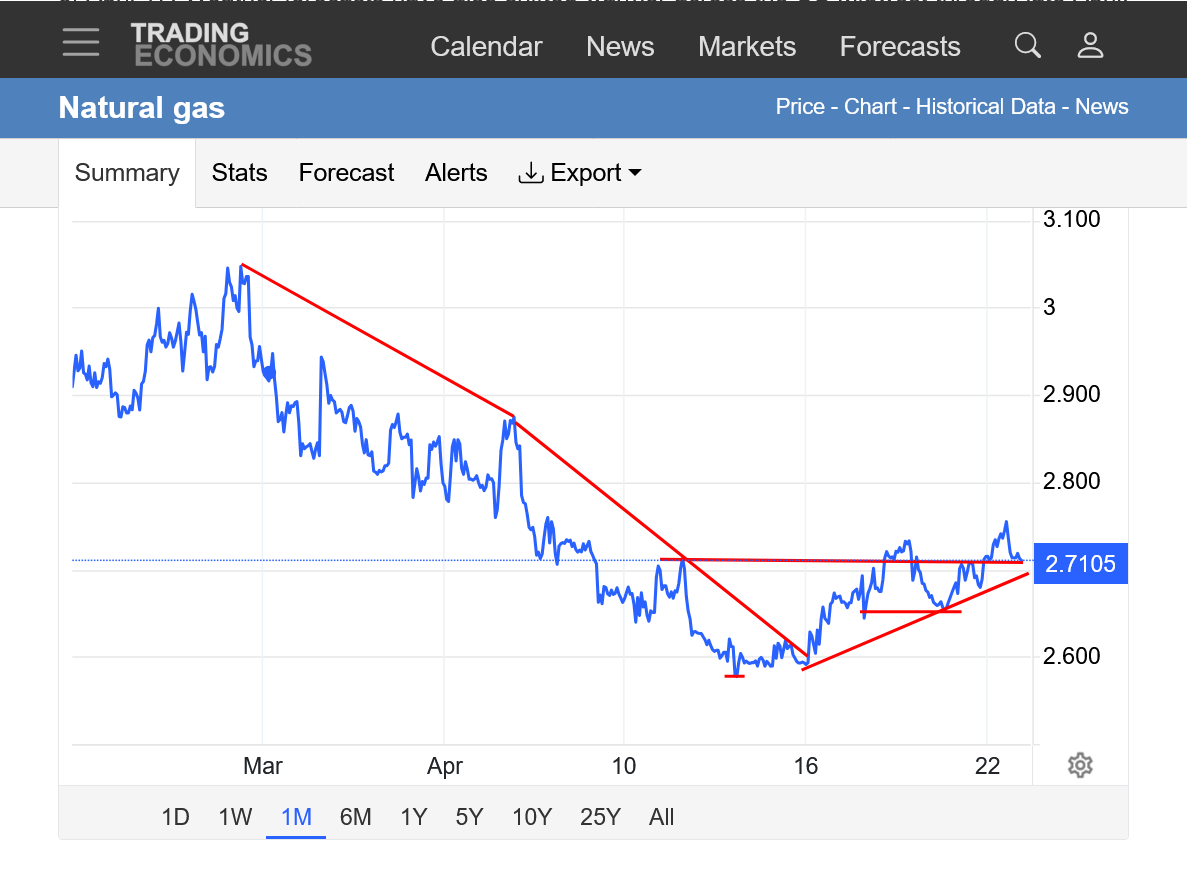
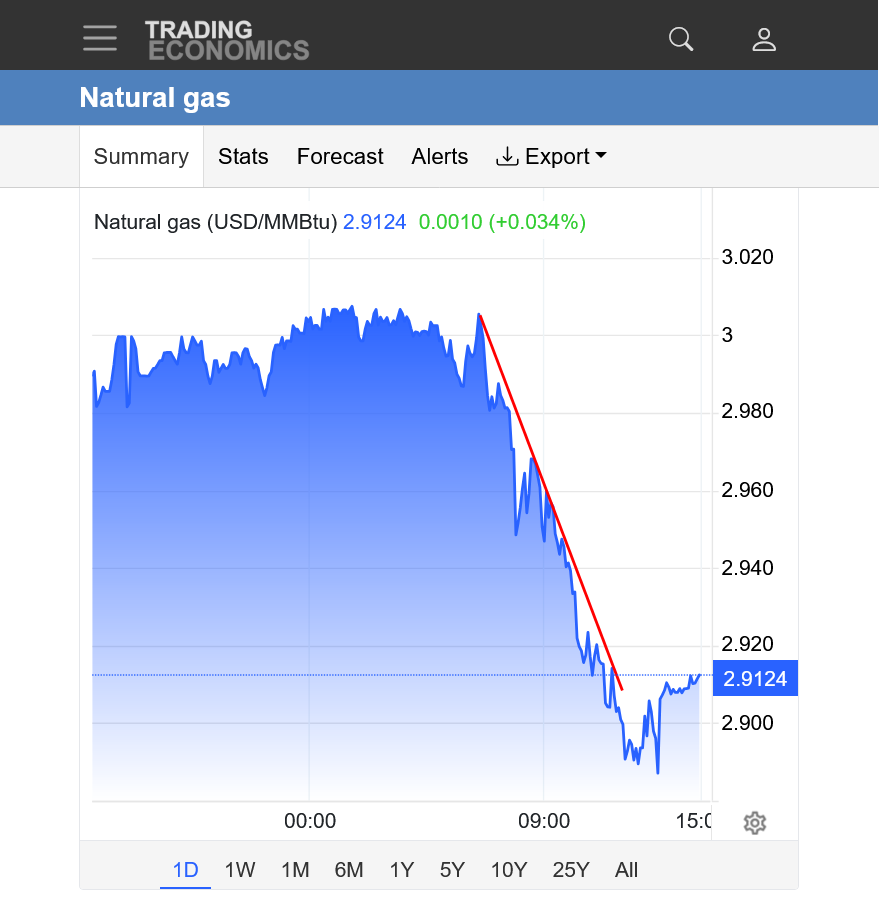
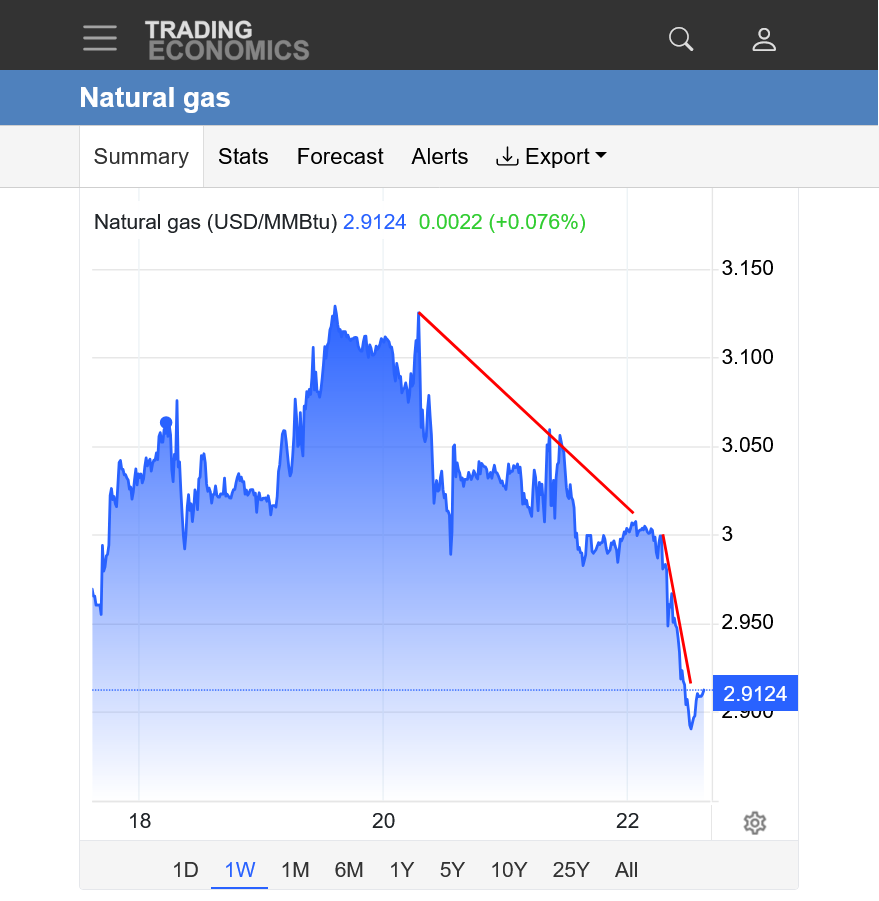
https://tradingeconomics.com/commodity/natural-gas
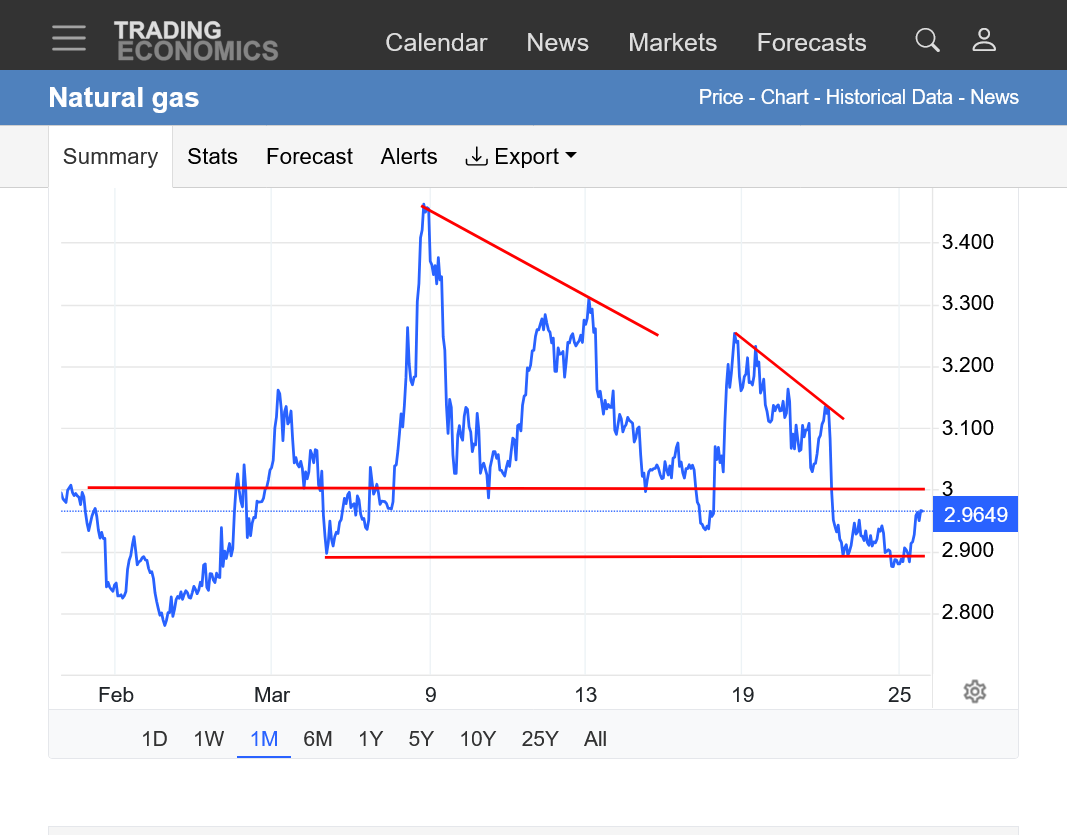
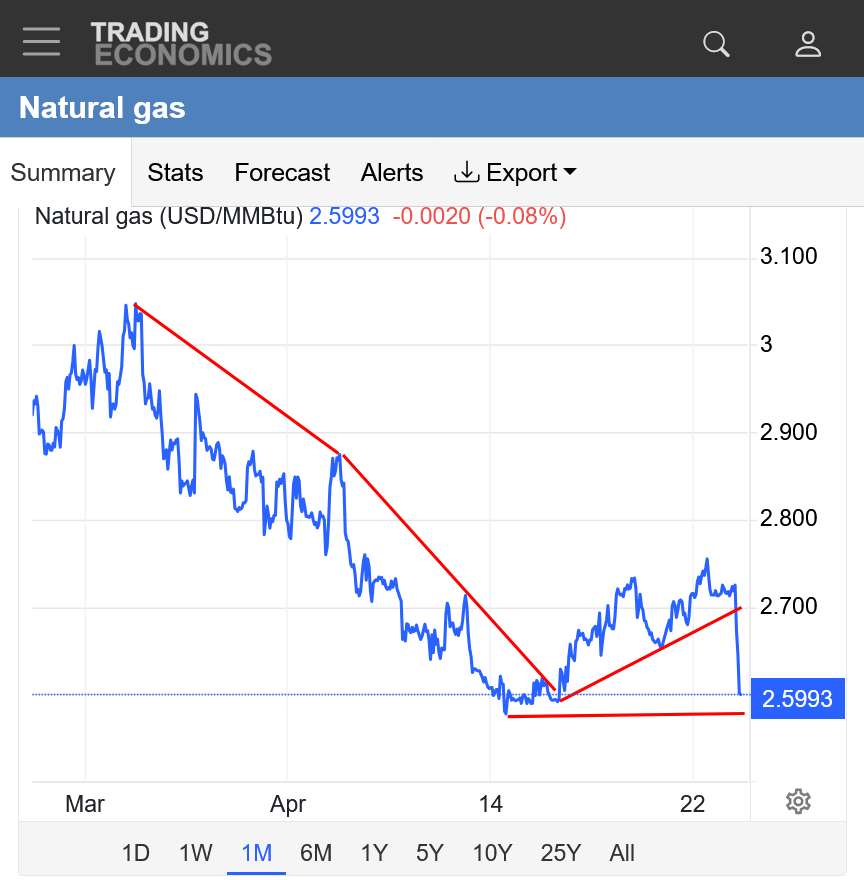
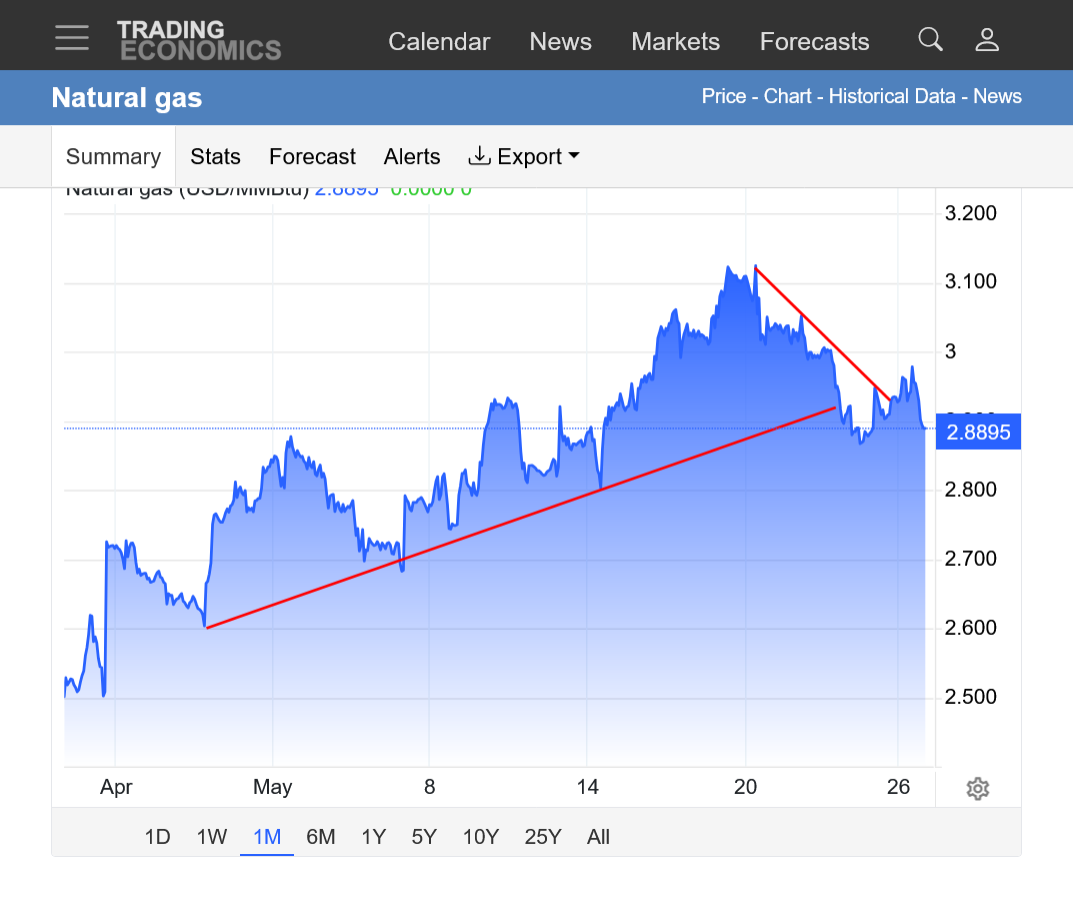
1. 1 month: The natural gas spike higher from the war was pretty wimpy compared to crude and has been in a downtrend after the initial high. Potentially breaking out to the down side of a descending triangle/wedge.
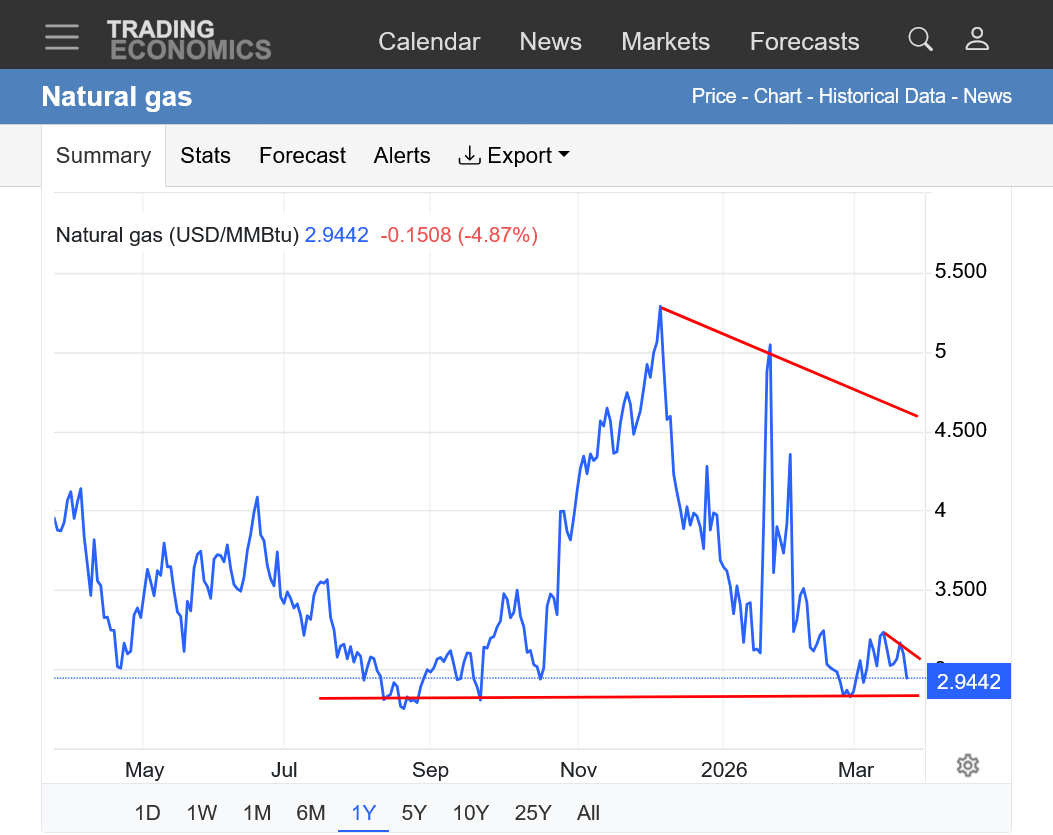
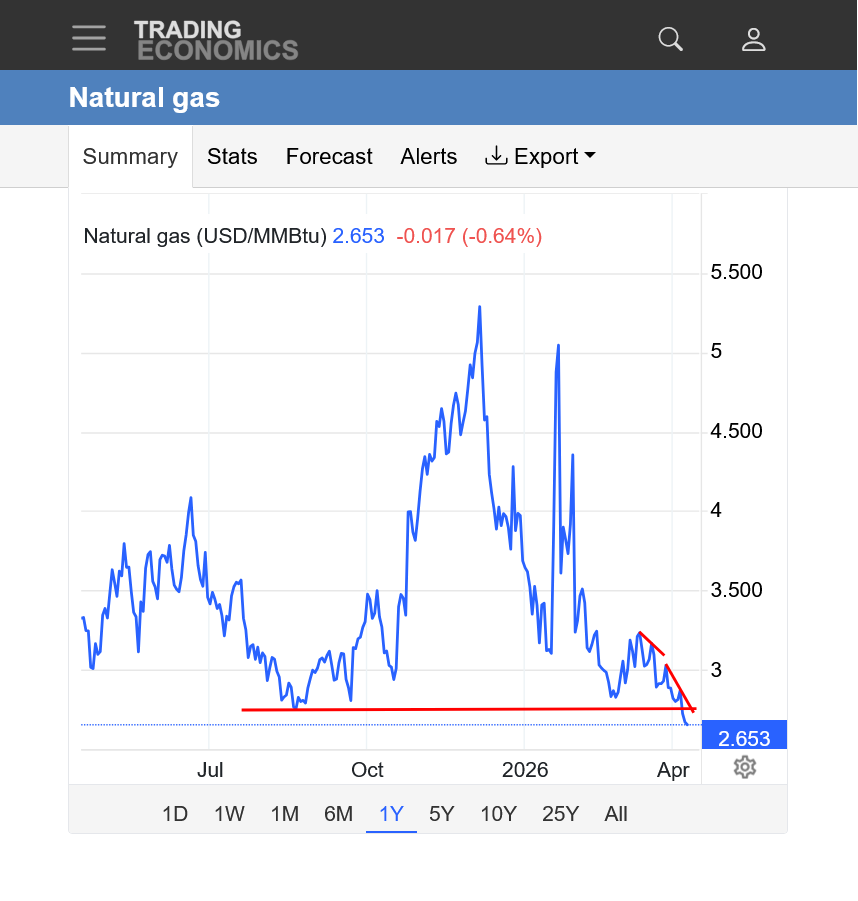
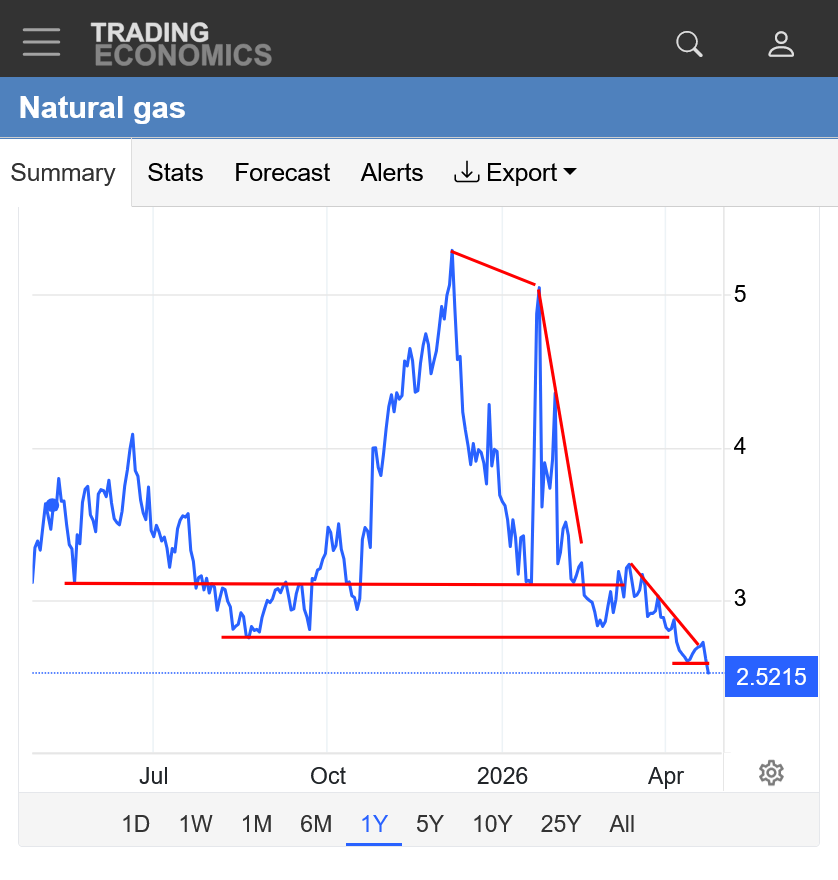
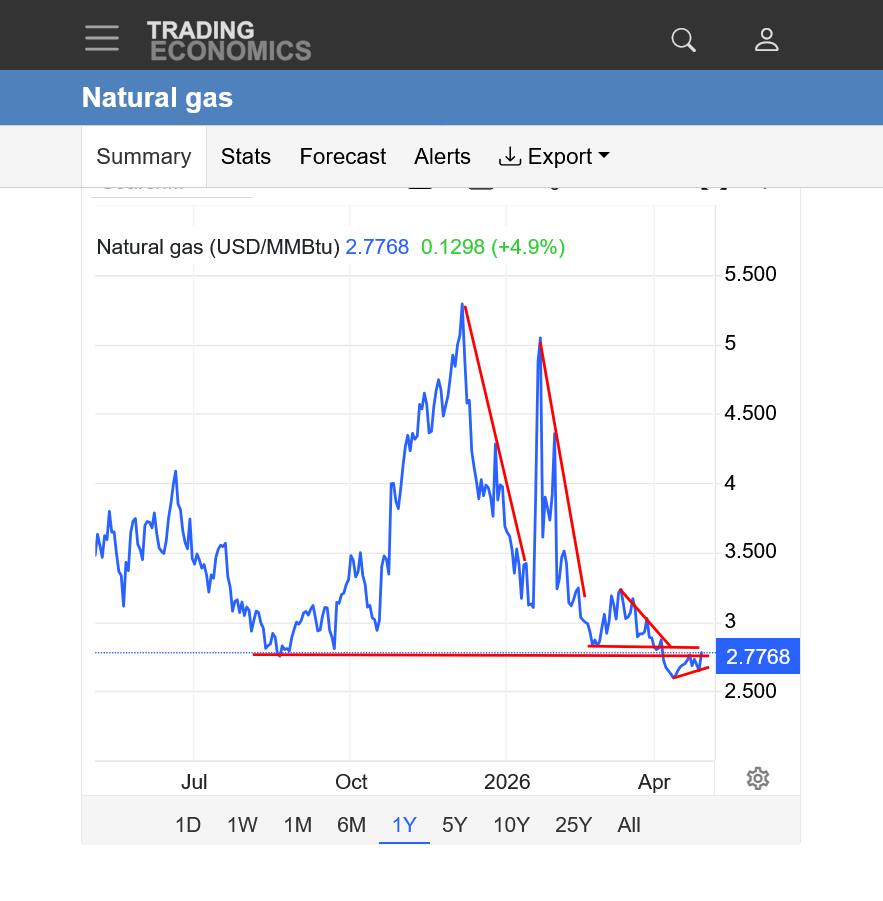
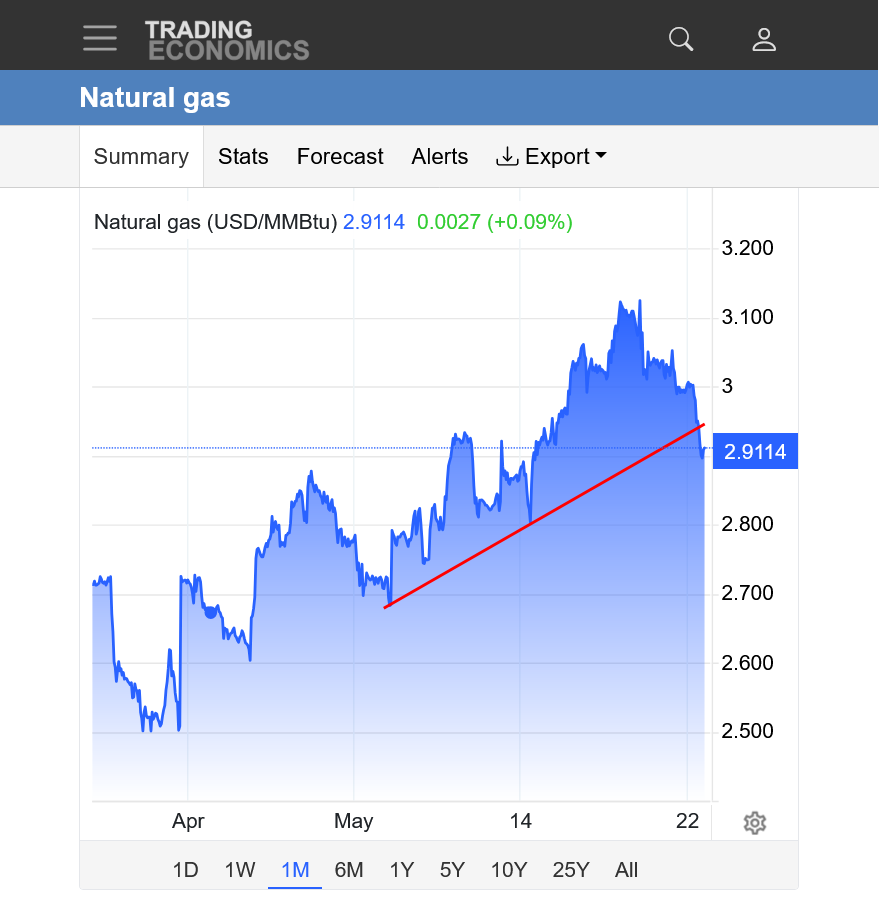
2. 1 year: Wimpy blip higher from the unjustified Netanyahu/Trump war. We're at MEGA support right now and seasonals turn extremely positive for the next 2 months. NEWS is dominating so many markets right now and NG has been 1 of them(muted compared to crude) but its still extraordinarily dangerous to trade at this point in time.
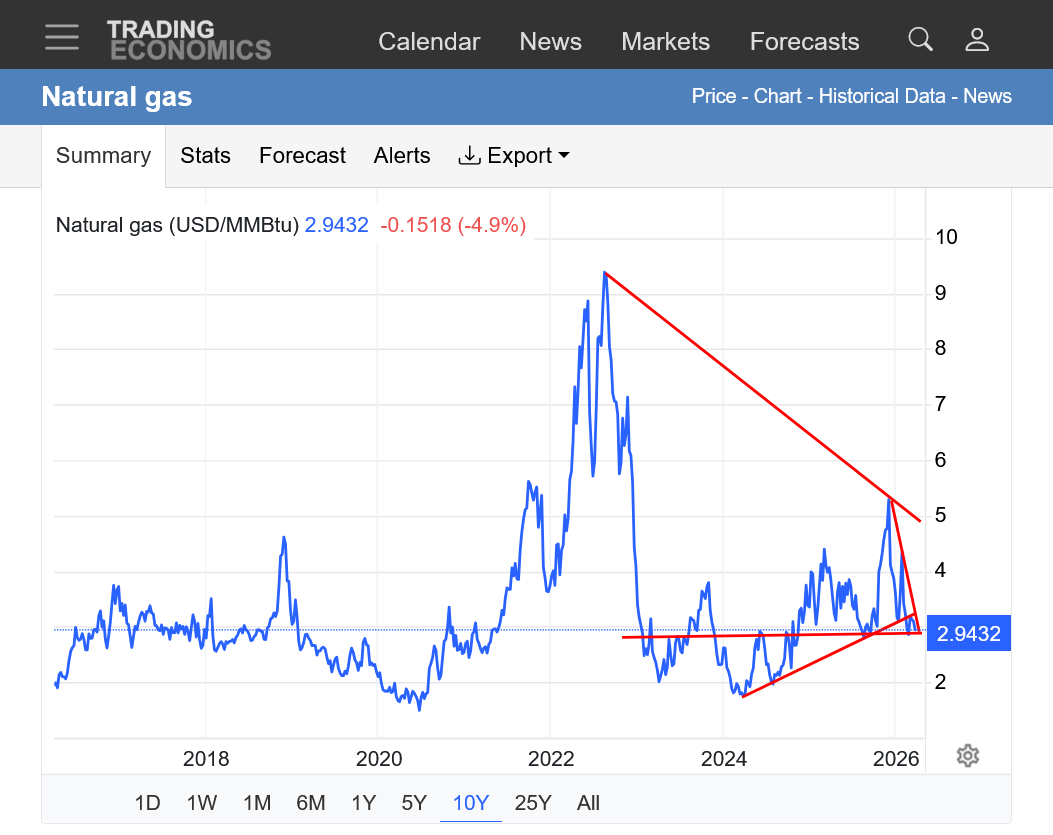
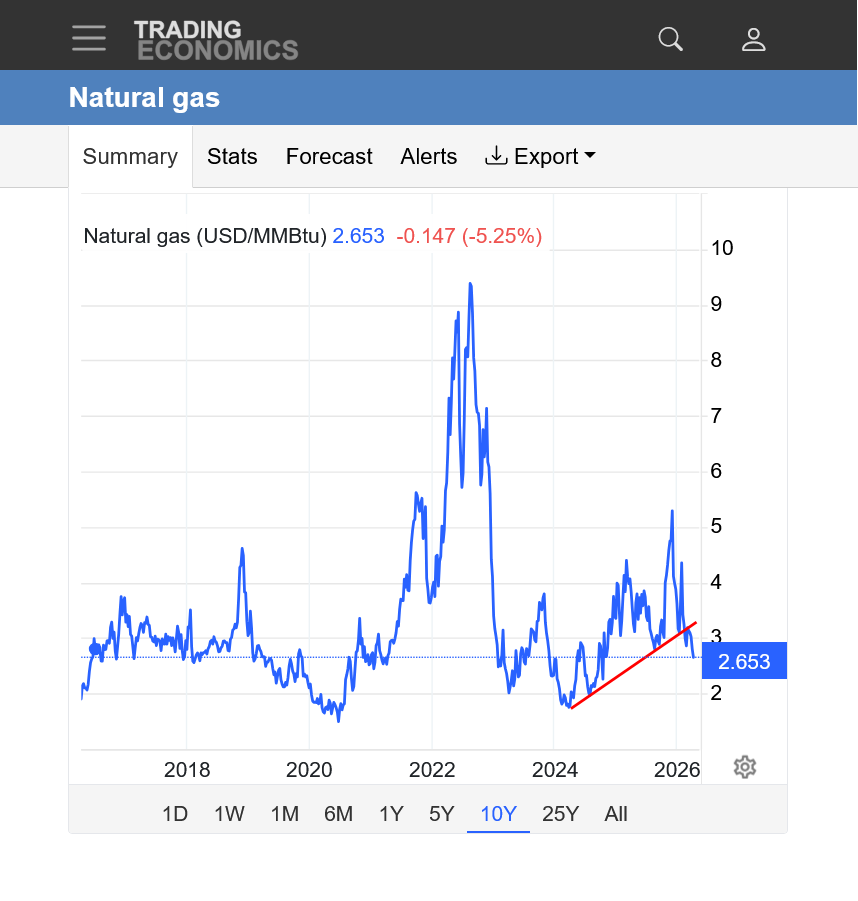
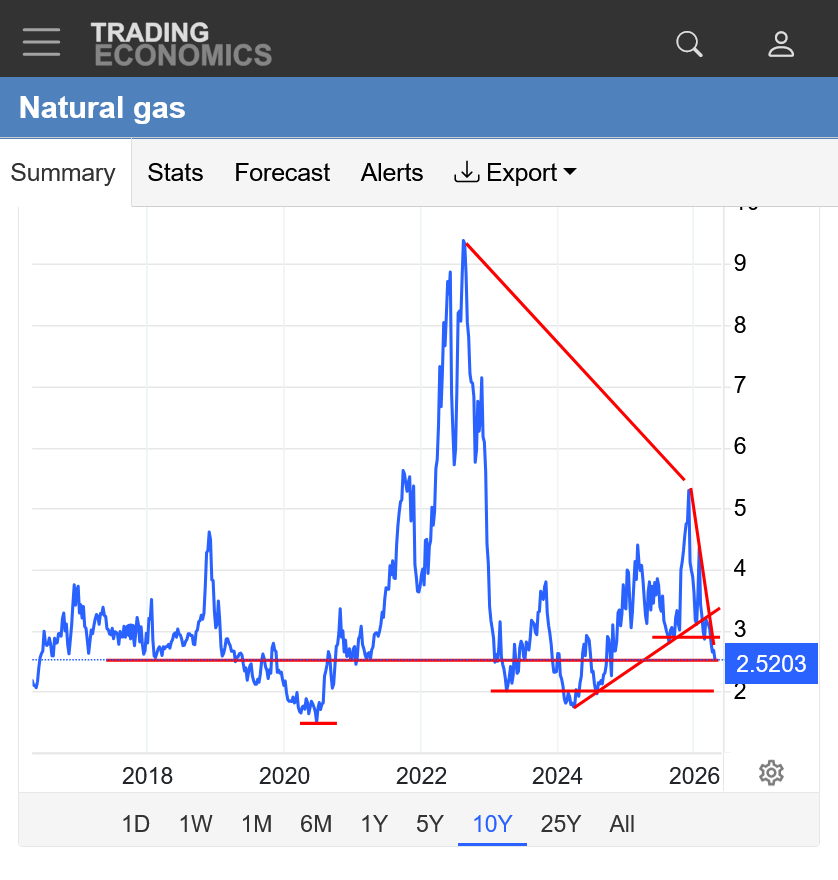
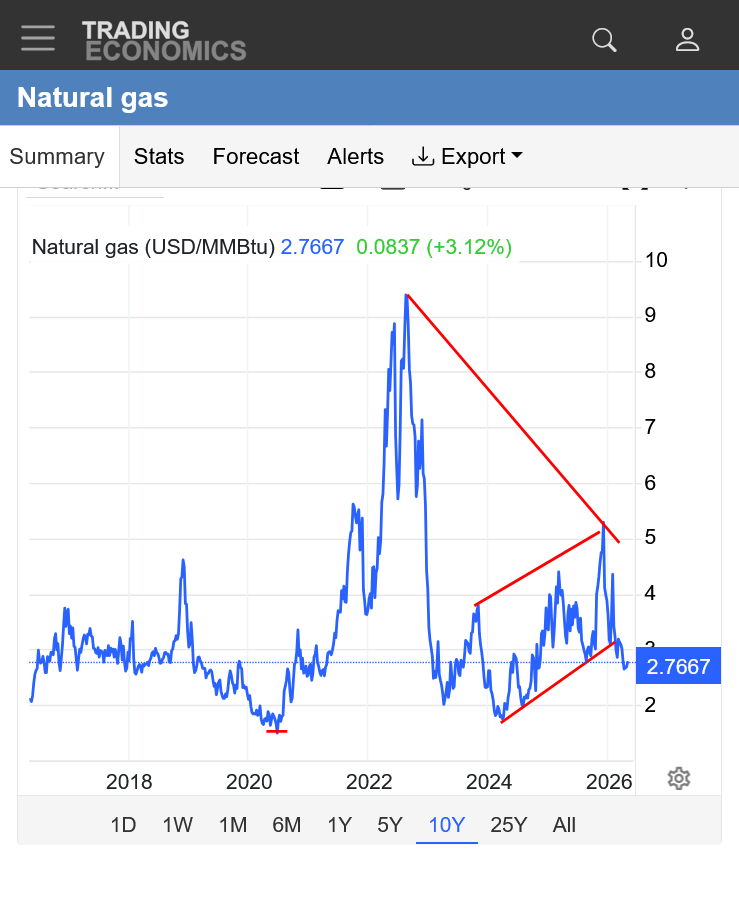
3. 10 years: We can draw all sorts of lines. 2 of them make a symmetrical triangle(lower highs and higher lows) that we might be breaking out to the downside from. Or this could be breaking out of a descending wedge/triangle. There are 2 different downtrending lines. 1 longer term from the 2022 extreme high and the other one with an extreme downward slope from the spike high earlier this year(from the extreme cold blast).
This can be an excellent market to trade weather NEWS, if you put on your position before the market reacts. Best time to do that is November-February, during the main heating season when residential demand gobbles up the most ng BY A WIDE MARGIN compared to any other time of the year. We're at the tail end of the heating season now and the weather traders don't care much about the HDD forecasts anymore. However, seasonal bottoms almost always take place in this time frame out to early April.
++++++++++++++++++++
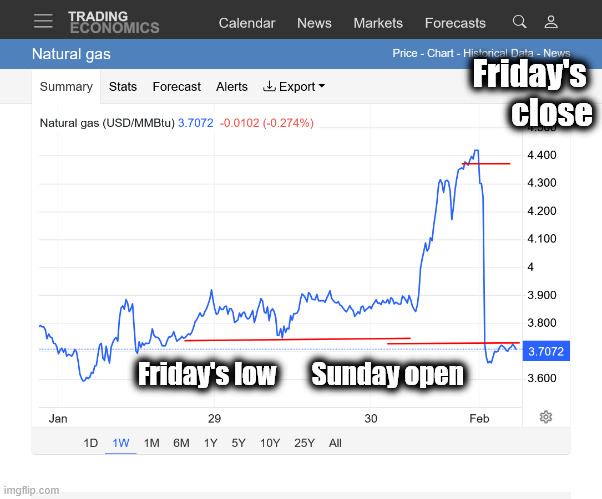
This was the spike up/ from that frigid air mass earlier this year, followed by an incredible spike lower on Sunday night's open. The very frigid forecast on Friday, caused in incredible spike higher(blow off top) then turned MUCH milder over the weekend and we gap opened almost $7,000/contract lower on Sunday night.
This was unprecedented, even for natural gas.
By metmike - Feb. 2, 2026, 1:49 a.m.
By metmike - Feb. 1, 2026, 10:51 p.m.
1. Top line was Friday's close = +$5,000/contract
2. 2nd line was Friday's low
3. 3rd line was Sunday's open and high, -$6,000/contract. The space between the 2nd and 3rd line was/is a downside break away gap.
After immediately spiking to -$7,200/contract shortly after the open, we fought back up close to the open, testing the bottom of the gap/high and have fallen back close to mid range as I type.
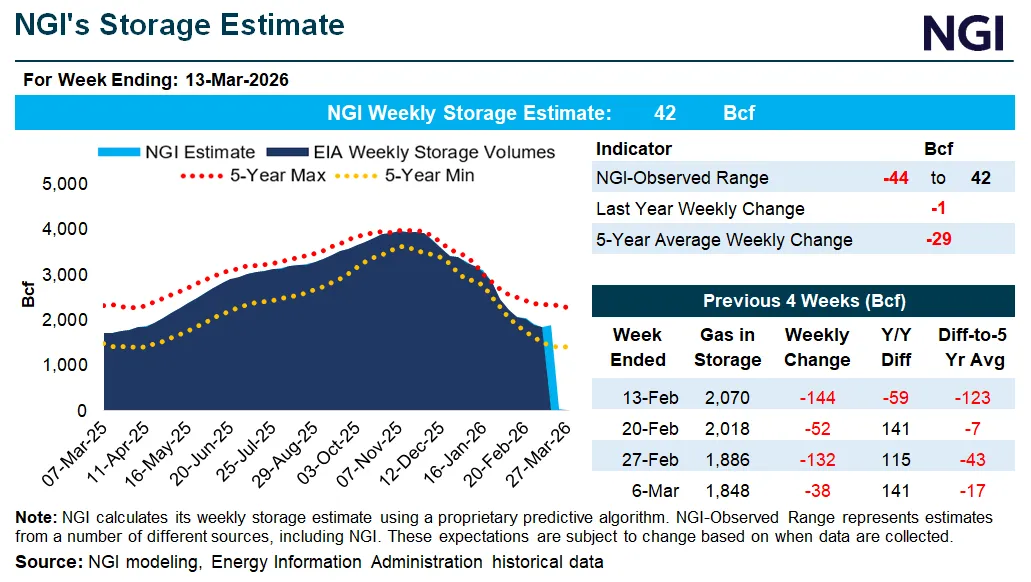
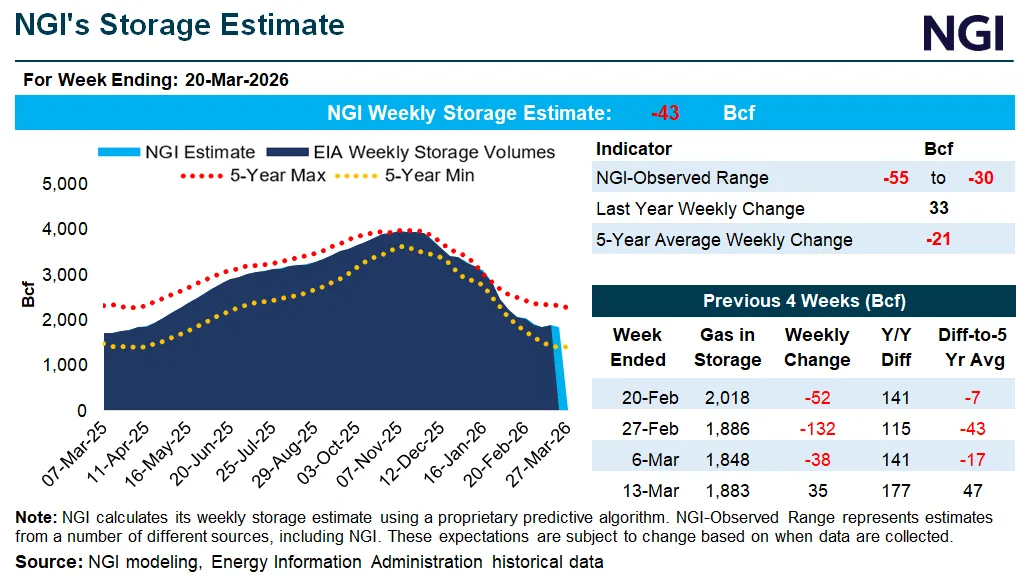
This was last week's EXTREMELY bearish EIA INJECTION!
Note the blue line on the graph turning UP a couple of weeks earlier than the seasonal bottom of the 5 year average gray line! Also crossing over/above that 5 year average for the first time in the last several weeks. Stocks are also +177 Bcf compared to last year. This is why the current price is below $3 and at the lows of the last year.
![]()
for week ending March 13, 2026 | Released: March 19, 2026 at 10:30 a.m. | Next Release: March 26, 2026
| Working gas in underground storage, Lower 48 states Summary text CSV JSN | |||||||||||||||||||||||||
|---|---|---|---|---|---|---|---|---|---|---|---|---|---|---|---|---|---|---|---|---|---|---|---|---|---|
| Historical Comparisons | |||||||||||||||||||||||||
| Stocks billion cubic feet (Bcf) | Year ago (03/13/25) | 5-year average (2021-25) | |||||||||||||||||||||||
| Region | 03/13/26 | 03/06/26 | net change | implied flow | Bcf | % change | Bcf | % change | |||||||||||||||||
| East | 302 | 294 | 8 | 8 | 297 | 1.7 | 338 | -10.7 | |||||||||||||||||
| Midwest | 374 | 375 | -1 | -1 | 367 | 1.9 | 431 | -13.2 | |||||||||||||||||
| Mountain | 201 | 200 | 1 | 1 | 165 | 21.8 | 124 | 62.1 | |||||||||||||||||
| Pacific | 258 | 259 | -1 | -1 | 193 | 33.7 | 167 | 54.5 | |||||||||||||||||
| South Central | 747 | 721 | 26 | 26 | 684 | 9.2 | 777 | -3.9 | |||||||||||||||||
| Salt | 192 | 177 | 15 | 15 | 178 | 7.9 | 220 | -12.7 | |||||||||||||||||
| Nonsalt | 555 | 544 | 11 | 11 | 507 | 9.5 | 558 | -0.5 | |||||||||||||||||
| Total | 1,883 | 1,848 | 35 | 35 | 1,706 | 10.4 | 1,836 | 2.6 | |||||||||||||||||
| Totals may not equal sum of components because of independent rounding. | |||||||||||||||||||||||||
Working gas in storage was 1,883 Bcf as of Friday, March 13, 2026, according to EIA estimates. This represents a net increase of 35 Bcf from the previous week. Stocks were 177 Bcf higher than last year at this time and 47 Bcf above the five-year average of 1,836 Bcf. At 1,883 Bcf, total working gas is within the five-year historical range.
For information on sampling error in this report, see Estimated Measures of Sampling Variability table below.

Note: The shaded area indicates the range between the historical minimum and maximum values for the weekly series from 2021 through 2025. The dashed vertical lines indicate current and year-ago weekly periods.
A seasonal low typically occurs in this time frame into April. Every year is different.
https://tradingeconomics.com/commodity/natural-gas
1. 1 month: I should have drawn another line of support on this chart just below 2.8.
++++++++++++++++++++++
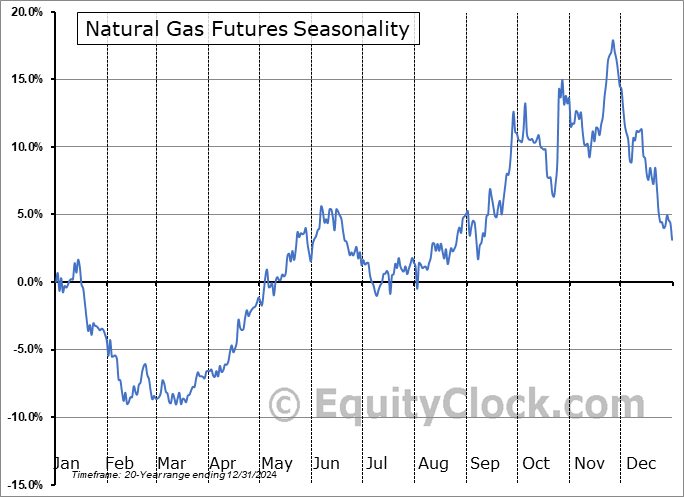
Don't be short natural gas from late March thru May without a real good reason!
https://charts.equityclock.com/natural-gas-futures-ng-seasonal-chart
++++++++++++
RECORD HEAT in the southwest. Chilly Midwest to East. Not as bearish as last weeks unusually large INJECTION for so early in the year from the beneficial warmth in those locations with high population density reducing the heating demand from burning natural gas.
This latest report should actually be bullish vs average for mid March.
https://www.cpc.ncep.noaa.gov/products/tanal/temp_analyses.php
Natural gas futures edged higher Wednesday, reversing earlier losses as Tehran’s rejection of a U.S. peace plan kept war risks in play, with LNG feed gas demand and bullish storage expectations also supporting prices.
Yesterday’s EIA release was slightly bullish vs avg guesses due to a slightly larger than expected pull of -54 vs The Desk’s survey /median guess of -45 to -47. As Mike noted earlier in the week, this draw was aided by an unusual combo of higher than avg cold driven HDD in the E half of the US and unusually high heat driven CDD in the SW. Compare this -54 to the very bearish +35 of the prior release due to widespread E US strong warm anomalies:
for week ending March 20, 2026 | Released: March 26, 2026 at 10:30 a.m. | Next Release: April 2, 2026
| Working gas in underground storage, Lower 48 states Summary text CSV JSN | |||||||||||||||||||||||||
|---|---|---|---|---|---|---|---|---|---|---|---|---|---|---|---|---|---|---|---|---|---|---|---|---|---|
| Historical Comparisons | |||||||||||||||||||||||||
| Stocks billion cubic feet (Bcf) | Year ago (03/20/25) | 5-year average (2021-25) | |||||||||||||||||||||||
| Region | 03/20/26 | 03/13/26 | net change | implied flow | Bcf | % change | Bcf | % change | |||||||||||||||||
| East | 271 | 302 | -31 | -31 | 298 | -9.1 | 323 | -16.1 | |||||||||||||||||
| Midwest | 351 | 374 | -23 | -23 | 367 | -4.4 | 415 | -15.4 | |||||||||||||||||
| Mountain | 204 | 201 | 3 | 3 | 163 | 25.2 | 122 | 67.2 | |||||||||||||||||
| Pacific | 257 | 258 | -1 | -1 | 192 | 33.9 | 167 | 53.9 | |||||||||||||||||
| South Central | 745 | 747 | -2 | -2 | 720 | 3.5 | 787 | -5.3 | |||||||||||||||||
| Salt | 197 | 192 | 5 | 5 | 199 | -1.0 | 227 | -13.2 | |||||||||||||||||
| Nonsalt | 549 | 555 | -6 | -6 | 521 | 5.4 | 561 | -2.1 | |||||||||||||||||
| Total | 1,829 | 1,883 | -54 | -54 | 1,739 | 5.2 | 1,815 | 0.8 | |||||||||||||||||
| Totals may not equal sum of components because of independent rounding. | |||||||||||||||||||||||||
Working gas in storage was 1,829 Bcf as of Friday, March 20, 2026, according to EIA estimates. This represents a net decrease of 54 Bcf from the previous week. Stocks were 90 Bcf higher than last year at this time and 14 Bcf above the five-year average of 1,815 Bcf. At 1,829 Bcf, total working gas is within the five-year historical range.
For information on sampling error in this report, see Estimated Measures of Sampling Variability table below.
Excellent post, Larry! I was meaning to post this a dozen times yesterday but was so focused tracking the weather and following the CL and stock market and the latest on this war and NG is NOT trading weather (and am getting old, quite frankly), while trying to catch up on things at home........that I forgot.
This is great, thanks!
https://tradingeconomics.com/commodity/natural-gas
1. 1 month
2. 1 year
https://www.cpc.ncep.noaa.gov/products/tanal/temp_analyses.php

About as expected!
for week ending March 27, 2026 | Released: April 2, 2026 at 10:30 a.m. | Next Release: April 9, 2026
| Working gas in underground storage, Lower 48 states Summary text CSV JSN | |||||||||||||||||||||||||
|---|---|---|---|---|---|---|---|---|---|---|---|---|---|---|---|---|---|---|---|---|---|---|---|---|---|
| Historical Comparisons | |||||||||||||||||||||||||
| Stocks billion cubic feet (Bcf) | Year ago (03/27/25) | 5-year average (2021-25) | |||||||||||||||||||||||
| Region | 03/27/26 | 03/20/26 | net change | implied flow | Bcf | % change | Bcf | % change | |||||||||||||||||
| East | 270 | 271 | -1 | -1 | 286 | -5.6 | 312 | -13.5 | |||||||||||||||||
| Midwest | 350 | 351 | -1 | -1 | 364 | -3.8 | 404 | -13.4 | |||||||||||||||||
| Mountain | 208 | 204 | 4 | 4 | 165 | 26.1 | 122 | 70.5 | |||||||||||||||||
| Pacific | 258 | 257 | 1 | 1 | 201 | 28.4 | 171 | 50.9 | |||||||||||||||||
| South Central | 779 | 745 | 34 | 34 | 753 | 3.5 | 800 | -2.6 | |||||||||||||||||
| Salt | 214 | 197 | 17 | 17 | 216 | -0.9 | 234 | -8.5 | |||||||||||||||||
| Nonsalt | 565 | 549 | 16 | 16 | 538 | 5.0 | 566 | -0.2 | |||||||||||||||||
| Total | 1,865 | 1,829 | 36 | 36 | 1,769 | 5.4 | 1,811 | 3.0 | |||||||||||||||||
| Totals may not equal sum of components because of independent rounding. | |||||||||||||||||||||||||
Working gas in storage was 1,865 Bcf as of Friday, March 27, 2026, according to EIA estimates. This represents a net increase of 36 Bcf from the previous week. Stocks were 96 Bcf higher than last year at this time and 54 Bcf above the five-year average of 1,811 Bcf. At 1,865 Bcf, total working gas is within the five-year historical range.
For information on sampling error in this report, see Estimated Measures of Sampling Variability table below.
Unseasonable warmth across much of the country. Cold along the Canadian border. Bearish from reduced residential heating demand.
https://www.cpc.ncep.noaa.gov/products/tanal/temp_analyses.php

+++++++++++++++++
Note the blue line on the graph below is moving ABOVE the 5 year average! Storage is building a bit EARLIER than average from the very warm temps.
![]()
for week ending April 3, 2026 | Released: April 9, 2026 at 10:30 a.m. | Next Release: April 16, 2026
| Working gas in underground storage, Lower 48 states Summary text CSV JSN | |||||||||||||||||||||||||
|---|---|---|---|---|---|---|---|---|---|---|---|---|---|---|---|---|---|---|---|---|---|---|---|---|---|
| Historical Comparisons | |||||||||||||||||||||||||
| Stocks billion cubic feet (Bcf) | Year ago (04/03/25) | 5-year average (2021-25) | |||||||||||||||||||||||
| Region | 04/03/26 | 03/27/26 | net change | implied flow | Bcf | % change | Bcf | % change | |||||||||||||||||
| East | 277 | 270 | 7 | 7 | 294 | -5.8 | 308 | -10.1 | |||||||||||||||||
| Midwest | 358 | 350 | 8 | 8 | 372 | -3.8 | 400 | -10.5 | |||||||||||||||||
| Mountain | 208 | 208 | 0 | 0 | 165 | 26.1 | 123 | 69.1 | |||||||||||||||||
| Pacific | 261 | 258 | 3 | 3 | 205 | 27.3 | 174 | 50.0 | |||||||||||||||||
| South Central | 807 | 775 | R | 32 | 32 | 785 | 2.8 | 817 | -1.2 | ||||||||||||||||
| Salt | 226 | 210 | R | 16 | 16 | 231 | -2.2 | 241 | -6.2 | ||||||||||||||||
| Nonsalt | 581 | 565 | 16 | 16 | 555 | 4.7 | 576 | 0.9 | |||||||||||||||||
| Total | 1,911 | 1,861 | R | 50 | 50 | 1,822 | 4.9 | 1,824 | 4.8 | ||||||||||||||||
| Totals may not equal sum of components because of independent rounding. R=Revised. The reported revision caused the stocks for March 27, 2026 to change from 1,865 Bcf to 1,861 Bcf. As a result, the implied net change between the weeks ending March 20 and March 27 changed from 36 Bcf to 32 Bcf. | |||||||||||||||||||||||||
Working gas in storage was 1,911 Bcf as of Friday, April 3, 2026, according to EIA estimates. This represents a net increase of 50 Bcf from the previous week. Stocks were 89 Bcf higher than last year at this time and 87 Bcf above the five-year average of 1,824 Bcf. At 1,911 Bcf, total working gas is within the five-year historical range.
For information on sampling error in this report, see Estimated Measures of Sampling Variability table below.
Note: The shaded area indicates the range between the historical minimum and maximum values for the weekly series from 2021 through 2025. The dashed vertical lines indicate current and year-ago weekly periods.
The price dropping this far is a bit of a surprise to me. NG is clearly NOT following the liquid energies.
I feel that we are seeing a downside washout/exhaustion, putting in major lows that almost always happen at the end of Winter to early Spring.
In this case, the low is coming in a bit late, possibly from the very warm end to the heating season which started the injection season early and with some robust injections.
https://tradingeconomics.com/commodity/natural-gas
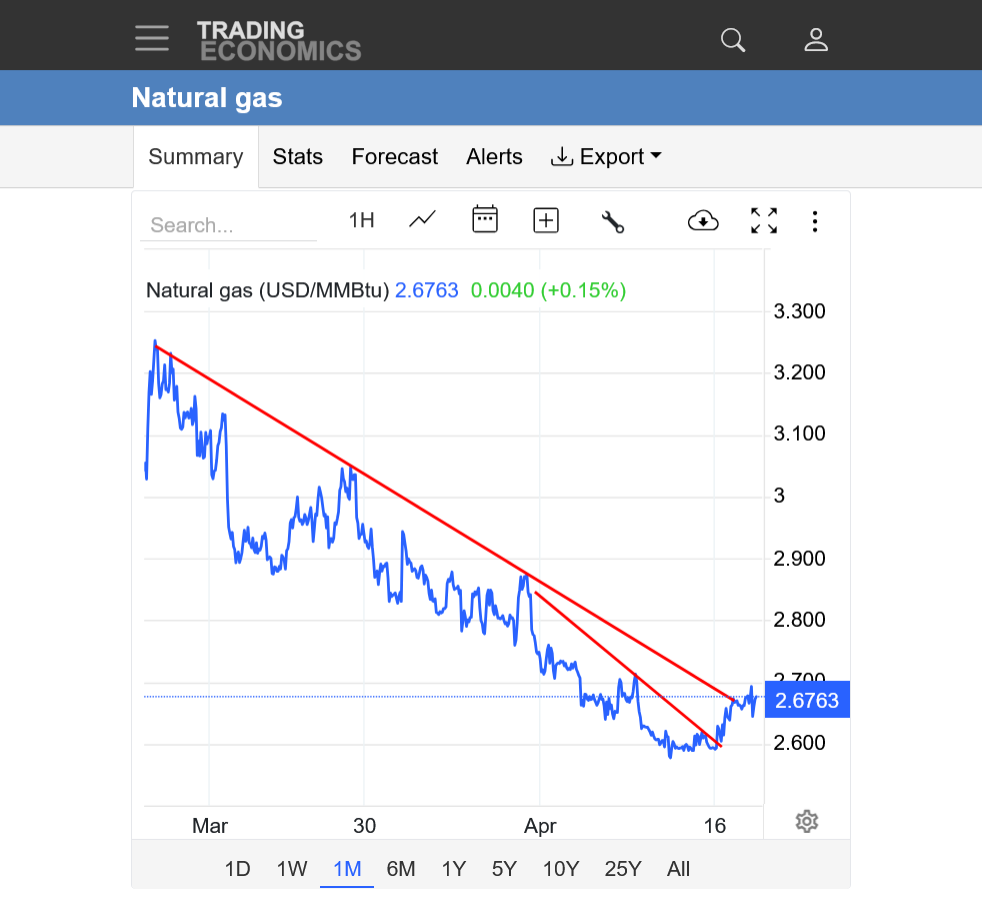
1. 1 month: Powerful downtrend that is actually accelerating a bit.
2. 1 year: Downside break out. 2 massive upside spikes higher this past Winter.
3. 10 years Downside break out.
+++++++++++++++++++
It would be extremely rare for us to continue spiking down like this much longer considering the powerful positive seasonal between now and the start of June.
https://charts.equityclock.com/natural-gas-futures-ng-seasonal-chart
MetMike
From a cycle point of view, this week will mark the 26th week from last weekly low, thus totally within weekly cycle time frame. Moreover, the daily cycle should also bottom within this week, as it is 42 days into its daily cycle, thus "ripe" for a low.
Look to buy tu-wed!! (Fireworks Monday to cycle low??)
Buying a call at cycle low timeframe "could" prove beneficial---just saying!
Thanks, tjc!
Your guess is as good as mine!
The seasonal low is extraordinarily reliable but each year is different. In 2020 for instance it was messed up from COVID which massively cut demand and the low didn't happen until the end of May/start of June.
I don't remember another year like that but could be missing 1. Most of the others featured a distinctive, well defined, spike low/selling exhaustion type pattern, similar to this which marked a significant low that lasted, at least until later in the year.
What can go wrong?
If the war slows down the economy, it can cut industrial demand. Sometimes the NG will trade in sympathy with the liquid energies, as it did briefly after the war broke out from the psychology and speculation that it could stimulate the natural gas exports.
However, a recession is usually very bearish NG prices, with COVID-2020 being the quintessential example.
I don't know this for sure, but these unexpectedly weak ng prices, besides being caused by the robust, early injections from warm weather could be from expectations of a WAE caused recession.
So natural is not reacting directly, like the crude but potentially indirectly.
Warm temperatures coming up are still likely to keep injections high for April.
We opened modestly higher on Sunday Evening, probably in sympathy with the gap higher in crude but have been unable to stay above the open.
We've also been unable to go lower too…..at least not make new lows. I feel that this market is near its low UNLESS the crude supply crisis continues in the Strait of Hormuz.
Instead of trading in sync with crude oil(higher) I feel that a continuation of elevated energy prices WILL cause a US AND global recession that will cause a major drop in industrial demand (2020 was an extreme example of that from COVID).
That gives rise to a more bearish potential, even though I'm leaning in the opposite direction because of the extremely powerful and reliable positive seasonal that is kicking in right now and lasts thru the month of May.
Each year is different. It's not like the suns increasing angle in the sky every Spring, ensuring us that Summer WILL arrive, along with the heat from that more powerful sun.
9am: I forgot to post the graph and will do an updated graph when back in my office later today.
2:30pm: The top line is the modestly higher open on Sunday Night. We tested that and found plenty of traders that still think NG is going lower. We barely held support but closed right on it(bad sign to close near the lows). In the absence of a Donald Trump inflicted recession(chances continue to increase), I feel that we are very close to major lows here.
Looking for a reversal up from new lows this week, possibly today.
![]()
for week ending April 10, 2026 | Released: April 16, 2026 at 10:30 a.m. | Next Release: April 23, 2026
| Working gas in underground storage, Lower 48 states Summary text CSV JSN | |||||||||||||||||||||||||
|---|---|---|---|---|---|---|---|---|---|---|---|---|---|---|---|---|---|---|---|---|---|---|---|---|---|
| Historical Comparisons | |||||||||||||||||||||||||
| Stocks billion cubic feet (Bcf) | Year ago (04/10/25) | 5-year average (2021-25) | |||||||||||||||||||||||
| Region | 04/10/26 | 04/03/26 | net change | implied flow | Bcf | % change | Bcf | % change | |||||||||||||||||
| East | 283 | 277 | 6 | 6 | 291 | -2.7 | 312 | -9.3 | |||||||||||||||||
| Midwest | 371 | 358 | 13 | 13 | 373 | -0.5 | 409 | -9.3 | |||||||||||||||||
| Mountain | 210 | 208 | 2 | 2 | 166 | 26.5 | 124 | 69.4 | |||||||||||||||||
| Pacific | 267 | 261 | 6 | 6 | 212 | 25.9 | 179 | 49.2 | |||||||||||||||||
| South Central | 839 | 807 | 32 | 32 | 802 | 4.6 | 838 | 0.1 | |||||||||||||||||
| Salt | 243 | 226 | 17 | 17 | 241 | 0.8 | 249 | -2.4 | |||||||||||||||||
| Nonsalt | 596 | 581 | 15 | 15 | 561 | 6.2 | 589 | 1.2 | |||||||||||||||||
| Total | 1,970 | 1,911 | 59 | 59 | 1,844 | 6.8 | 1,862 | 5.8 | |||||||||||||||||
| Totals may not equal sum of components because of independent rounding. | |||||||||||||||||||||||||
Working gas in storage was 1,970 Bcf as of Friday, April 10, 2026, according to EIA estimates. This represents a net increase of 59 Bcf from the previous week. Stocks were 126 Bcf higher than last year at this time and 108 Bcf above the five-year average of 1,862 Bcf. At 1,970 Bcf, total working gas is within the five-year historical range.
For information on sampling error in this report, see Estimated Measures of Sampling Variability table below.
Note: The shaded area indicates the range between the historical minimum and maximum values for the weekly series from 2021 through 2025. The dashed vertical lines indicate current and year-ago weekly periods.
Earlier expectations for a MAJOR, seasonal low this week seem to be verifying. However, this could just be a bear flag.
https://tradingeconomics.com/commodity/natural-gas
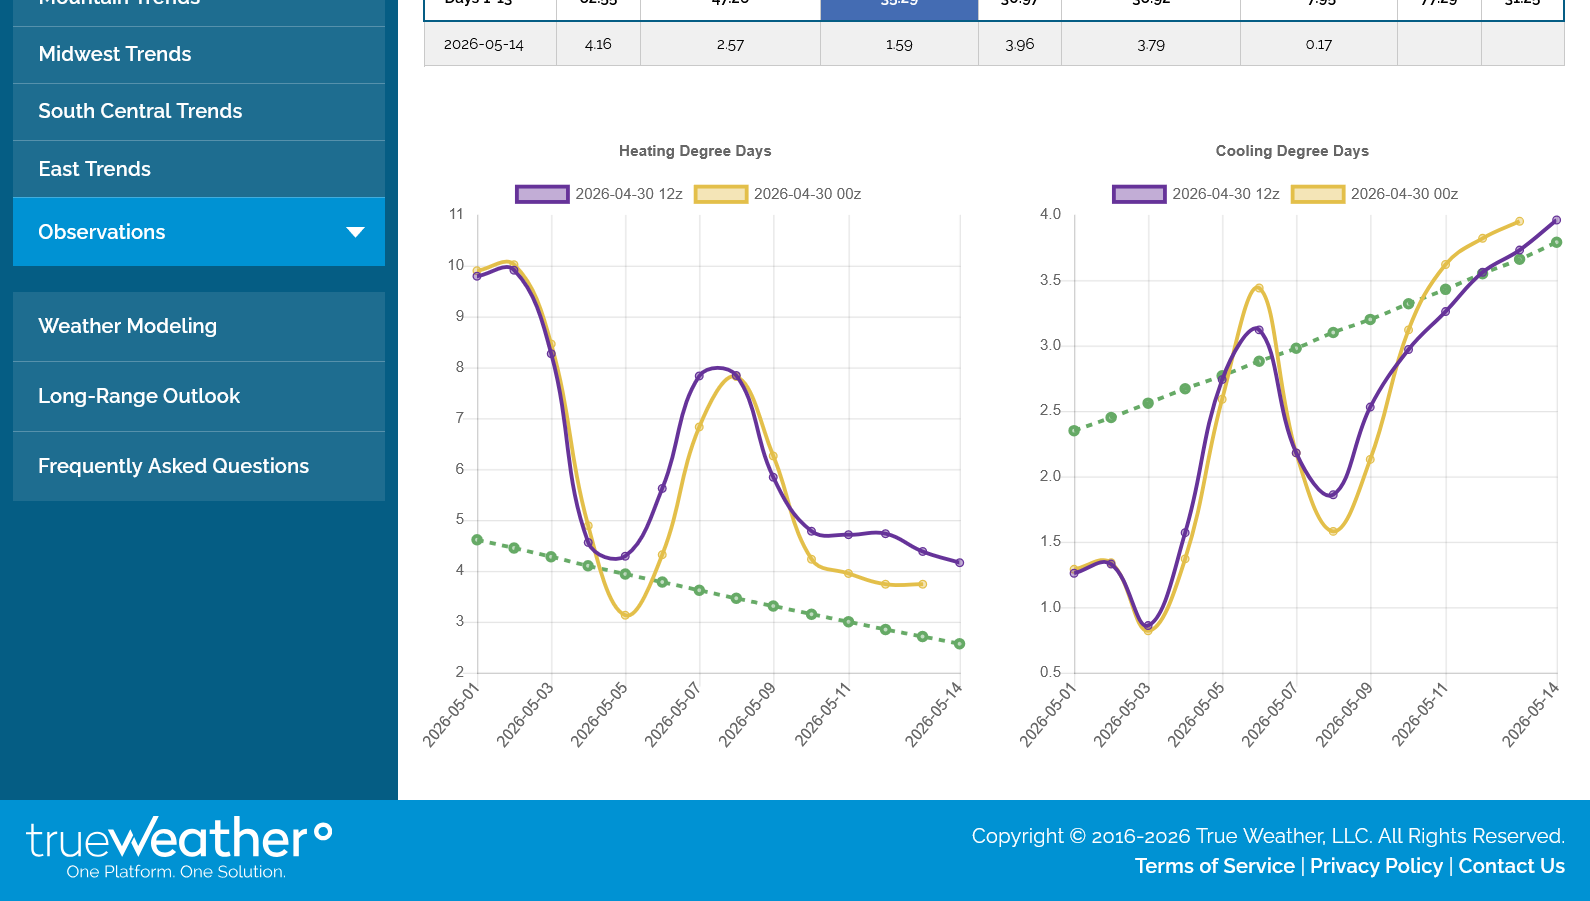
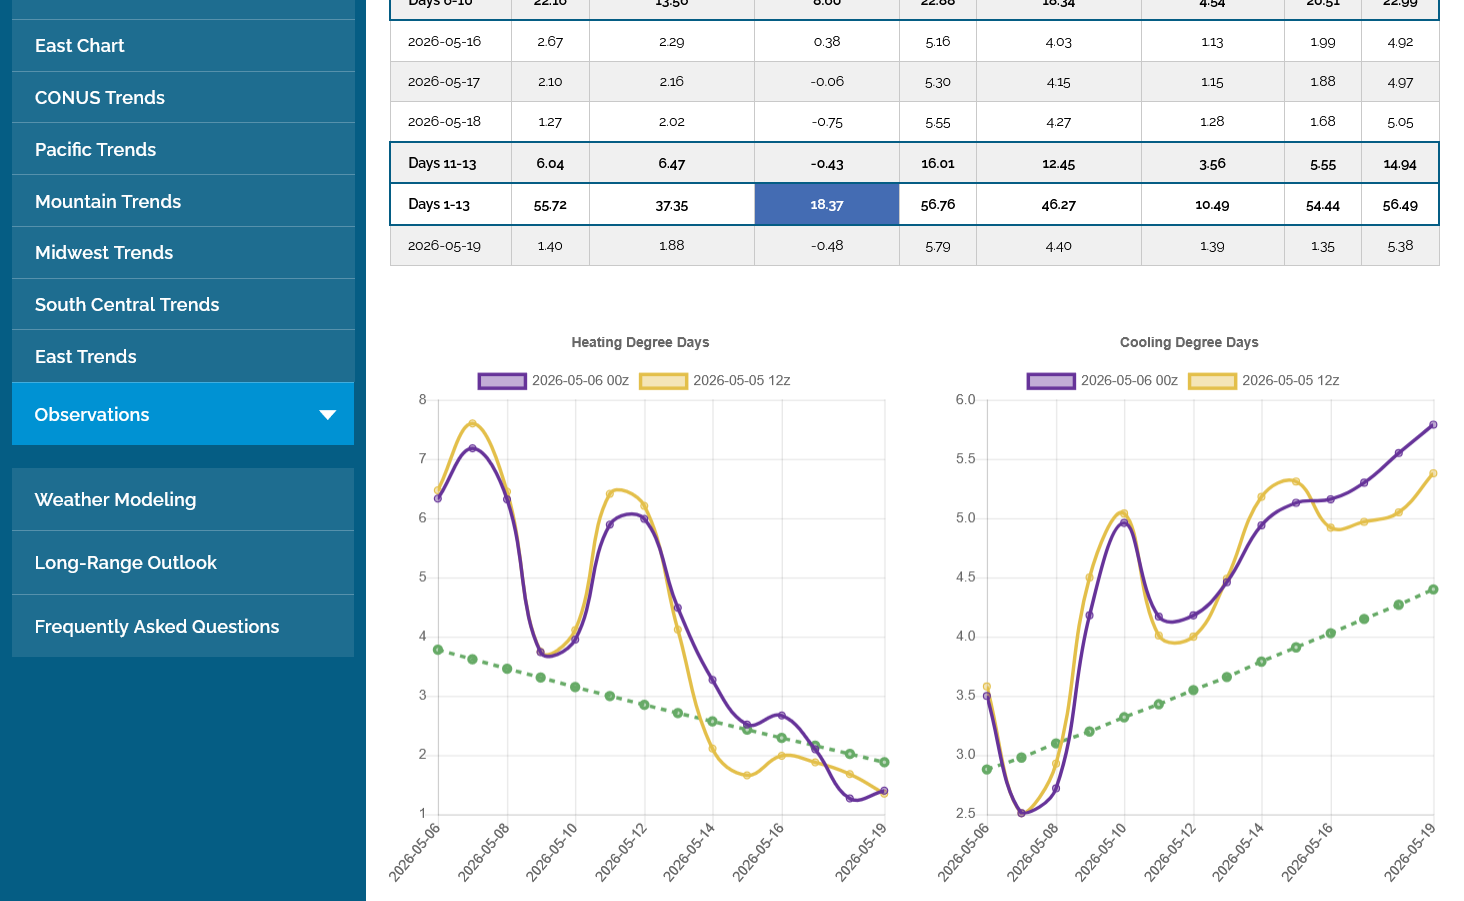
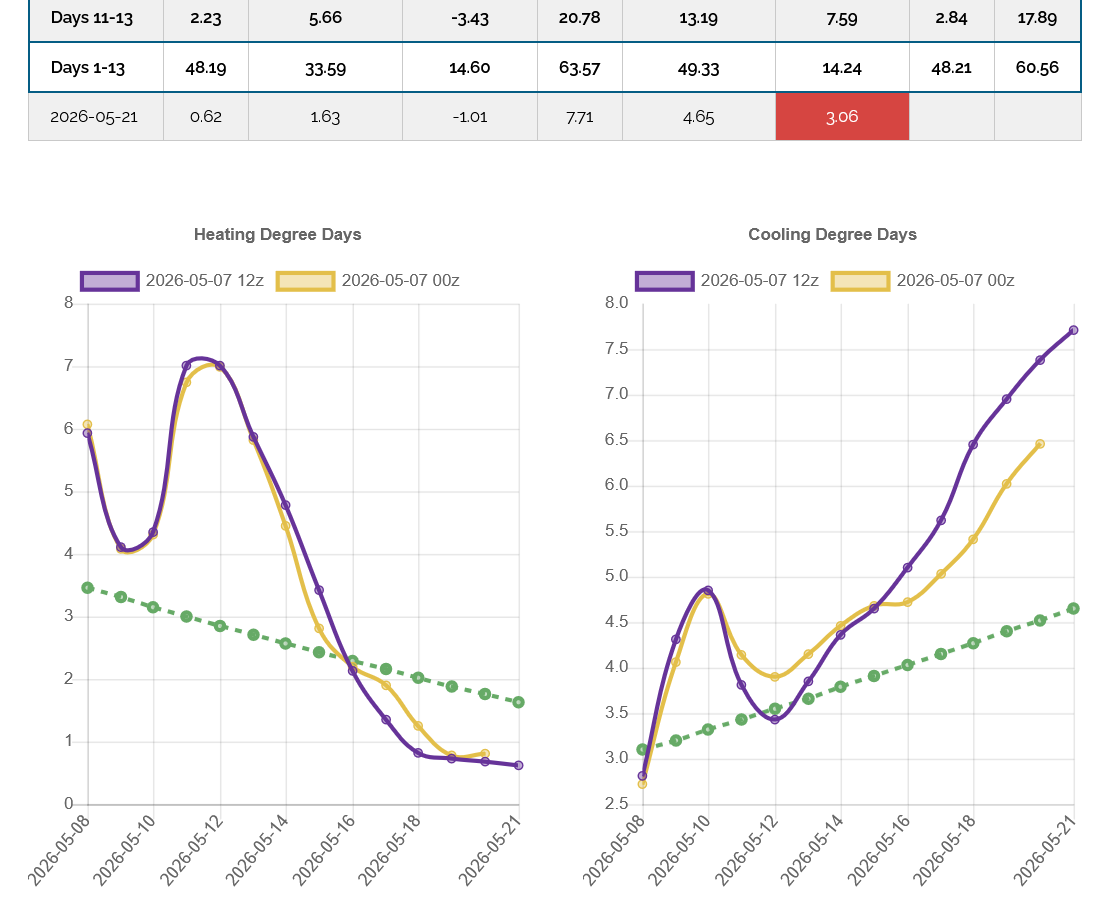
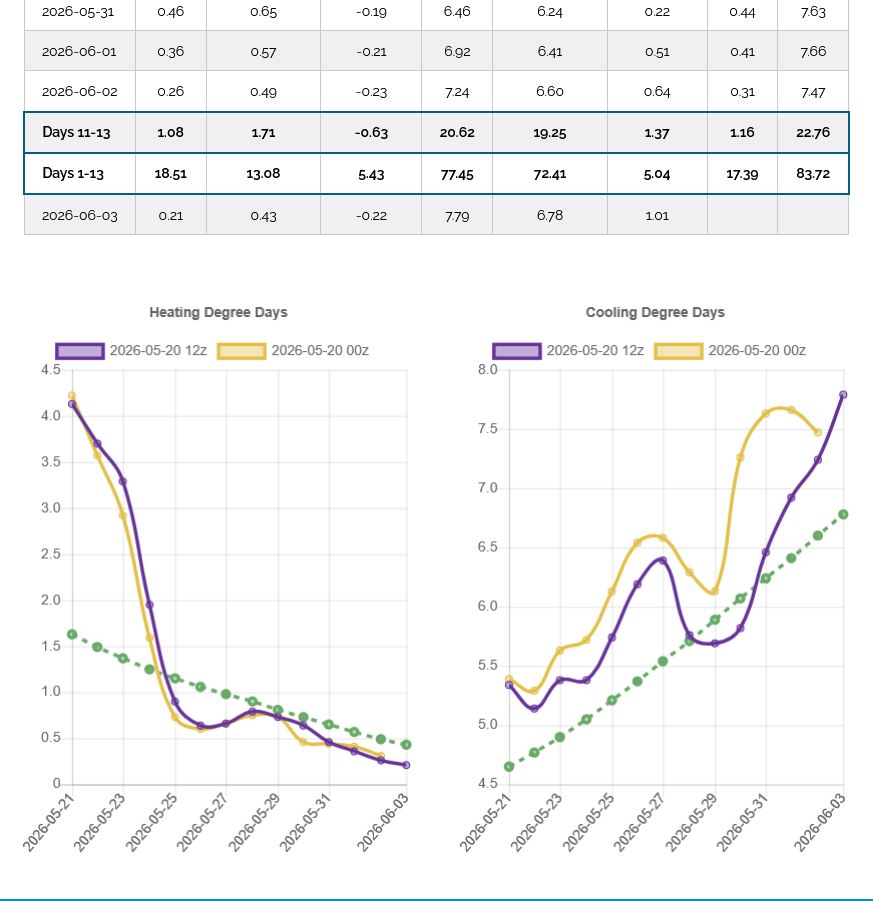
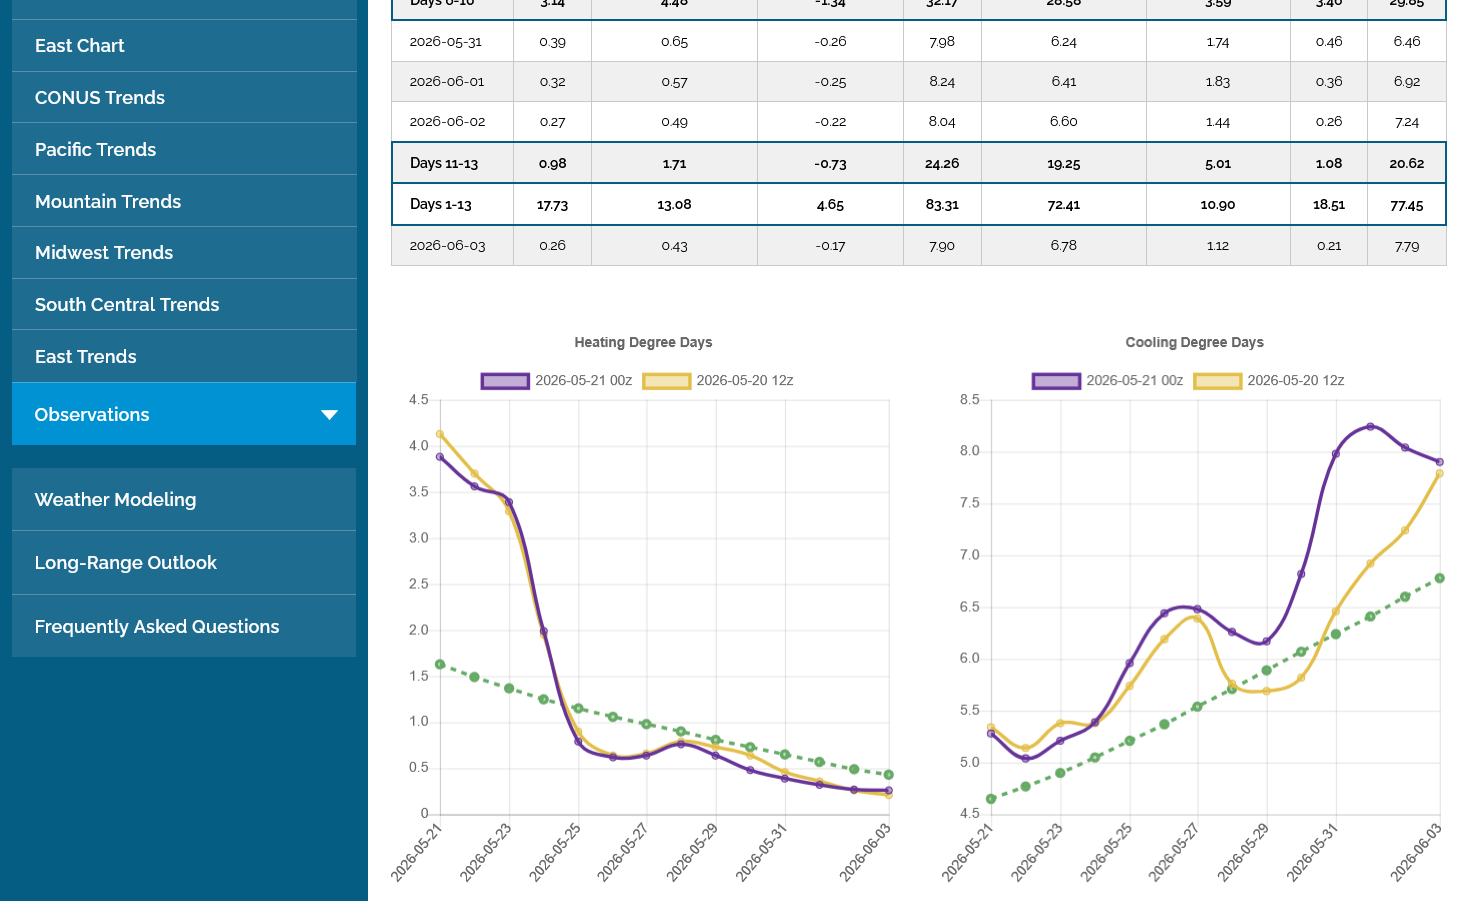
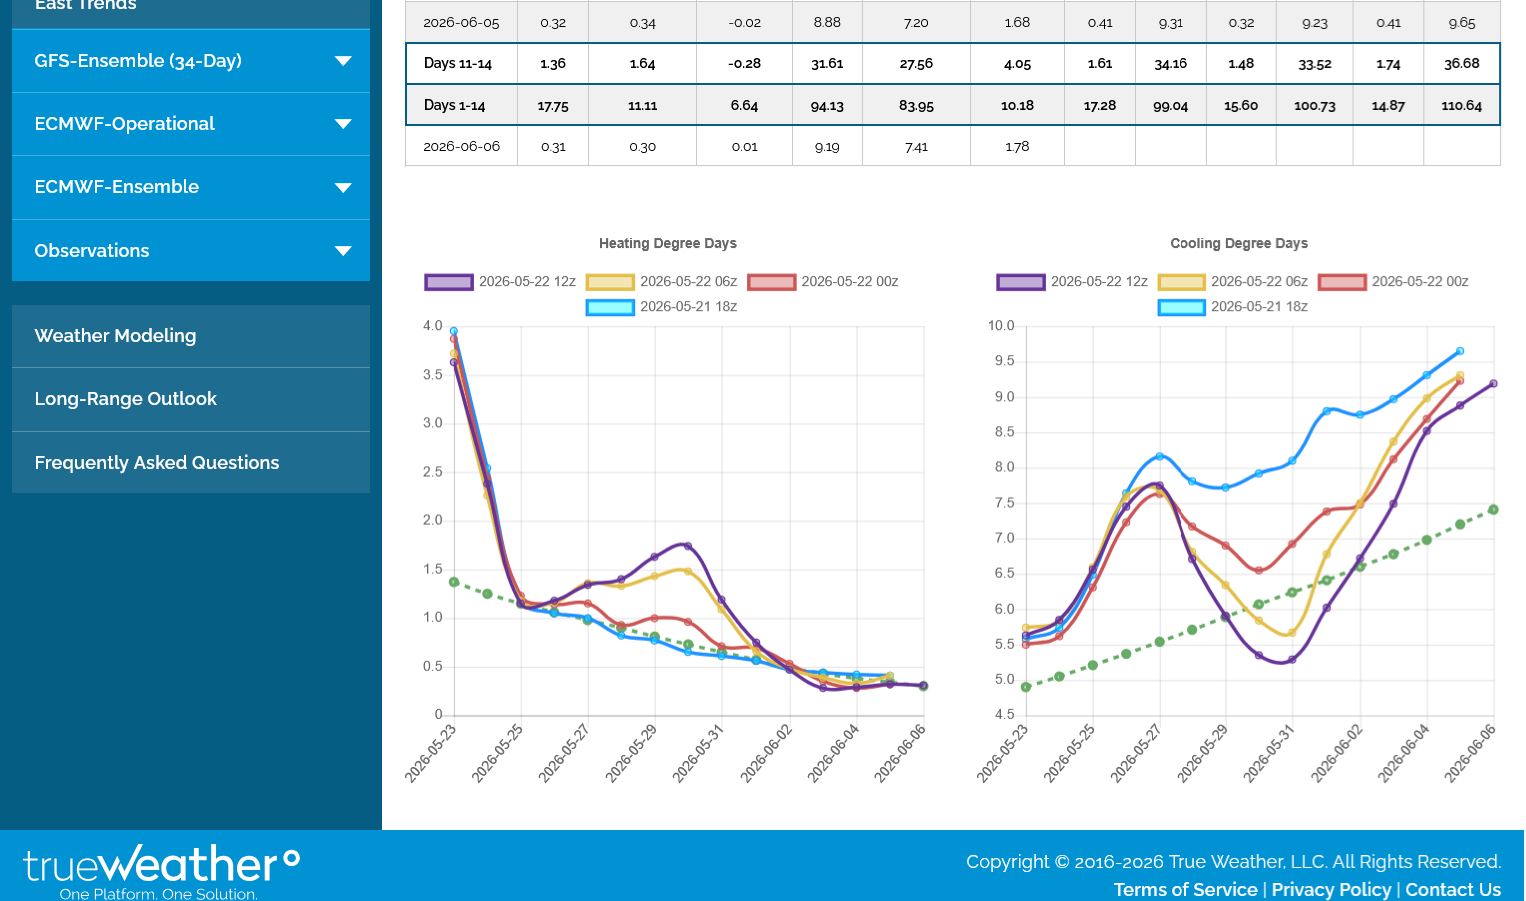
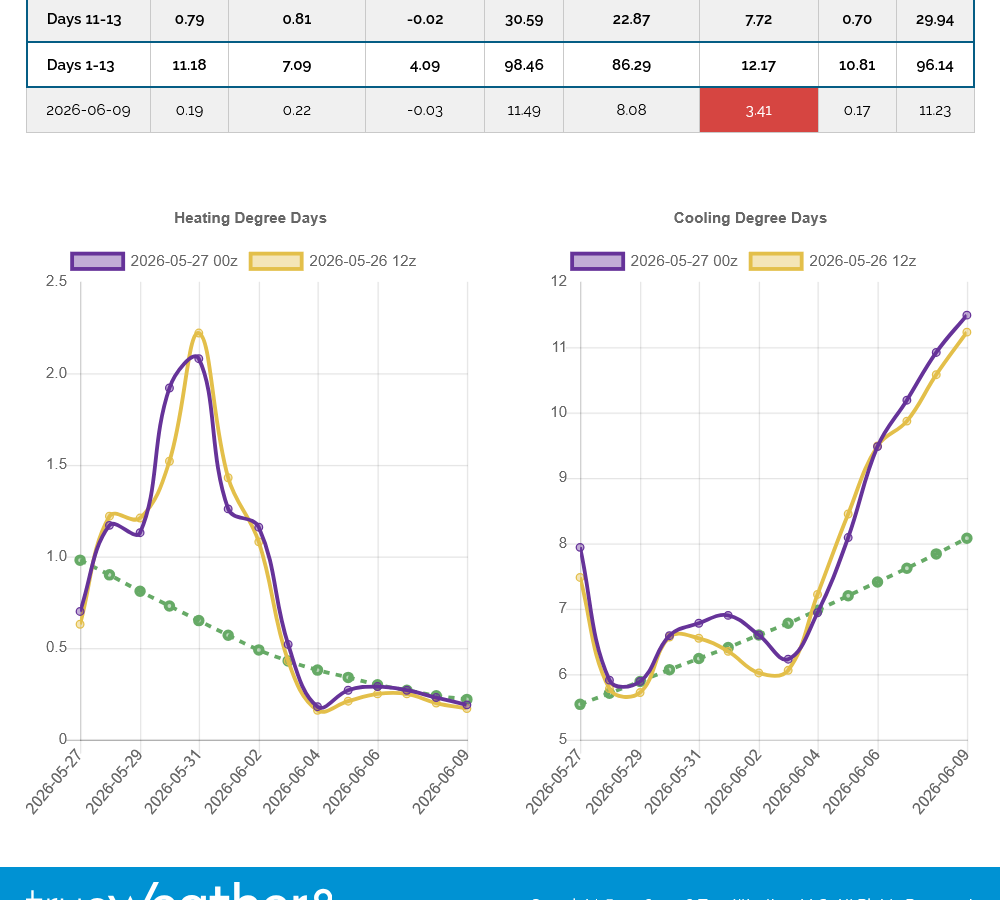
Heating degree days are on the left. Note the rapidly dropping seasonal in dashed green as cold weather quickly disappears. The purple line was the last 0z European model. The other line was the previous 12z run. Note a very brief spike higher over the weekend, then back below average for over half of next week, followed by even less impressive cold in week 2.
On the right is the CDD graph. The green line is climbing but won't become significant for another month.
The units on the Y axis of these 2 graphs are more than double for the HDDs/left than CDDs/right, even though they appear to be closer when comparing.
The CDDs will pass up the HDDs seasonally, I think in around 3 weeks.
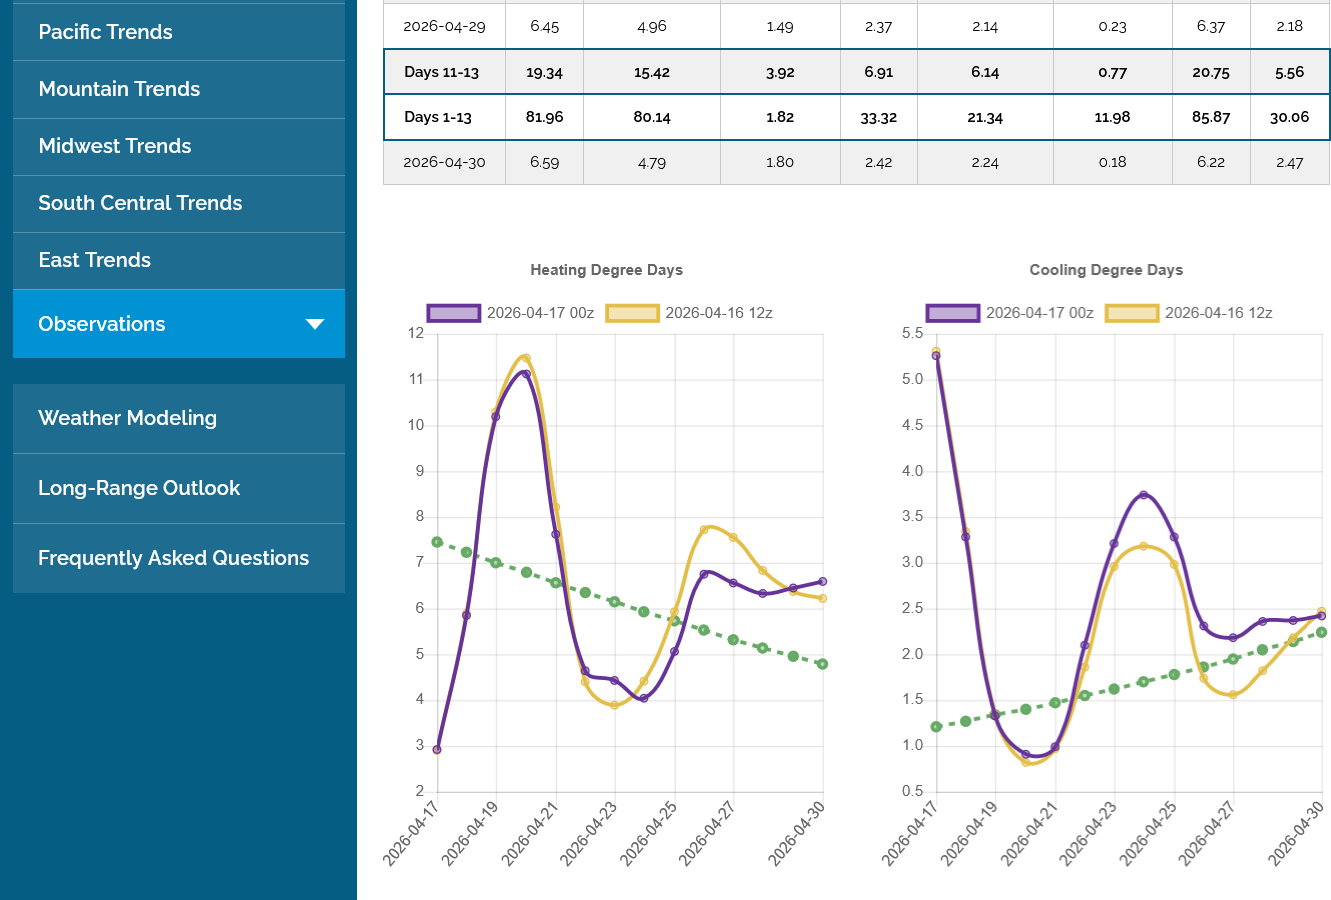
Last 12z European model in purple, not as chilly in week 2 as the previous run but HDDs don't matter much, if at all this late in the year.
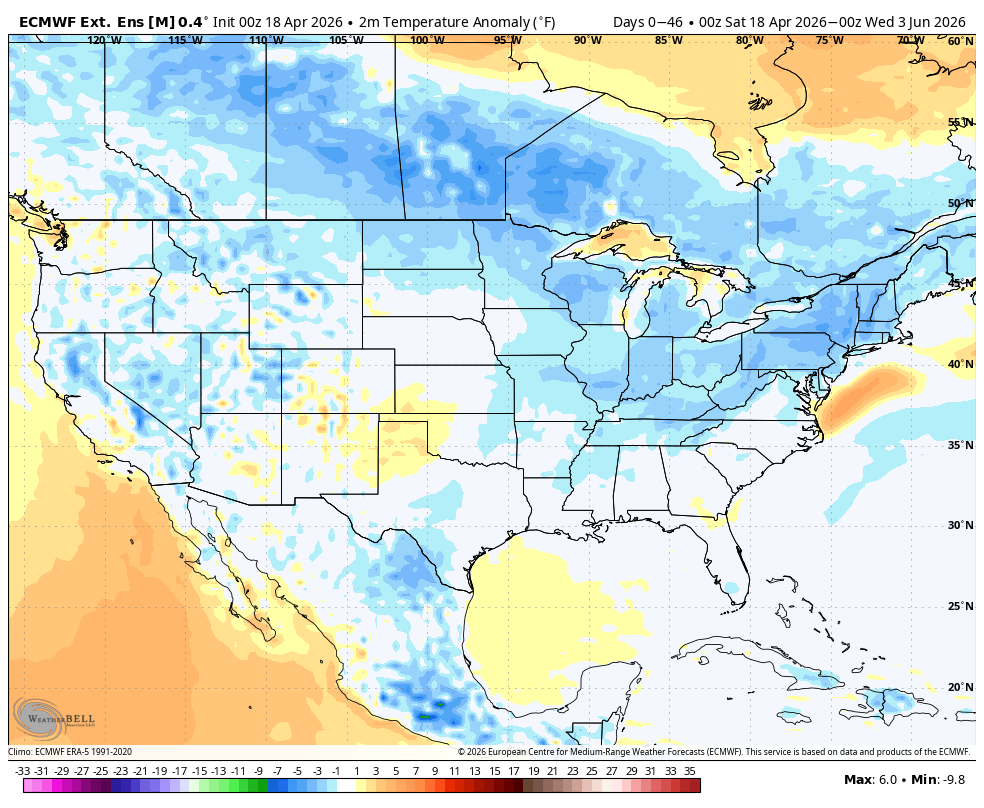
This was the last 46 day European Ensemble model temperature anomaly forecast from today, 4-18-26. This takes us into the start of June.
CDDs will matter the most in the 2nd half of this period, so this is BEARISH with a lower than average demand for air conditioning using electricity generated by burning natural gas!
The predicted, MAJOR seasonal low scenario last week continues to play out.
https://tradingeconomics.com/commodity/natural-gas
Near record warmth in April = big injections since this is still the (end) of the heating season.
https://www.cpc.ncep.noaa.gov/products/tanal/temp_analyses.php

++++++++++++++
Holy cow! I posted that temperature graph above before looking at the actual injection. +103 Bcf!!
Note the current year in blue on the graph below breaking bearishly upwards a few weeks earlier than usual(from warmth at the end of the cooling season) and separating from the 5 year average in gray.
We're now +137 Bcf compared to the 5 year average and +142 Bcf compared to last year.
![]()
for week ending April 17, 2026 | Released: April 23, 2026 at 10:30 a.m. | Next Release: April 30, 2026
| Working gas in underground storage, Lower 48 states Summary text CSV JSN | |||||||||||||||||||||||||
|---|---|---|---|---|---|---|---|---|---|---|---|---|---|---|---|---|---|---|---|---|---|---|---|---|---|
| Historical Comparisons | |||||||||||||||||||||||||
| Stocks billion cubic feet (Bcf) | Year ago (04/17/25) | 5-year average (2021-25) | |||||||||||||||||||||||
| Region | 04/17/26 | 04/10/26 | net change | implied flow | Bcf | % change | Bcf | % change | |||||||||||||||||
| East | 309 | 283 | 26 | 26 | 294 | 5.1 | 326 | -5.2 | |||||||||||||||||
| Midwest | 404 | 371 | 33 | 33 | 393 | 2.8 | 424 | -4.7 | |||||||||||||||||
| Mountain | 202 | 200 | R | 2 | 2 | 170 | 18.8 | 127 | 59.1 | ||||||||||||||||
| Pacific | 269 | 267 | 2 | 2 | 220 | 22.3 | 184 | 46.2 | |||||||||||||||||
| South Central | 879 | 839 | 40 | 40 | 844 | 4.1 | 864 | 1.7 | |||||||||||||||||
| Salt | 263 | 243 | 20 | 20 | 263 | 0.0 | 260 | 1.2 | |||||||||||||||||
| Nonsalt | 616 | 596 | 20 | 20 | 582 | 5.8 | 604 | 2.0 | |||||||||||||||||
| Total | 2,063 | 1,960 | R | 103 | 103 | 1,921 | 7.4 | 1,926 | 7.1 | ||||||||||||||||
| Totals may not equal sum of components because of independent rounding. R=Revised. Working gas stocks were revised to reflect resubmissions of data for the 33-week period from August 29, 2025 to April 10, 2026, in large part because of respondent resubmissions reflecting restatements of natural gas in storage from working gas to base gas. Excluding the week ending August 29, 2025, the effect of revisions on the weekly implied net change averaged 0 Bcf in magnitude, because the working gas levels were revised downward by 10 Bcf on average each week during this period. The reported revision caused the stocks for April 10, 2026 to change from 1,970 Bcf to 1,960 Bcf. As a result, the implied net change between the weeks ending April 03 and April 10 changed from 59 Bcf to 60 Bcf. More information about the revised working gas volumes during this period is available at ngshistory.xls, and in the revisions.xls spreadsheet at: https://ir.eia.gov/ngs/revisions.xls. | |||||||||||||||||||||||||
Working gas in storage was 2,063 Bcf as of Friday, April 17, 2026, according to EIA estimates. This represents a net increase of 103 Bcf from the previous week. Stocks were 142 Bcf higher than last year at this time and 137 Bcf above the five-year average of 1,926 Bcf. At 2,063 Bcf, total working gas is within the five-year historical range.
For information on sampling error in this report, see Estimated Measures of Sampling Variability table below.
Note: The shaded area indicates the range between the historical minimum and maximum values for the weekly series from 2021 through 2025. The dashed vertical lines indicate current and year-ago weekly periods.
+++++++++++
This massive build hit the bulls hard although the large funds, came in at 7am selling hard ahead of the report and ng was already sharply lower before the release but plunged even more after it.
https://tradingeconomics.com/commodity/natural-gas
The seasonal low formation from last week is being tested with this giant spike downward.
Decisive new lows on a closing basis would turn this into more of a big, fat bear flag on the charts or a failed bottoming configuration.
The market has spoken. The formation is now just a large bear flag, which is a continuation pattern. Smashing thru previous lows and delaying the time frame of the seasonal low.
The latest for this seasonal low occurred in 2020 p, at the start of June because of the economy shutting down that cut back on industrial demand.
There is the chance that a contracting economy right now is having a negative impact to NG prices.
https://tradingeconomics.com/commodity/natural-gas
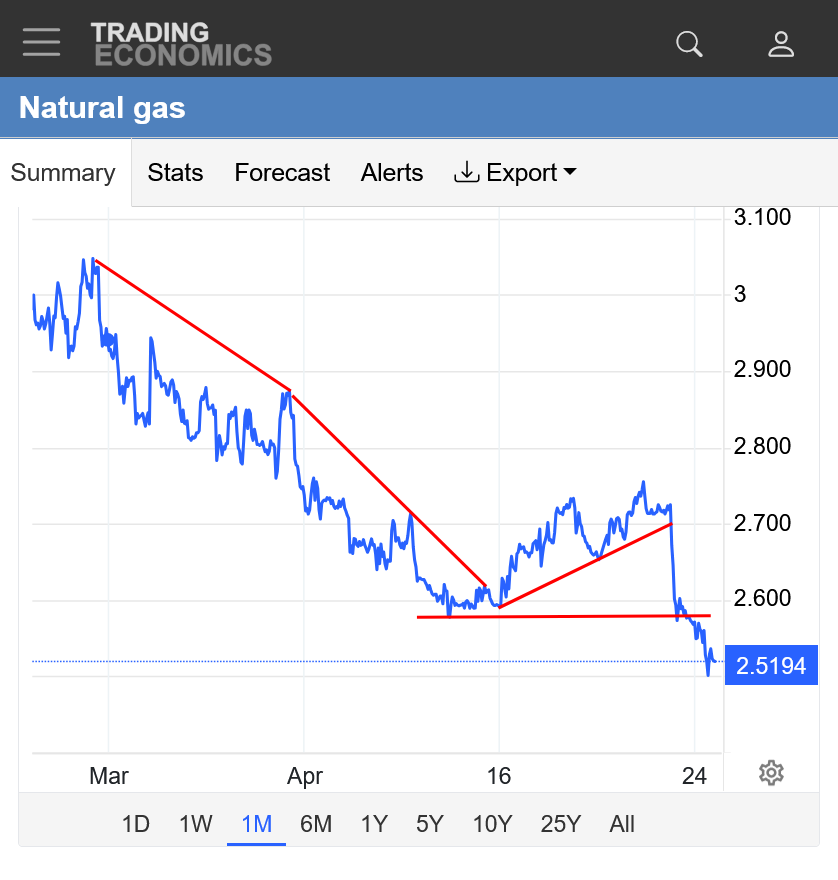
1. 1 month: Downside break out yesterday after the extremely bearish EIA storage report. Previous downtrend was interrupted by a bear flag type formation that got some momentum as it looked like a seasonal bottom initially.
2. 1 year; Huge spikes up from extreme cold waves this past Winter. Recent downtrend is now renewed. Lowest price in 19 months, since Oct. 2024 BEFORE the 1 year chart.
3. 10 years: Early 2022 MAJOR highs. 2024/25/early 2026 uptrend has been violated.
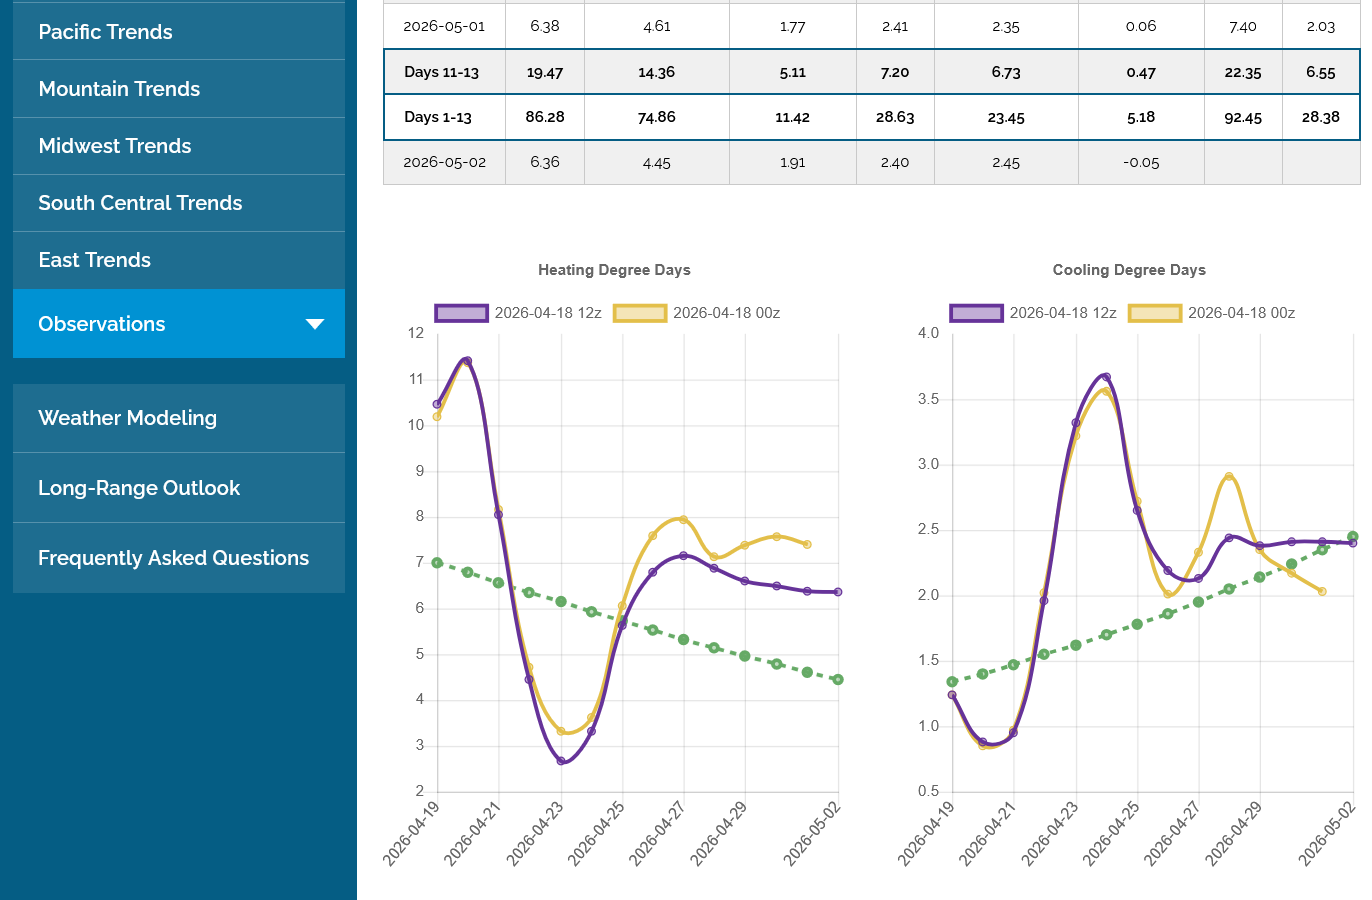
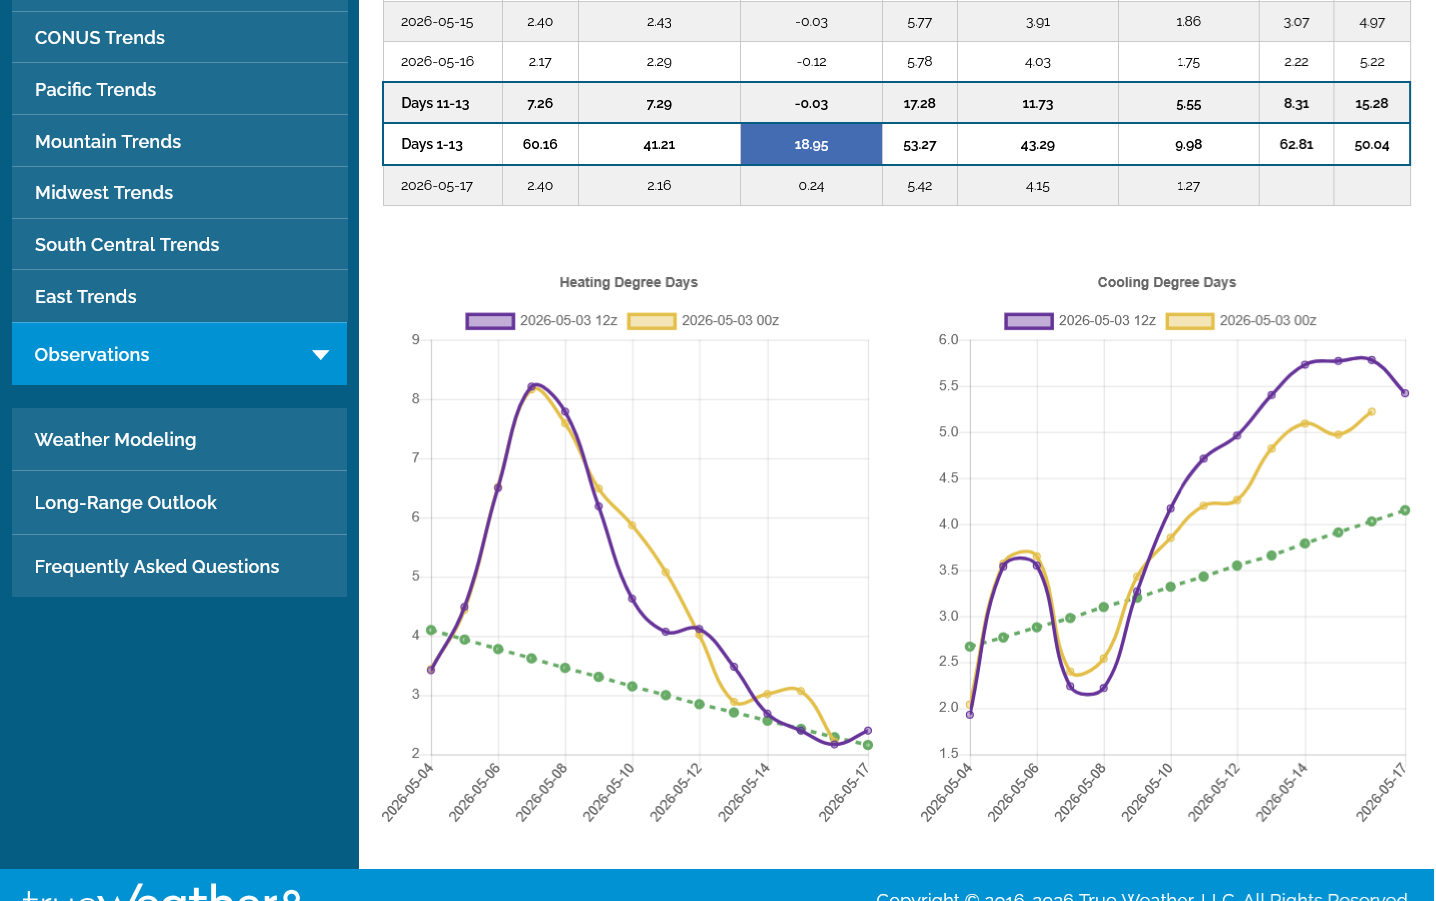
+6 HDDs from this last 12z European Ensemble model in purple/left. Too late in the heating season to matter. Regardless, the big bump higher in HDDs is a result of a very chilly pattern mid/late next week.
Seasonally averaged(climatology) CDDs on the right will pass up HDDs on the left(dashed green lines) around May 10th.
Front month, May 2026 expires on Tuesday. NG is known for spikes up and down ahead of expiration. This would be a good spot for a spike, seasonal low. Coming a bit late from the injection season starting several weeks early and last week's shockingly HUGE injection.
Another big injection is expected this Thursday at 9:30am. Not likely as huge as last week.
https://www.cpc.ncep.noaa.gov/products/tanal/temp_analyses.php

Potentially bottoming formation or short covering ahead of Tuesday's expiration of May NG?
https://tradingeconomics.com/commodity/natural-gas
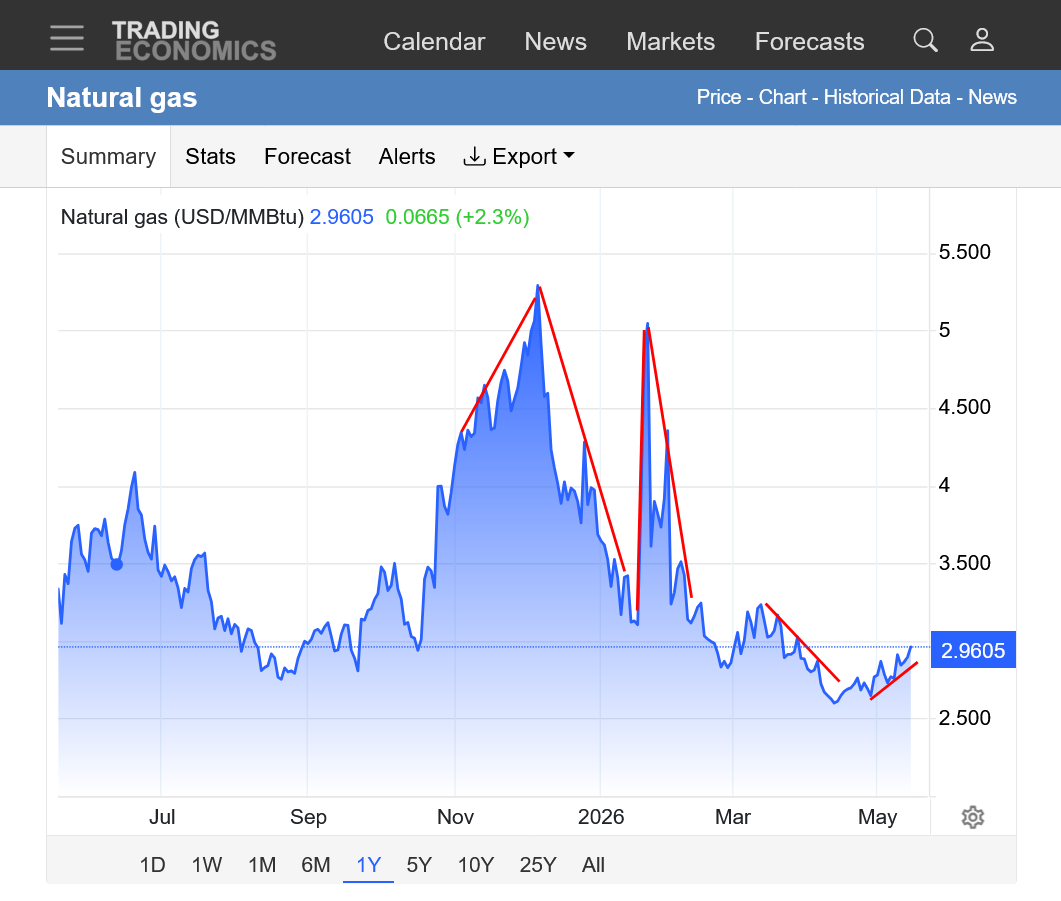
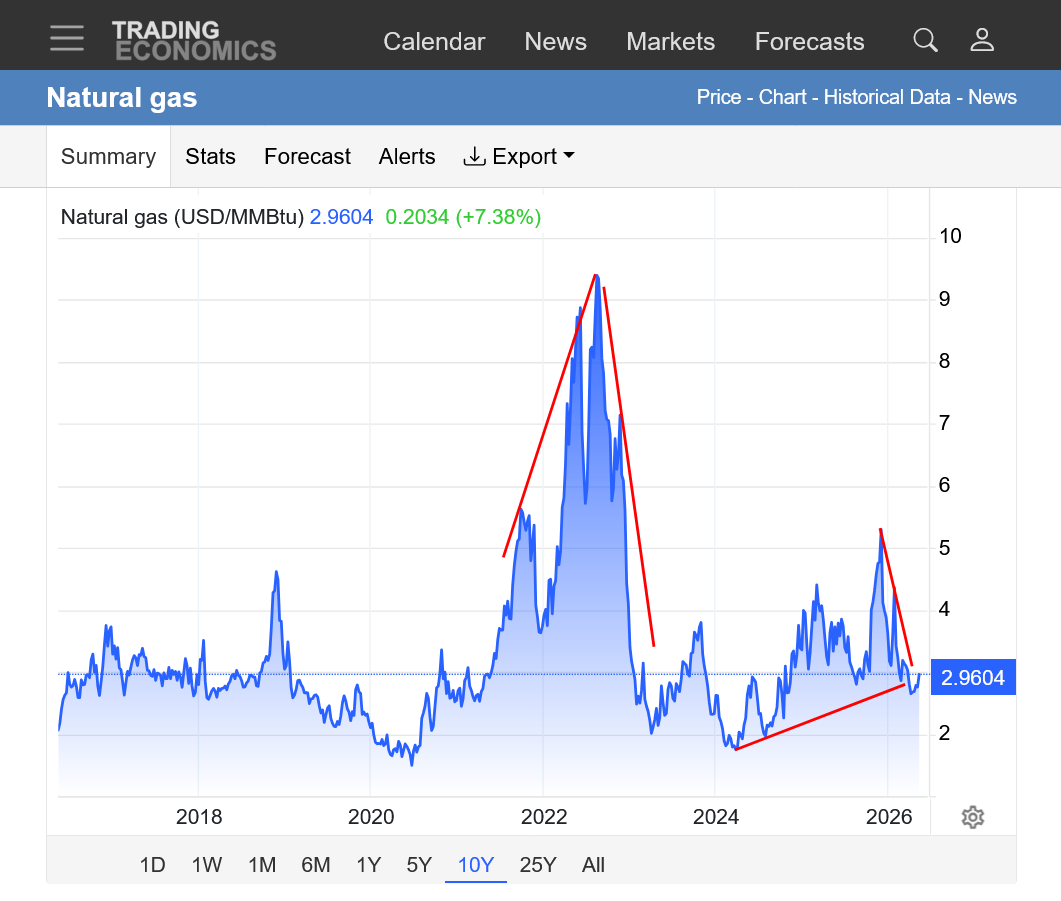
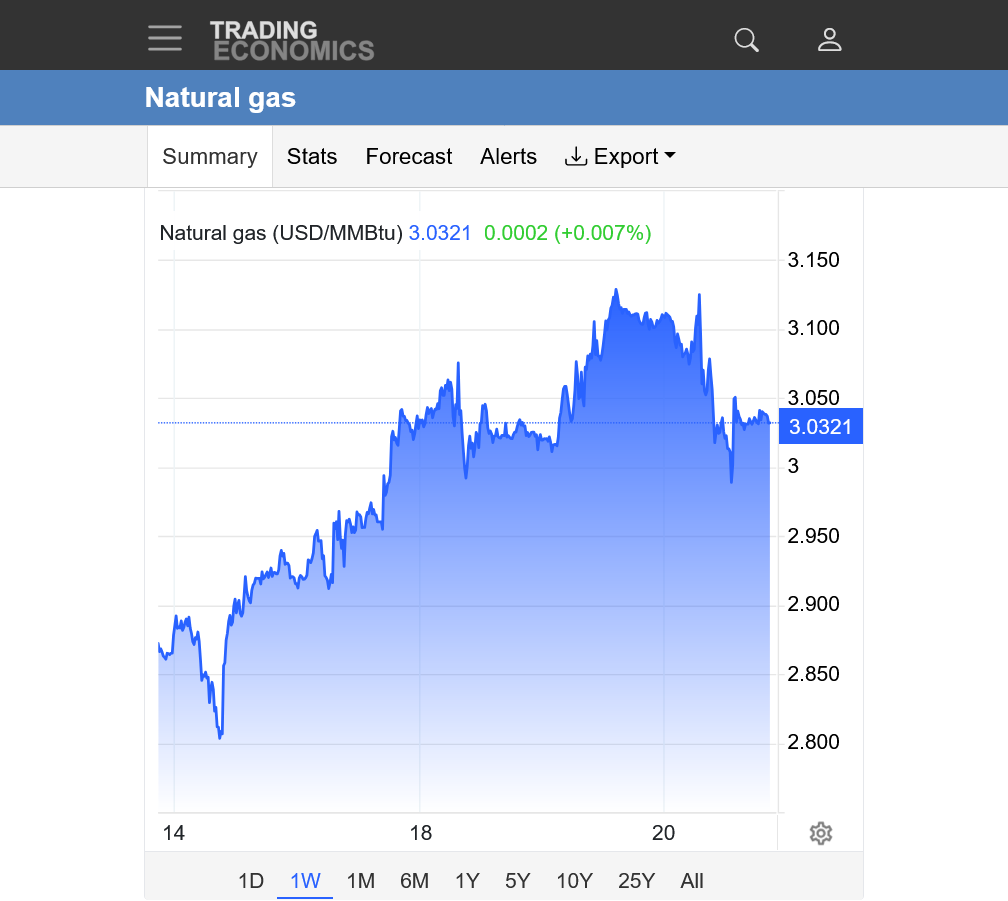
1. 1 week: Big bounce up today
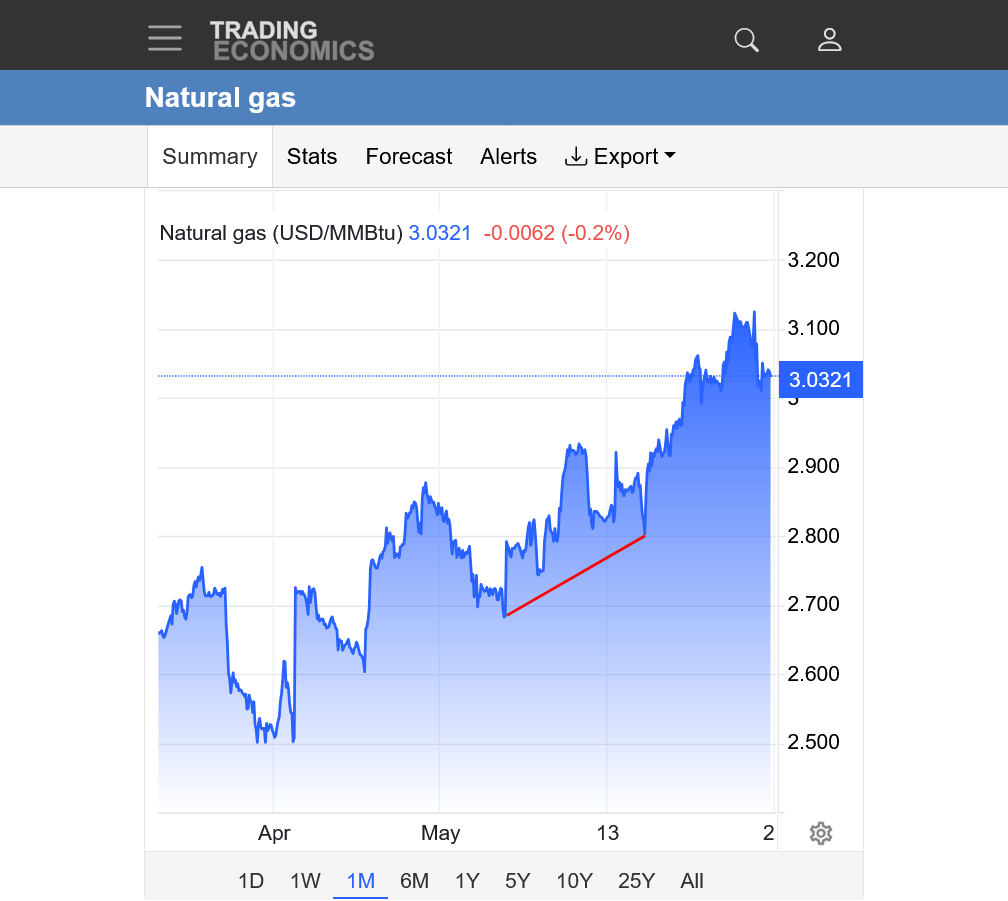
2. 1 month: Downtrend, false bottom that turned into a bear flag, ending with the spike lower on Thursday after the mega bearish, huge EIA injection to storage.
3. 1 year: 2 huge spikes up from extreme cold this past Winter. Extremely steep downtrend after the 2nd high from milder weather. Bear flag, then less steep downtrend with the injection season starting 3 weeks early from mild weather reducing the need for residential heating.
![]()
for week ending April 24, 2026 | Released: April 30, 2026 at 10:30 a.m. | Next Release: May 7, 2026
| Working gas in underground storage, Lower 48 states Summary text CSV JSN | |||||||||||||||||||||||||
|---|---|---|---|---|---|---|---|---|---|---|---|---|---|---|---|---|---|---|---|---|---|---|---|---|---|
| Historical Comparisons | |||||||||||||||||||||||||
| Stocks billion cubic feet (Bcf) | Year ago (04/24/25) | 5-year average (2021-25) | |||||||||||||||||||||||
| Region | 04/24/26 | 04/17/26 | net change | implied flow | Bcf | % change | Bcf | % change | |||||||||||||||||
| East | 332 | 309 | 23 | 23 | 326 | 1.8 | 342 | -2.9 | |||||||||||||||||
| Midwest | 429 | 404 | 25 | 25 | 421 | 1.9 | 439 | -2.3 | |||||||||||||||||
| Mountain | 205 | 202 | 3 | 3 | 174 | 17.8 | 131 | 56.5 | |||||||||||||||||
| Pacific | 272 | 269 | 3 | 3 | 225 | 20.9 | 190 | 43.2 | |||||||||||||||||
| South Central | 905 | 879 | 26 | 26 | 880 | 2.8 | 887 | 2.0 | |||||||||||||||||
| Salt | 272 | 263 | 9 | 9 | 279 | -2.5 | 269 | 1.1 | |||||||||||||||||
| Nonsalt | 634 | 616 | 18 | 18 | 602 | 5.3 | 618 | 2.6 | |||||||||||||||||
| Total | 2,142 | 2,063 | 79 | 79 | 2,026 | 5.7 | 1,989 | 7.7 | |||||||||||||||||
| Totals may not equal sum of components because of independent rounding. | |||||||||||||||||||||||||
Working gas in storage was 2,142 Bcf as of Friday, April 24, 2026, according to EIA estimates. This represents a net increase of 79 Bcf from the previous week. Stocks were 116 Bcf higher than last year at this time and 153 Bcf above the five-year average of 1,989 Bcf. At 2,142 Bcf, total working gas is within the five-year historical range.
For information on sampling error in this report, see Estimated Measures of Sampling Variability table below.
Note: The shaded area indicates the range between the historical minimum and maximum values for the weekly series from 2021 through 2025. The dashed vertical lines indicate current and year-ago weekly periods.
+++++++++++++
We're seeing a reversal up from life of contract lows in the new front month, JUNE natural gas here.
One of the flaws in the graphing source that we use here is that it only graphs the FRONT MONTH.
Towards the end of every month, when the front month ROLLS OVER to the next month in NG, if there's a big price differential between the expiring month and the new front month, it can completely mess up the price formations on our price charts. Specific comments below on this chart for 1 week.
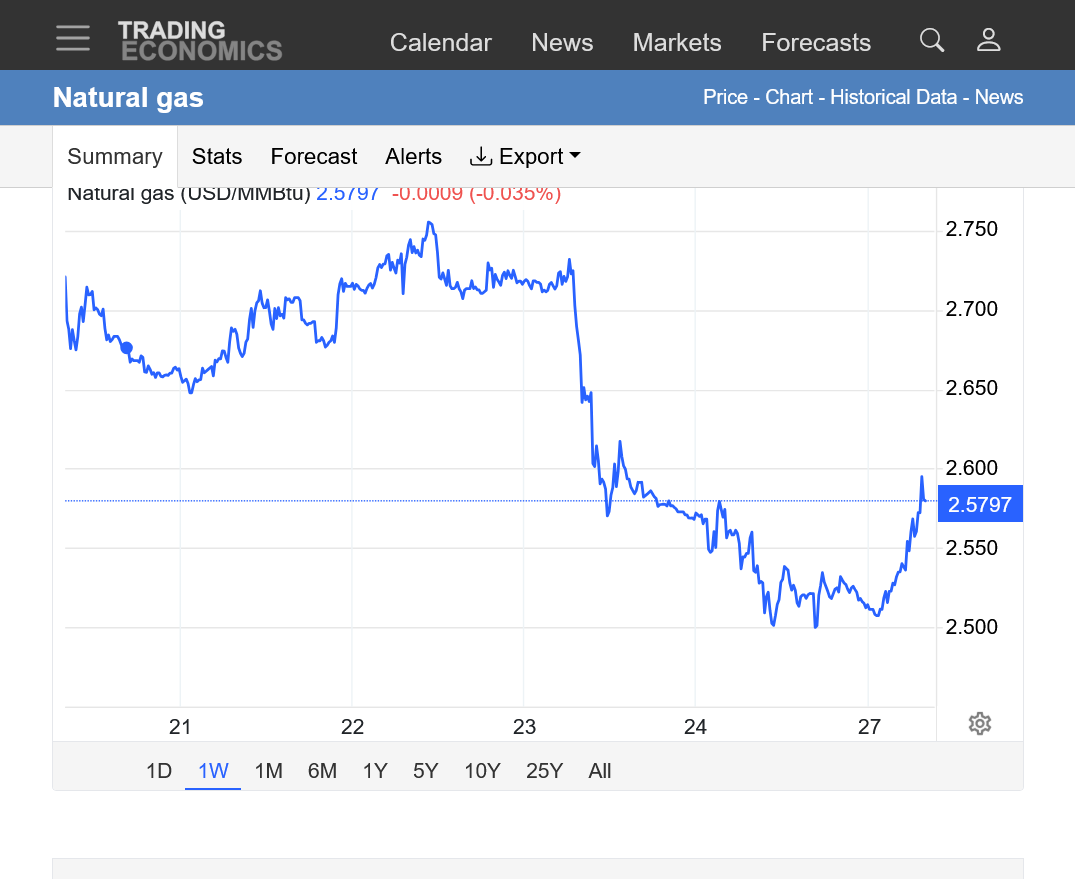
https://tradingeconomics.com/commodity/natural-gas
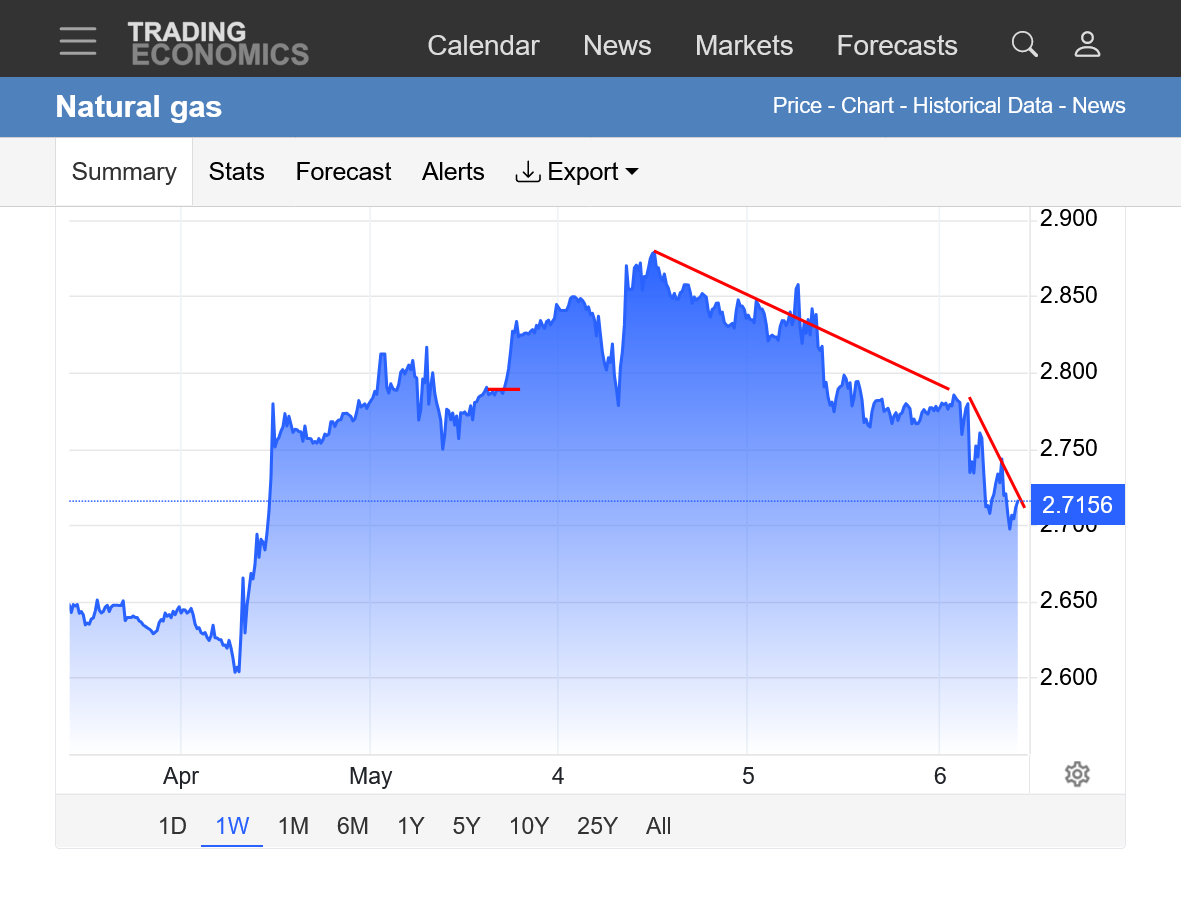
1. 1 week: I put in red lines below to show the already obvious spike up with the rollover from May to June this week.
We basically added +$2,000/contract to the price immediately.
If you take out that +$2,000/contract or if you were just graphing June Natural gas below that $2.6 was a LIFE OF CONTRACT LOW for June natural gas and we are now trading higher! That's an upside reversal from a record low price at a time of year that almost always features a seasonal low.
Regardless, the $2.5 May contract basis looks like a solid low.
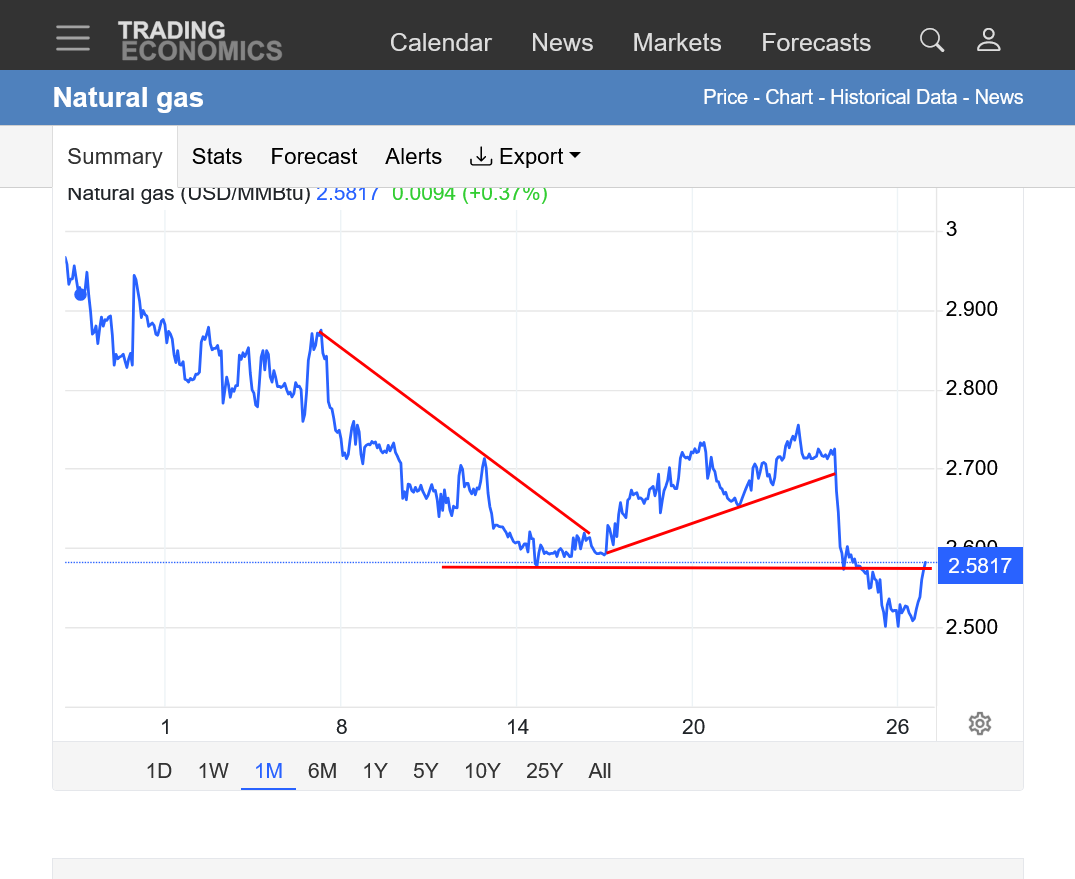
2. 1 month: Inverted Head and Shoulders bottom formation with us breaking out above the neckline right now. However, this is only with the help of the +$2,000 rollover. $2.5 looks like a solid low!
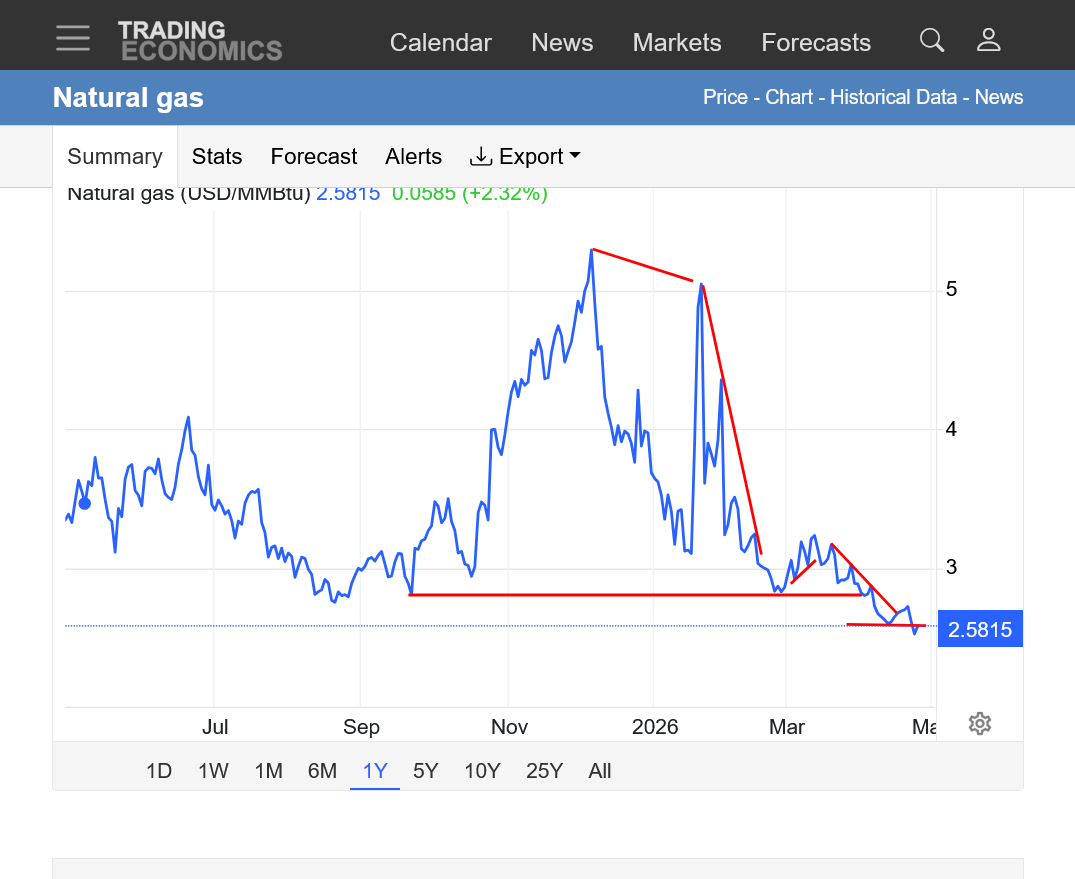
3. 1 year: Note the 2 HUGE spike highs this past Winter from extreme cold waves. Then steep downtrends from the very mild weather after the spikes up from cold. There was a 3rd, much weaker one late in the heating season
4. 10 years: Major low in 2020 from COVID cutting demand. Major high in AUGUST 2022 from storage getting low. Record injections in the Fall of 2022=price collapse.
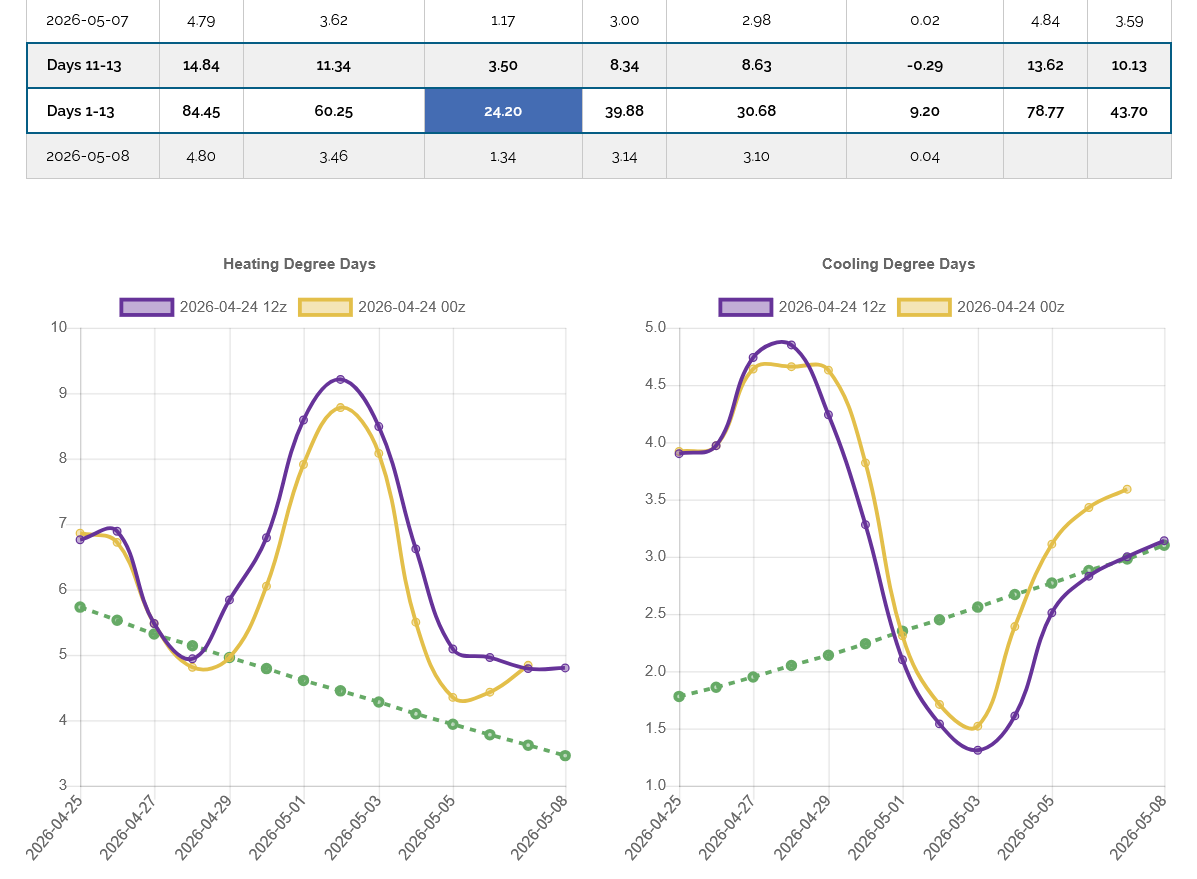
Rapidly rising CDDs on the right, seasonally pass up rapidly falling HDDS on the left on May 9th, noted by the dashed green lines. So heat is becoming bullish and cool temps bearish until early October.
The scales on these graphs is messed up.
The vertical/Y axis on the left is almost 3 times the vertical/Y axis on the right even though the lines on the right are a bit higher, they represent 77 CDDs compared to 82 HDDs on the left.
More uncertainty than usual here because of the war but it sure looks like the seasonal lows are in!
CDDs pass up HDDs in 6 days(green line) and those are what matter more, starting RIGHT NOW.
Some modest heat in the south coming in week 2 on the right. Nothing extreme or anomalous but enough to be a modest bullish factor, especially with longer term forecasts adding some heat and the STRONG May up seasonal.
7 day temps for this Thursday's EIA storage report released at 9:30am. Maybe not as robust as the last 2 injections from some early CDDs in the South and HDDs north(where not many people live).
https://www.cpc.ncep.noaa.gov/products/tanal/temp_analyses.php

+++++++++++
It sure looks like the lows are in for natural gas for reasons mentioned previously(but the current energy market environment is extraordinarily uncertain)
https://www.marketforum.com/forum/topic/118808/#119912
The free source that we use here for charting has suddenly changed the look of their graphing.
On this daily chart below, I noted the open last evening at 5pm. We immediately spiked up from the open but then suddenly spiked down to test that low very early this morning before taking off up again. This is what makes trading this market so tough.
For instance, if one bought the open(which is what I would have done if trading it the past day) you would have immediately had a nice profit. Then what? How much do you risk? If in a weather market with extreme high confidence, then you can trade without stops. In early May when wx isn't the main driving force and tremendous uncertainty because of the Iran war dynamic, you would put in a protective stop to lock in x amounts of profits and not let a profit turn into a loss. Doing that would resulted in getting stopped out with the spike lower early this morning.
Was this a fluke? Unfortunately not. This sort of pattern repeats very frequently and appears to be related to algorithms/behavior of, especially large traders.
Anyways, we are closing near the highs with solid gains with some modest heat in the longer range forecasts and a very strong UP seasonal.
https://tradingeconomics.com/commodity/natural-gas
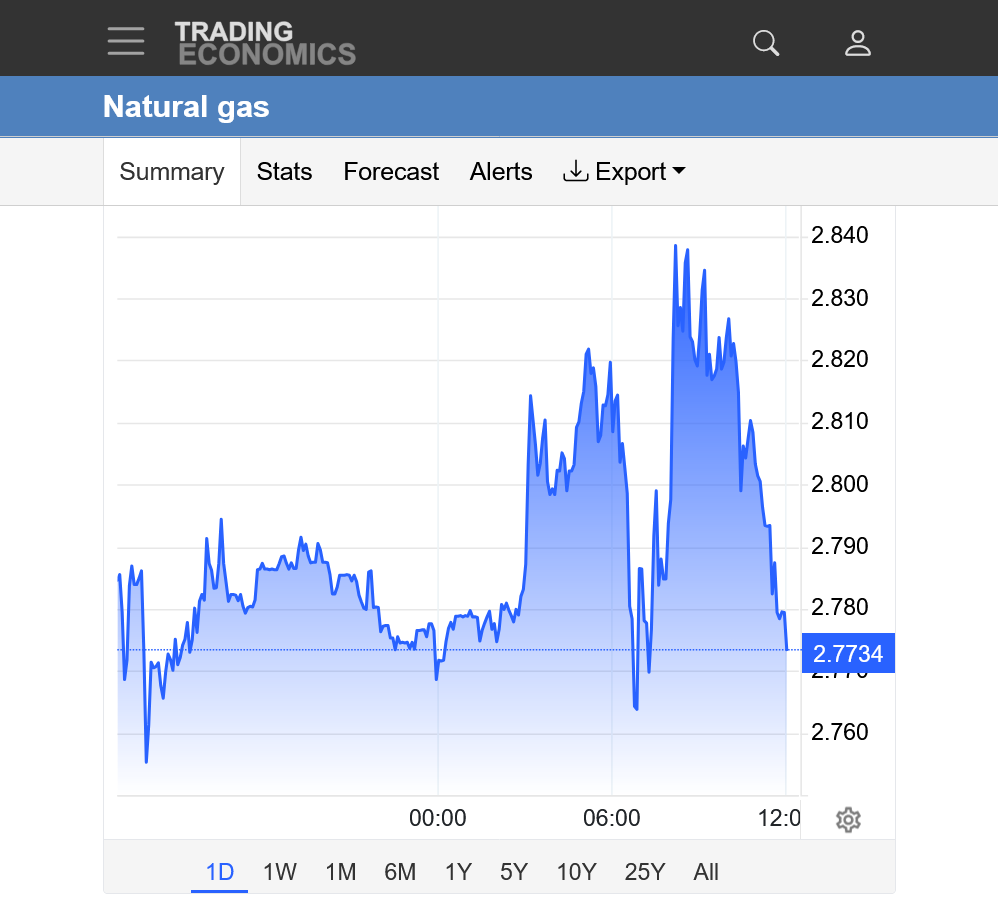
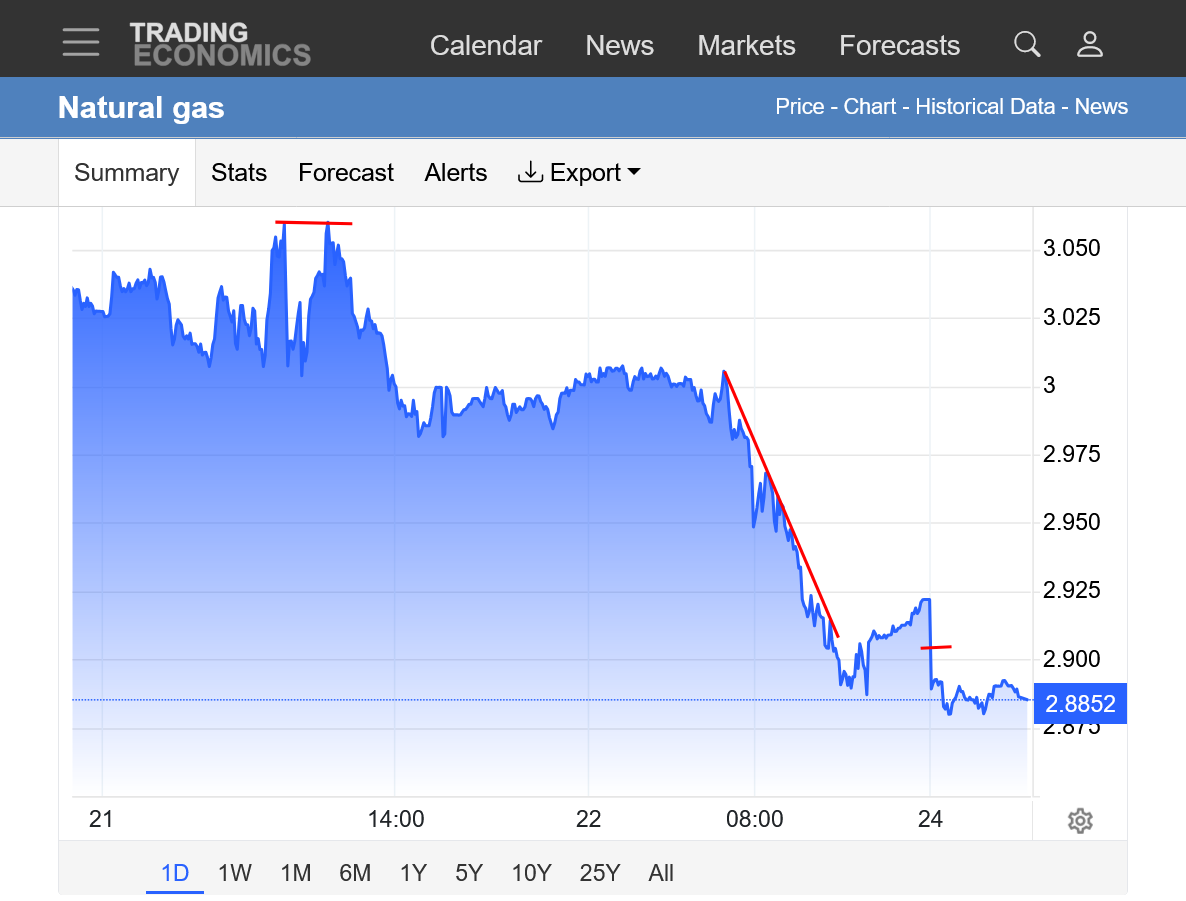
Clearly, my thoughts that a season low is in are in jeopardy here. After the BEARISH NEWS hit the crude market very early this morning the price crash lower attracted selling in natural gas as noted from the steeper red line that commenced at that time.
The open on Sunday night is the horizonal line in the center of the graph. We are trading well below that right now.
https://tradingeconomics.com/commodity/natural-gas
++++++++++++++++
This was the last 0z European Ensemble model in purple. HDDs on the left and the increasingly more important CDDs on the right. The previous run from 12 hours earlier is graphed. CDDs become slightly bullish but in mid May, we usually need widespread record heat to cause enough residential AC use (that needs electricity from burning natural gas) to make a market tradable impact from weather.
NG prices took off like a rocket after this BULLISH release at 9:30 am. I speculated earlier this week that the number would not be as robust as recently release BEARISH numbers.
+63 Bcf! Below expectations and much below the 5 year average. So my confidence in us posting the seasonal low just jumped back up!!!
![]()
for week ending May 1, 2026 | Released: May 7, 2026 at 10:30 a.m. | Next Release: May 14, 2026
| Working gas in underground storage, Lower 48 states Summary text CSV JSN | |||||||||||||||||||||||||
|---|---|---|---|---|---|---|---|---|---|---|---|---|---|---|---|---|---|---|---|---|---|---|---|---|---|
| Historical Comparisons | |||||||||||||||||||||||||
| Stocks billion cubic feet (Bcf) | Year ago (05/01/25) | 5-year average (2021-25) | |||||||||||||||||||||||
| Region | 05/01/26 | 04/24/26 | net change | implied flow | Bcf | % change | Bcf | % change | |||||||||||||||||
| East | 361 | 332 | 29 | 29 | 358 | 0.8 | 362 | -0.3 | |||||||||||||||||
| Midwest | 452 | 429 | 23 | 23 | 450 | 0.4 | 459 | -1.5 | |||||||||||||||||
| Mountain | 203 | 205 | -2 | -2 | 179 | 13.4 | 137 | 48.2 | |||||||||||||||||
| Pacific | 275 | 272 | 3 | 3 | 231 | 19.0 | 197 | 39.6 | |||||||||||||||||
| South Central | 914 | 905 | 9 | 9 | 912 | 0.2 | 910 | 0.4 | |||||||||||||||||
| Salt | 273 | 272 | 1 | 1 | 291 | -6.2 | 277 | -1.4 | |||||||||||||||||
| Nonsalt | 641 | 634 | 7 | 7 | 621 | 3.2 | 633 | 1.3 | |||||||||||||||||
| Total | 2,205 | 2,142 | 63 | 63 | 2,130 | 3.5 | 2,066 | 6.7 | |||||||||||||||||
| Totals may not equal sum of components because of independent rounding. | |||||||||||||||||||||||||
Working gas in storage was 2,205 Bcf as of Friday, May 1, 2026, according to EIA estimates. This represents a net increase of 63 Bcf from the previous week. Stocks were 75 Bcf higher than last year at this time and 139 Bcf above the five-year average of 2,066 Bcf. At 2,205 Bcf, total working gas is within the five-year historical range.
For information on sampling error in this report, see Estimated Measures of Sampling Variability table below.
Note: The shaded area indicates the range between the historical minimum and maximum values for the weekly series from 2021 through 2025. The dashed vertical lines indicate current and year-ago weekly periods.
++++++++++++
https://tradingeconomics.com/commodity/natural-gas
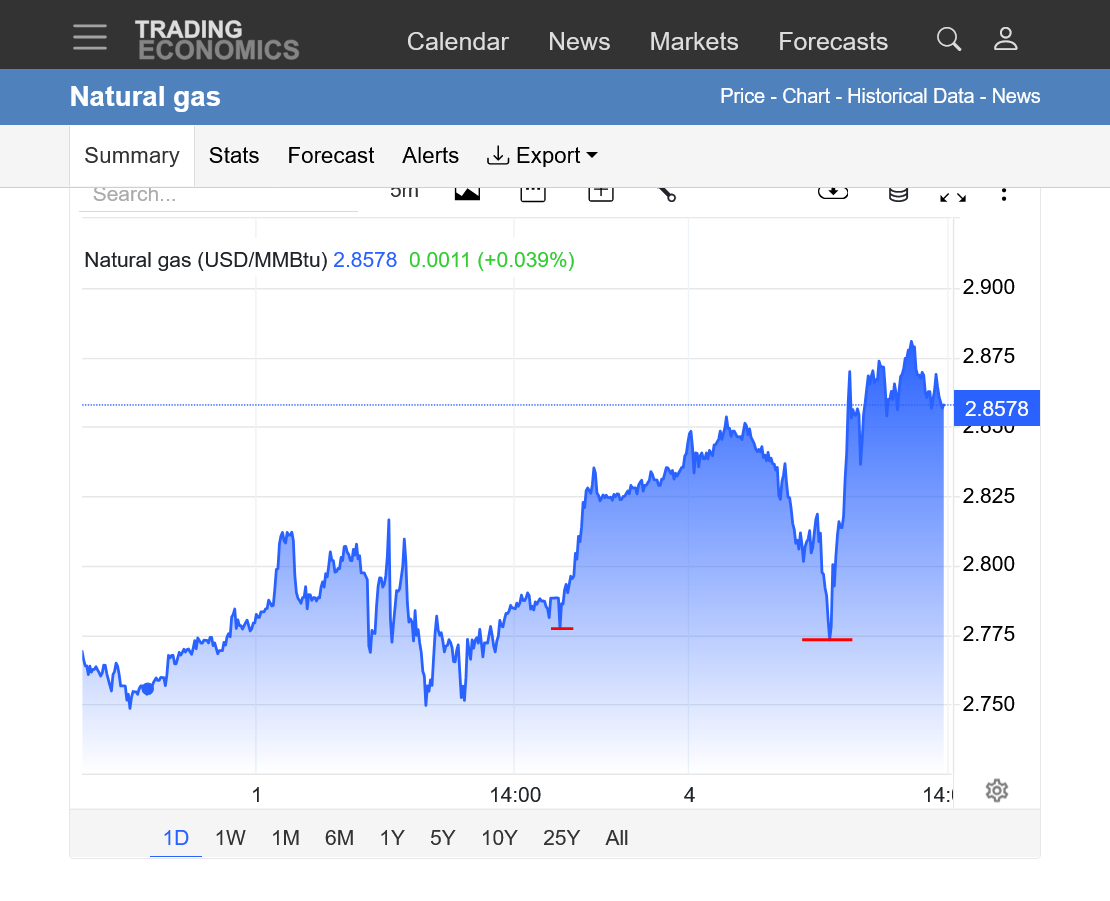
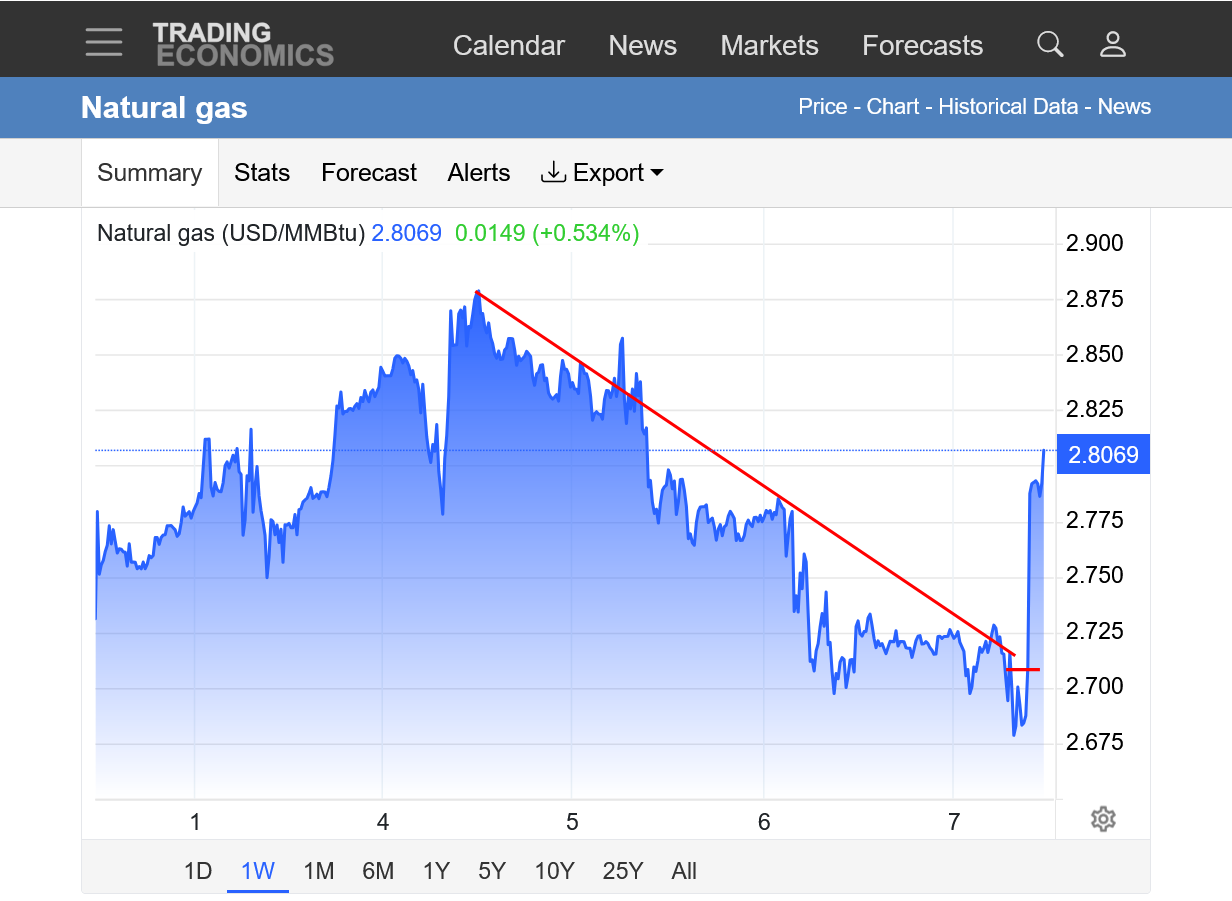
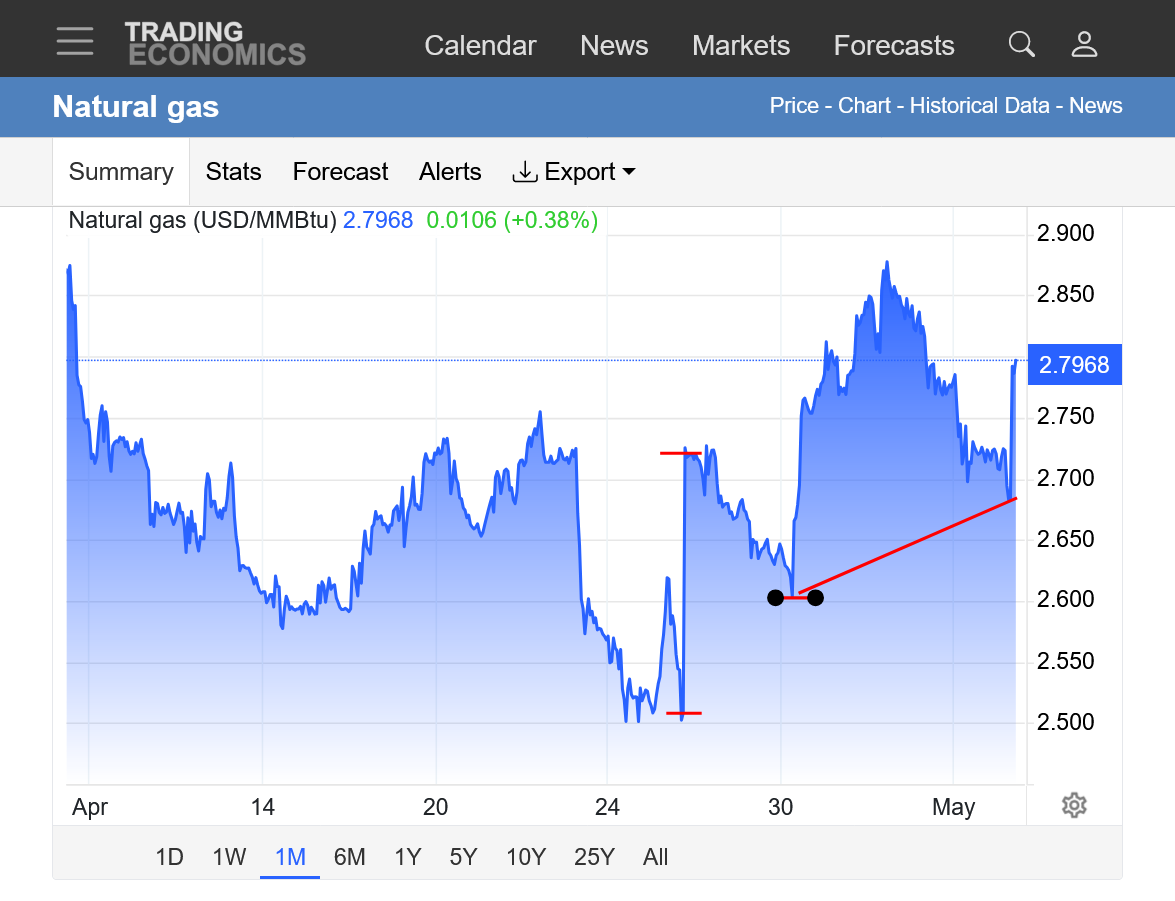
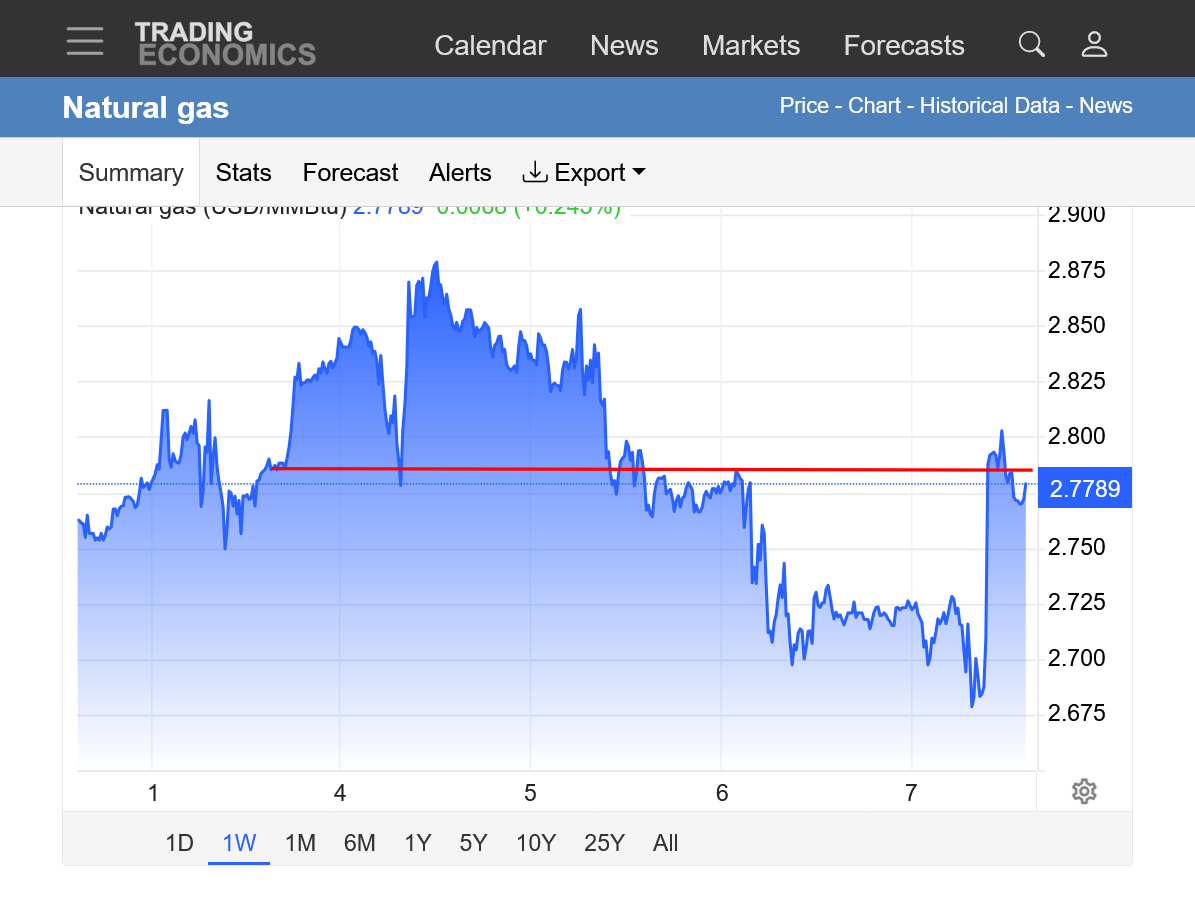
1. 1 week. Note the horizontal red line on the right, marking the time this EIA storage report was released. We shot up $1,000/contract in a couple of minutes.
2. 1 month: Note the spike up of $2,000/contract in late April. This was just the rollover from graphing the previous front month, April to the current front month, May which WAS trading $2,000 higher at the time. I note from my trading platform/charts that the low for May is $2.592 made on April 30th(shown below with the black circles)
So clearly, this weeks low was ABOVE that which is a pretty powerful sign that THE lows are in!!!!
2:30pm: The red line is the price that we opened at this week on Sunday Night.
May is usually not a good month for weather trading natural gas. HDD season is over and CDD season usually can't generate enough CDDs from anything except record widespread heat.
However, we are going to be experiencing some robust seasonal demand for burning NG to generate electricity for residential cooling demand next week and later this month. The seasonal lows appear to be in so that's just an added bullish element.
The dang war in Iran is a wild card. NEWS from that could spike NG 1 way or the other.
The purple line on the right was the last 12z run of the European Model. +3 CDDs vs the previous 0z run 12 hours earlier. It looks more extreme than it because of the small values on the Y axis that don't require much to jump up. Green dashed lines are the seasonal average.
At the end of the graph on the right, we're up to 7.5 CDDs. In mid-July, when average CDDs peak, the average is almost double that at 13.5 CDDs. So we should use that for perspective.
Pretty extreme volatility since yesterday's bullish EIA report. NOT tradable, especially using weather. This is the last day below. I count 4 spikes up, down, up, down since very early this morning and after all that, we're back near unchanged for the day.
Question?
Does pumping more crude make more natural gas?
This is an outstanding question/point, cutworm!
Not my super area of expertise and this is a complicated dynamic but the answer is YES! At least for tight oil plays that are getting mature. As the oil is drawn down, the ratio of gas to oil goes up. I learned something from this article below. Thanks, cutworm!
Natural gas and oil are found together in most formations.
If you increase crude production you will also yield "wet" gas in the process which is typically separated from the oil at the wellhead. It contains a higher concentration of Natural Gas Plant Liquids (NGPLs), including ethane and propane, making it what is commonly referred to as "wet gas" as opposed to "dry gas" extracted from natural gas wells.
%20-%2011-%20Exh.%20J1-%20(EIA)%20Average%20Crude%20oil.pdf.png)
%20-%2011-%20Exh.%20J1-%20(EIA)%20Average%20Crude%20oil.pdf.png)
Seasonal CDDs-right have just passed up HDDs-left shown as the dashed green lines below.
The last European Ensemble 12z run is in purple. It was a bit cooler in week 2 and doesn't appear to be extreme enough to completely dominate price determination this week but is still modestly bullish by May standards.
Total CDDs are +24 for the entire period. This will reduce the magnitude of the injections later this month by XX Bcf.
Historically, May is a VERY strong month for the price of natural gas.
+++++++++++++++++++++++
April and May have strong up seasonals!
https://charts.equityclock.com/natural-gas-futures-ng-seasonal-chart
++++++++++
Very chilly temps last week and the elevated HDDs might reduce the magnitude of the EIA report's injection number(not sure) on Thursday at 9:30am. At least compared to average.
https://www.cpc.ncep.noaa.gov/products/tanal/temp_analyses.php

Today's strength would seem to solidly confirm that the seasonal low is in. Upcoming very warm weather is adding a bit to the bullishness from elevated CDDs.
https://tradingeconomics.com/commodity/natural-gas
1. 1 week: Horizontal lines in the center show the spike up from last Thursday's BULLISH EIA. (lower than expected injection). Extremely bullish, upside break out.
2. 1 month: Horizontal lines in the center show the +$2,000 spike up on the continuous chart when we rolled over from the expiring May contract to the current front month, June which was trading almost $2,000 higher at that time. Extremely bullish, upside break out.
3. 1 year 1 huge spikes higher this past Winter from extreme cold approaching. Steep downtrends after that cold from mild temps. The last one has been violated on this continuous chart. Potentially bullish considering this is May and heat is on the way but it could end up being a bear flag.
4. 10 years: COVID low in 2020. US and global peak in August 2022 as storage was greatly drawn down, followed by massive record injections in the Fall of 2022 and a price collapse. Uptrend in 2024, 2025. Uncertainty for long term trend. Still bearish looking.
The week 2 forecast turning MUCH cooler could have been a big factor in the sell off a short while ago!
The purple line on the right was the last 0z EE model for CDDs. The heat spike up is short lived and NOW we are back to the seasonal average line (dashed green) towards the end of week 2.
1. 1 week: Prices plunged around 6am this morning when the big funds entered the market with selling. Monday, at the same time they were big buyers and we went up fast. Note the spike up with the bullish EIA report last Thursday at 9:30 am.
2. 1 month: +$2,000 instantly from the rollover on this graph from May to the new front month, June. Uptrend since the April 30 low (when heat started to be added to the forecast too)
It's hard to say how much and when the volatile price of crude is impacting natural gas prices but it IS at impossible to predict times. For instance, crude is up sharply this morning even though ng is down sharply.
Yesterday, they were BOTH up sharply.
After the spike higher in CDDs the next week, we back off down to average by the end of week 2. The purple line on the right was the last 12z European Ensemble average.
We can see the increasing average CDDs with the green dashed line, getting above 5 before the end of this month.
For perspective, in mid-July when CDDs peak that average will be close to 14. So getting above 8 next week is pretty robust for mid-May standards and well above average, with +4 CDDs/day for 3 days at the peak.
Lack of longevity at those elevated levels lessens the bullishness too but it is still modestly bullish. For the next 4+ months, hot=bullish, cool=bearish for natural gas.
+85 Bcf is a pretty big number and greater than last week's very bullish +63 Bcf. Looks like that was right at the estimate, so neutral for price.
![]()
for week ending May 8, 2026 | Released: May 14, 2026 at 10:30 a.m. | Next Release: May 21, 2026
| Working gas in underground storage, Lower 48 states Summary text CSV JSN | |||||||||||||||||||||||||
|---|---|---|---|---|---|---|---|---|---|---|---|---|---|---|---|---|---|---|---|---|---|---|---|---|---|
| Historical Comparisons | |||||||||||||||||||||||||
| Stocks billion cubic feet (Bcf) | Year ago (05/08/25) | 5-year average (2021-25) | |||||||||||||||||||||||
| Region | 05/08/26 | 05/01/26 | net change | implied flow | Bcf | % change | Bcf | % change | |||||||||||||||||
| East | 388 | 361 | 27 | 27 | 391 | -0.8 | 386 | 0.5 | |||||||||||||||||
| Midwest | 476 | 452 | 24 | 24 | 476 | 0.0 | 480 | -0.8 | |||||||||||||||||
| Mountain | 206 | 203 | 3 | 3 | 184 | 12.0 | 143 | 44.1 | |||||||||||||||||
| Pacific | 279 | 275 | 4 | 4 | 236 | 18.2 | 205 | 36.1 | |||||||||||||||||
| South Central | 941 | 914 | 27 | 27 | 951 | -1.1 | 935 | 0.6 | |||||||||||||||||
| Salt | 285 | 273 | 12 | 12 | 306 | -6.9 | 284 | 0.4 | |||||||||||||||||
| Nonsalt | 656 | 641 | 15 | 15 | 645 | 1.7 | 651 | 0.8 | |||||||||||||||||
| Total | 2,290 | 2,205 | 85 | 85 | 2,239 | 2.3 | 2,150 | 6.5 | |||||||||||||||||
| Totals may not equal sum of components because of independent rounding. | |||||||||||||||||||||||||
Working gas in storage was 2,290 Bcf as of Friday, May 8, 2026, according to EIA estimates. This represents a net increase of 85 Bcf from the previous week. Stocks were 51 Bcf higher than last year at this time and 140 Bcf above the five-year average of 2,150 Bcf. At 2,290 Bcf, total working gas is within the five-year historical range.
For information on sampling error in this report, see Estimated Measures of Sampling Variability table below.
Note: The shaded area indicates the range between the historical minimum and maximum values for the weekly series from 2021 through 2025. The dashed vertical lines indicate current and year-ago weekly periods.
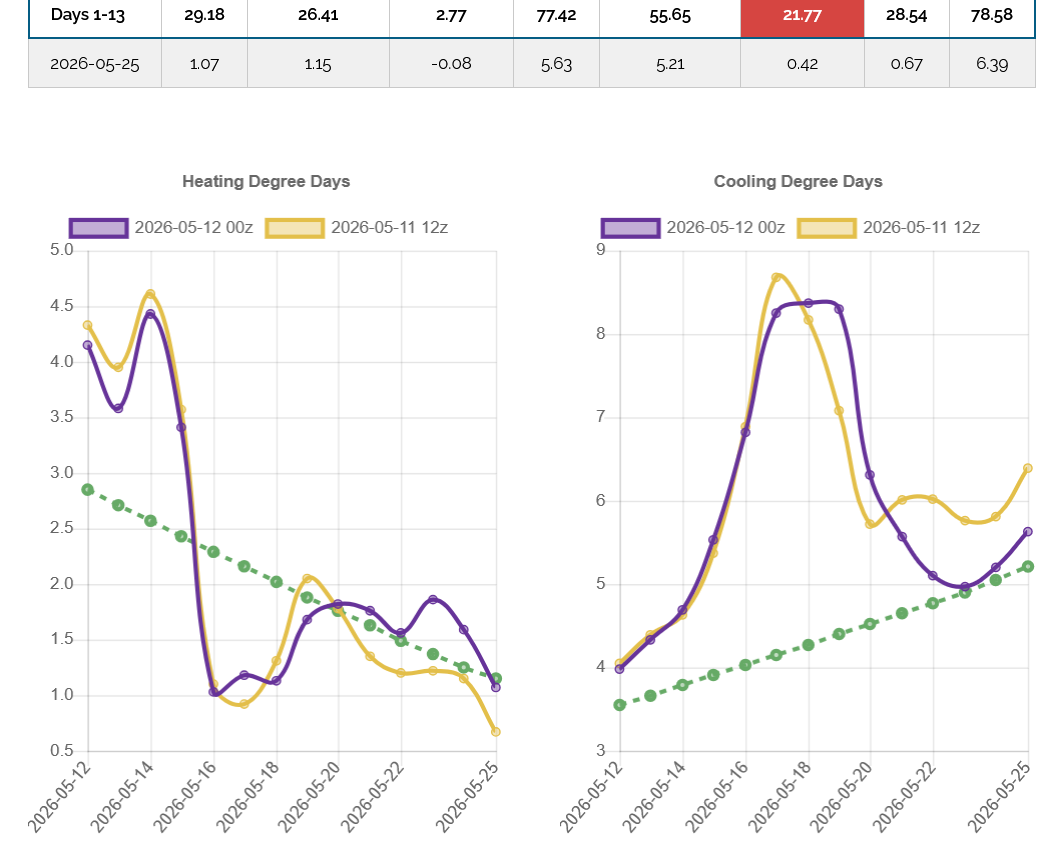
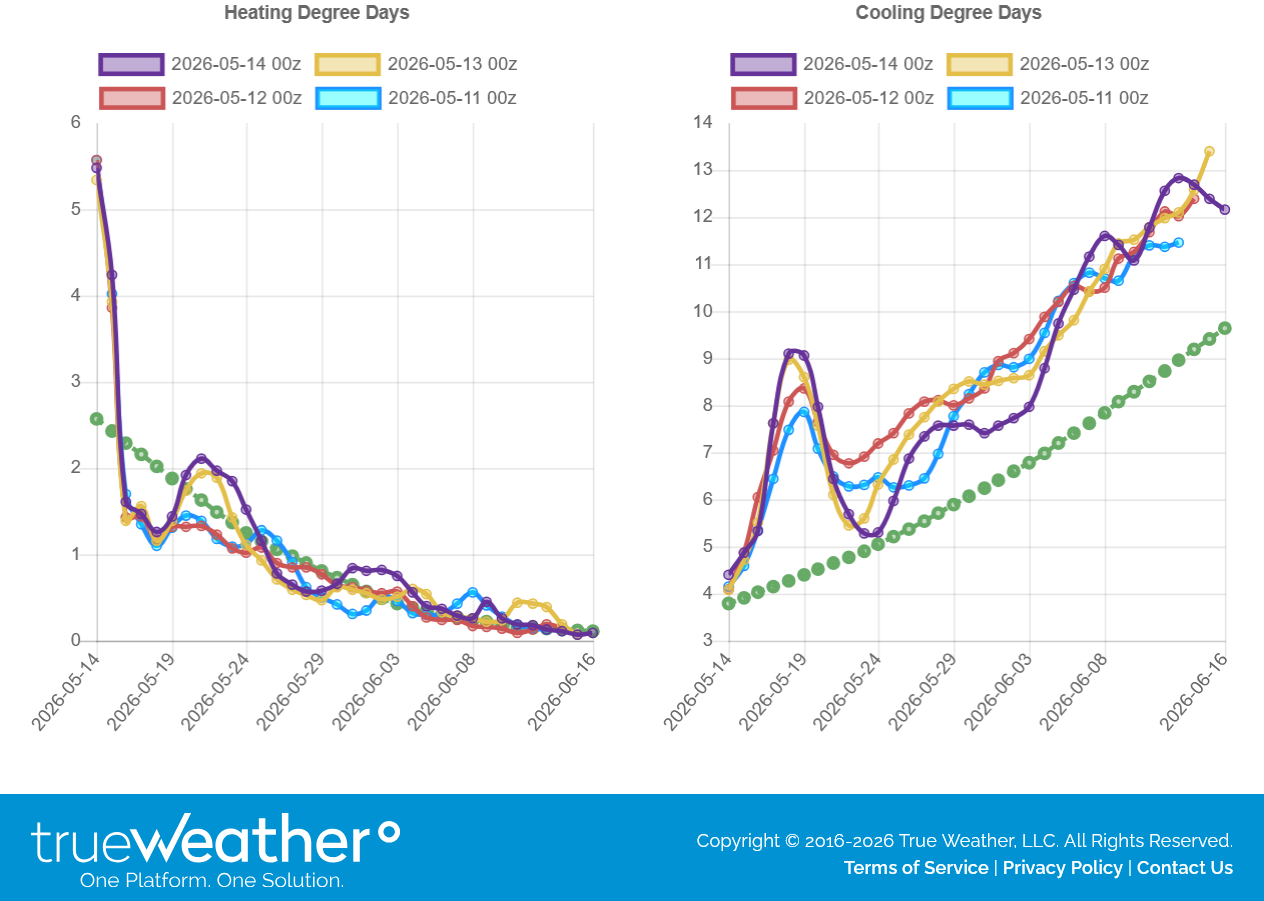
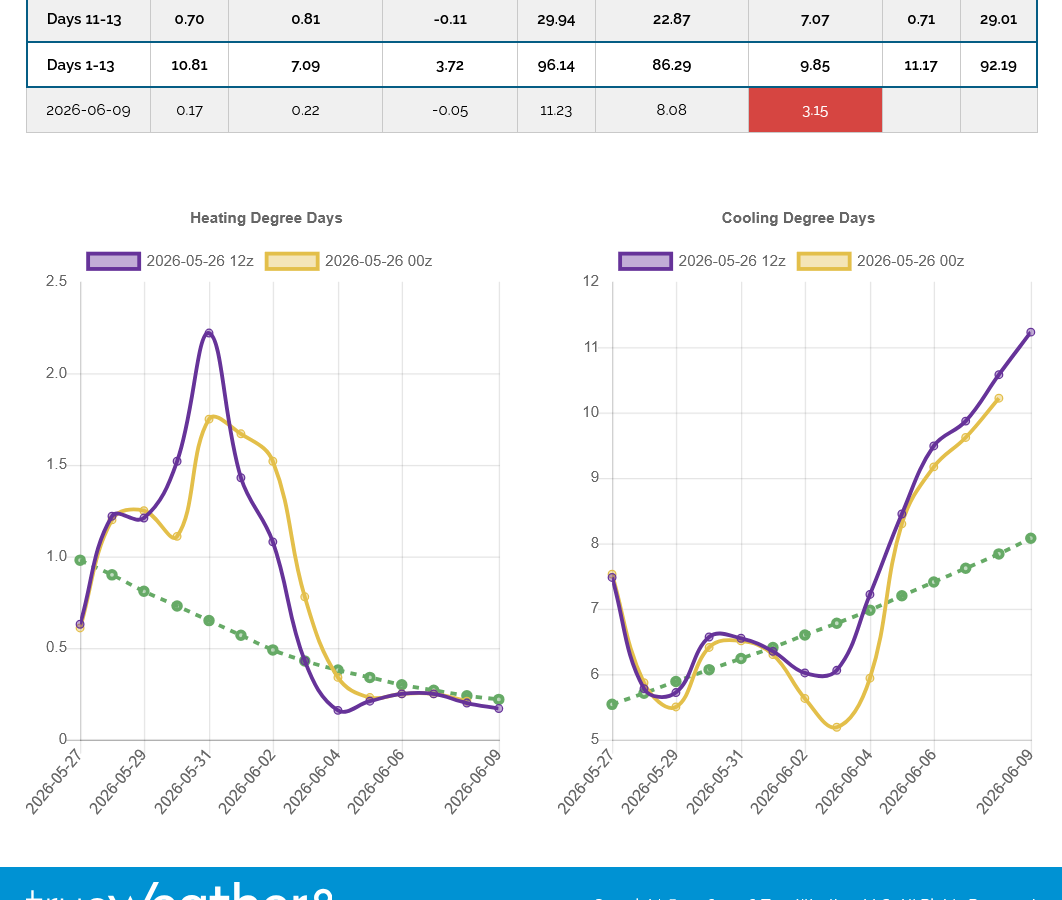
This is the 35 day forecast from the GEFS model. The graph on the right is for CDDs. HDDs on the left don't matter any more and diminish to near 0 by the end of the month. This site provides data that is 1 day old, so the purple, last solution was from yesterday, 5-14-26.
The last 4 solutions tell the same story. June will feature widespread heat, elevated CDDs and increased demand for natural gas that is burned to generate electricity for residential air conditioning.
Note how much higher the predicted CDDs are compared to the green dashed seasonal average.
By the middle of June, CDDs are really elevated, to a level that is approaching the mid-July seasonal peak in the average which is close to 14 on that graph.
+++++++++++++++++++
This is the 500 mb map for the end of that period, along with the temperature anomalies at that time. The Northeast is a place that is most likely to escape the heat.


Those maps are updated daily most of the time here:
Rain/Drought thread May 2026
Started by metmike - May 4, 2026, 9:44 p.m.
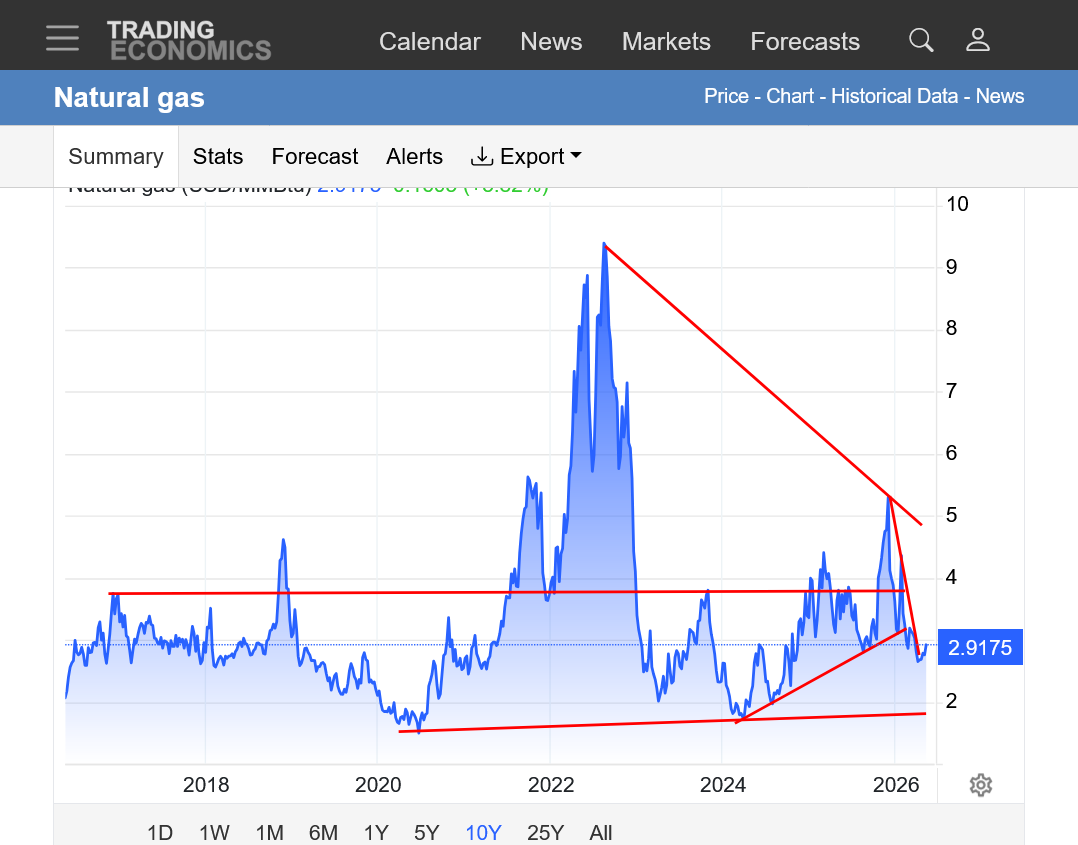
https://tradingeconomics.com/commodity/natural-gas
1. 1 month: As anticipated at the end of April/early this month, the seasonal lows have been confirmed. Hot June forecasts are incentivizing speculative buying.
2. 1 year: Spikes up and down from extreme cold this past Winter. Downtrend continued in March and April from mild temps that caused an early start to the injection season. Headed up now in anticipation of a HOT June.
3. 10 years: Huge spike up in 2022 that peaked in the Summer, followed by record smashing, numerous 100+ injections in the Fall that crashed prices fast! One can make a bullish or bearish case for the current interpretation.
Factors like the Iran war,/exports, hot weather with increased demand and the economy are probably in the drivers seat.
Don't forget that a recession kills industrial demand and is bearish natural gas prices.
Also, fake green energy (solar/wind) cuts demand for natural gas too as they generate electricity. I use the term fake, only because wind energy is the most ANTI environmental type of energy there is by a Grand Canyon wide margin and the huge increase in CO2, while warming the planet has massively greened up the planet from the indisputable law of photosynthesis.
"Green" energy is a made up entirely POLITICAL term to falsely label ANTI green energy as environmentally friendly.
By every authentic standard, especially scientific, biological, plants, crops.....etc fossil fuels are the indisputable champion when it comes to AUTHENTIC green energy........and its not even close.
Death by GREENING!
Started by metmike - May 11, 2021, 2:31 p.m.
https://www.marketforum.com/forum/topic/69258/
7 days for next Thursdays's EIA report. Chilly East, especially Northeast, where lots of people live (probably some lingering HDDs in the Northeast). HOT West to the Plains, where less people live.
https://www.cpc.ncep.noaa.gov/products/tanal/temp_analyses.php

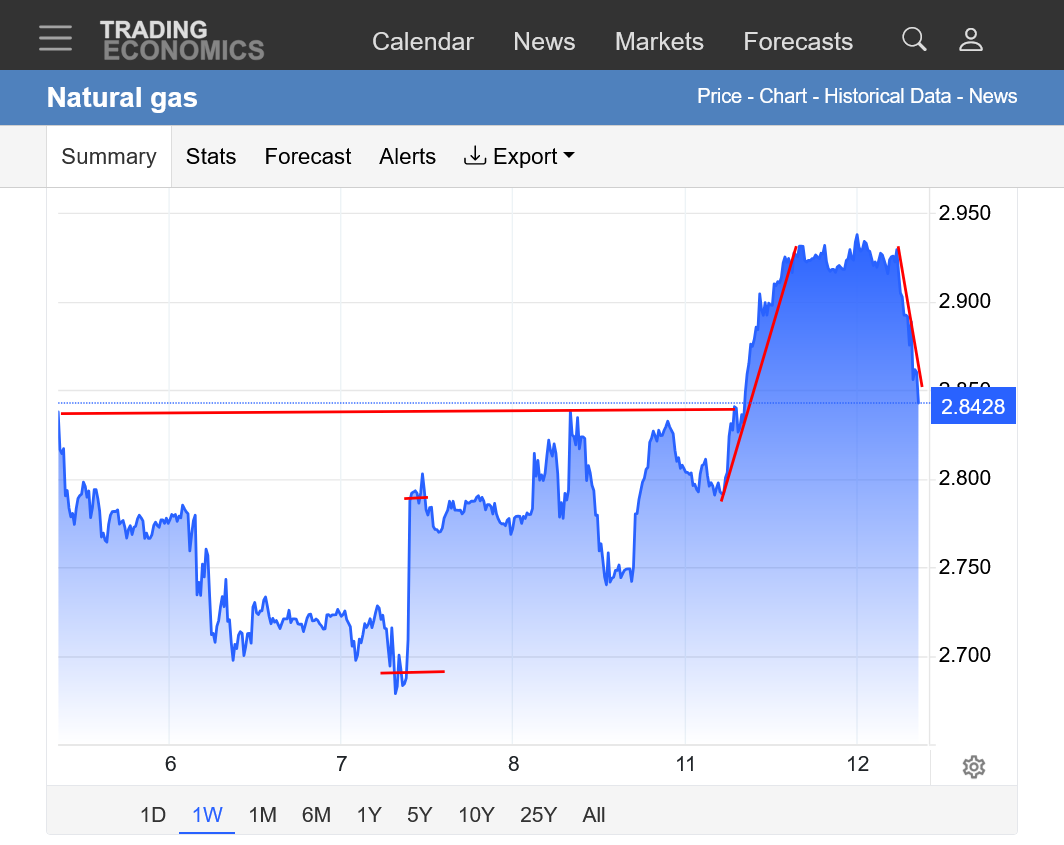
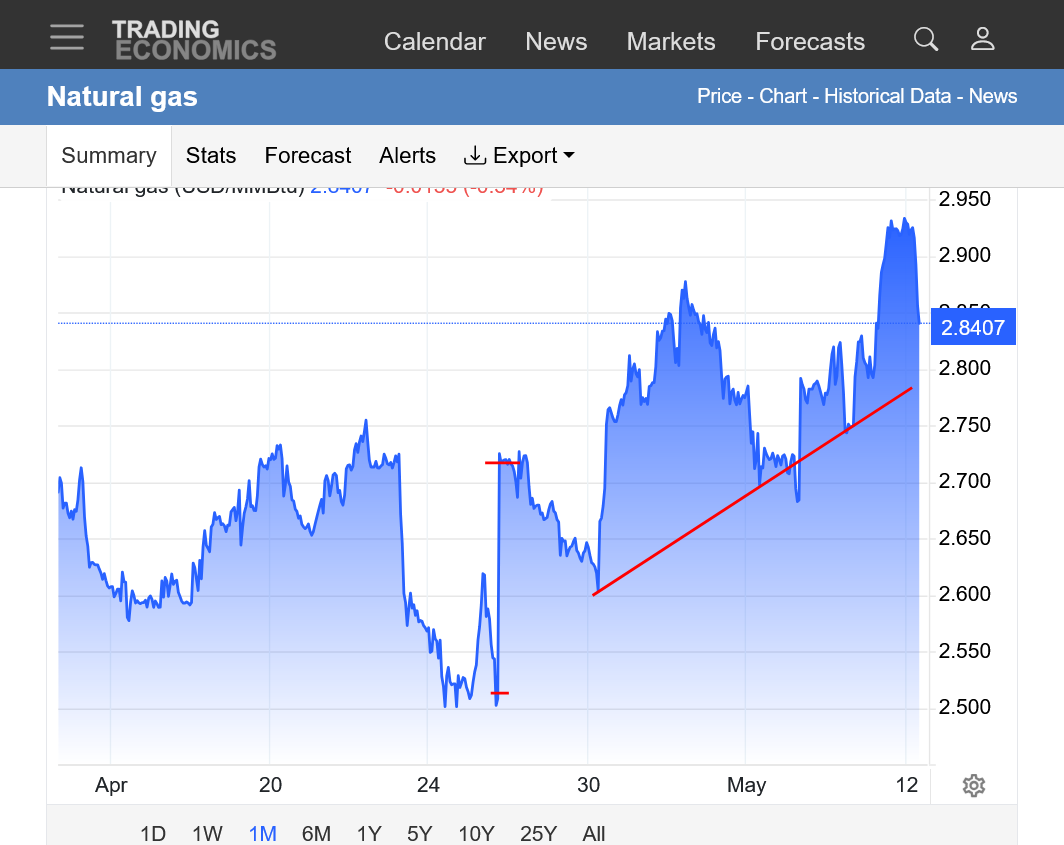
https://tradingeconomics.com/commodity/natural-gas
1. 1 week: Minor setback today.
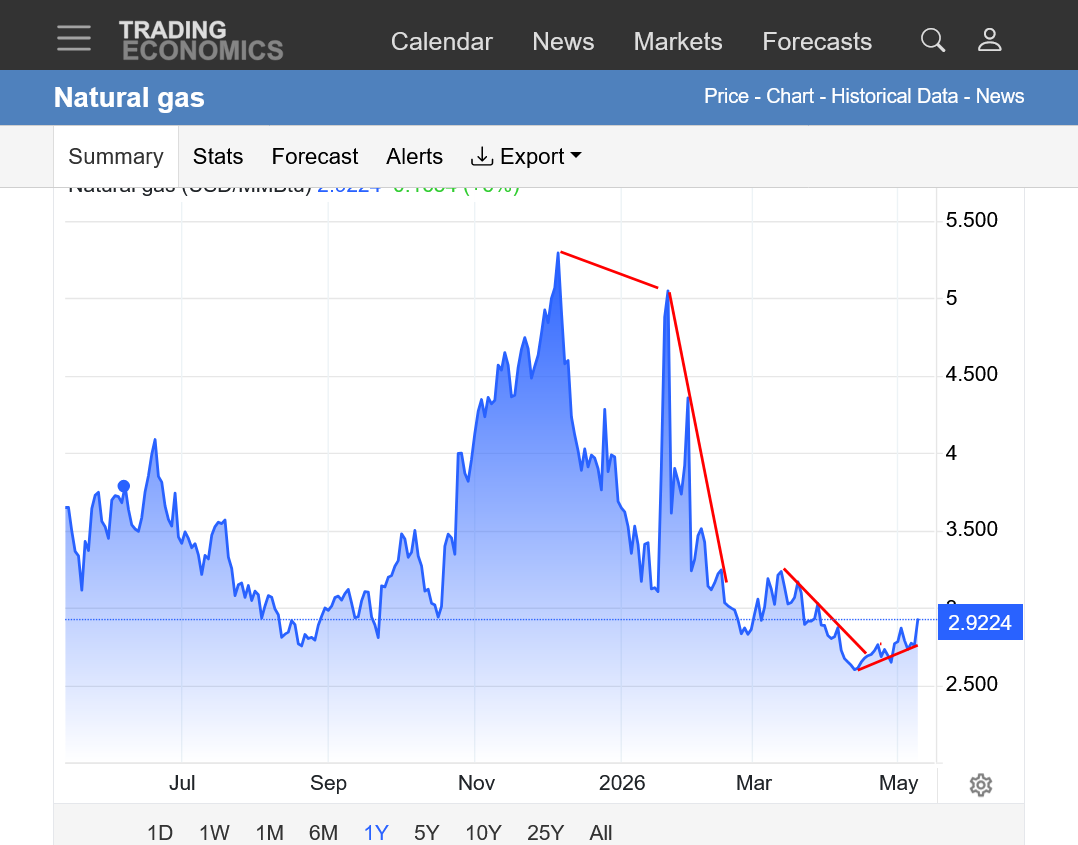
2. 1 month: The lows are in!
++++++++++++++++
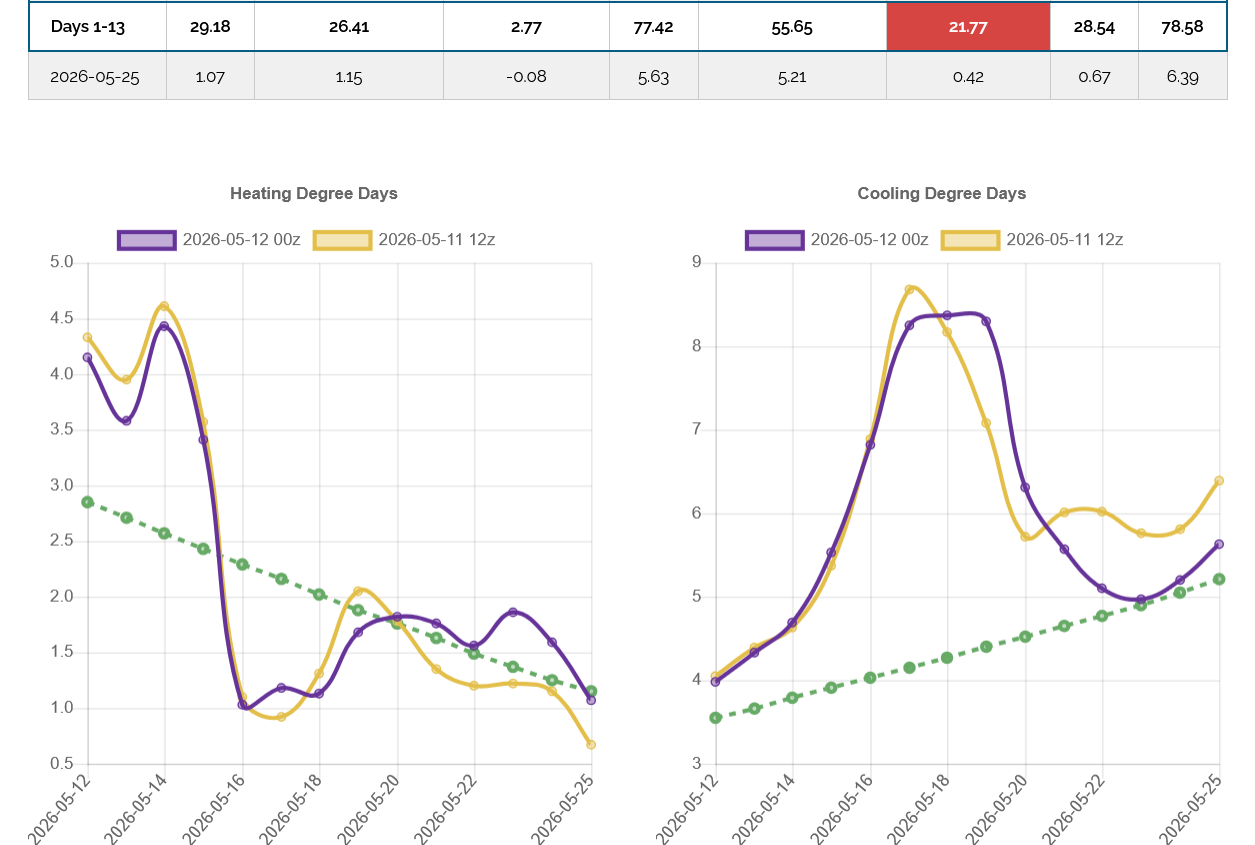
-6 CDDs on the last 12z European model ensemble run shown in purple on the right with the previous run from 12 hours earlier. The rapidly climbing green line is the historical/climatological average. It peaks in mid July just below 14/day.
+101 Bcf
Note the blue line on the graph below(this years storage number) remains above the 5 year average. It bottomed several weeks early this year from a mild end to the heating season. This caused the seasonal bottom IN PRICES to occur later than usual as injections to storage started early (when the last couple of small draw downs would typically happen).
This is the entire reason for the blue line to be above the gray line.
![]()
for week ending May 15, 2026 | Released: May 21, 2026 at 10:30 a.m. | Next Release: May 28, 2026
| Working gas in underground storage, Lower 48 states Summary text CSV JSN | |||||||||||||||||||||||||
|---|---|---|---|---|---|---|---|---|---|---|---|---|---|---|---|---|---|---|---|---|---|---|---|---|---|
| Historical Comparisons | |||||||||||||||||||||||||
| Stocks billion cubic feet (Bcf) | Year ago (05/15/25) | 5-year average (2021-25) | |||||||||||||||||||||||
| Region | 05/15/26 | 05/08/26 | net change | implied flow | Bcf | % change | Bcf | % change | |||||||||||||||||
| East | 419 | 388 | 31 | 31 | 427 | -1.9 | 413 | 1.5 | |||||||||||||||||
| Midwest | 505 | 476 | 29 | 29 | 507 | -0.4 | 503 | 0.4 | |||||||||||||||||
| Mountain | 210 | 206 | 4 | 4 | 191 | 9.9 | 150 | 40.0 | |||||||||||||||||
| Pacific | 286 | 279 | 7 | 7 | 243 | 17.7 | 214 | 33.6 | |||||||||||||||||
| South Central | 972 | 941 | 31 | 31 | 990 | -1.8 | 962 | 1.0 | |||||||||||||||||
| Salt | 298 | 285 | 13 | 13 | 319 | -6.6 | 292 | 2.1 | |||||||||||||||||
| Nonsalt | 673 | 656 | 17 | 17 | 670 | 0.4 | 670 | 0.4 | |||||||||||||||||
| Total | 2,391 | 2,290 | 101 | 101 | 2,358 | 1.4 | 2,242 | 6.6 | |||||||||||||||||
| Totals may not equal sum of components because of independent rounding. | |||||||||||||||||||||||||
Working gas in storage was 2,391 Bcf as of Friday, May 15, 2026, according to EIA estimates. This represents a net increase of 101 Bcf from the previous week. Stocks were 33 Bcf higher than last year at this time and 149 Bcf above the five-year average of 2,242 Bcf. At 2,391 Bcf, total working gas is within the five-year historical range.
For information on sampling error in this report, see Estimated Measures of Sampling Variability table below.
Note: The shaded area indicates the range between the historical minimum and maximum values for the weekly series from 2021 through 2025. The dashed vertical lines indicate current and year-ago weekly periods.
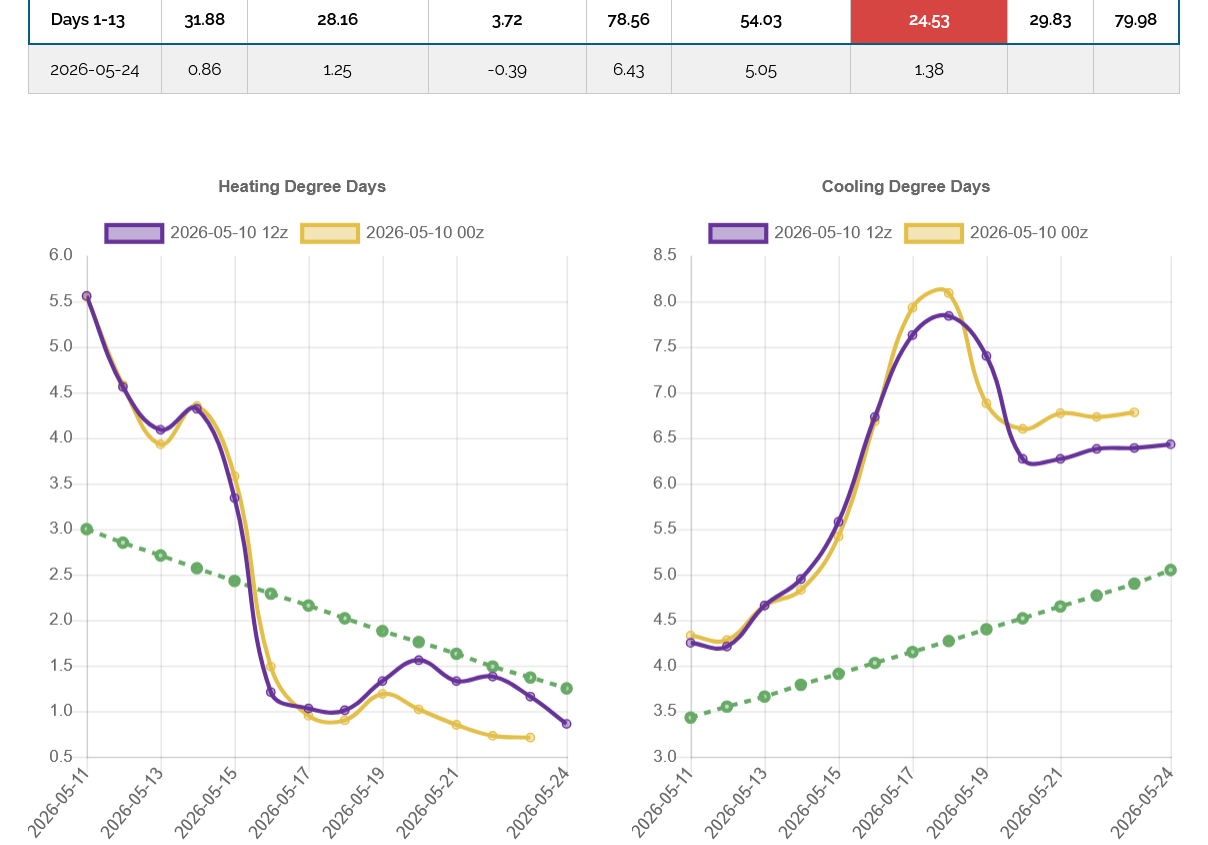
++++++++++++++++++++
The last 0z European Ensemble run(right/purple) added +6 CDDs compared to the previous run 12 hours earlier. So this would add a bit of bullishness. The upcoming heat may mostly be dialed in.
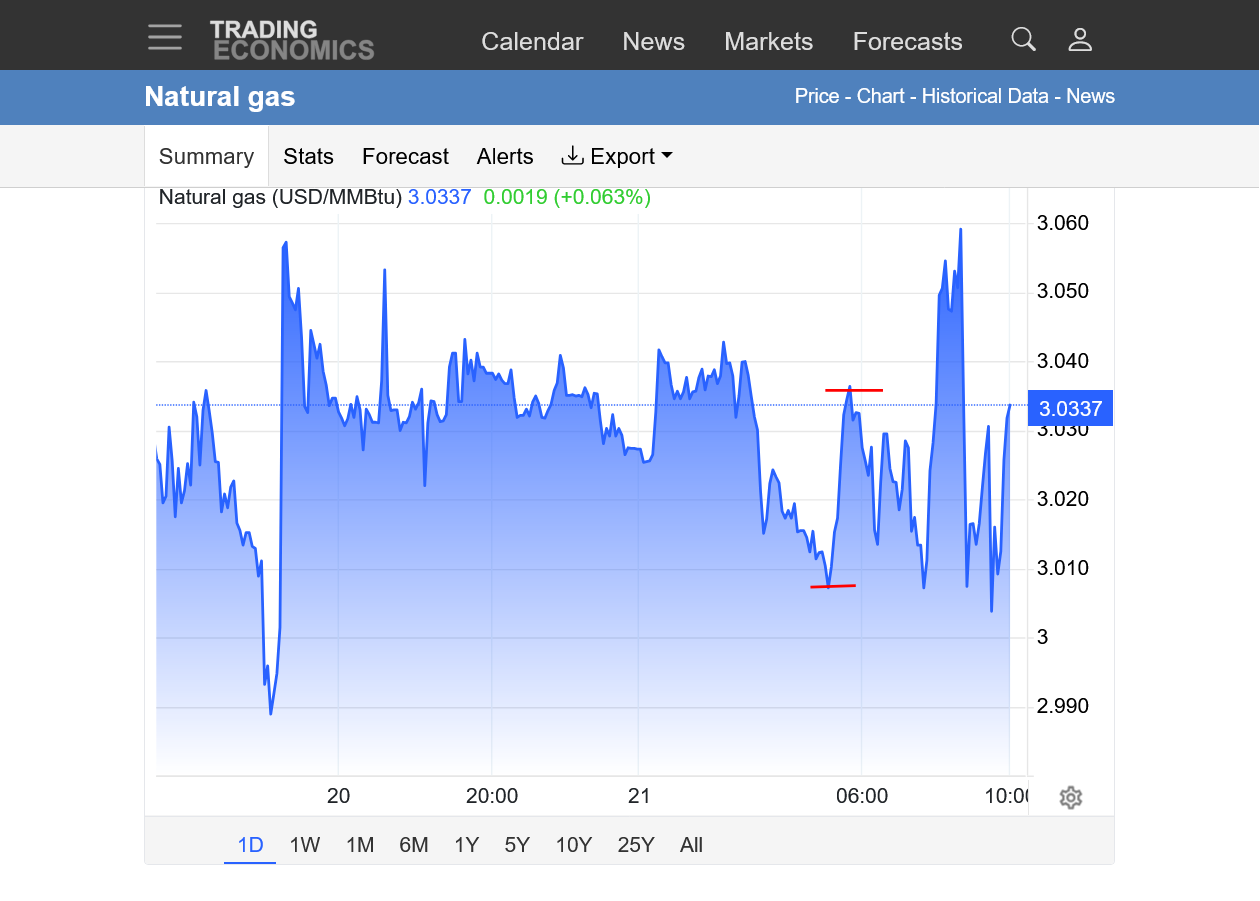
The war in Iran and price of crude can have a big impact on the price of NG. Note below, the spike up just after 5am that happened simultaneously.
The 2nd price chart, natural gas is EXTREMELY choppy!
By metmike - May 21, 2026, 9:22 a.m.
https://tradingeconomics.com/commodity/crude-oil
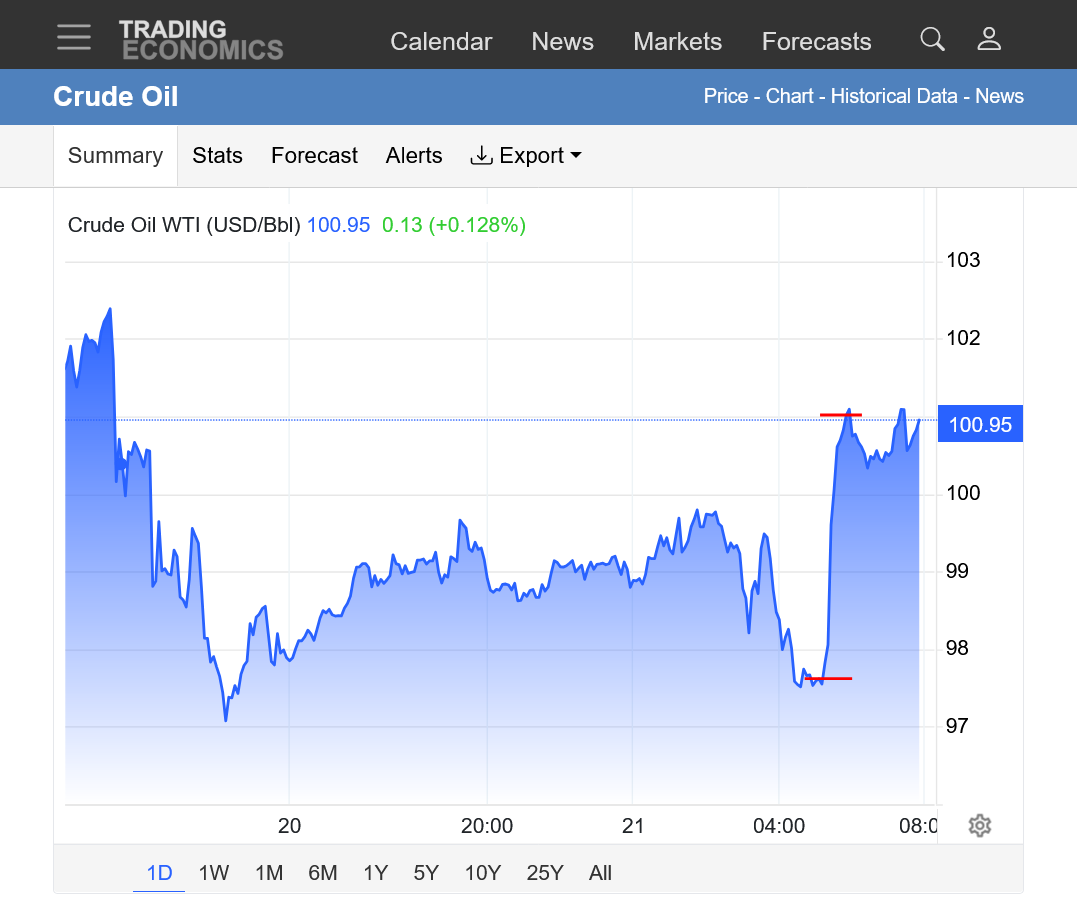
The price chart below for NG goes out an additional 2 hours compared to the crude chart above. The volatility often increases like this just before and after the release of the weekly EIA storage number at 9:30 am.
https://tradingeconomics.com/commodity/natural-gas
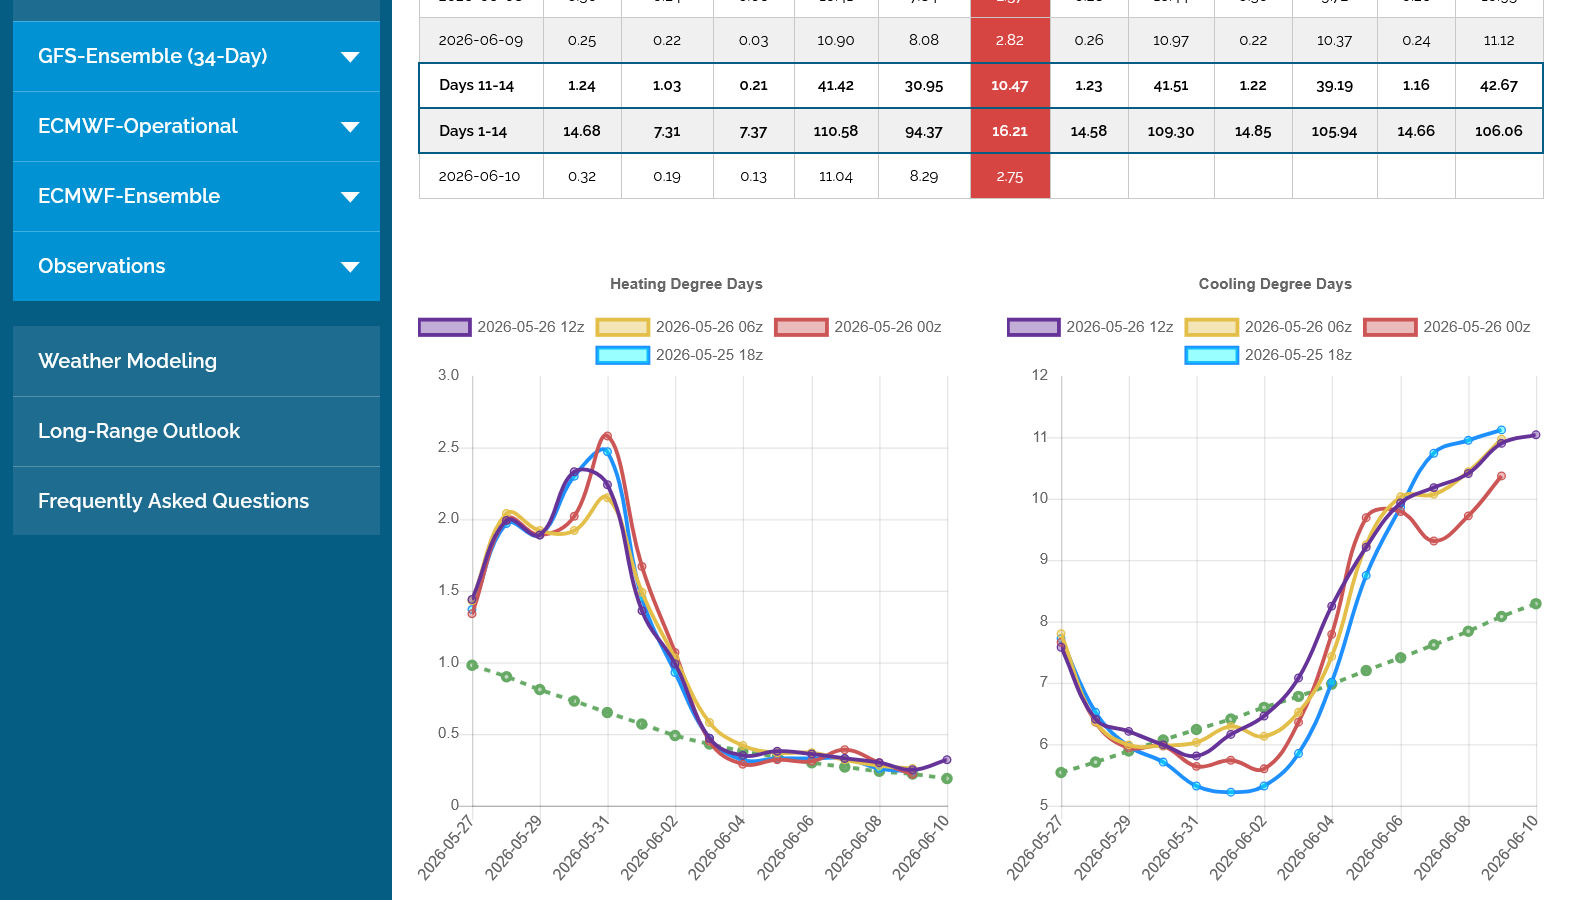
The amount of cooling on the last 3 runs of the GEFS model is stunning!!!! These runs are 6 hours apart, each of them significantly cooler. The last one is in purple(on the right).
We went from significant, widespread heat in blue(18z Thursday-21st) to a cold shot that takes CDDs BELOW the average, green dashed line for several days in the middle of the period(including NEXT weekend).
++++++++++++
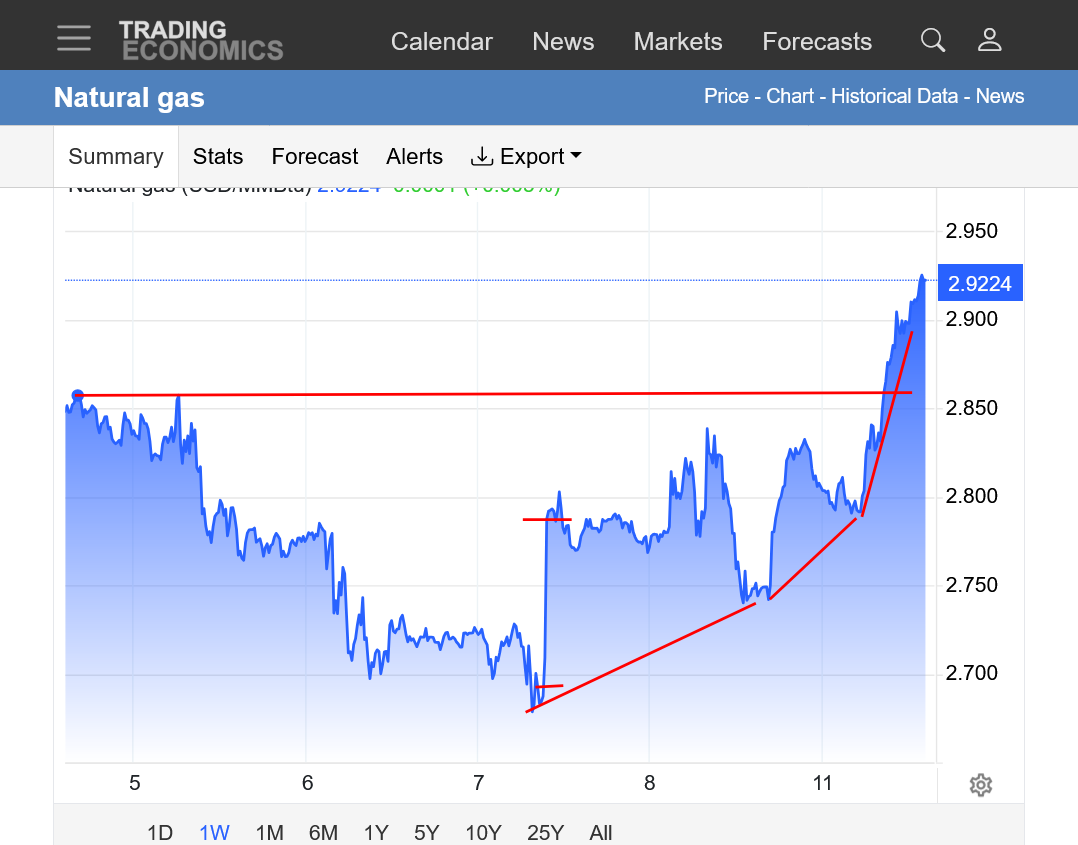
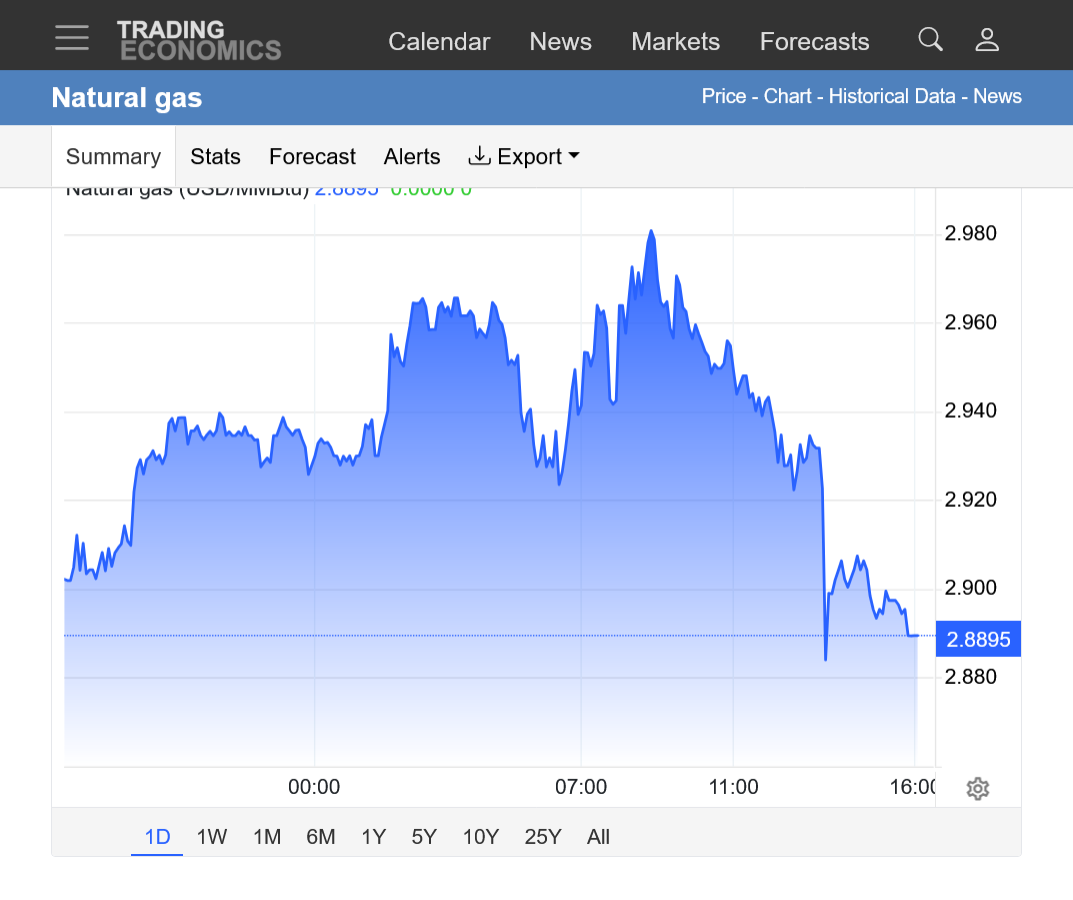
This has put in a short term top!!
https://tradingeconomics.com/commodity/natural-gas
1. 1 day: The selling commenced when the large fund started their day at 6am with aggressive selling and it remained sustained all day.
2. 1 week: The top was actually on Wednesday. The selling accelerated today when the guidance turned much cooler yet.
3. 1 month: The steep uptrend in May, helped substantially from the HEAT in the forecast was broken today.
These were the 7 day temps, ending last Thursday for this weeks weekly ng storage report.
Warm enough in the South for some unseasonable CDDs which might cut down on the injection a little bit because of extra ng burned to generate electricity for AC use. Storage right now is 149 Bcf above the 5 year average thanks to around a 3 week early start to the injection season that to a very mild end to the heating season( which reduced HDDs)!
https://www.marketforum.com/forum/topic/118808/#120366
+++++++++++++++
https://www.cpc.ncep.noaa.gov/products/tanal/temp_analyses.php

+++++++++++++
June NG expires on Tuesday and July NG already has 4 times more volume tonight.
This is the June contract below, with the red horizontal line being the open and high so far.
NG made its seasonal low at the end of April, soaring higher with tons of HEAT in the June forecast which would result in burning lots of NG to generate electricity for residential cooling.
Forecasts last week that dropped temperatures in the 2 week forecast likely helped put in a short term top for NG.
The market reversed lower today, DESPITE a hotter week 2 from the European Ensemble model below(+4 CDDs). Purple line on the right. Previous run was 12 hours earlier.
The 12z GEFS is below that with the last 4 runs(6 hours apart purple being the 12z, last run). Also a bit hotter from week 1.
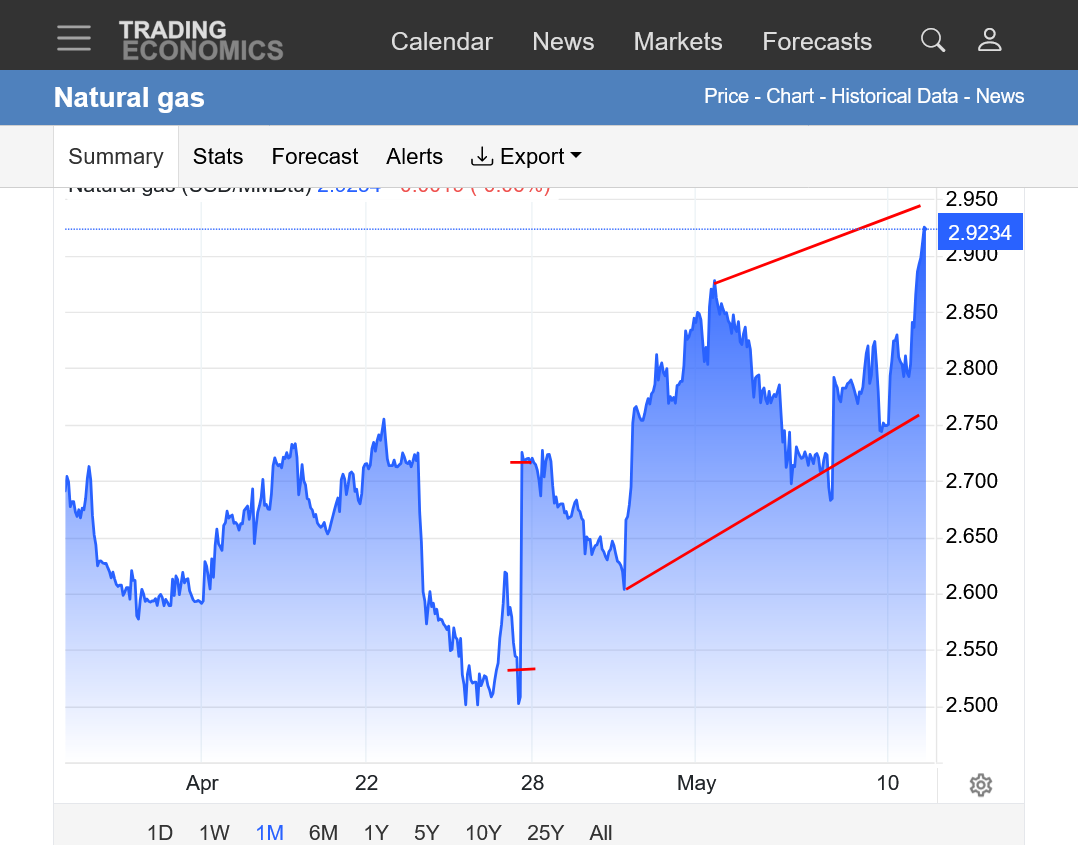
https://tradingeconomics.com/commodity/natural-gas
1. 1 day: Reversal down
2. 1 month: The seasonal lows are in. The steep short term uptrend has been disrupted by the short term high formation last week which likely came from the weather forecasts for this week turning sharply cooler(less CDDs as seen above).
If the June outlook keeps adding CDDs like this last one, this could just be a bull flag.
There is an unusually high amount of uncertainty because of the Iran war impacting the energy markets.
Of utmost significance is the fact that the front month, June natural gas expires tomorrow.
June NG expires today!
0Z European Ensemble, purple/right was +2.4 CDDs compared to the previous run from 12 hours earlier.
MAJOR week 2 heat wave on the way. Note the leap higher in CDDs on the right compared to the climatological average in green that is also climbing.
It usually peaks in mid July just under 14 and this June heat wave will be getting close to that.
Thanks, Mike, for posting. I follow the NG threads closely.
YW, cutworm!!!
That's great to hear because it's why I do it!
Just to mention it to readers. There is an annual fee to renew MarketForum's licensing and internet use that is due every June.
When Alex's wife still owned MarketForum and we were unable to renew our contract with Google Ads and she was nowhere to be found it left us behind on paying those fees and I decided that working this site for free was one thing (with my wife not thrilled) but paying for it went too far.
So WxFollower and cutworm pitched in to pay much of that small fee, then cutworm pitched in again the 2nd year.
I now have full ownership of MarketForum and can do what I want so it seems more justified for me to pay it out of my pocket even though its still paying.
Glad this came up because the fee is due in June.
The point of reviewing this is that their monetary assistance was very appreciated but even more so, their wanting to be part of something because they see the value of what we provide here.
I probably should be like everybody else and show ads here to generate a bit of revenue and maybe I will still at some point but that's not what I care about. I have low interest in recruiting new members and am happy just providing reliable, authentic information. Some of it I would look at even if MarketForum didn't exist but most of it because this site is a platform to share our wonderful world with readers and that gives me additional purpose in life.
So cutworm your comment validated that and thank you. It's hard to know how many readers that we have at different times. When I share adverse weather posts with my chess families and teachers at 5 schools I know it bumps up by 1,000+. Outside of that, its a guess.
I guess this was bullish! Looks like the previous interpretation of the weakness earlier in the week being a bull flag is verifying.
A 92 Bcf storage injection reported by US Energy Information Administration (EIA) for the week ended May 22 sent July New York Mercantile Exchange natural gas futures higherThursday as traders reacted to the contract’s first storage report as prompt month.
for week ending May 22, 2026 | Released: May 28, 2026 at 10:30 a.m. | Next Release: June 4, 2026
| Working gas in underground storage, Lower 48 states Summary text CSV JSN | |||||||||||||||||||||||||
|---|---|---|---|---|---|---|---|---|---|---|---|---|---|---|---|---|---|---|---|---|---|---|---|---|---|
| Historical Comparisons | |||||||||||||||||||||||||
| Stocks billion cubic feet (Bcf) | Year ago (05/22/25) | 5-year average (2021-25) | |||||||||||||||||||||||
| Region | 05/22/26 | 05/15/26 | net change | implied flow | Bcf | % change | Bcf | % change | |||||||||||||||||
| East | 447 | 419 | 28 | 28 | 458 | -2.4 | 442 | 1.1 | |||||||||||||||||
| Midwest | 539 | 505 | 34 | 34 | 537 | 0.4 | 531 | 1.5 | |||||||||||||||||
| Mountain | 213 | 210 | 3 | 3 | 197 | 8.1 | 157 | 35.7 | |||||||||||||||||
| Pacific | 292 | 286 | 6 | 6 | 253 | 15.4 | 223 | 30.9 | |||||||||||||||||
| South Central | 993 | 972 | 21 | 21 | 1,017 | -2.4 | 987 | 0.6 | |||||||||||||||||
| Salt | 305 | 298 | 7 | 7 | 327 | -6.7 | 299 | 2.0 | |||||||||||||||||
| Nonsalt | 688 | 673 | 15 | 15 | 690 | -0.3 | 688 | 0.0 | |||||||||||||||||
| Total | 2,483 | 2,391 | 92 | 92 | 2,462 | 0.9 | 2,339 | 6.2 | |||||||||||||||||
| Totals may not equal sum of components because of independent rounding. | |||||||||||||||||||||||||
Working gas in storage was 2,483 Bcf as of Friday, May 22, 2026, according to EIA estimates. This represents a net increase of 92 Bcf from the previous week. Stocks were 21 Bcf higher than last year at this time and 144 Bcf above the five-year average of 2,339 Bcf. At 2,483 Bcf, total working gas is within the five-year historical range.
For information on sampling error in this report, see Estimated Measures of Sampling Variability table below.
Note: The shaded area indicates the range between the historical minimum and maximum values for the weekly series from 2021 through 2025. The dashed vertical lines indicate current and year-ago weekly periods.
++++++++++++++
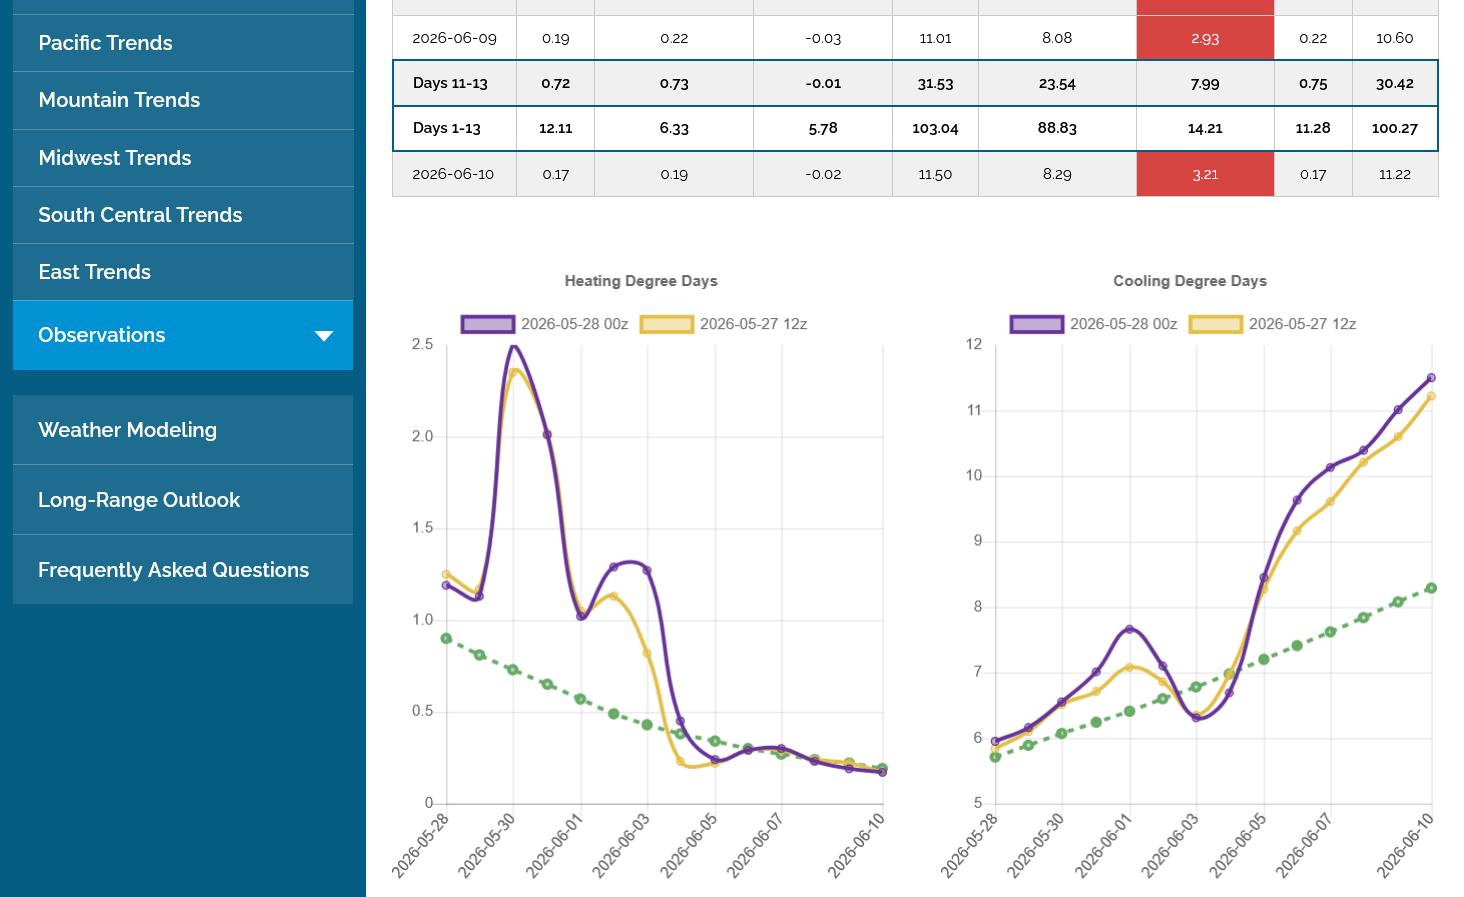
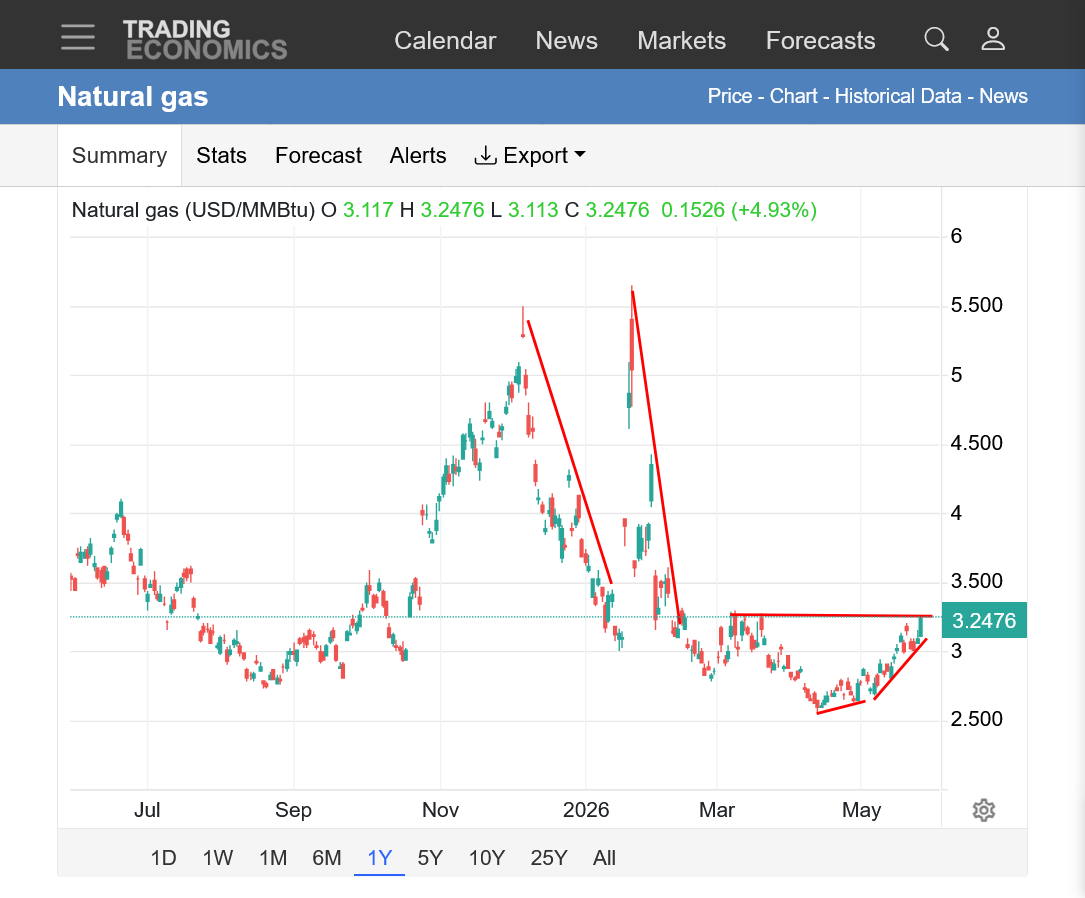
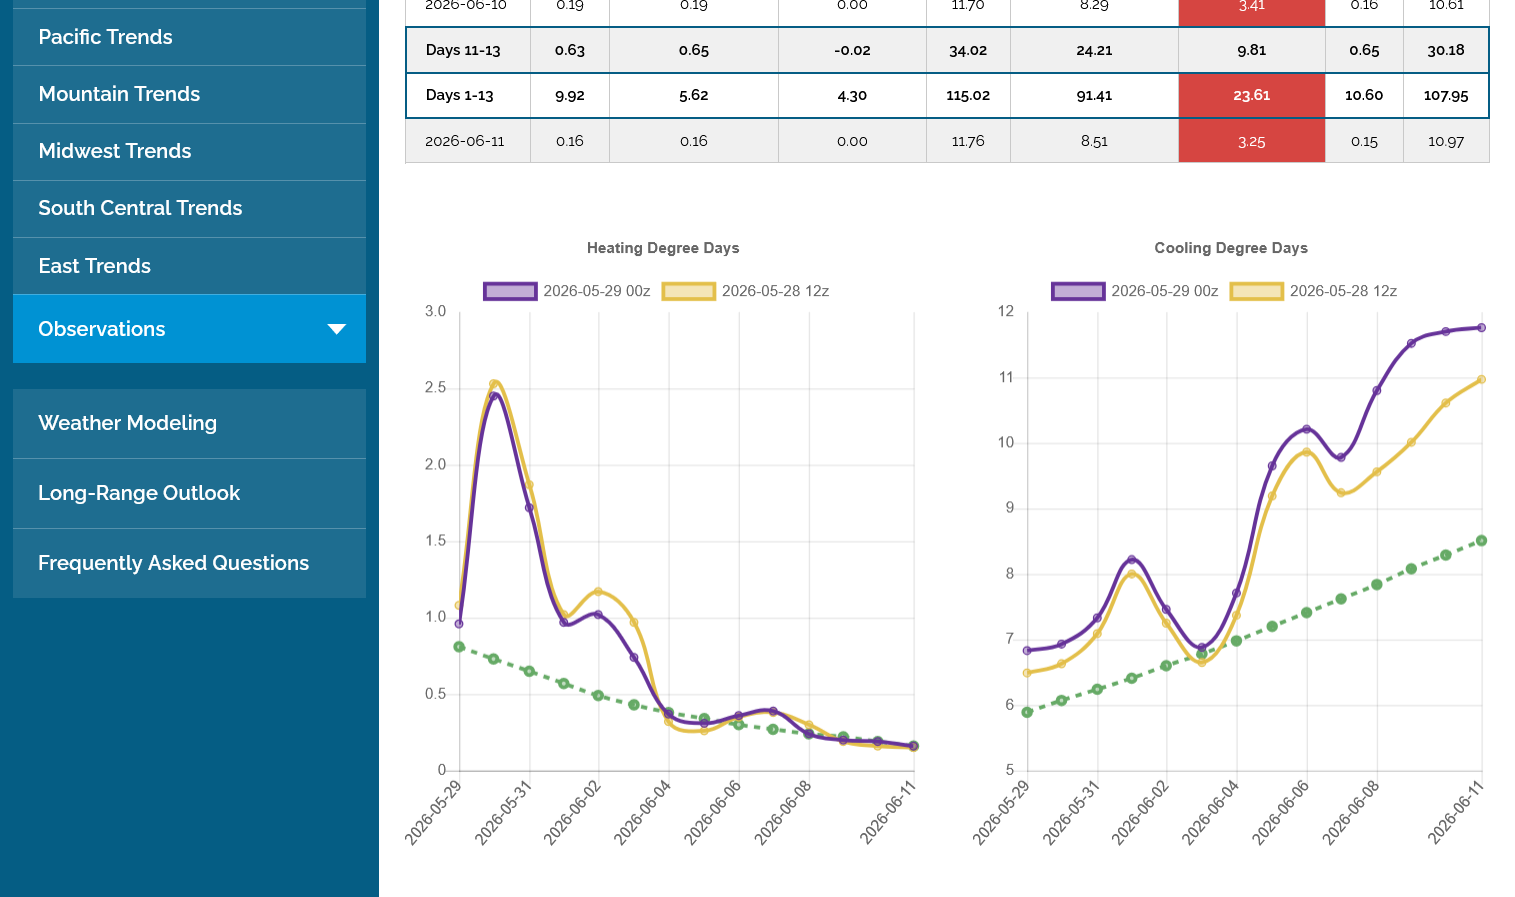
The last 0Z European model ensemble in purple/right added another 3 CDDs vs the previous run 12 hours earlier. The trajectory in week 2 is way up with a steep slope as June starts off with a HOT bang with temps more like July by the end of week 2. That will require alot of electricity for residential cooling that is generated by burning natural gas.
+++++++++++
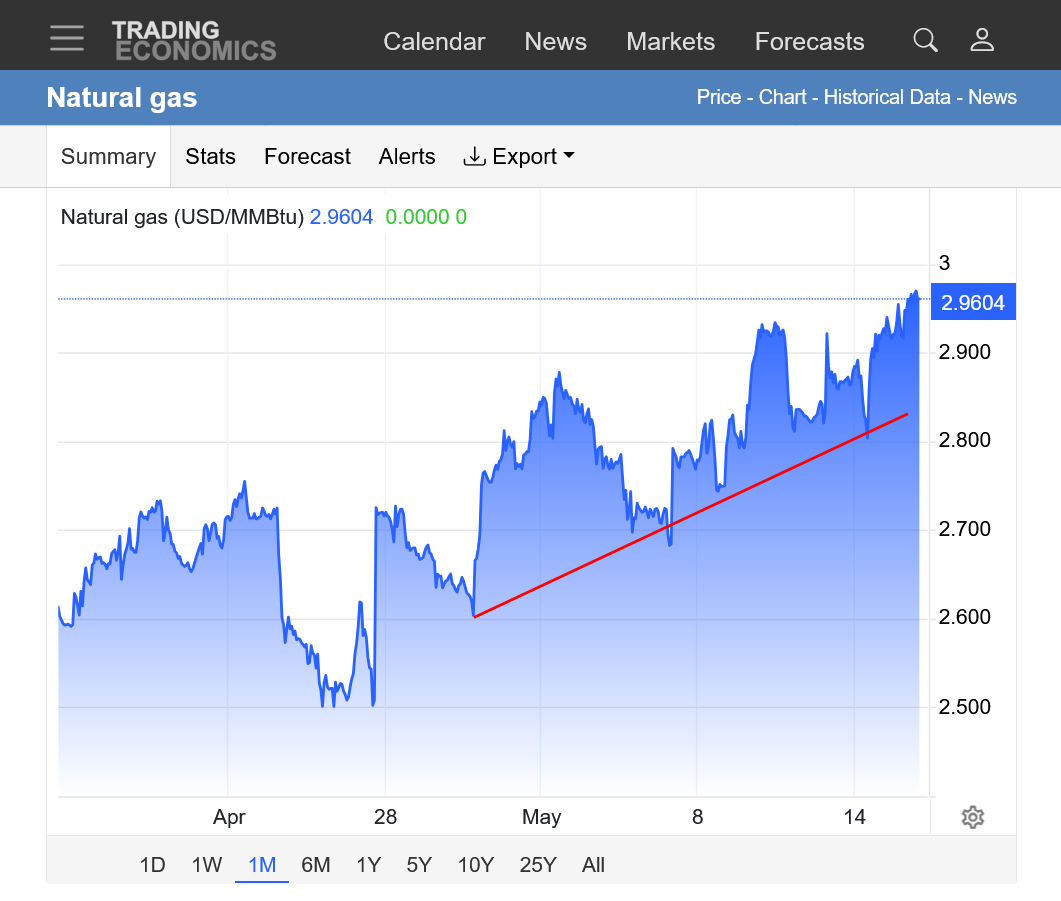
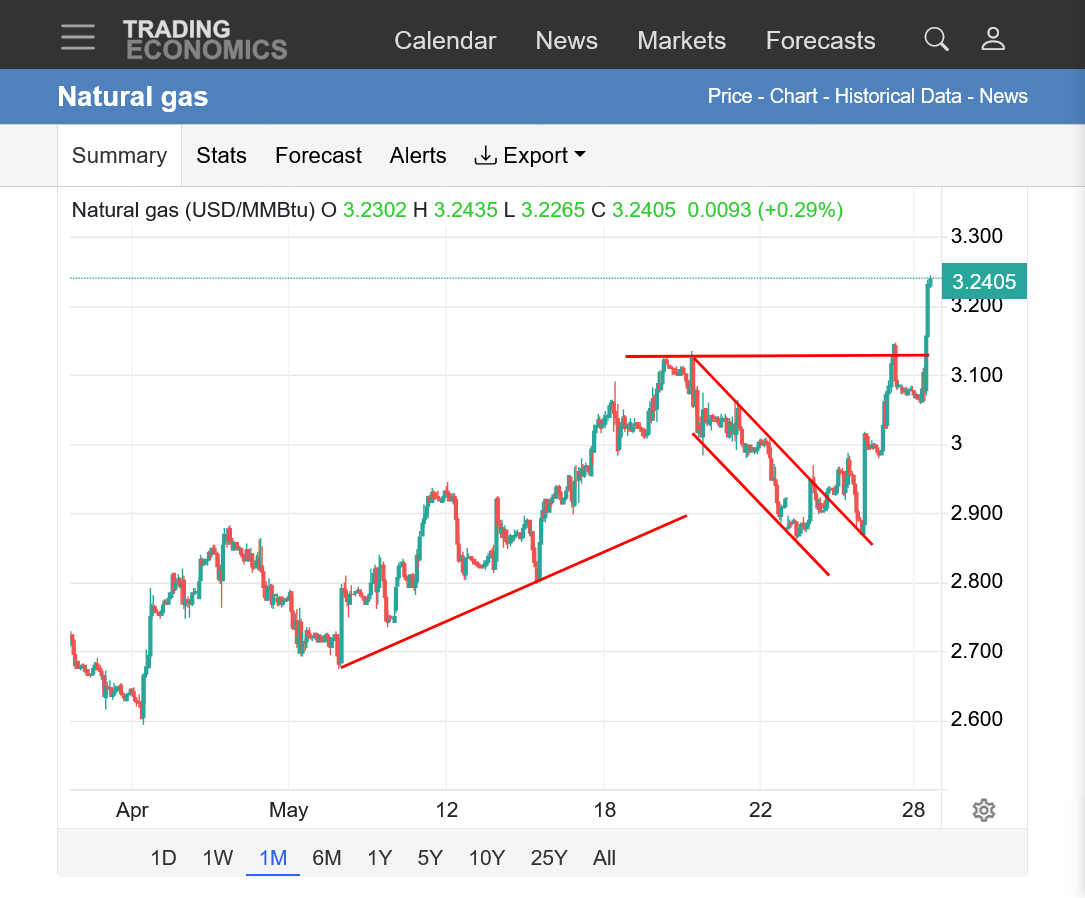
https://tradingeconomics.com/commodity/natural-gas
1. 1 month: Uptrend from the lows, then a bull flag with upside break out today.
2. 1 year: Winter weather spikes! Then seasonal Lows and uptrend. At resistance(for this chart) which looks easy to break based on recent price action and heat in the June forecast.
++++++++++++
High heat builds in the Midwest in early June!
https://www.cpc.ncep.noaa.gov/products/predictions/threats/temp_probhazards_d8_14_contours.png

The last 0z EE was a whopping +7 CDDs (purple on the right graph) vs the previous 12z run from 12 hours earlier which gave NG added fuel to continue the spike higher after midnight! This was mostly added week 2 heat.
The horizontal red line on the 1 day graph below is when traders used this HOTTER weather information to place aggressive, at the market buy orders(that hit all the sell orders going up in order to find the volume needed match them).
This was around 1:30am.
https://tradingeconomics.com/commodity/natural-gas