Get all the comprehensive weather here:
https://www.marketforum.com/forum/topic/83844/
++++++++++++++
Previous thread:
Natural Gas July 23, 2026
47 responses
https://www.marketforum.com/forum/topic/121780/
+++++++++++++++++++
https://tradingeconomics.com/commoty/natural-gas
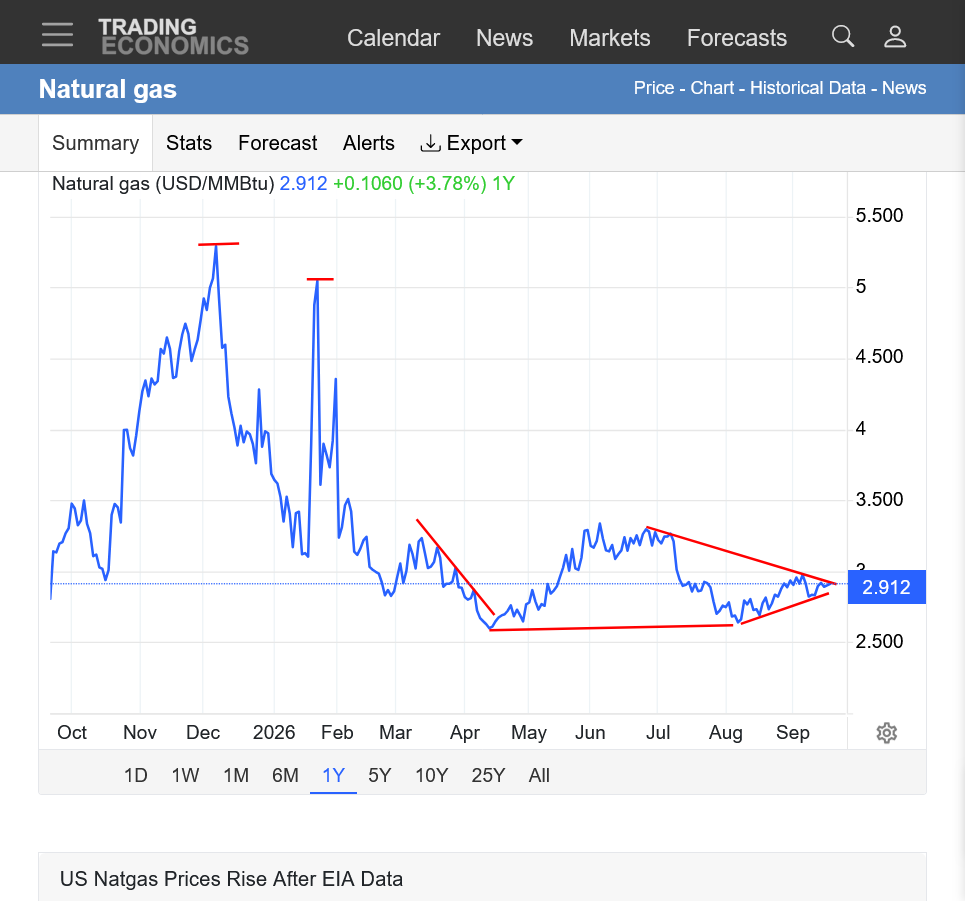
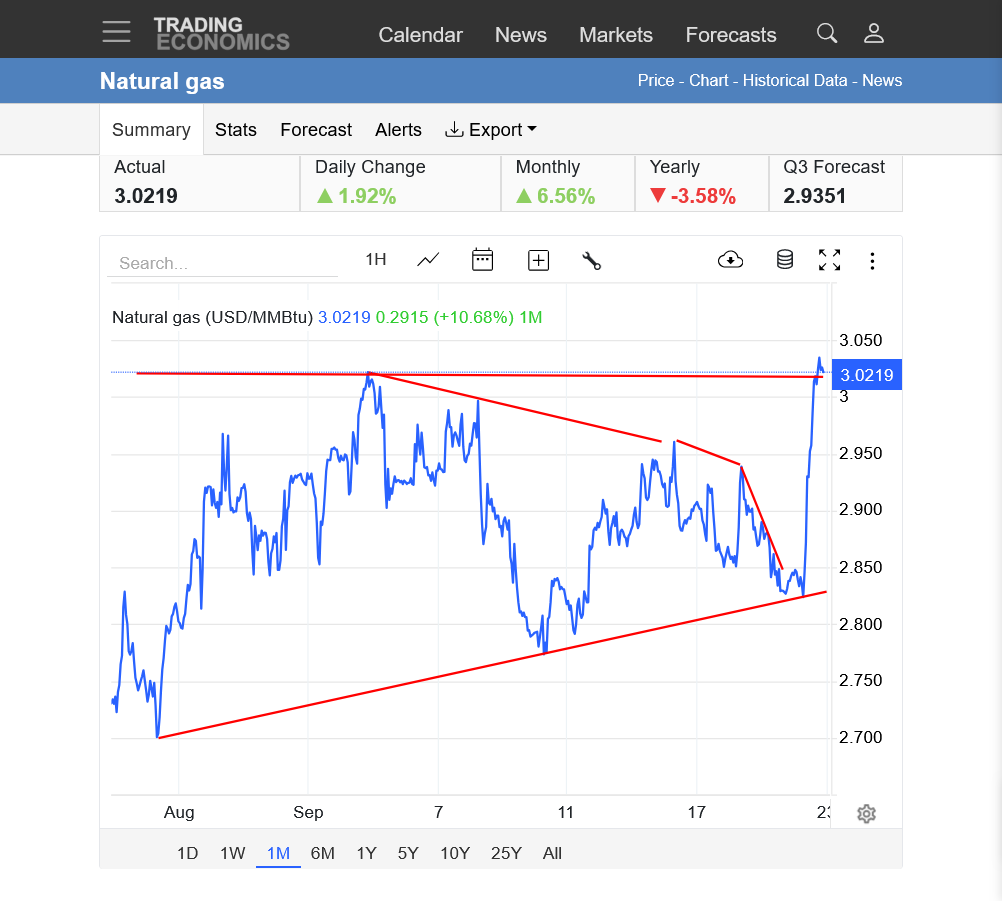
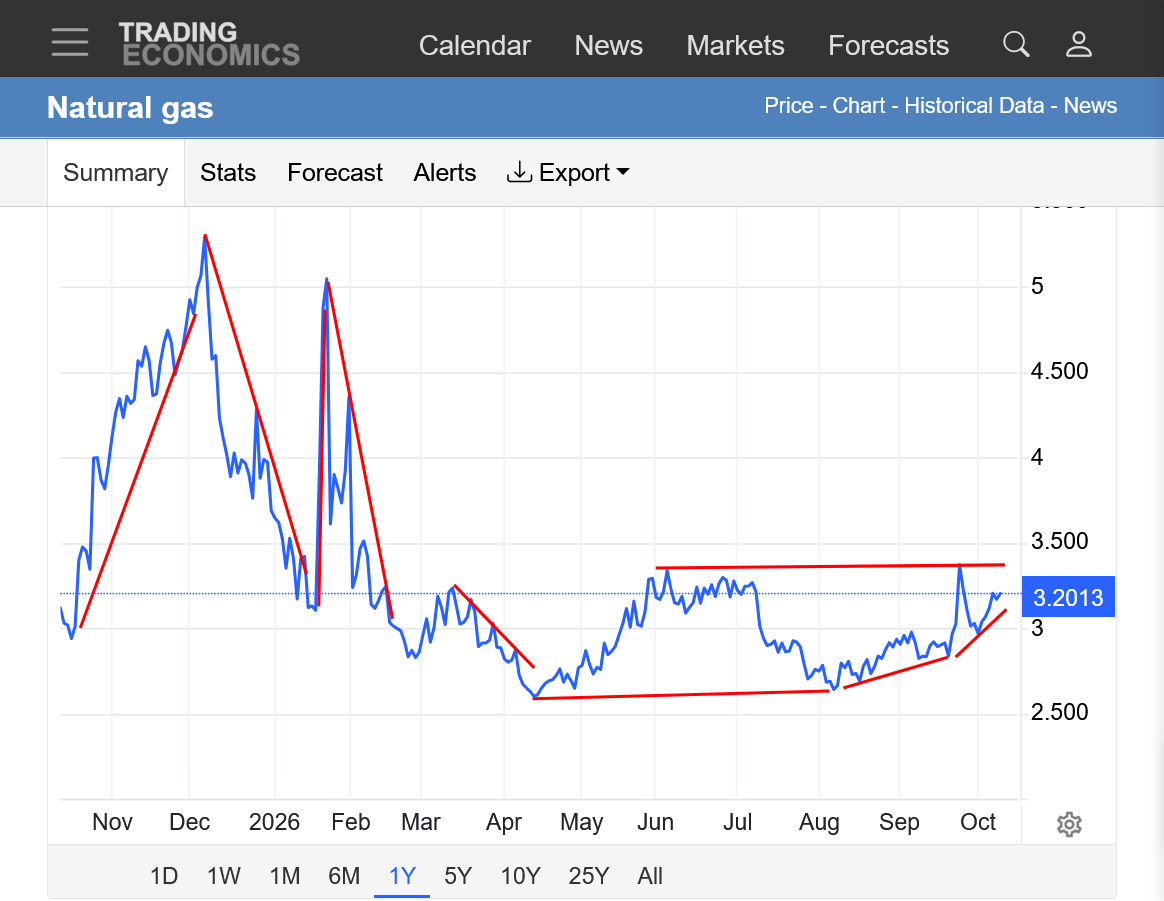
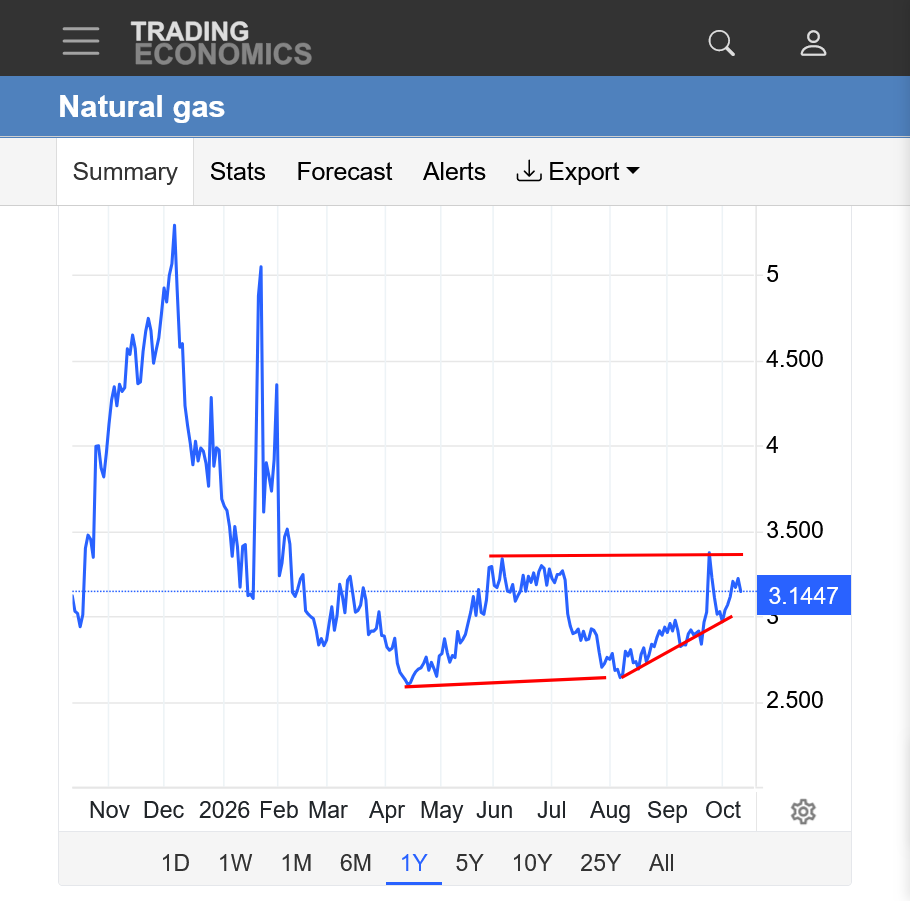
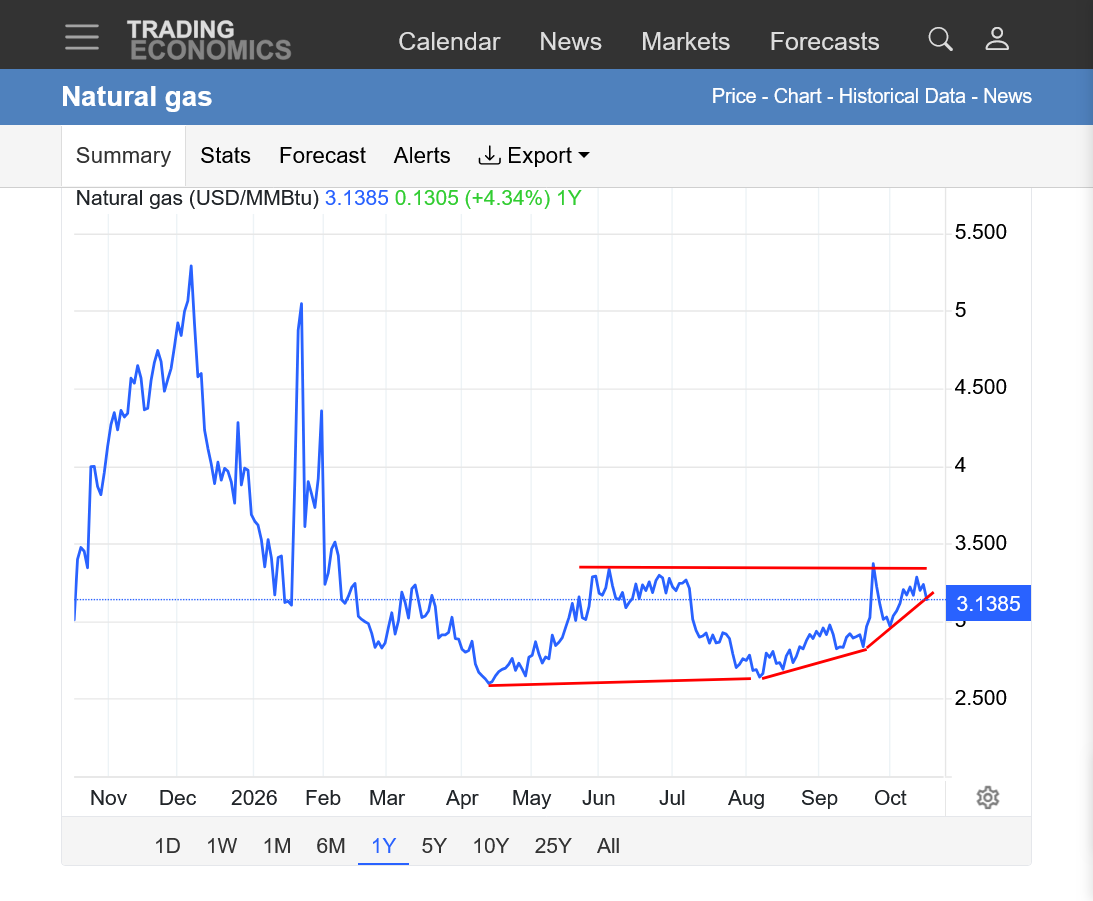
1. 1 year: Weather spikes up last Winter. Late seasonal low in April after a very mild end to the heating season. Since then, higher lows + lower highs =Symmetrical triangle..
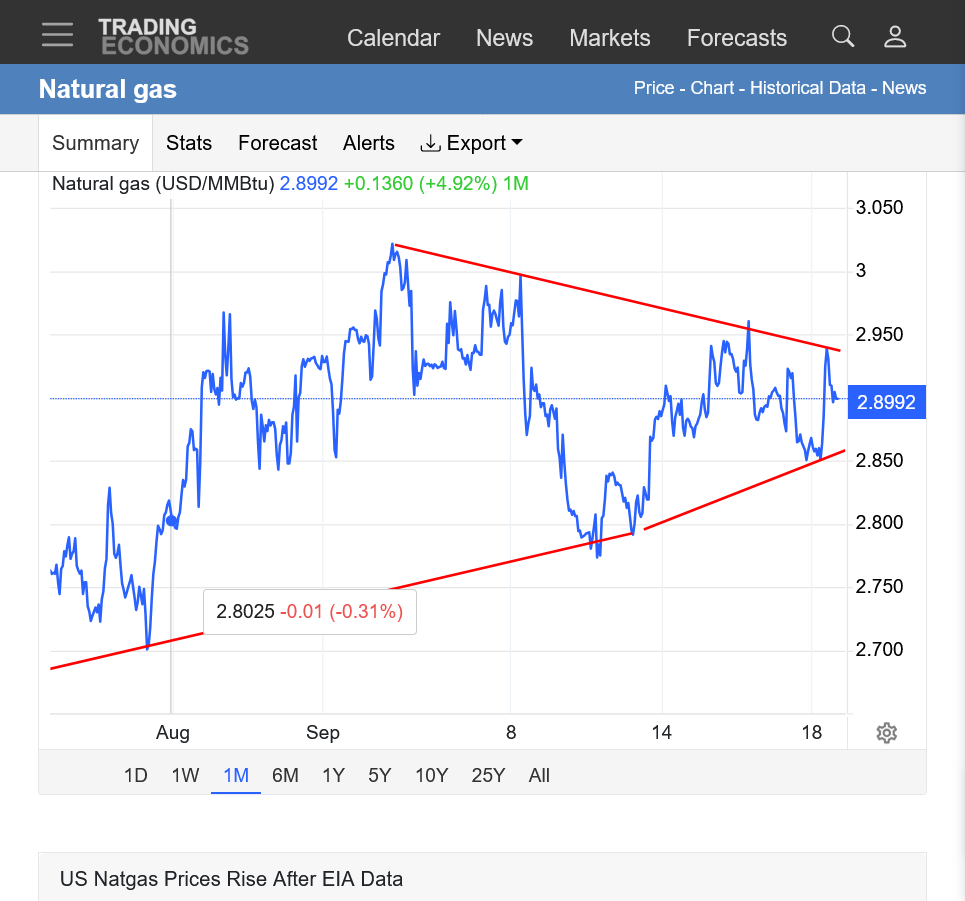
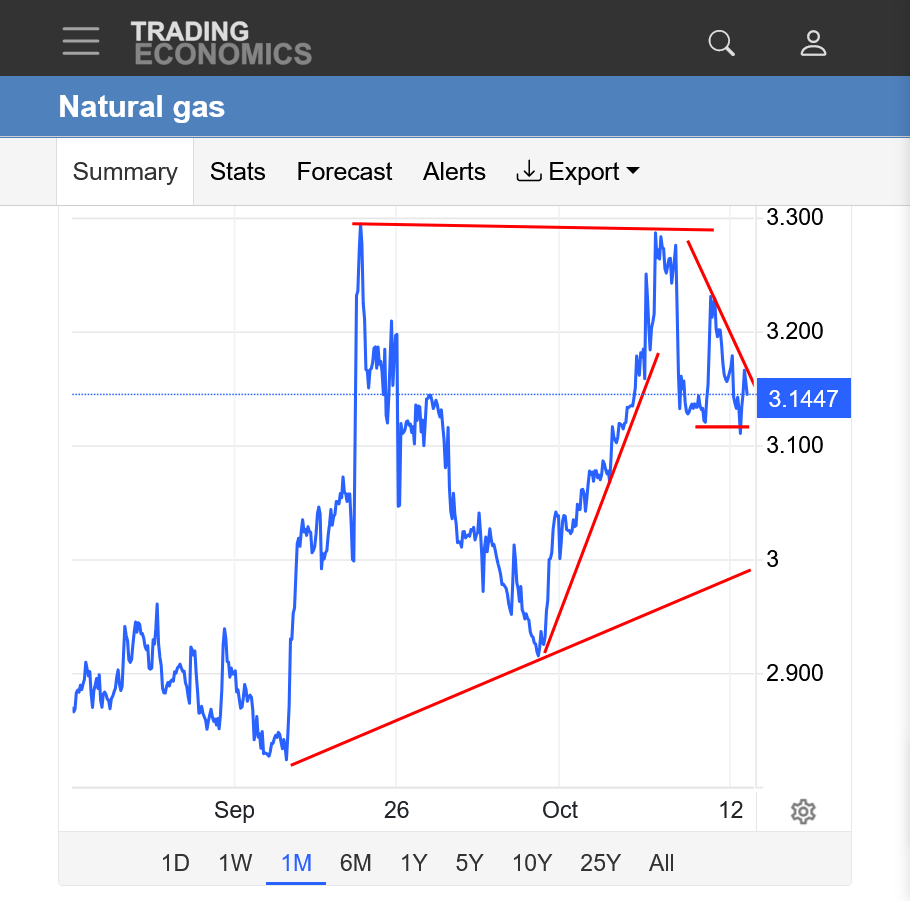
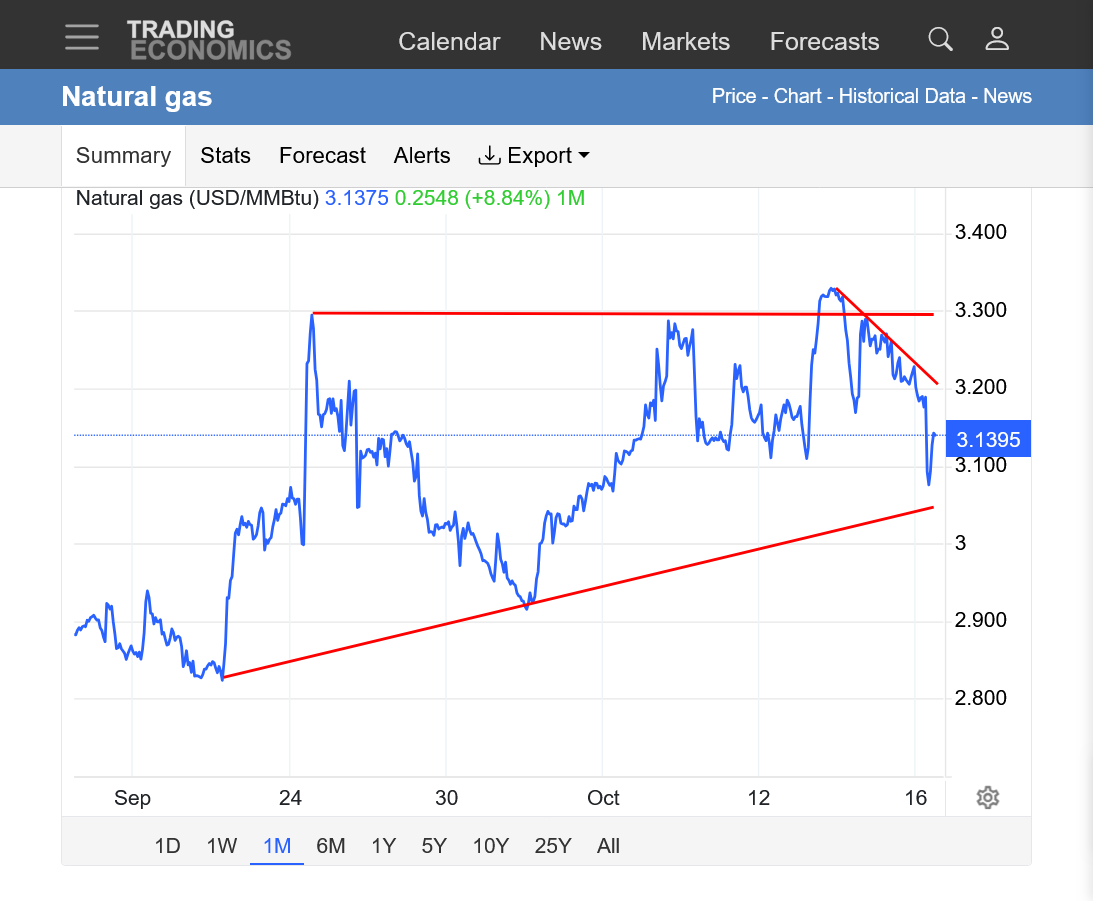
2. 1 month. Symmetrical triangle with an upside bias, especially since a strong upside seasonal will be in place in October well into November(see below).
++++++++++++++++++++++
Seasonals for natural gas turn sharply up ahead of the main demand season(Winter and HDDs). Usually towards the end of September to near the end of November, then they crash lower in early December.
EACH YEAR IS DIFFERENT!
https://charts.equityclock.com/natural-gas-futures-ng-seasonal-chart

Temperatures for next Thursday's EIA:
Near record heat in the South! Small injection for this time of year from elevated cooling demand which comes from burning natural gas to generate electricity!
The market already traded this long before it happened!
https://www.cpc.ncep.noaa.gov/products/tanal/temp_analyses.php
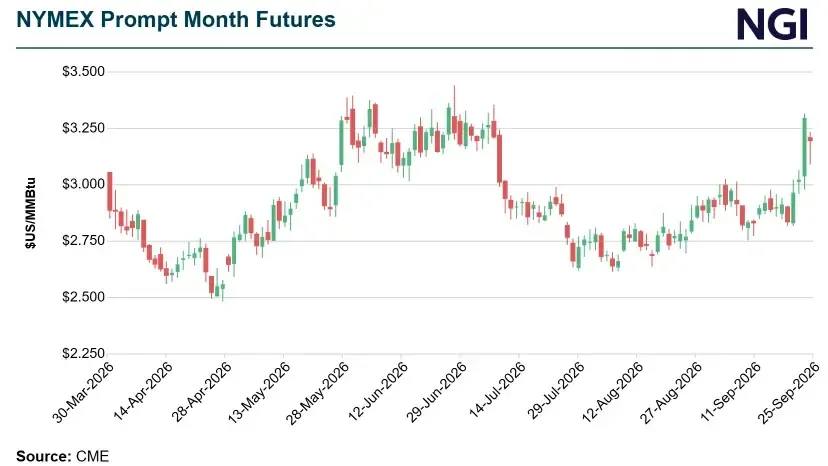
On the price charts above. They are for the CONTINUOUS price of the front month.
When NG was making its seasonal low in April, the front month was trading MUCH lower than the October Natural Gas price, which is the front month right now.
This is making the charts look much more bullish than they really are.
October natural gas traded well above $3 during the month of April. We are LOWER than that right now. The continuous price charts on the earlier page show us trading HIGHER than April.
This is fairly typical since futures prices are in Contango(higher priced as you go out farther in the future) most of the time.
Recent crude oil prices have been an extreme exception!
++++++++++
By metmike - Sept. 9, 2026, 3:30 p.m.
I wish that I could show just the October, front month which is at life of contract highs. Back in June, when we last traded at this price on the CONTINUOUS chart, the market expected the war to be over in September/October and so there was a tremendous amount of premium in the front months.
That extremely abnormal backwardation has returned.
The front month, October is trading $25 higher than the January 2027 contract!
https://www.investopedia.com/terms/b/backwardation.asp

++++++++++
AI Overview
A futures market is in backwardation when near-term (front-month) prices are higher than prices for later-dated delivery. [1]What High Front-Month Backwardation Means
Common Markets for Backwardation
Natural gas just shot up +$1,000/contract but not from weather. Maybe the seasonal, pre Fall low is in?
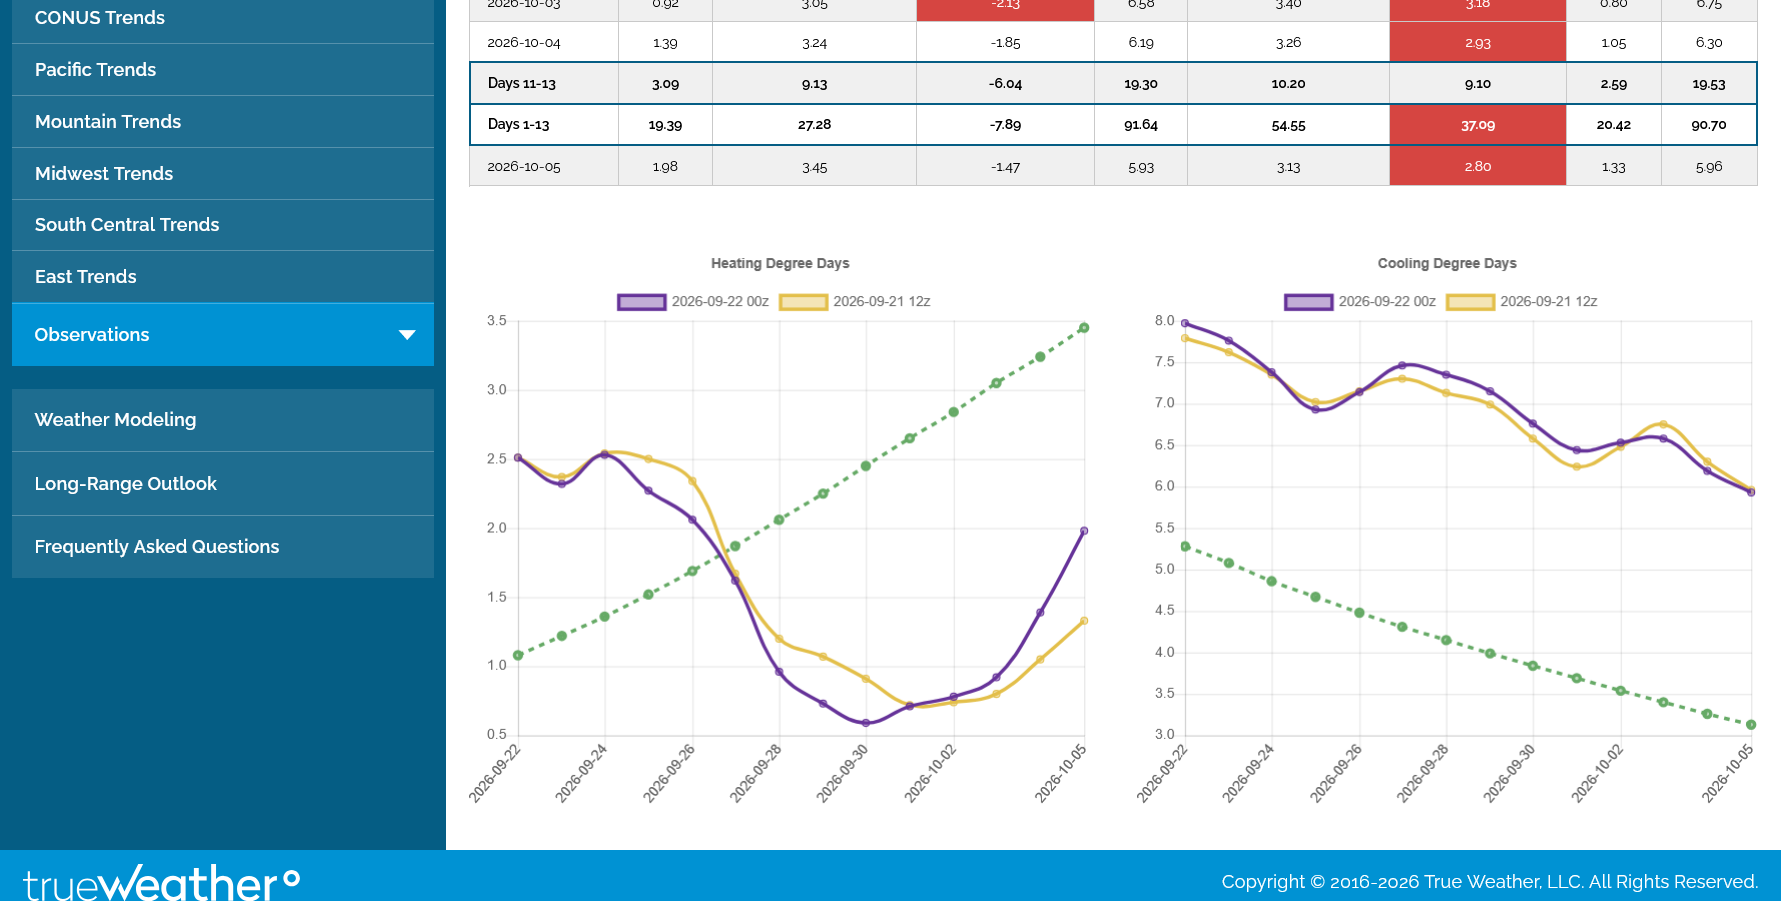
This was the last 0z European Ensemble model. The dashed green line, Seasonal HDDs on the left, pass up CDDs on the right on October 4th. The scales used makes this metric look misleading. The scale on the left is 0 to 3.5, while the scale on the right is 0 to 8.0!
Anyway, the greatly elevated CDDs on the right, after being bullish since early May, start TURNING BEARISH by mid October when they are part of a pattern that suppresses the rapidly increasing seasonal HDDs(which mean the most until next April)!
Story of the Day
Natural Gas Futures Rally to Doorstep of $3
US natural gas market fundamentals are loosening as cooler weather gains prominence, yet production shows signs of easing and a storage inventory surplus could further shrink. Those bullish signals and bargain buying bolstered front-month futures on Tuesday.
++++++++++++
I have no idea why natural gas shot up today!!! Maybe testing the uptrend line along with strong up seasonals and some lingering heat in the south(which has been in the forecast every day forever)
https://tradingeconomics.com/commodity/natural-gas
+53 Bcf!
A SMALL number for this time of year. Note below, the slowly increasing blue line on the graph below, the 2026 number CONVERGING with the steeper sloped increasing gray line, the 5 year average. The intense heat has been using up a lot of natural gas which is burned at power plants to generate electricity for residential air conditions. This has been seen with the greatly elevated CDDs(cooling degree days).
Additionally: Stocks were 146 Bcf less than last year at this time

for week ending September 18, 2026 | Released: September 24, 2026 at 10:30 a.m. | Next Release: October 1, 2026
| Working gas in underground storage, Lower 48 states Summary text CSV JSN | |||||||||||||||||||||||||
|---|---|---|---|---|---|---|---|---|---|---|---|---|---|---|---|---|---|---|---|---|---|---|---|---|---|
| Historical Comparisons | |||||||||||||||||||||||||
| Stocks billion cubic feet (Bcf) | Year ago (09/18/25) | 5-year average (2021-25) | |||||||||||||||||||||||
| Region | 09/18/26 | 09/11/26 | net change | implied flow | Bcf | % change | Bcf | % change | |||||||||||||||||
| East | 815 | 795 | 20 | 20 | 803 | 1.5 | 775 | 5.2 | |||||||||||||||||
| Midwest | 959 | 934 | 25 | 25 | 941 | 1.9 | 927 | 3.5 | |||||||||||||||||
| Mountain | 244 | 241 | 3 | 3 | 265 | -7.9 | 228 | 7.0 | |||||||||||||||||
| Pacific | 292 | 289 | 3 | 3 | 300 | -2.7 | 266 | 9.8 | |||||||||||||||||
| South Central | 1,041 | 1,039 | 2 | 2 | 1,188 | -12.4 | 1,059 | -1.7 | |||||||||||||||||
| Salt | 217 | 222 | -5 | -5 | 298 | -27.2 | 248 | -12.5 | |||||||||||||||||
| Nonsalt | 825 | 817 | 8 | 8 | 888 | -7.1 | 811 | 1.7 | |||||||||||||||||
| Total | 3,351 | 3,298 | 53 | 53 | 3,497 | -4.2 | 3,256 | 2.9 | |||||||||||||||||
| Totals may not equal sum of components because of independent rounding. | |||||||||||||||||||||||||
Working gas in storage was 3,351 Bcf as of Friday, September 18, 2026, according to EIA estimates. This represents a net increase of 53 Bcf from the previous week. Stocks were 146 Bcf less than last year at this time and 95 Bcf above the five-year average of 3,256 Bcf. At 3,351 Bcf, total working gas is within the five-year historical range.
For information on sampling error in this report, see Estimated Measures of Sampling Variability table below.
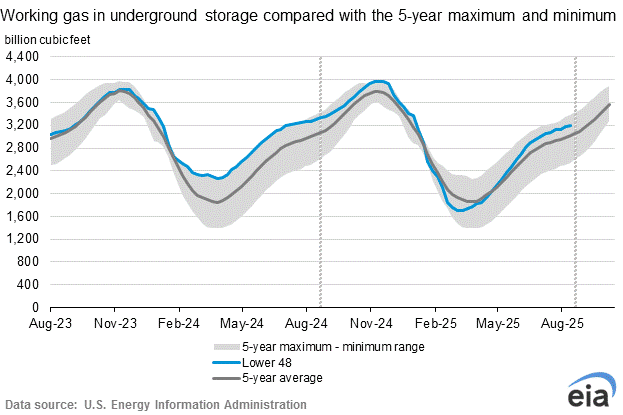
Note: The shaded area indicates the range between the historical minimum and maximum values for the weekly series from 2021 through 2025. The dashed vertical lines indicate current and year-ago weekly periods.
Another small-ish (vs the average HUGE numbers at this time of year) injection this Thursday with unseasonable heat in the South and some early HDDs in the Northeast. The market already dialed that in earlier this month.
Weather at this time of year is unlikely to drive price.
https://www.cpc.ncep.noaa.gov/products/tanal/temp_analyses.php

+++++++++++
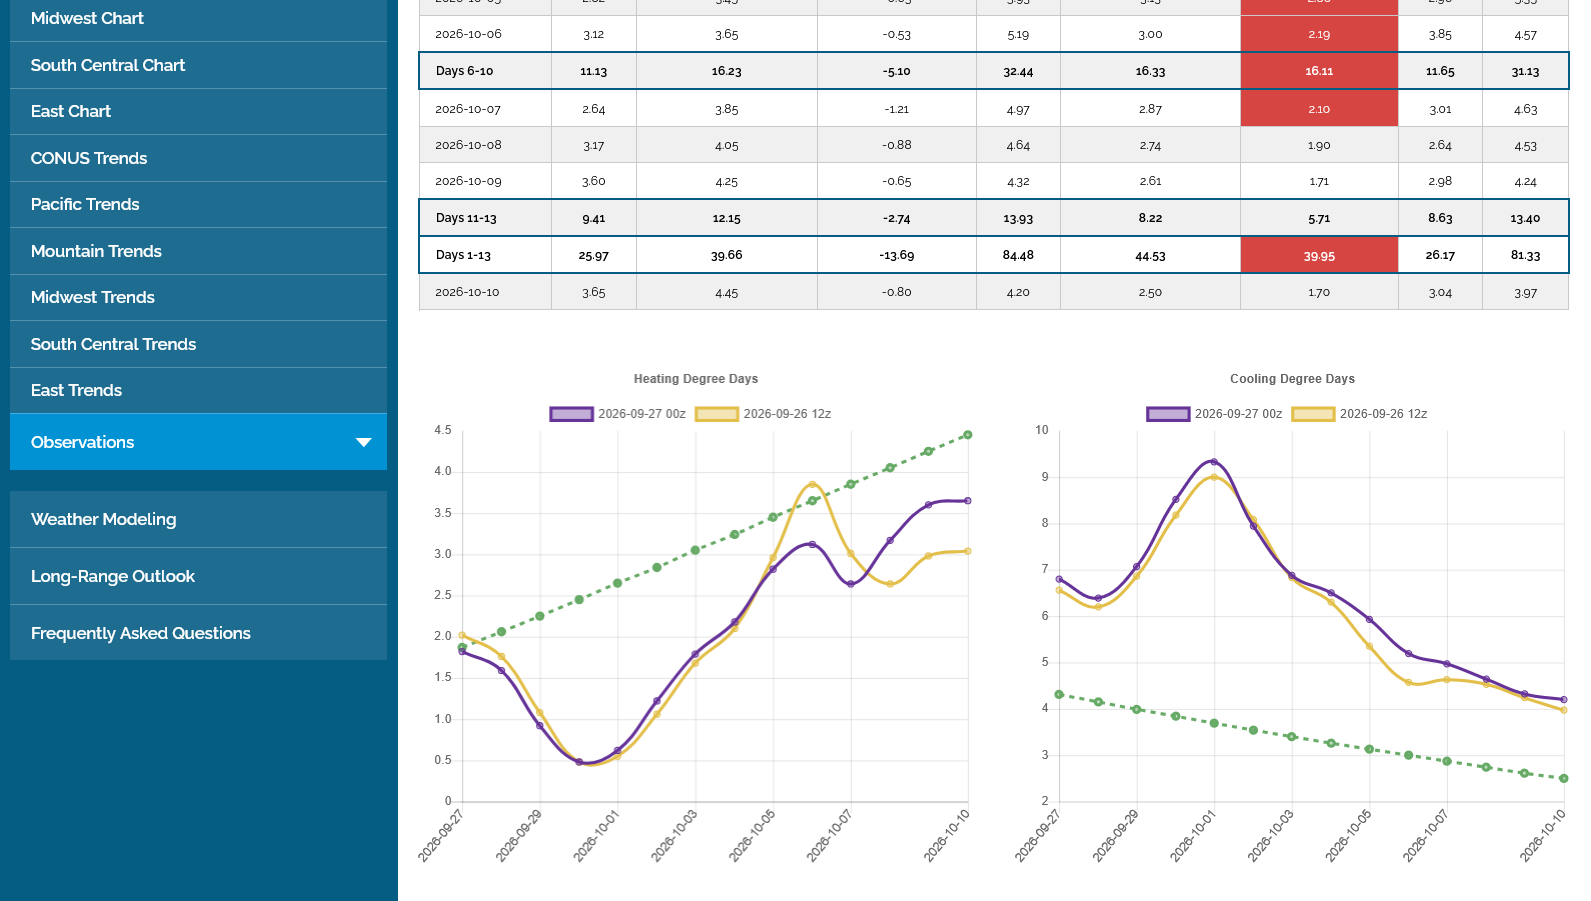
SEASONAL HDDs on the left pass up CDDs on the right during the first week of October. They are shown in green. However, they have a bad scale to display this data.
On the left, the HDD scale is 0 to 4.5. However on the right, the CDD is 0 to 10.
They should both be 0 to 10 in order to show an apples to apples comparison.
++++++
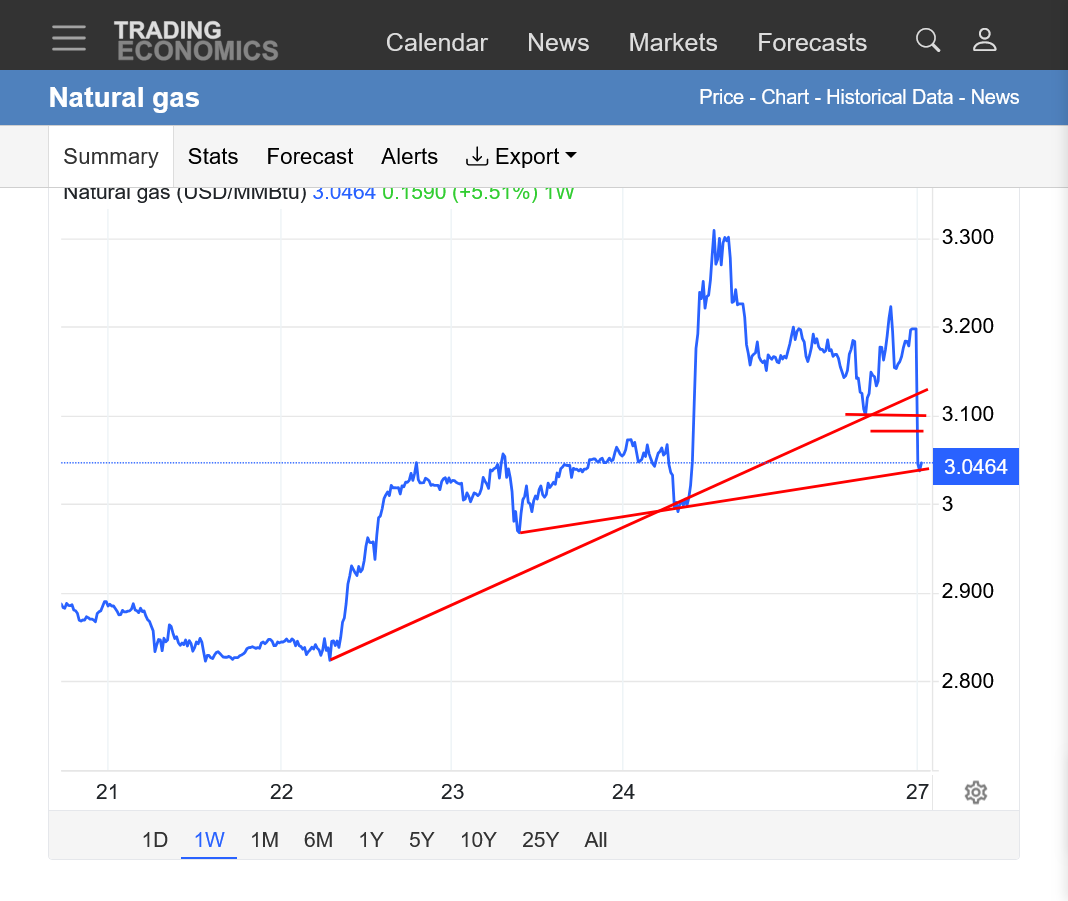
We gapped lower on the open, below Friday's low. The gap is shown below.
This potentially violated a very short term, unsustainable steep trendline up from last week's surprise spike.
Maybe that was just short covering ahead of the soon to expire October contract?(speculation) which goes off the board tomorrow.
NG took off like a rocket shortly after the EIA report on Thursday as seen by the $2,000+ spike higher on the graph below.
https://tradingeconomics.com/commodity/natural-gas
The November NG that takes over as the new front month also gapped lower on the open.
This was the news on Friday:
Natural gas futures gave up ground on Friday as traders took profits following a pronounced rally that sent prices to their highest levels since the peak of summer. Bullish storage shifts, sliding production and a major outage in Appalachia fueled the week’s upswing.
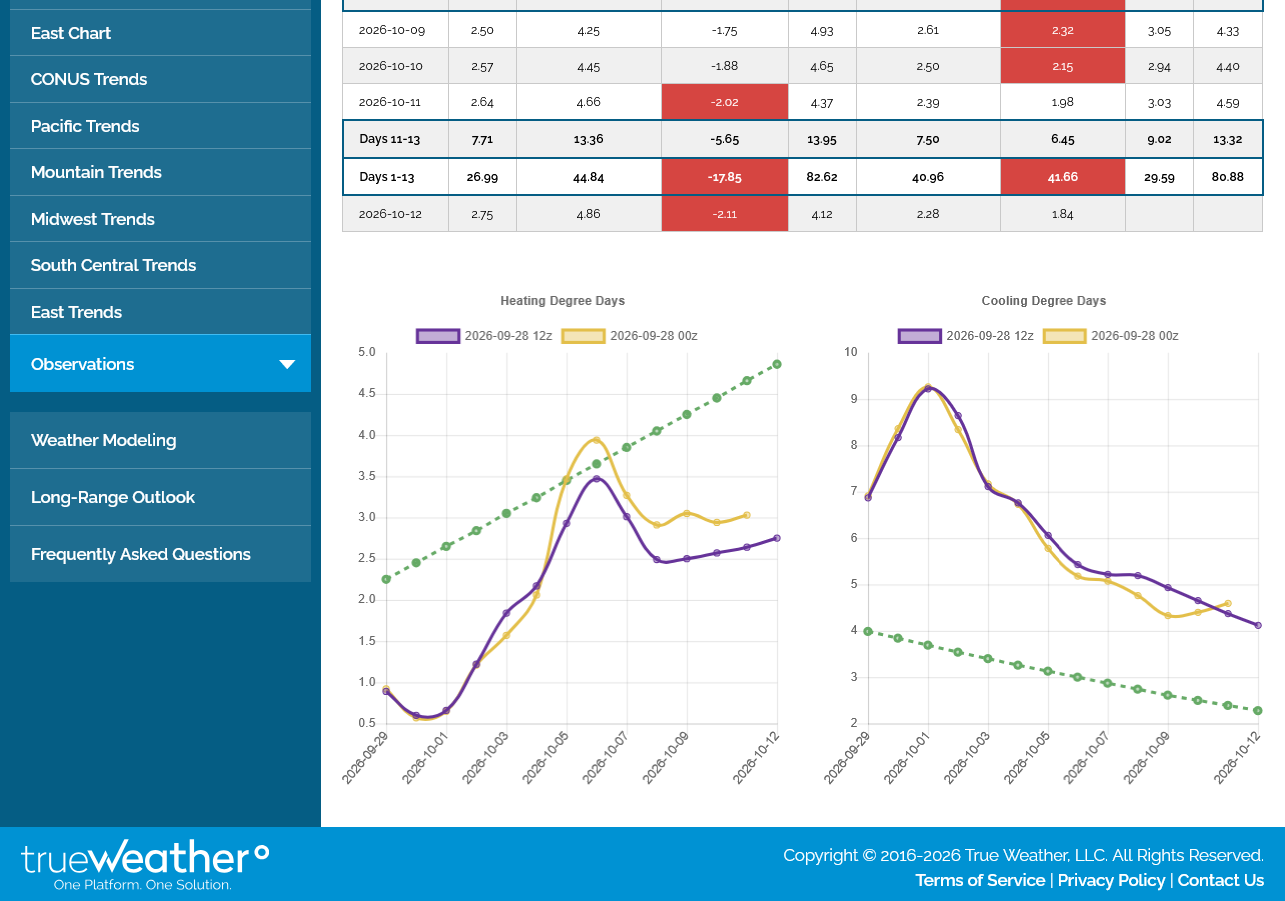
Warm weather is turning BEARISH now.
The left side is HDDs, the right side is CDDs. The green, seasonal average HDD line passes up CDDs on October 4th.
Both these graphs should go from 0-10 to properly reflect perspective with apples to apples degree day comparisons. However, the left/HDD graph only goes from 0-5, while the CDD/right graph goes from 0-10. This makes the HDD's look much greater than they really are!
Note that the green line on the left has already passed up the green line on the right before this period started even though that doesn't actually happen in reality for 6 more days.
Regardless, at the end of the period, CDDs on the right are +1.8 degree days ABOVE average, while HDDs on the left are -2.1 degree days BELOW average.
The steepness of the slope of the increase in HDDs on the left is doubled/exaggerated from the bad scaling as they go UP 2.6 HDDs for the period, while the CDDs on the right drop 1.7 CDDs during the same period.
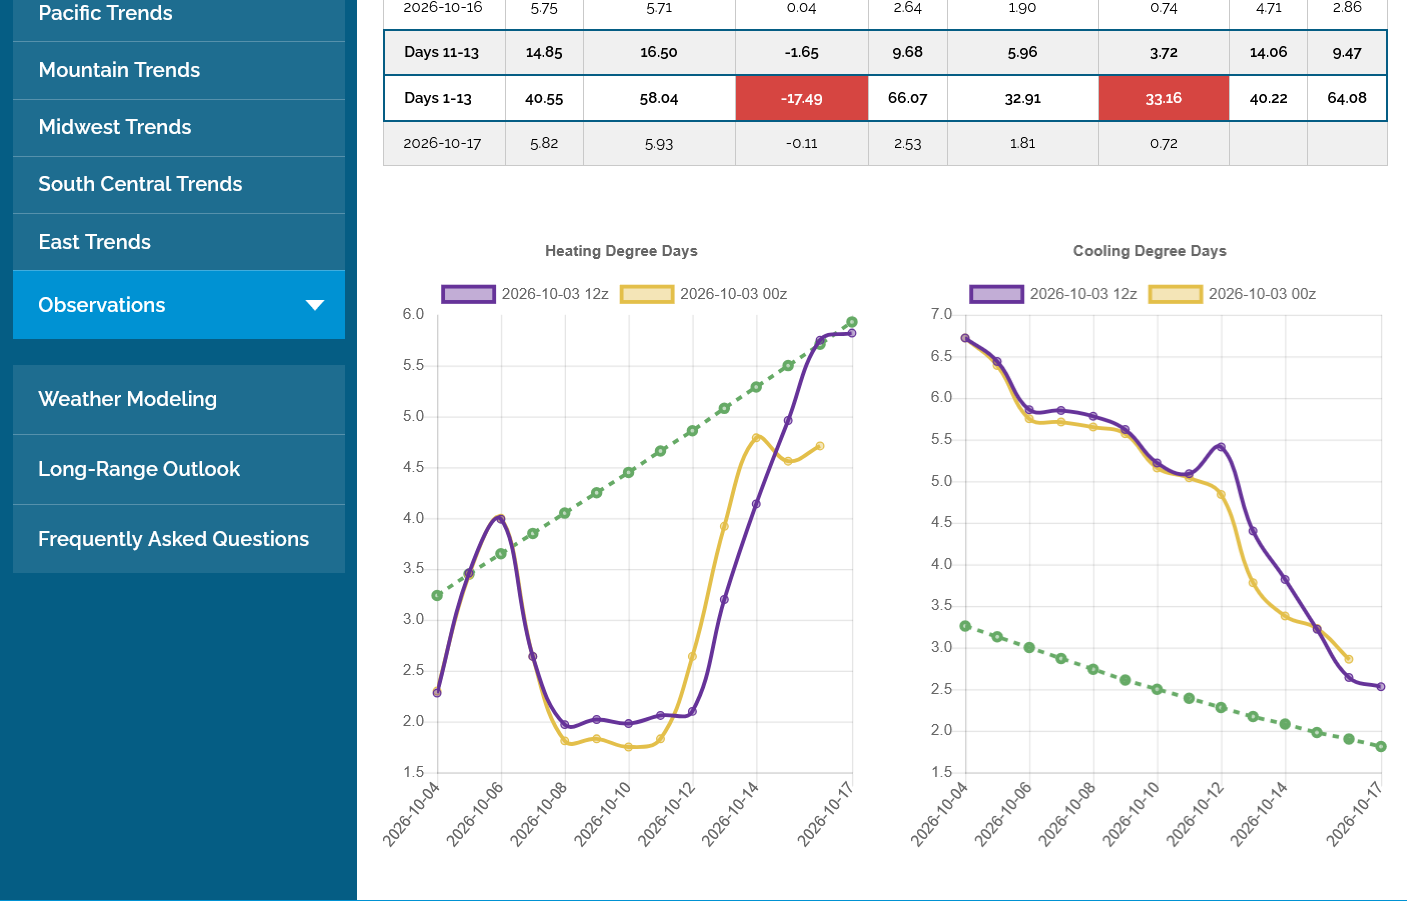
Seasonal CDDs (on the left), rapidly rising green line, pass up HDDS tomorrow!
The graphs are pretty close now for apples to apples, Degree Day comparisons with the lines on the 2 graphs on similar scales. By the end of week 2, CDDs are blowing away HDDs!
This could turn bullish for Natural Gas with the assistance of the strong up signal from the historical seasonal in the month of October. However, each year is different and we would likely need more cold than this to have any confidence.
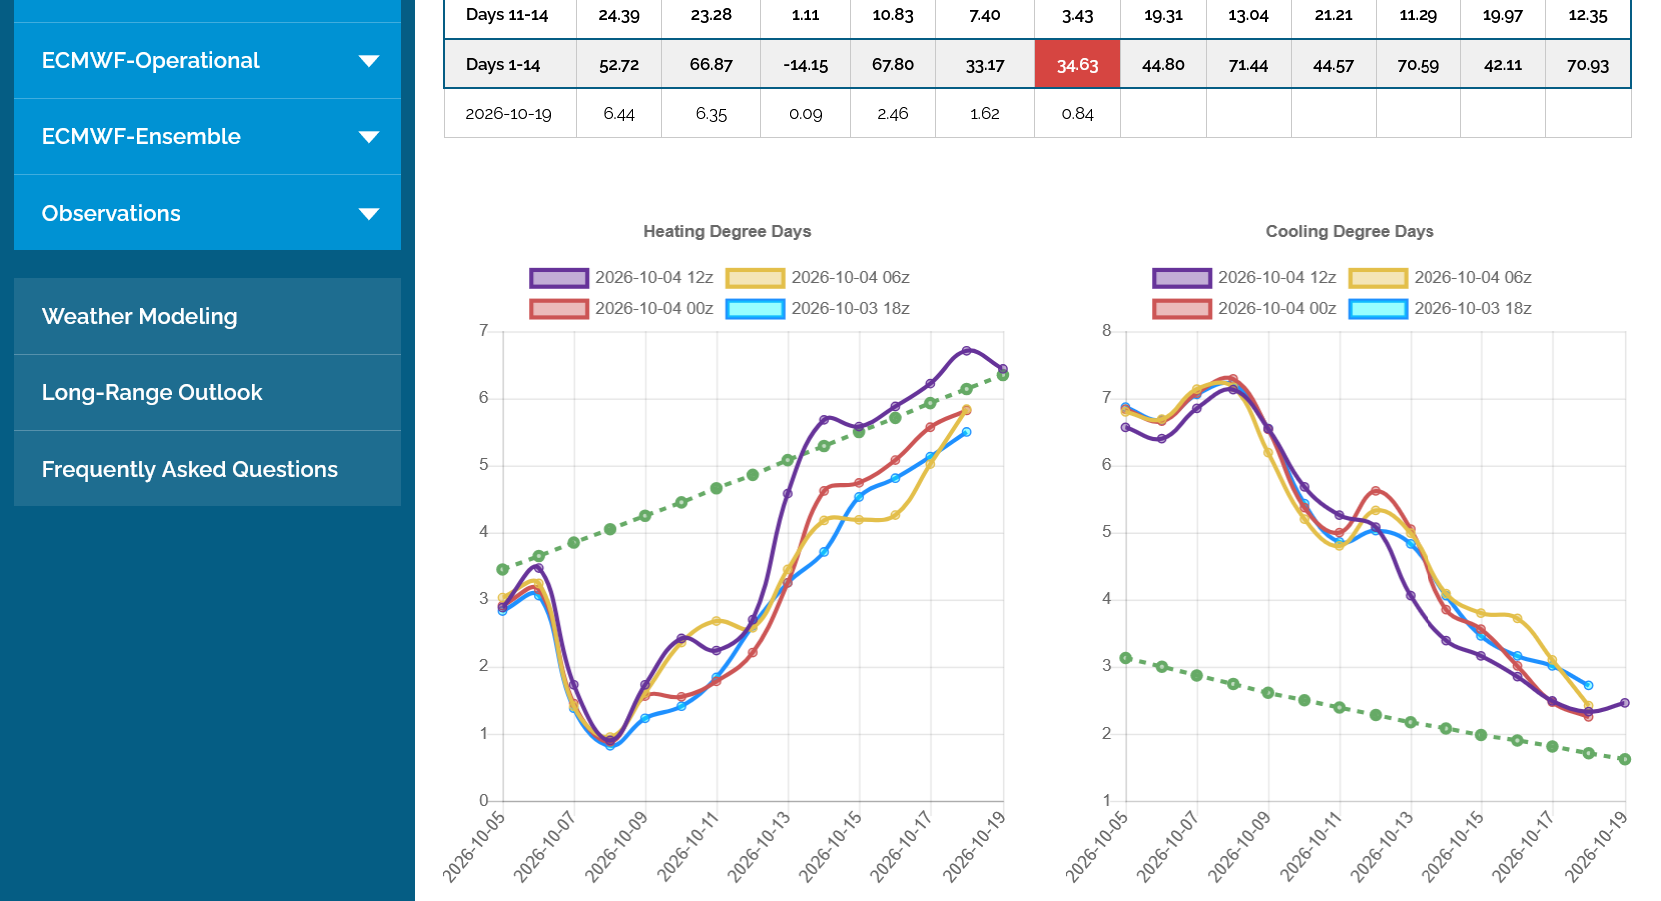
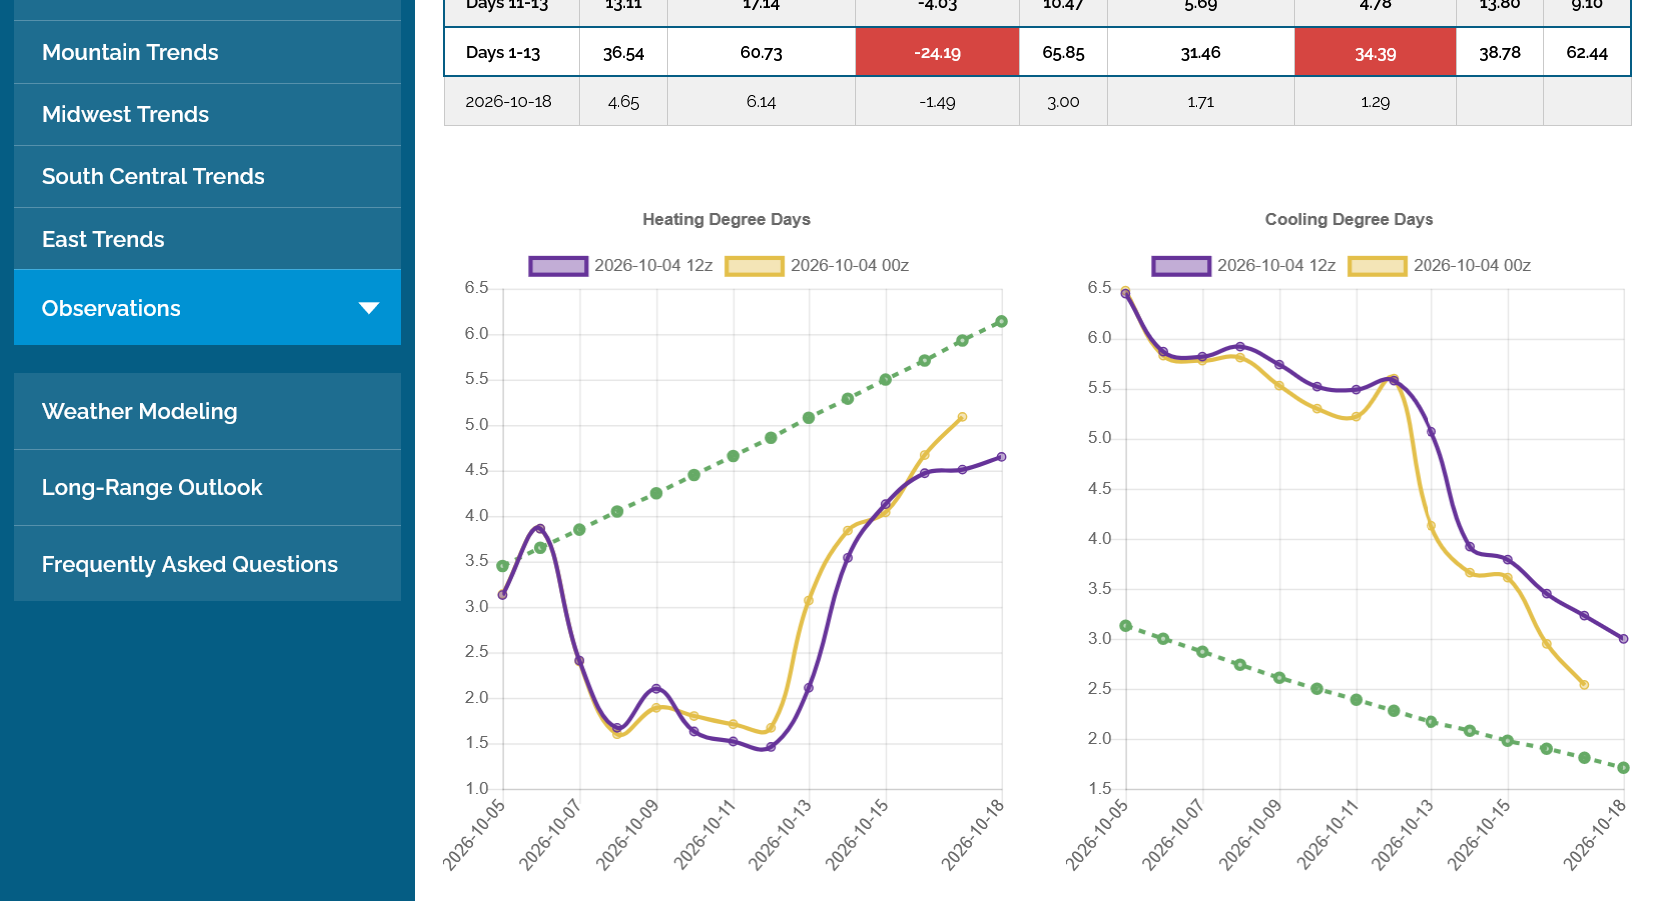
The last 12z GEFS (+8 HDDs from the previous run-purple/left) is pretty impressive with the cold moving in during week 2.
Will this be enough to be bullish the natural gas market this week? It's only October and HDDs are just above average but I've seen this cause prices to spike higher at this time of year before. Each year is different.
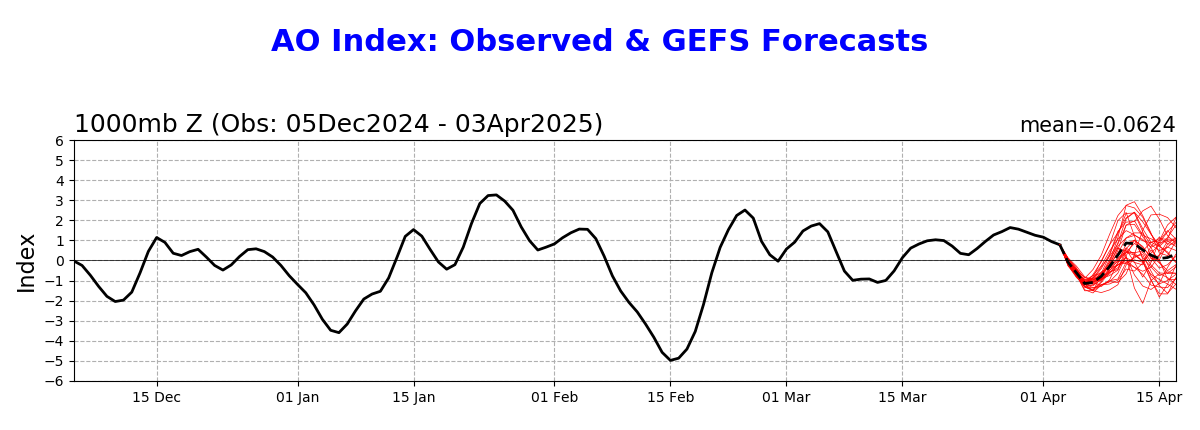
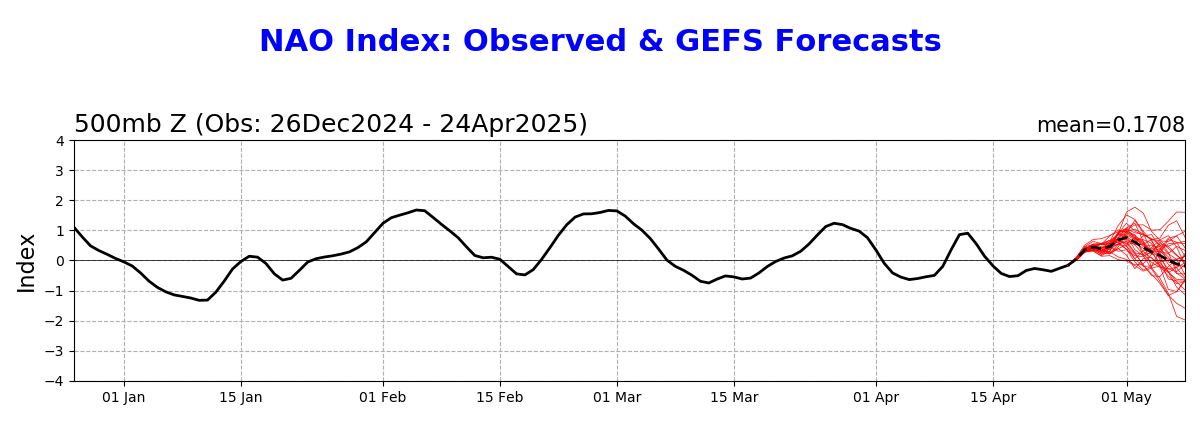
However, this looks short lived, especially with a +NAO and slightly +AO, though the market likes to over react to early season cold.
https://www.marketforum.com/forum/topic/83844/#83949
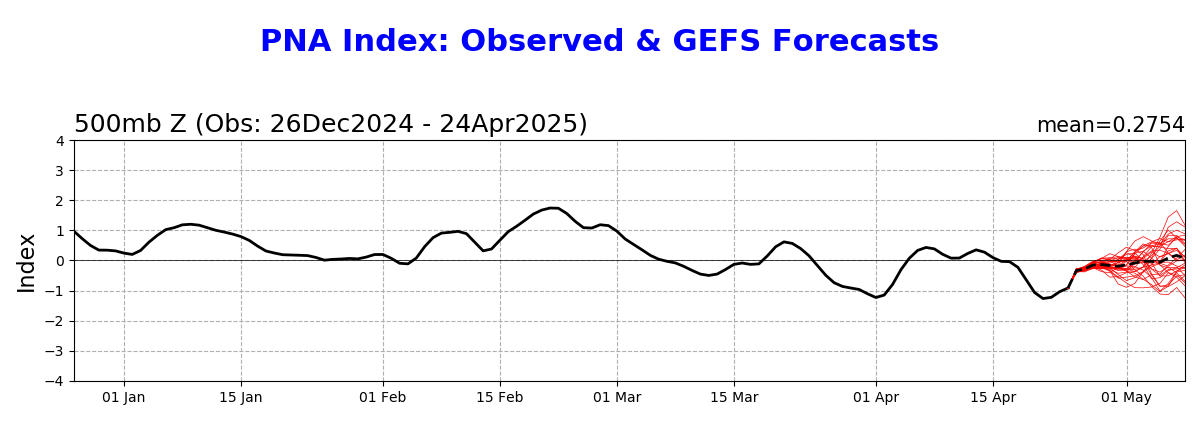
Arctic Oscillation Index, North Atlantic Oscillation Index, Pacific North American Index.
https://www.cpc.ncep.noaa.gov/products/precip/CWlink/daily_ao_index/ao.shtml
https://www.cpc.ncep.noaa.gov/products/precip/CWlink/pna/nao.shtml
https://www.cpc.ncep.noaa.gov/products/precip/CWlink/pna/pna.shtml
++++++++++
Temps for this next EIA report released at 9:30 am on Thursdays: Very warm in the center. Should still feature a decent sized injection, even if its a tad less than the average for that week because of late season AC use in places like TX which increases demand for burning natural gas to generate the electricity.
https://www.cpc.ncep.noaa.gov/products/tanal/temp_analyses.php

+++++++++++++++=
Rather than focusing on the + 64 Bcf build last week, which is on the low side for late September, note the blue line below. This years storage.
Note that intense heat the past 6 weeks has resulted in REDUCED injections and the blue line, though increasing is doing that with a less steep slope compared to the 5 year average. As a result, the blue line, that started with a health surplus has been CONVERGING with the 5 year average(which has had a steeper slope up from bigger injections at that time of year).
The impact of that heat IS OVER! The market went up just before and during that heat which is dialed into the price. Now we trade FUTURE CDDs compared to expectations!
Stocks are now 138 Bcf LESS THAN last year at this time. This will make the market slightly more sensitive to extreme cold waves early in the season!
for week ending September 25, 2026 | Released: October 1, 2026 at 10:30 a.m. | Next Release: October 8, 2026
| Working gas in underground storage, Lower 48 states Summary text CSV JSN | |||||||||||||||||||||||||
|---|---|---|---|---|---|---|---|---|---|---|---|---|---|---|---|---|---|---|---|---|---|---|---|---|---|
| Historical Comparisons | |||||||||||||||||||||||||
| Stocks billion cubic feet (Bcf) | Year ago (09/25/25) | 5-year average (2021-25) | |||||||||||||||||||||||
| Region | 09/25/26 | 09/18/26 | net change | implied flow | Bcf | % change | Bcf | % change | |||||||||||||||||
| East | 840 | 815 | 25 | 25 | 828 | 1.4 | 803 | 4.6 | |||||||||||||||||
| Midwest | 984 | 959 | 25 | 25 | 968 | 1.7 | 956 | 2.9 | |||||||||||||||||
| Mountain | 248 | 244 | 4 | 4 | 269 | -7.8 | 233 | 6.4 | |||||||||||||||||
| Pacific | 295 | 292 | 3 | 3 | 302 | -2.3 | 271 | 8.9 | |||||||||||||||||
| South Central | 1,048 | 1,041 | 7 | 7 | 1,187 | -11.7 | 1,074 | -2.4 | |||||||||||||||||
| Salt | 213 | 217 | -4 | -4 | 293 | -27.3 | 252 | -15.5 | |||||||||||||||||
| Nonsalt | 834 | 825 | 9 | 9 | 893 | -6.6 | 822 | 1.5 | |||||||||||||||||
| Total | 3,415 | 3,351 | 64 | 64 | 3,553 | -3.9 | 3,336 | 2.4 | |||||||||||||||||
| Totals may not equal sum of components because of independent rounding. | |||||||||||||||||||||||||
Working gas in storage was 3,415 Bcf as of Friday, September 25, 2026, according to EIA estimates. This represents a net increase of 64 Bcf from the previous week. Stocks were 138 Bcf less than last year at this time and 79 Bcf above the five-year average of 3,336 Bcf. At 3,415 Bcf, total working gas is within the five-year historical range.
For information on sampling error in this report, see Estimated Measures of Sampling Variability table below.
Note: The shaded area indicates the range between the historical minimum and maximum values for the weekly series from 2021 through 2025. The dashed vertical lines indicate current and year-ago weekly periods.
+++++++++++++
The 12z European Ensemble model(that usually impacts natural gas the most) was not nearly as chilly! It also was -2+ HDDs(bearish) vs the previous run.
+++++++++++++++
https://tradingeconomics.com/commodity/natural-gas
Weather dominates, often with spikes up and down
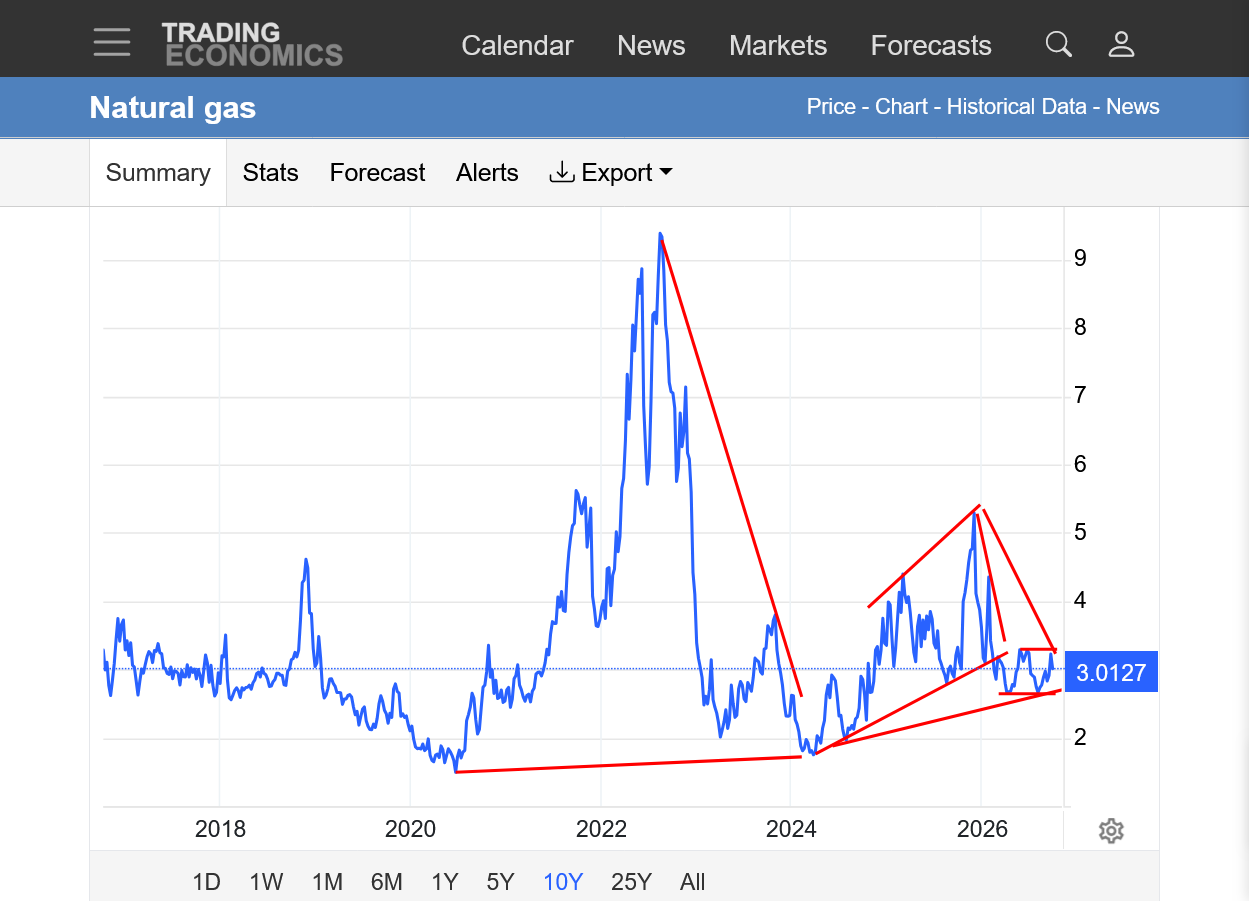
1. 10 years: One can justify any of these lines. Symmetrical triangle? Sideways rectangle recently?
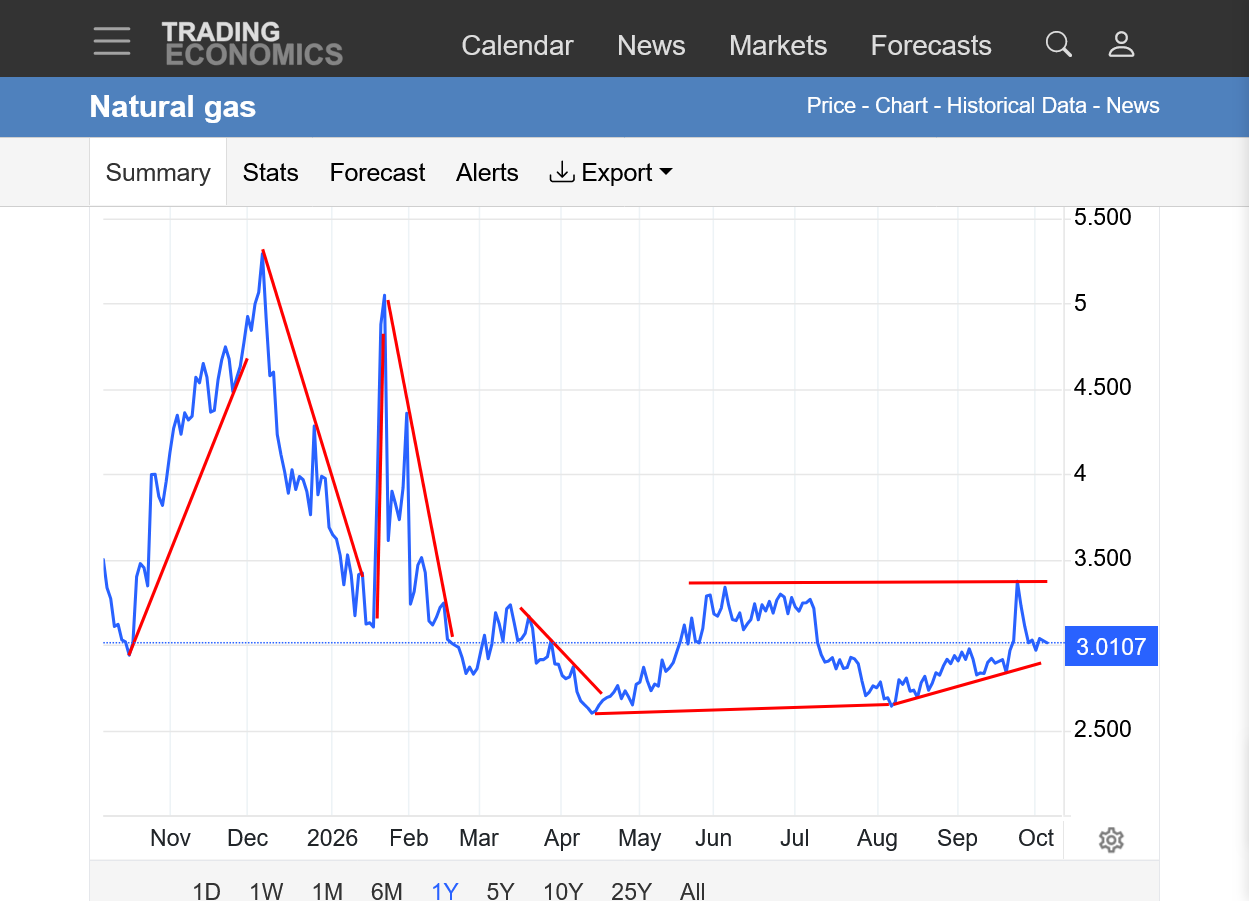
2. 1 year: Weather spikes up and down last Winter! Mild end of Winter and delayed Spring bottom. Ascending wedge?
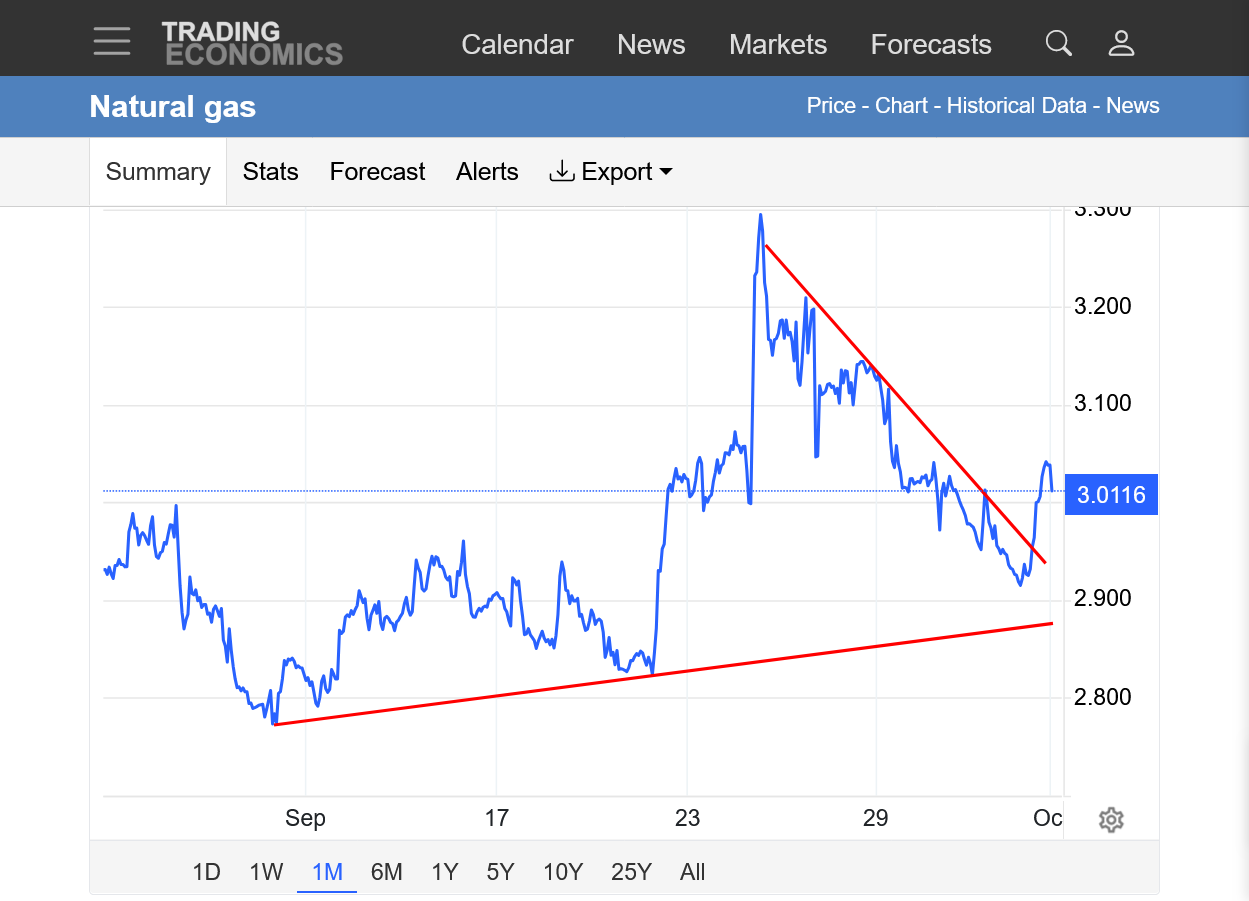
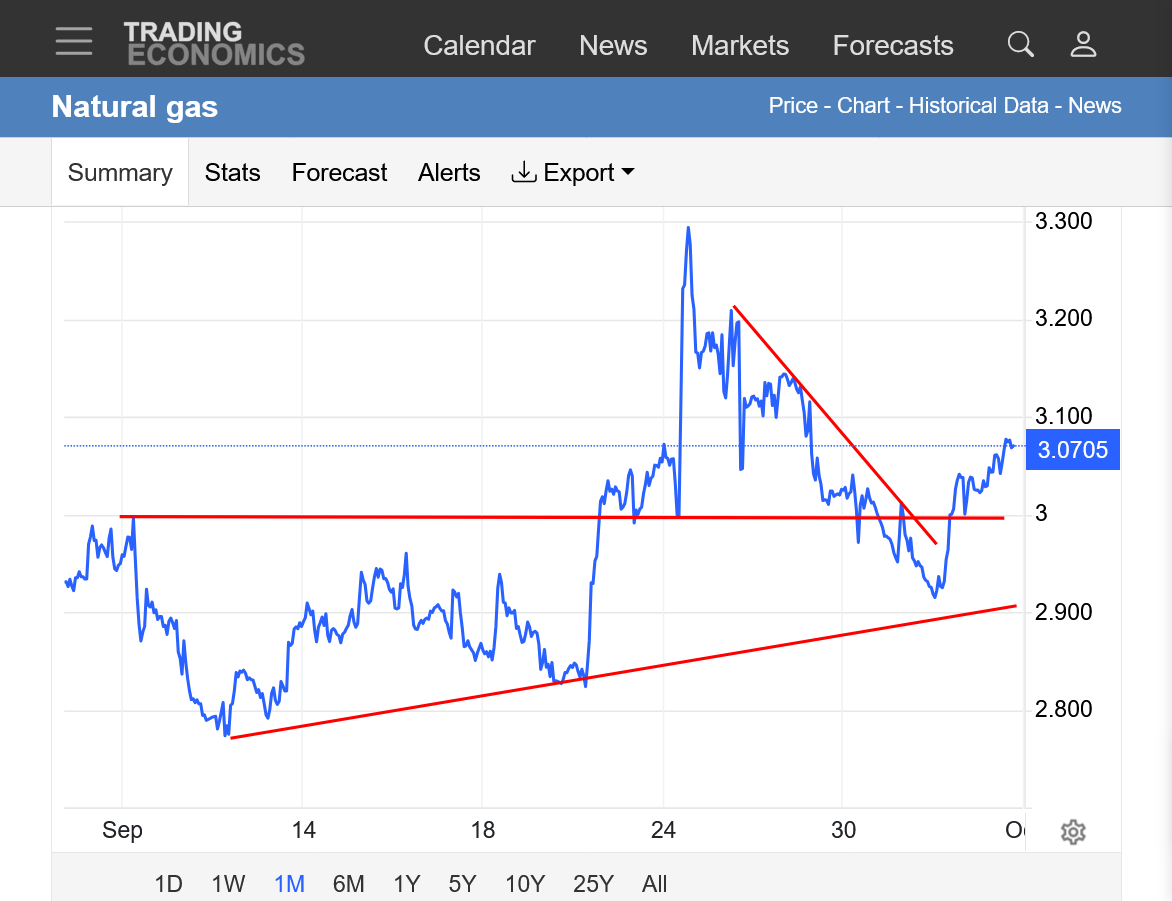
3. 1 month: Symmetrical triangle/wedge with steep downslope and potential upside break out on Friday.
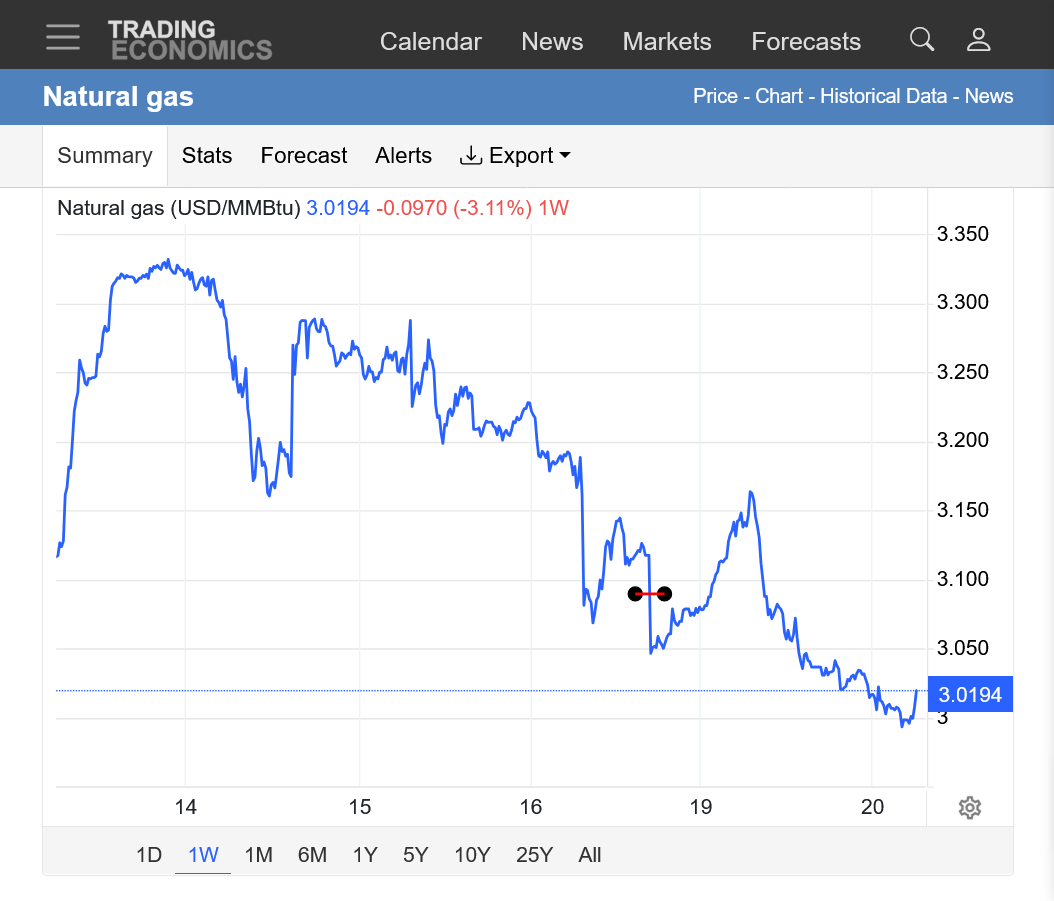
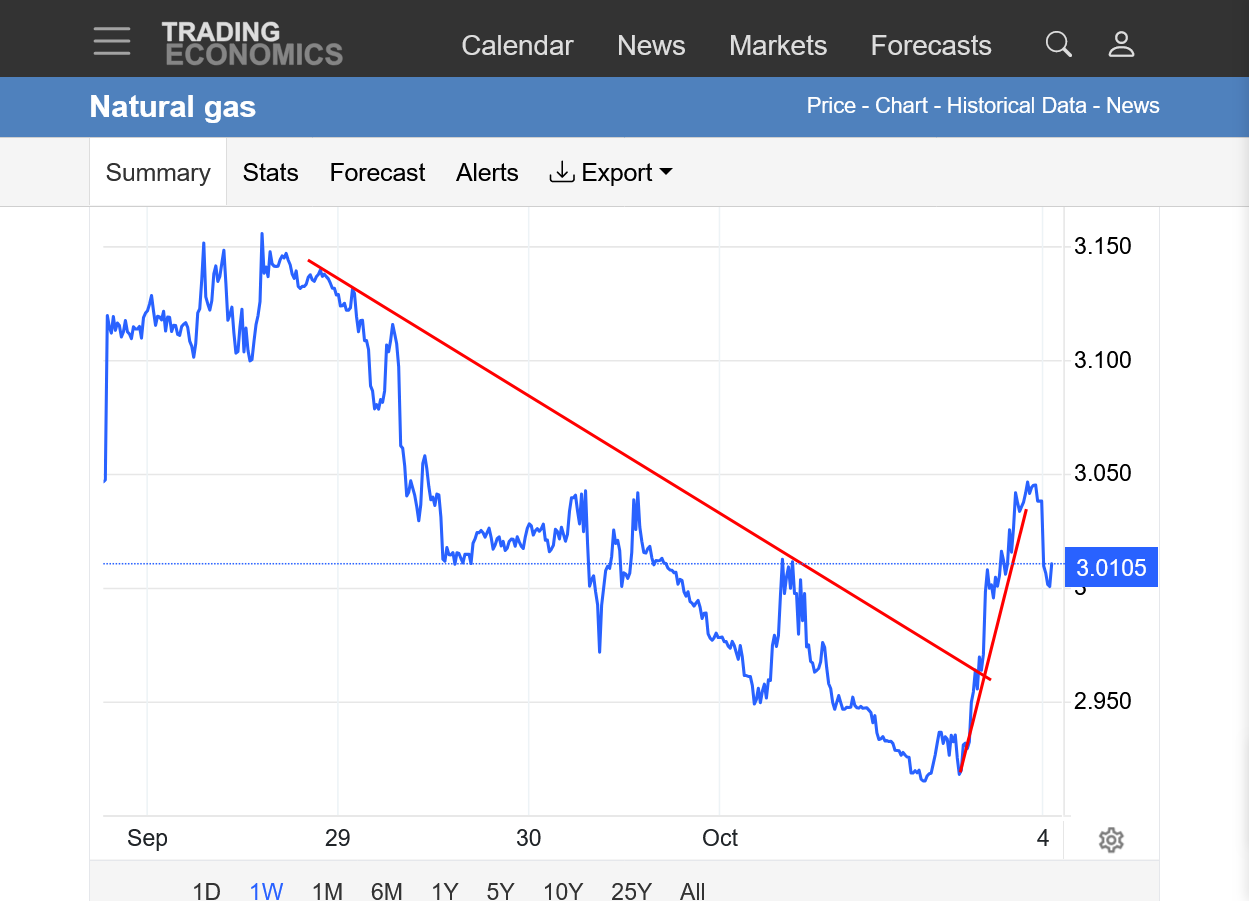
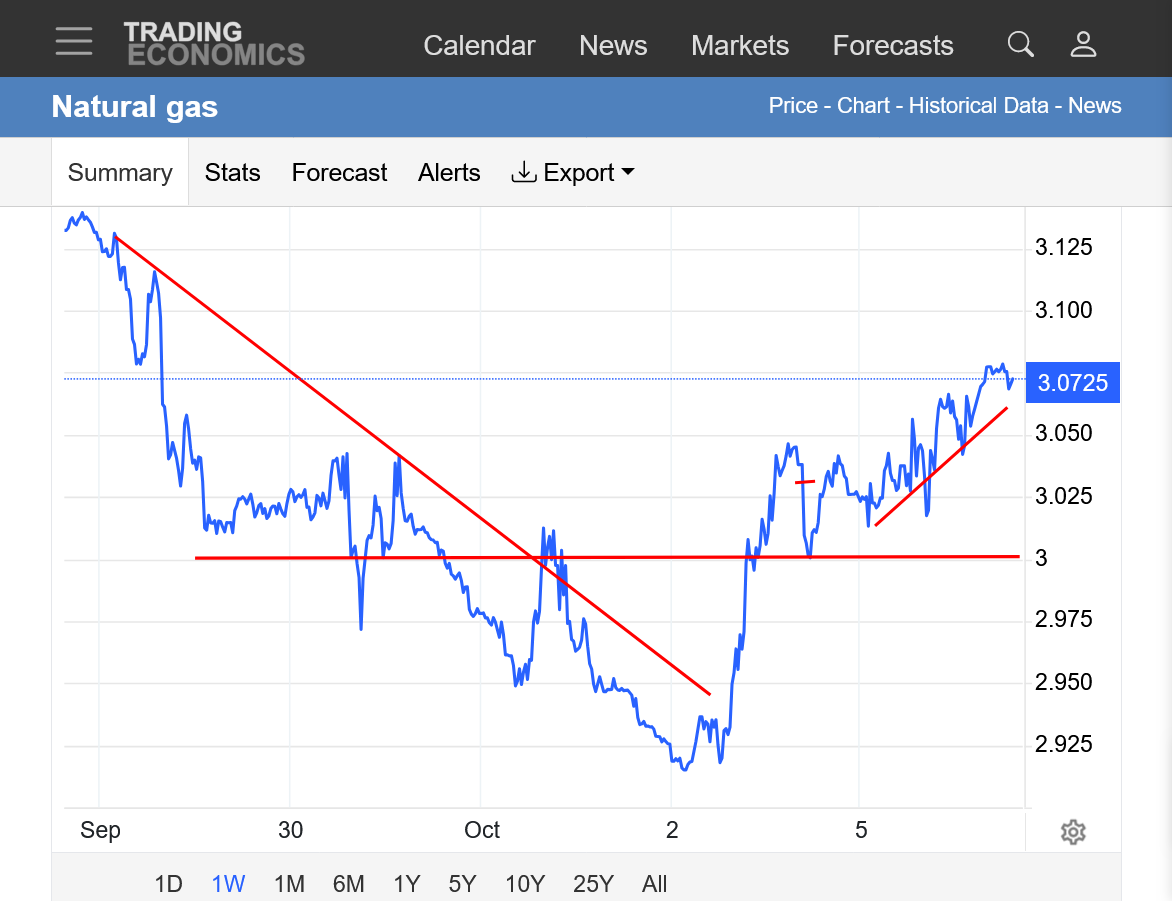
4. 1 week: Steep downslope with sudden spike up +$1,300 from the lows on Friday just after 6am Lower so far on Sunday Night but $3 held.
++++++++++++++=
1 month: Bulls have the advantage after the higher close today, confirming the upside break out on Friday.
1 week: Upside break out above $3!
https://tradingeconomics.com/commodity/natural-gas
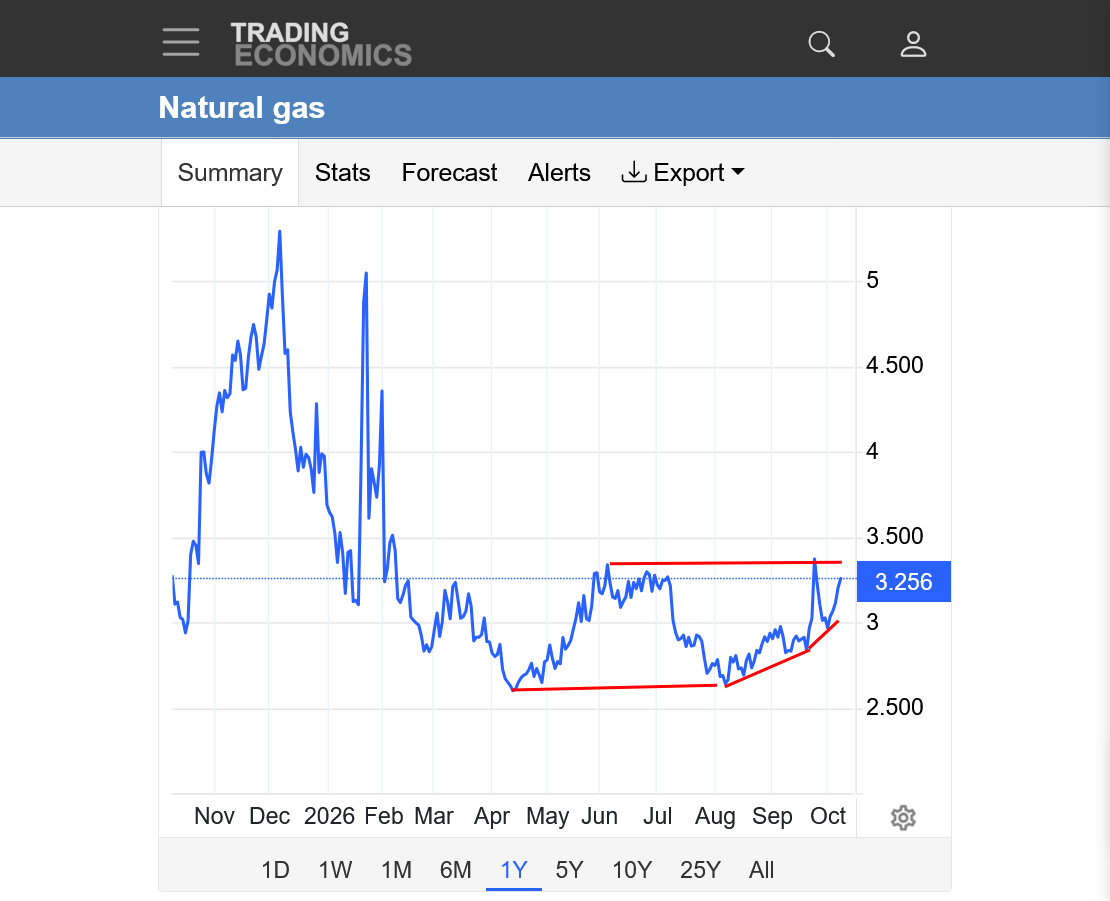
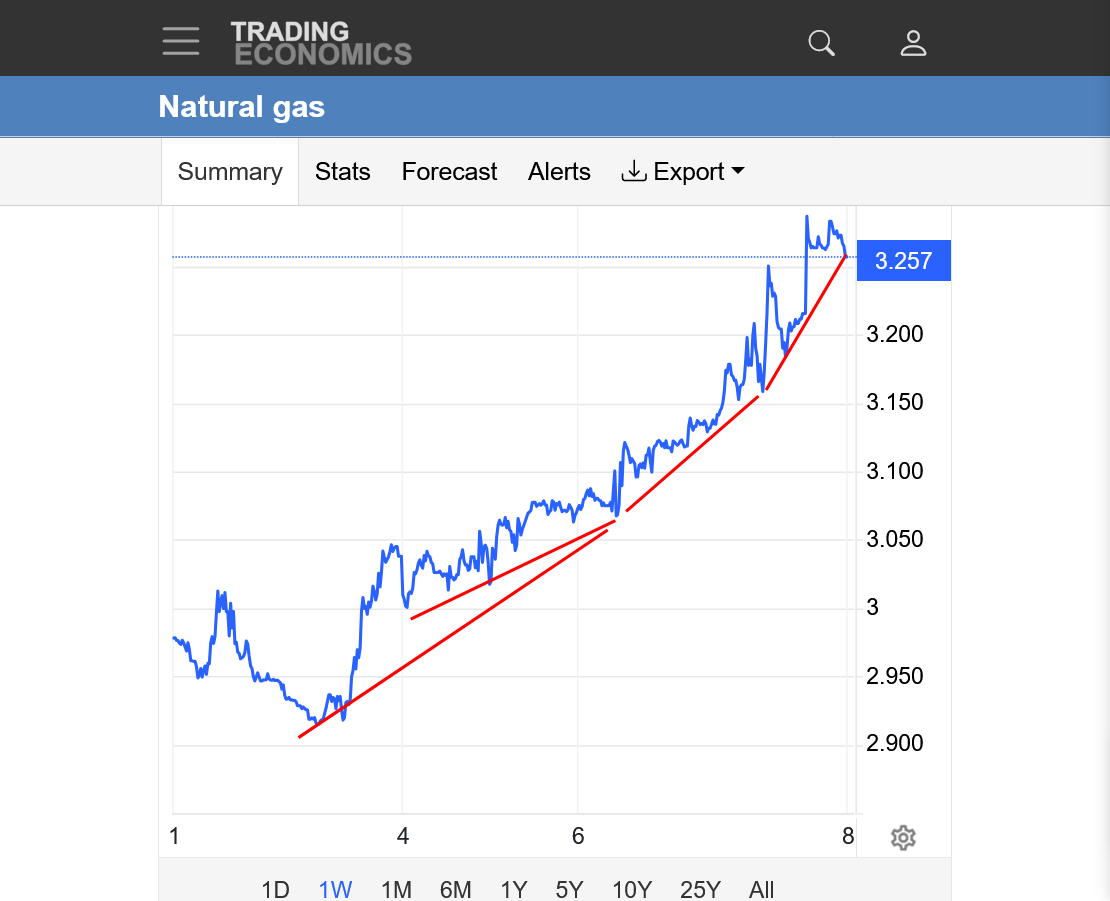
Bulls have the big edge. Huge rally as we approach major resistance that looks vulnerable!
1. 1 year Steepening uptrend recently. Likely ready to break out to the upside! Less likely to be a double top.
2. 1 week +$3,500/contract since the lows last week!
A tad bearish?? The blue line below on the graph is almost down to the 5 year average. Stocks are 130 Bcf less than last years. Seasonals are positive in October.
The hurricane has been bullish this week.
for week ending October 2, 2026 | Released: October 8, 2026 at 10:30 a.m. | Next Release: October 15, 2026
| Working gas in underground storage, Lower 48 states Summary text CSV JSN | |||||||||||||||||||||||||
|---|---|---|---|---|---|---|---|---|---|---|---|---|---|---|---|---|---|---|---|---|---|---|---|---|---|
| Historical Comparisons | |||||||||||||||||||||||||
| Stocks billion cubic feet (Bcf) | Year ago (10/02/25) | 5-year average (2021-25) | |||||||||||||||||||||||
| Region | 10/02/26 | 09/25/26 | net change | implied flow | Bcf | % change | Bcf | % change | |||||||||||||||||
| East | 862 | 840 | 22 | 22 | 856 | 0.7 | 831 | 3.7 | |||||||||||||||||
| Midwest | 1,010 | 984 | 26 | 26 | 997 | 1.3 | 987 | 2.3 | |||||||||||||||||
| Mountain | 253 | 248 | 5 | 5 | 274 | -7.7 | 239 | 5.9 | |||||||||||||||||
| Pacific | 299 | 295 | 4 | 4 | 304 | -1.6 | 274 | 9.1 | |||||||||||||||||
| South Central | 1,076 | 1,048 | 28 | 28 | 1,199 | -10.3 | 1,101 | -2.3 | |||||||||||||||||
| Salt | 227 | 213 | 14 | 14 | 295 | -23.1 | 264 | -14.0 | |||||||||||||||||
| Nonsalt | 849 | 834 | 15 | 15 | 904 | -6.1 | 837 | 1.4 | |||||||||||||||||
| Total | 3,500 | 3,415 | 85 | 85 | 3,630 | -3.6 | 3,432 | 2.0 | |||||||||||||||||
Totals may not equal sum of components because of independent rounding.SummaryWorking gas in storage was 3,500 Bcf as of Friday, October 2, 2026, according to EIA estimates. This represents a net increase of 85 Bcf from the previous week. Stocks were 130 Bcf less than last year at this time and 68 Bcf above the five-year average of 3,432 Bcf. At 3,500 Bcf, total working gas is within the five-year historical range.For information on sampling error in this report, see Estimated Measures of Sampling Variability table below. | |||||||||||||||||||||||||
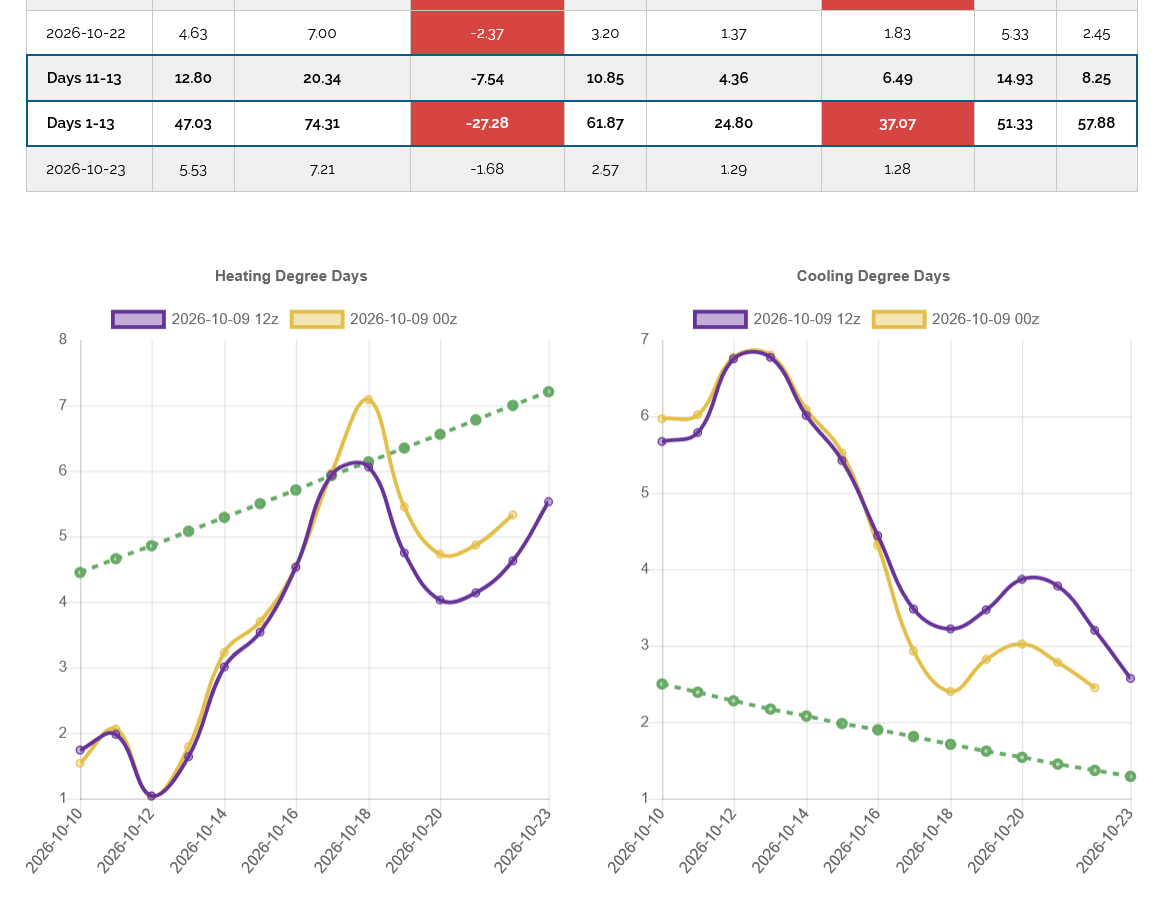
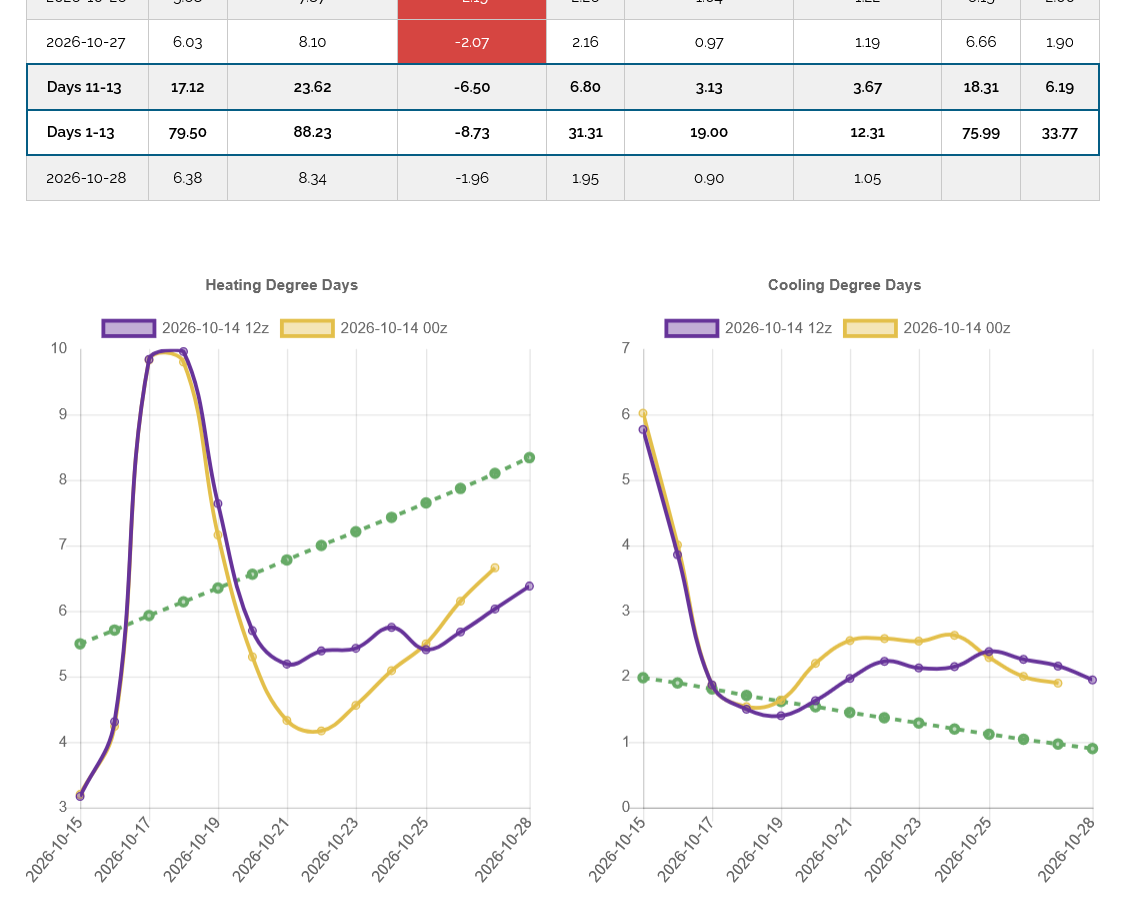
Climatologically averaged HDDs(left) passed up CDDs(right) earlier this week, shown by the dashed green lines on the 2 graphs below.
The last 12z European Ensemble model had -4 HDDs, shown by the purple line on the left. This was mainly from a milder week 2 forecast with the last 5 data points from the previous 0Z run from 12 hours earlier, being HIGHER than those same time frames on the last run shown with purple dots BELOW that.
Natural gas prices were under a bit of pressure after this when this data came out and after that this afternoon.
https://tradingeconomics.com/commodity/natural-gas
1. 1 day: Milder week 2 came out.
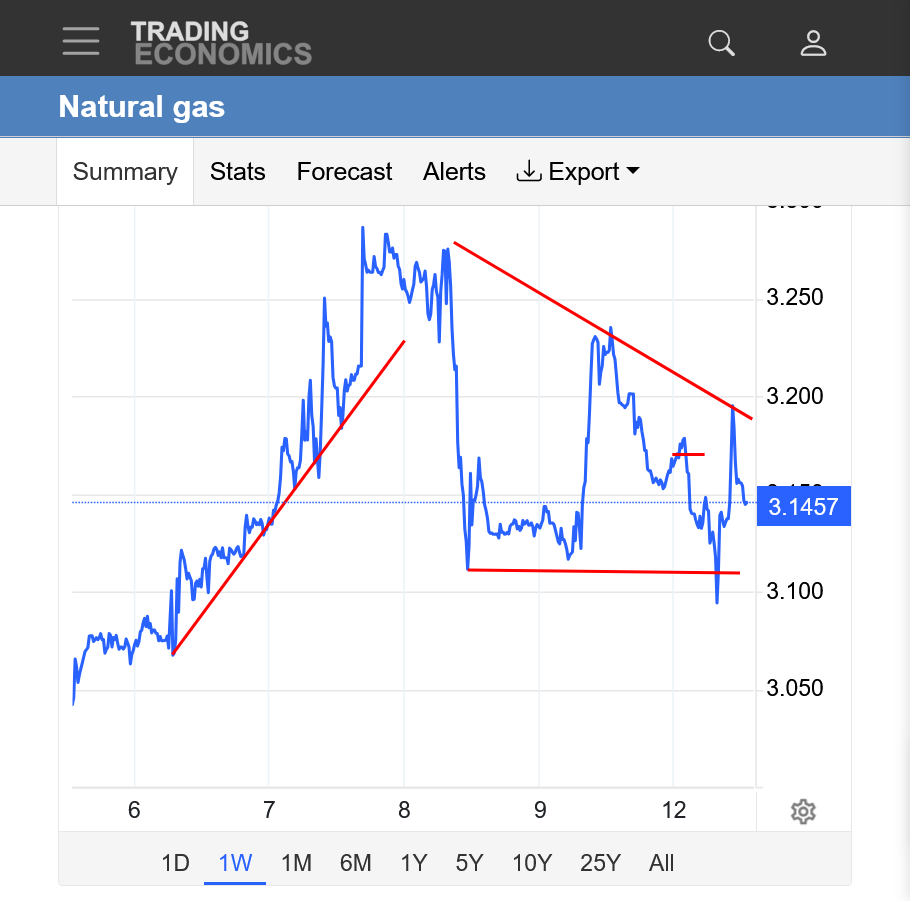
2. 1 week: Hurricane premium?? Bearish EIA number on Thursday. Milder 12z model temps.
3. 1 month: September heat? Correction to a HIGHER low. Hurricane premium??
4. 1 year: Weather spikes last Winter. Mild end of heating season and delayed seasonal low in April. Summer heat with higher lows. Potential double top but UP seasonals are pretty strong right now.
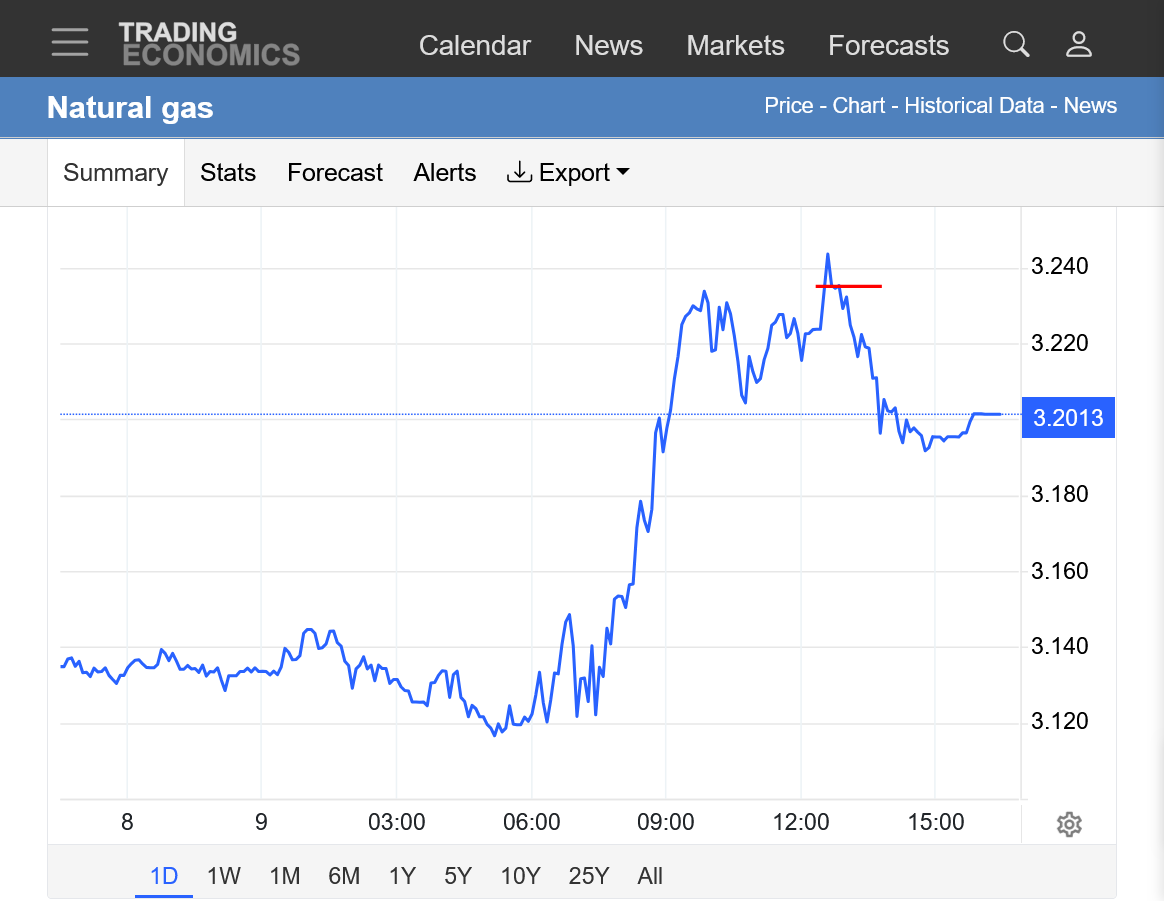
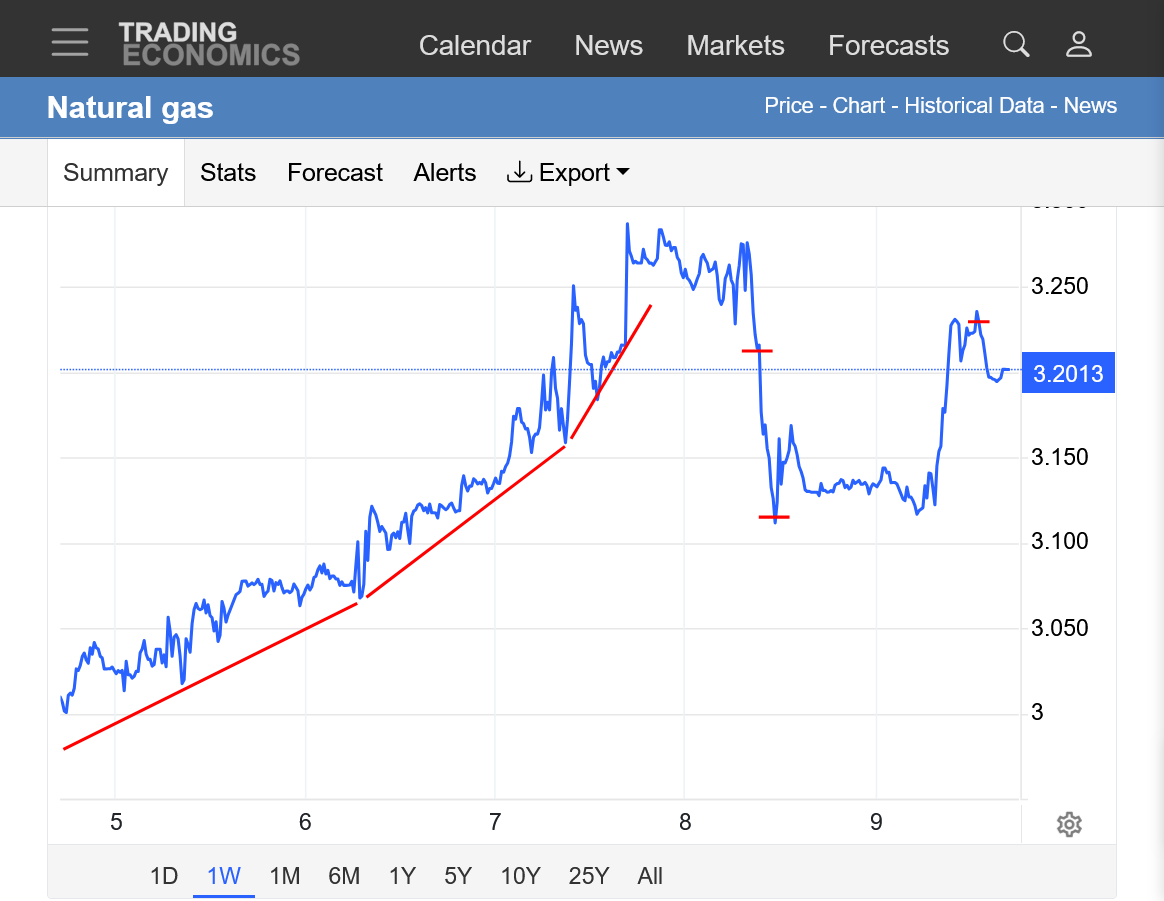
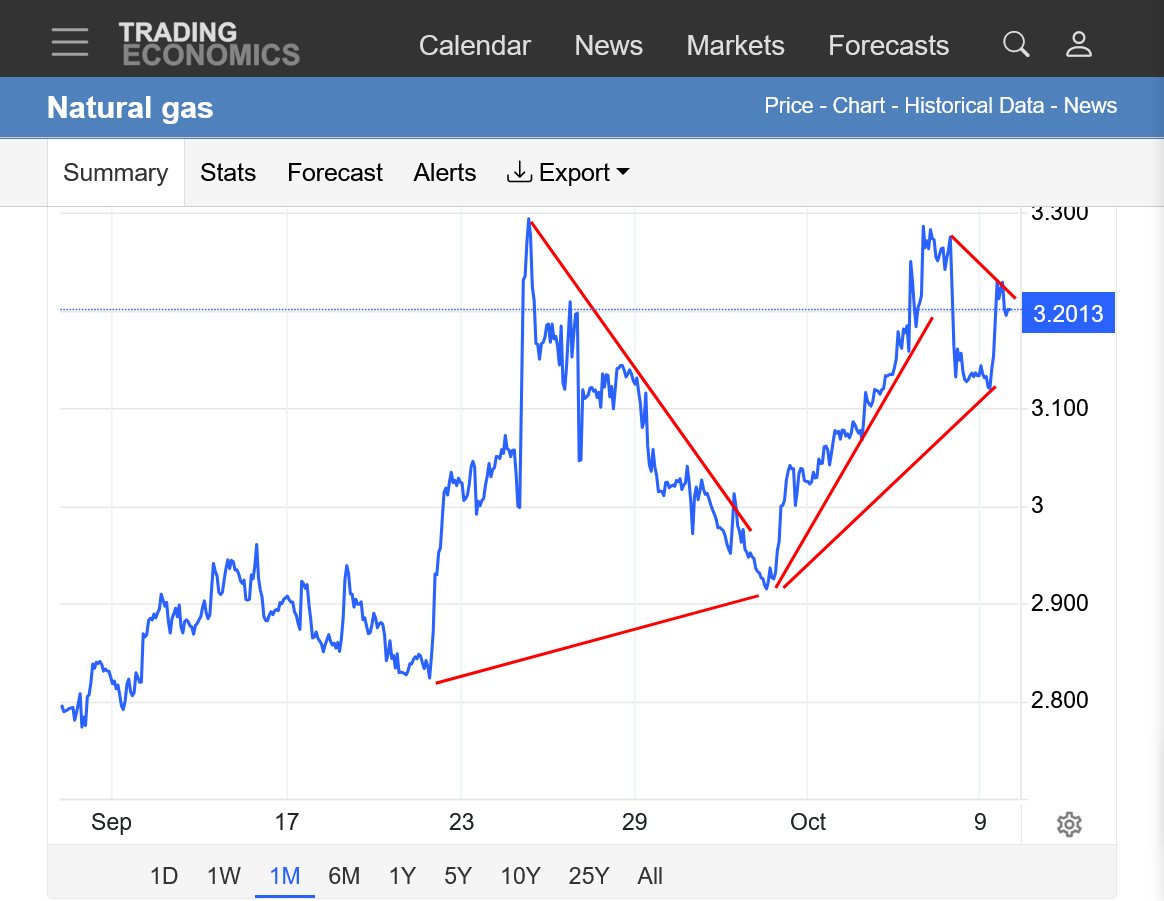
Temperatures from last week for this Thursday's EIA number. Very warm-West, cool Northeast. Keep in mind that this period is a time frame when HDDs and CDDs for the entire country are usually very close AND LOW. Even the most extreme temps are unable to use up the amount of natural gas that would be used from an average day in January for residential heating.
https://www.cpc.ncep.noaa.gov/products/tanal/temp_analyses.php

https://tradingeconomics.com/commodity/natural-gas
1. 1 year: Double top? Ascending triangle? Steepening upslope trend with the same highs.
2. 1 month
3. 1 week: Hurricane premium last week, almost straight up? Giving half of it back since then with very wide swings up and down?
4. 1 day: Open last night. Big spike down just after 7am. Big spike up just after 10am(to barely take out the highs, then reverse lower again to around mid-range at 1pm).
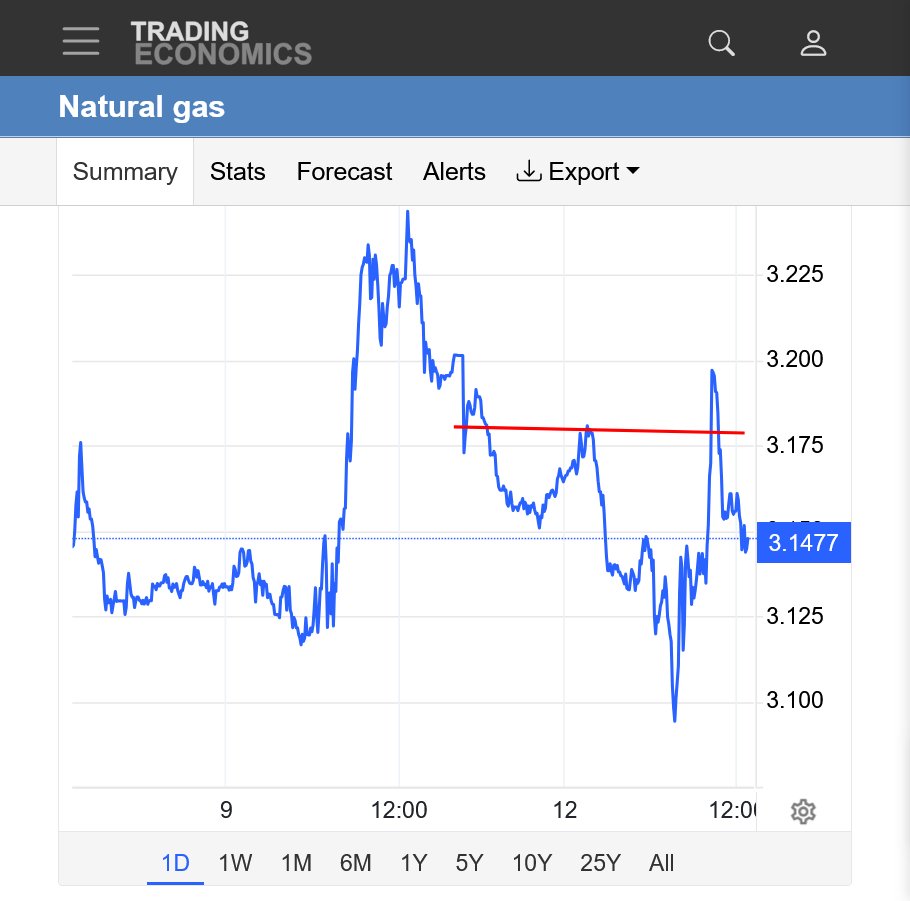
Extremely impressive day for natural gas!!!!
https://tradingeconomics.com/commodity/natural-gas
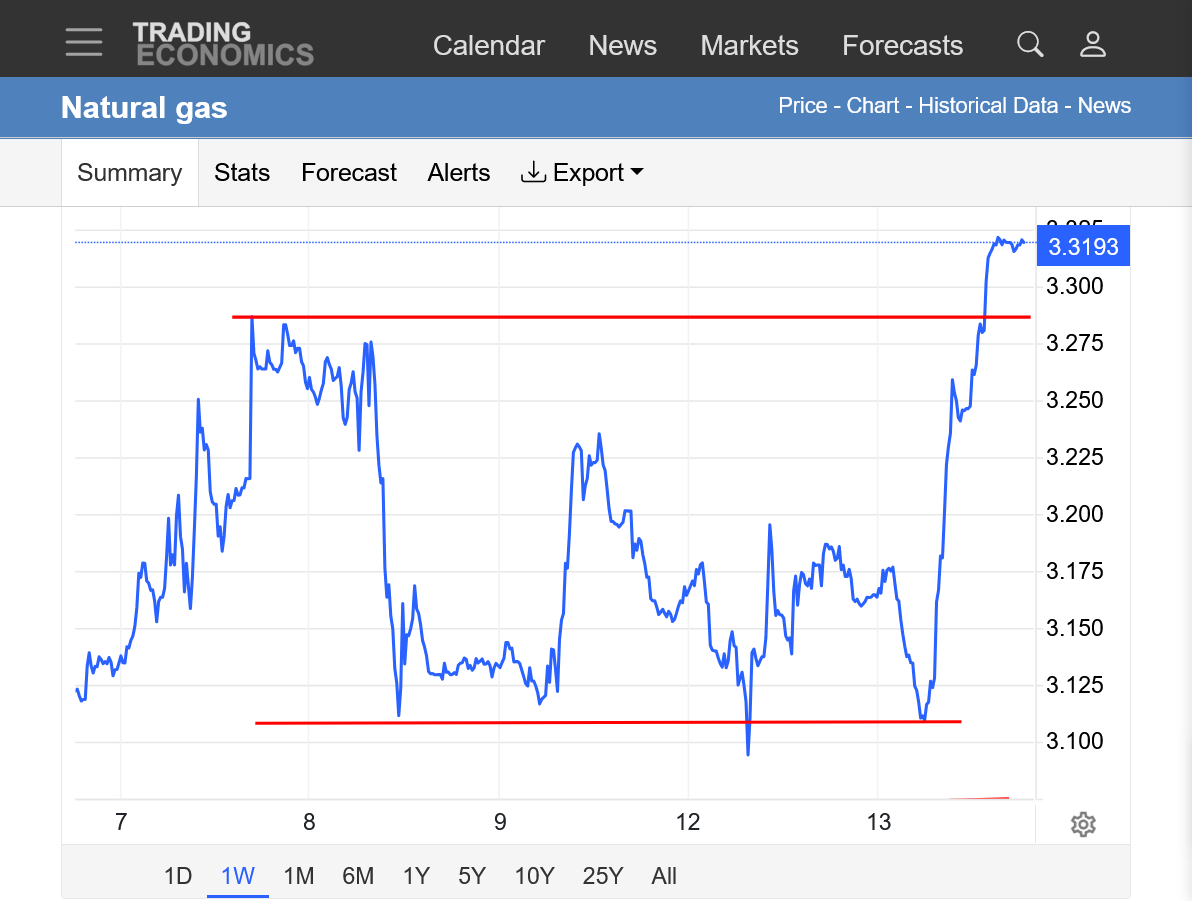
1. 1 week: NG took off like a rocket at 6am after testing the rock solid support from recent days. Currently +$2,000/contract since then and ABOVE last week's highs.
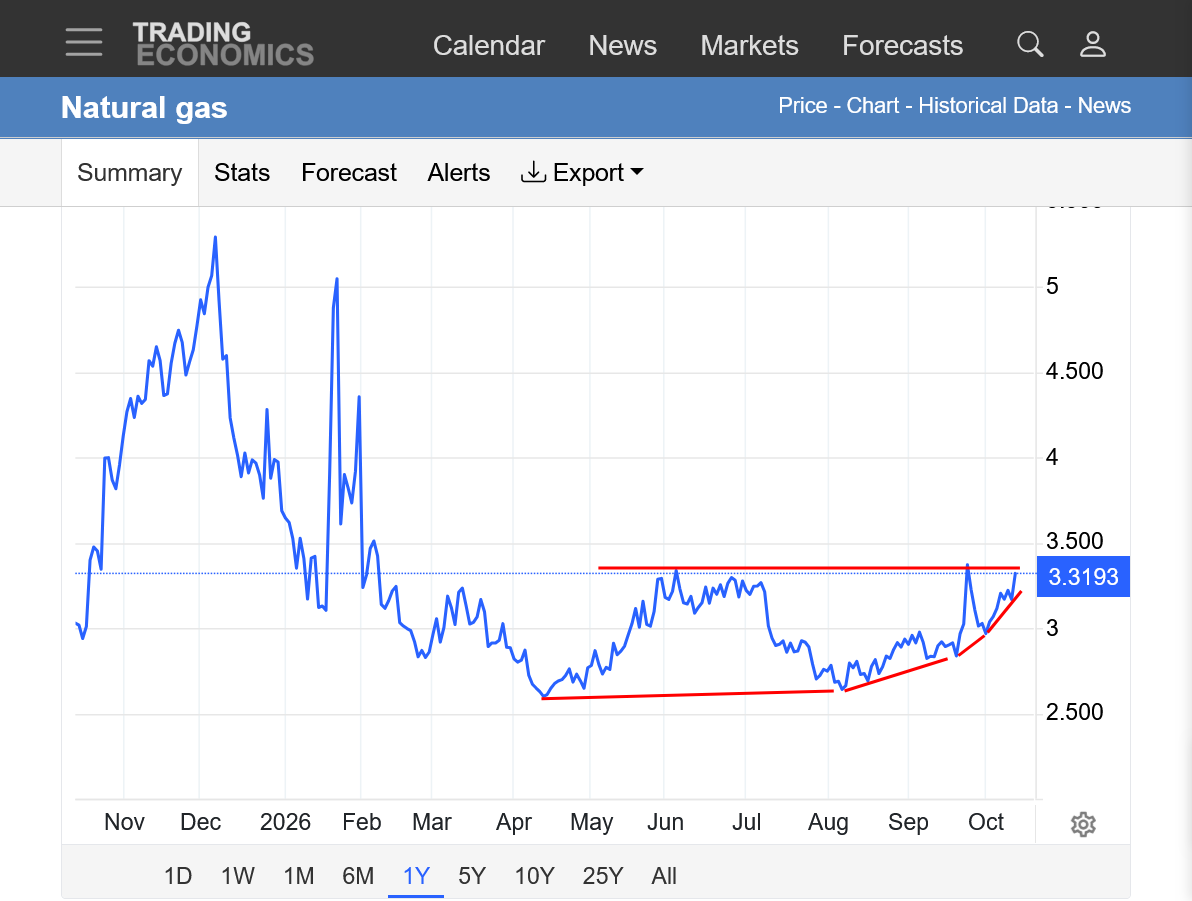
2. 1 year: Steepening upslope since the seasonal lows were set in April. With the strength today and momentum, it looks very likely that we will take out the double/triple top!
++++++++++
What gives with the NWS week 2 weather forecast being so warm/bearish?
https://www.marketforum.com/forum/topic/83844/#83852
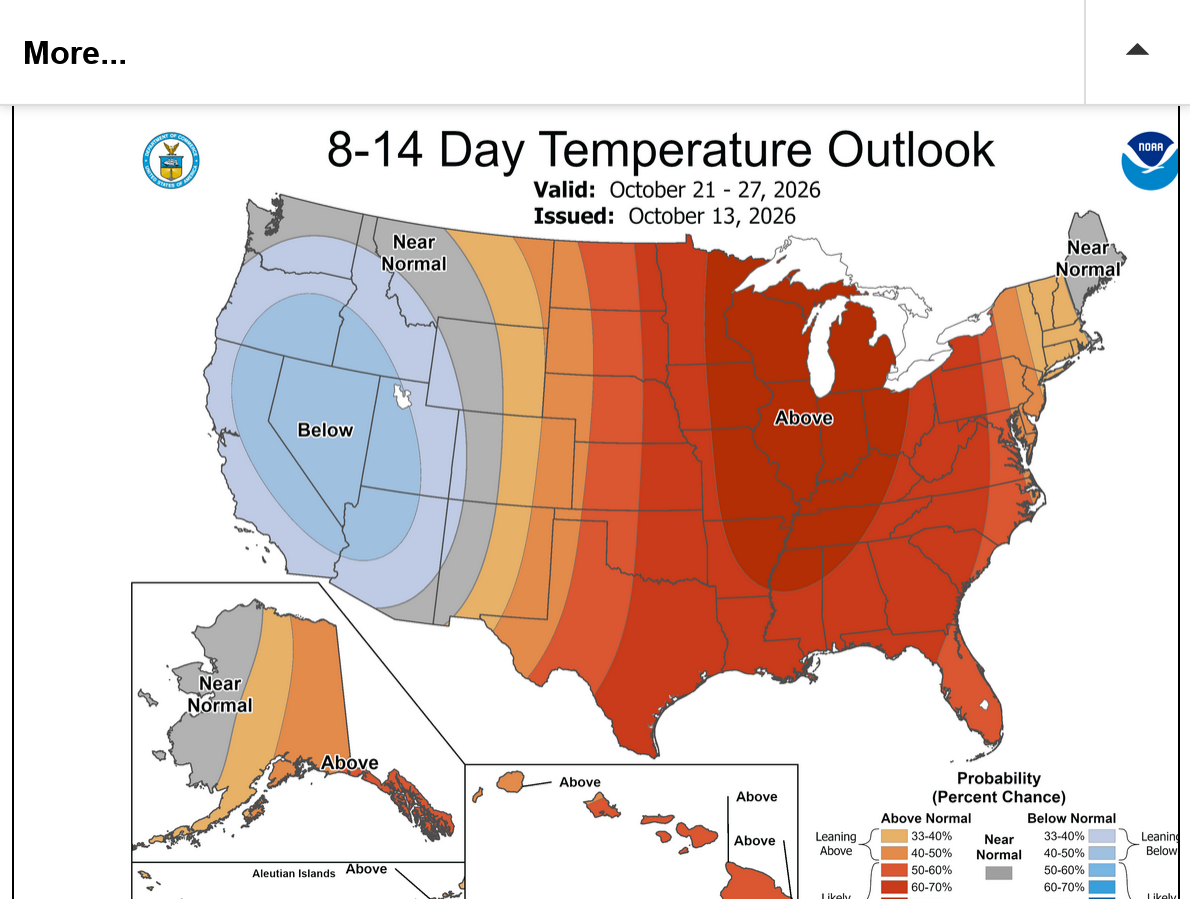
Maybe this is what gives. Heights building in Canada with a -AO and -NAO at the end of the month which is frequently a precursor to cold air delivery from high latitudes to mid latitudes. This portends the potential for a COLD START TO NOVEMBER!
https://www.marketforum.com/forum/topic/83844/#83949
https://www.psl.noaa.gov/map/images/ens/ens.html#nh
NCEP Ensemble t = 360 hour forecast 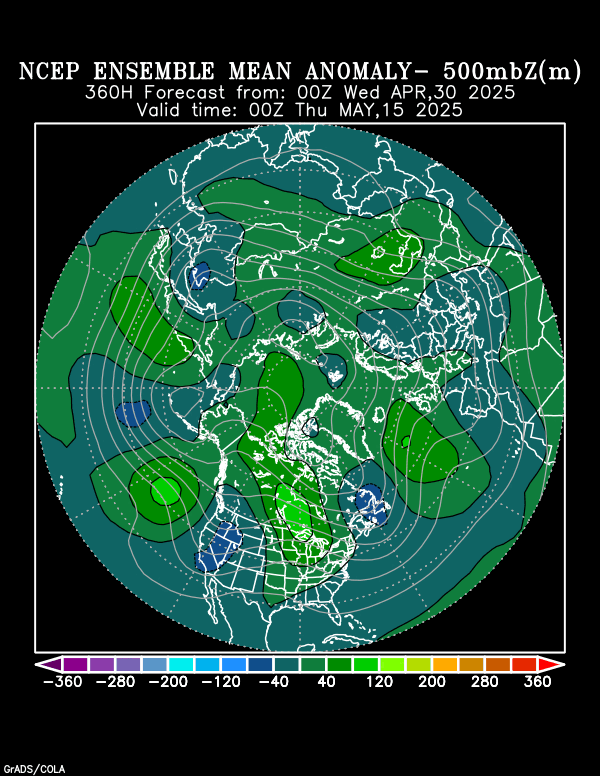
NCEP Ensemble t = 360 hour forecast 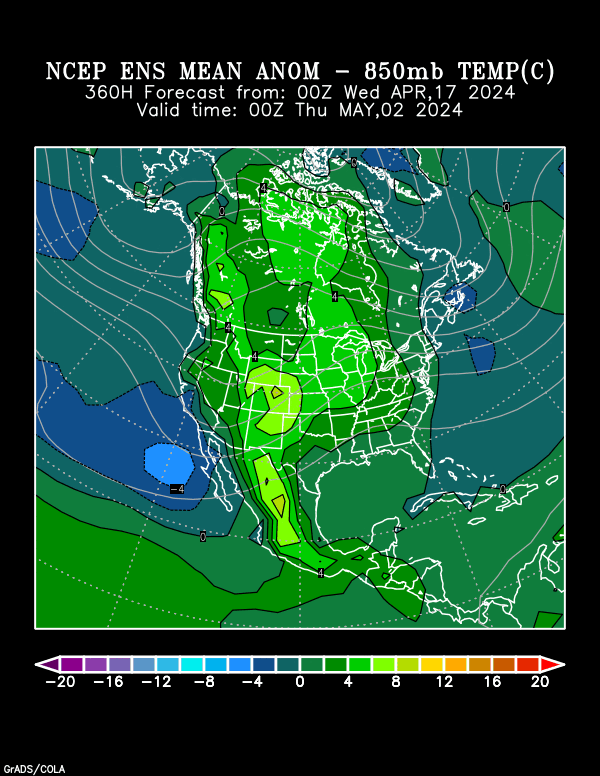
Arctic Oscillation Index, North Atlantic Oscillation Index, Pacific North American Index.
https://www.cpc.ncep.noaa.gov/products/precip/CWlink/daily_ao_index/ao.shtml
https://www.cpc.ncep.noaa.gov/products/precip/CWlink/pna/nao.shtml
Seasonals are strongly up here and early season cold always attracts many more speculators than late Winter cold, when the heating season is winding down. And the market in this age doesn't wait for the NWS to show the cold on their week 2 updates. The NG will often trade potential week 3 cold in the first half of the heating season.
And part of this boils down to the principle of self fulfilling prophesies. If all the big speculators expect all the other big speculators to trade week 3 cold early in the heating season, then a huge change to week 3 cold becomes the most important price driving factor on days like today. I can't say that was it with certainty. Yesterday's week 3 maps had this solution too. Maybe we just needed to trade down to strong support to trigger the big buying orders and it fed on itself after traders witnessed that.
The NAO and AO that is updated daily on the images/post above is not AS negative today. Did this pressure natural gas???
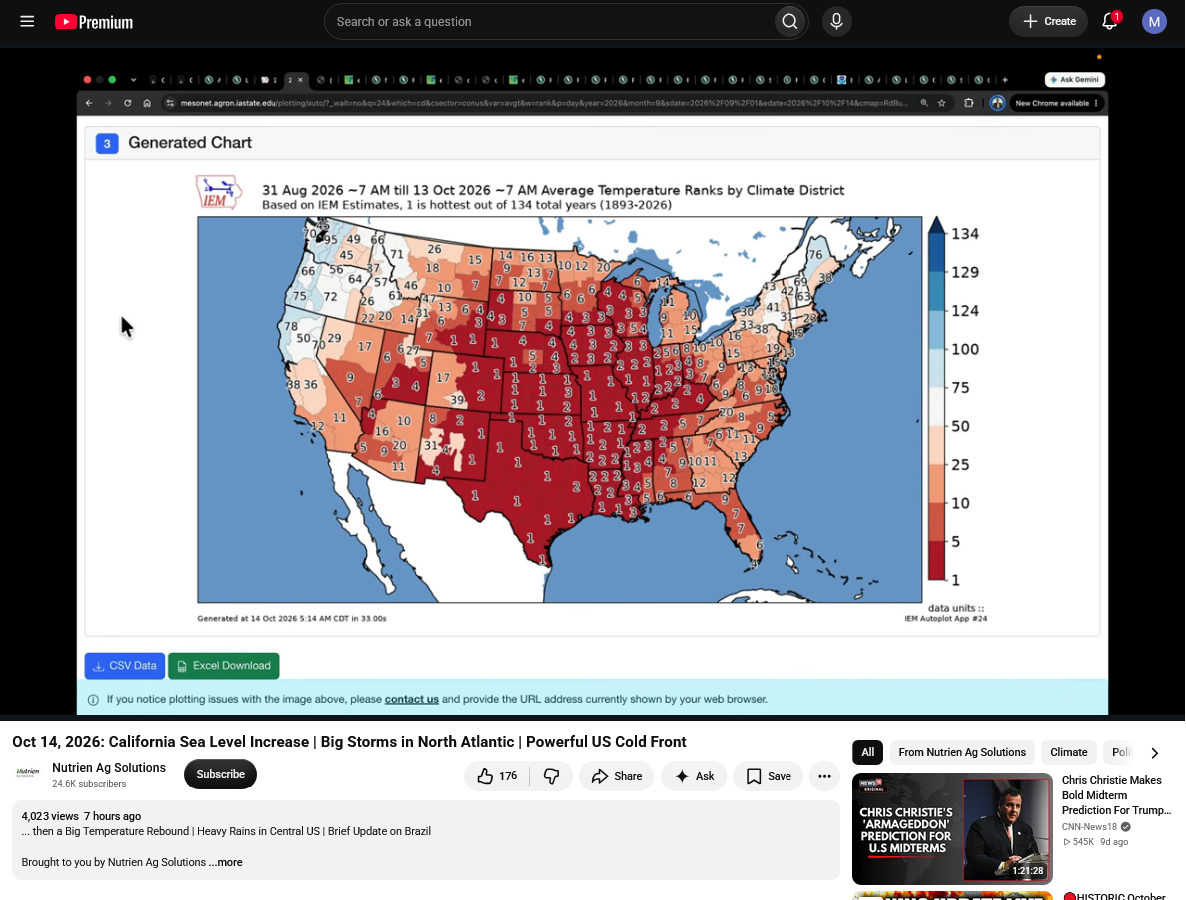
These were the temperature rankings for the period thru yesterday that started on September 1. #1 is the hottest ever! This also used up alot of natural gas for late cooling season air conditioning and reduced injections(bullish for natural gas).
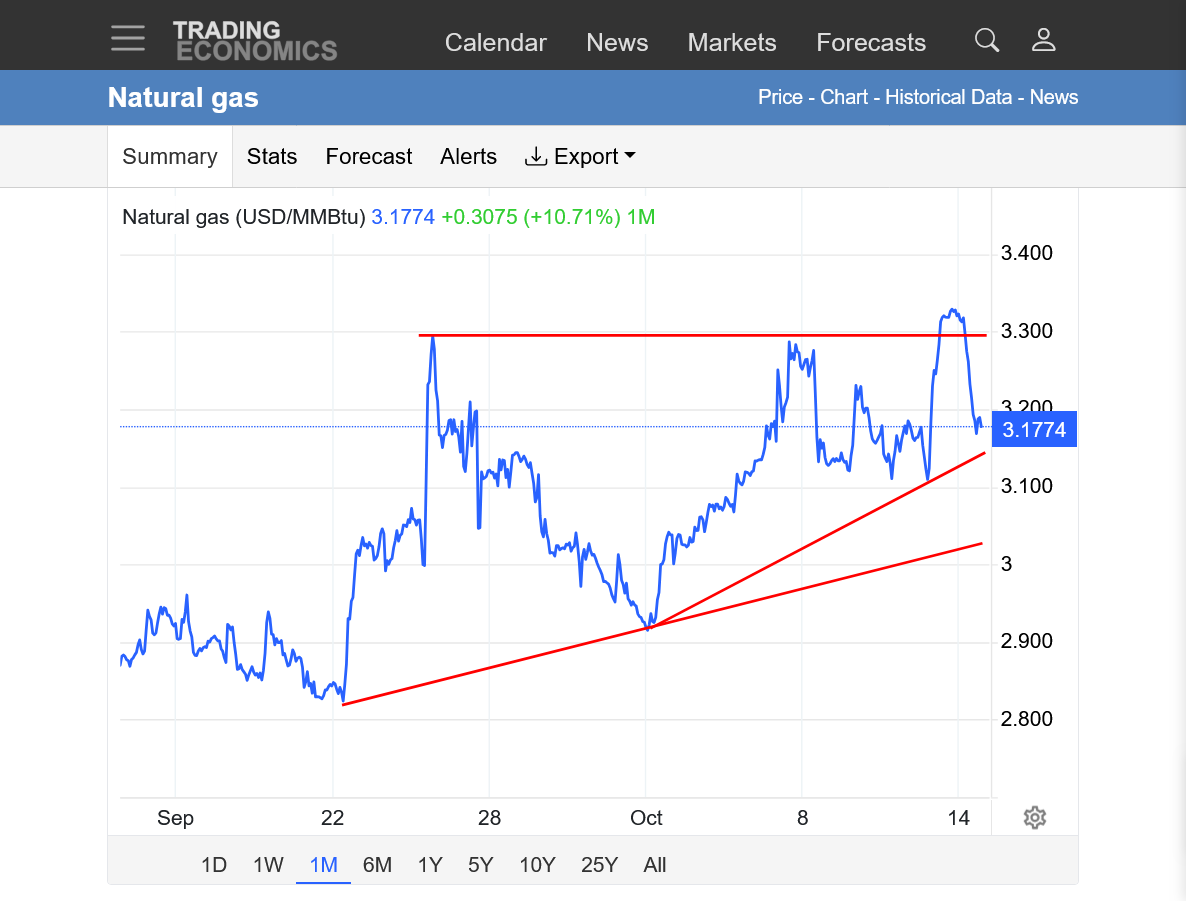
https://tradingeconomics.com/commodity/natural-gas
1. 1 month: After looking like natural gas was going to break out to the upside yesterday, with a huge rally/spike above last weeks highs and the highest price in a month........natural gas gave back much of the gains today and now looks more like it's put in a potential top. However, it still is holding all the uptrends.
++++++++++++++++++++++++++
5:50pm: Some sort of NEWS hit at exactly 2:45 pm Central that caused natural gas to spike straight up by over $1,000/contract as shown below! This was 10 minutes after the post above.
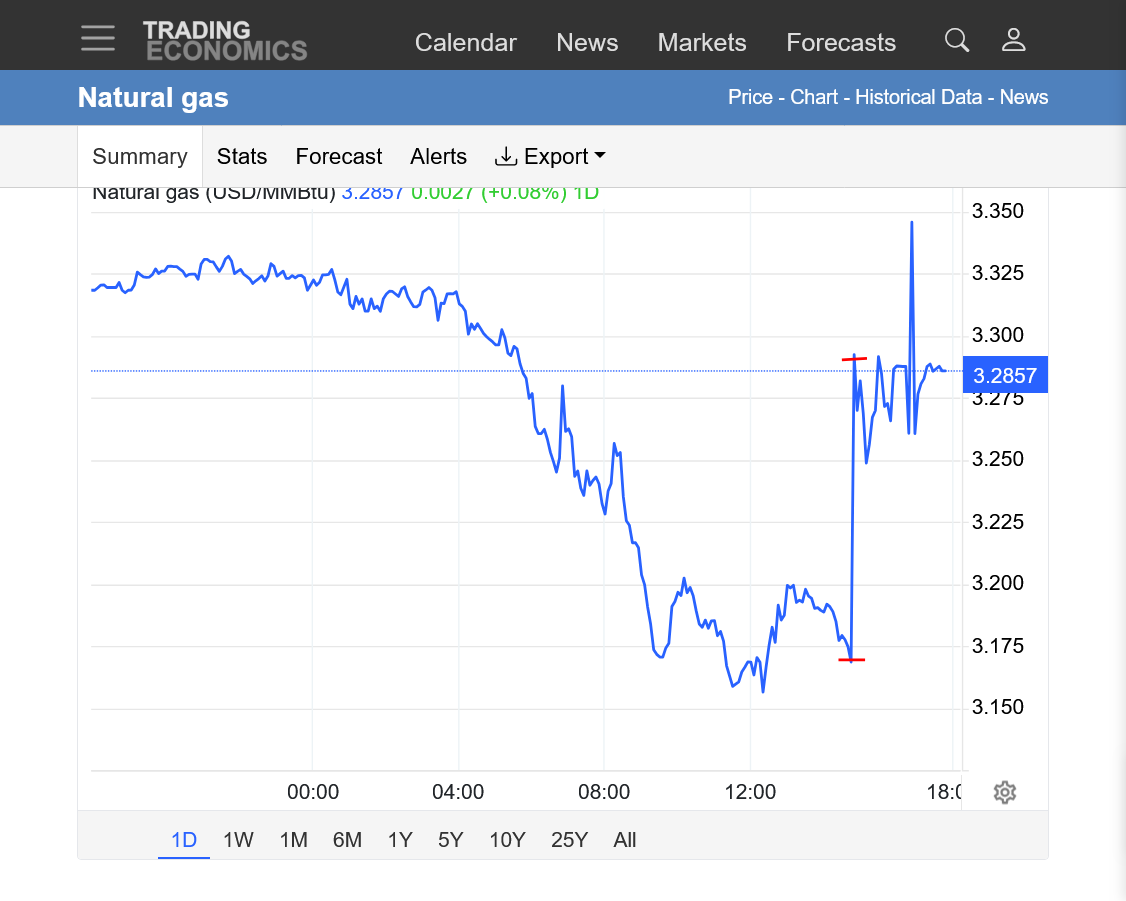
The last 12z Europeans model was +4 HDDs but came out a bit before that time. Was that a factor??
+++++++++++++++++++
For the EIA report at 9:30am tomorrow/Thursday. Storage has been LOWER than last year and slowly eroding the surplus compared to the 5 year average because of late cooling season heat. We burn natural gas to generate electricity for residential air conditioning.
However, we burn MUCH more ng in the Winter to heat homes.
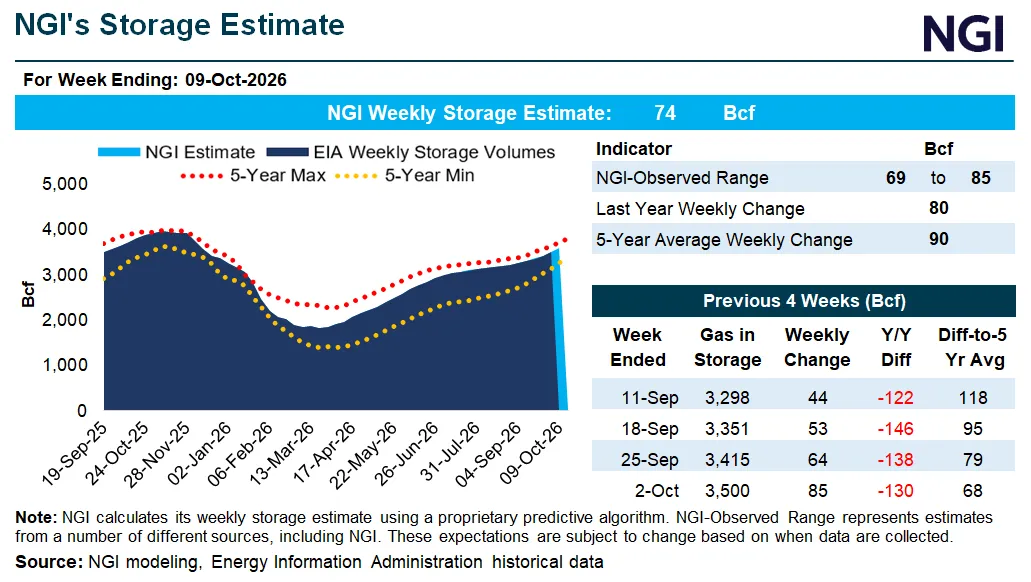
The number was a bit bullish vs expectations!
for week ending October 9, 2026 | Released: October 15, 2026 at 10:30 a.m. | Next Release: October 22, 2026
| round storage, Lower 48 states Summary text CSV JSN | |||||||||||||||||||||||||
|---|---|---|---|---|---|---|---|---|---|---|---|---|---|---|---|---|---|---|---|---|---|---|---|---|---|
| Historical Comparisons | |||||||||||||||||||||||||
| Stocks billion cubic feet (Bcf) | Year ago (10/09/25) | 5-year average (2021-25) | |||||||||||||||||||||||
| Region | 10/09/26 | 10/02/26 | net change | implied flow | Bcf | % change | Bcf | % change | |||||||||||||||||
| East | 884 | 862 | 22 | 22 | 880 | 0.5 | 856 | 3.3 | |||||||||||||||||
| Midwest | 1,037 | 1,010 | 27 | 27 | 1,027 | 1.0 | 1,017 | 2.0 | |||||||||||||||||
| Mountain | 255 | 253 | 2 | 2 | 278 | -8.3 | 242 | 5.4 | |||||||||||||||||
| Pacific | 294 | 299 | -5 | -5 | 307 | -4.2 | 276 | 6.5 | |||||||||||||||||
| South Central | 1,097 | 1,076 | 21 | 21 | 1,218 | -9.9 | 1,132 | -3.1 | |||||||||||||||||
| Salt | 236 | 227 | 9 | 9 | 302 | -21.9 | 279 | -15.4 | |||||||||||||||||
| Nonsalt | 861 | 849 | 12 | 12 | 916 | -6.0 | 853 | 0.9 | |||||||||||||||||
| Total | 3,567 | 3,500 | 67 | 67 | 3,710 | -3.9 | 3,522 | 1.3 | |||||||||||||||||
| Totals may not equal sum of components because of independent rounding. | |||||||||||||||||||||||||
Working gas in storage was 3,567 Bcf as of Friday, October 9, 2026, according to EIA estimates. This represents a net increase of 67 Bcf from the previous week. Stocks were 143 Bcf less than last year at this time and 45 Bcf above the five-year average of 3,522 Bcf. At 3,567 Bcf, total working gas is within the five-year historical range.
For information on sampling error in this report, see Estimated Measures of Sampling Variability table below.
Note: The shaded area indicates the range between the historical minimum and maximum values for the weekly series from 2021 through 2025. The dashed vertical lines indicate current and year-ago weekly periods.
https://tradingeconomics.com/commodity/natural-gas
1. 1 week: Spike up Tuesday! Steep downtrend since then. Around 6:30 am this morning, the big traders decided to sell hard. Testing the lows of this week.
2. 1 month: Triple top? Still holding the uptrend but bears have taken control.
3. 1 year: Ascending wedge with higher lows(steeping slope up) and similar highs. Was this a top or can the uptrend continue??? The weather forecast is mostly bearish and we're entering the time frame for (an early) seasonal top ahead of Winter/HDDs.
EACH YEAR IS DIFFERENT!
https://charts.equityclock.com/natural-gas-futures-ng-seasonal-chart
Natural gas weather for the next 2 weeks is EXTREMELY bearish.
CDDs on the right don't matter any more. The scales are misleading. Average HDDs on the left are above 9 at the end of the period, while average CDDs on the right are below 1 during the last week.
So the record high CDDS near 2.4 at the end of the period(on the right) are actually only 50% of the record low HDDs on the left because the scale makes them look 4 times more powerful than they really are.
What that means is that the warmth is taking much more away from HDDs than it's adding to CDDs.
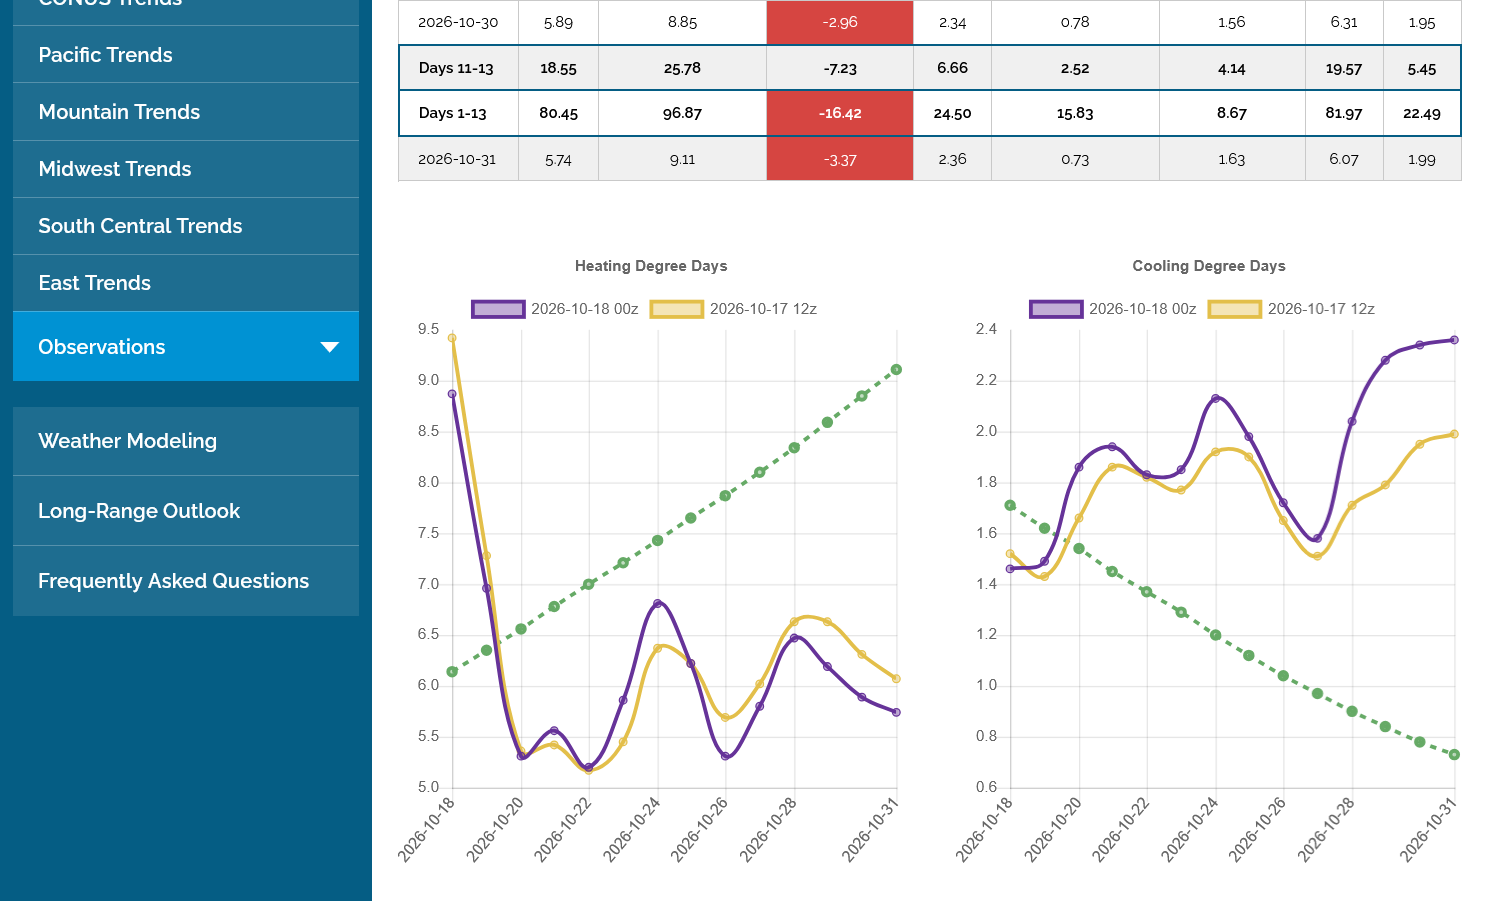
The only time there would be an exception to this in late October is if the south would be having record warmth(where CDDs are still adding up a bit) while the north was having very cold. In that case, the CDDS could be added to the HDDs.
In this case, the warmth is in the north too and up there, it takes away MUCH more from the dominant HDDs.
+++++++++++
Adding to the extremely bearish weather is the flip of the AO forecast from negative last week to positive now. The NAO also flipped from negative to neutral and the PNA is negative.
Arctic Oscillation Index, North Atlantic Oscillation Index, Pacific North American Index.
https://www.cpc.ncep.noaa.gov/products/precip/CWlink/daily_ao_index/ao.shtml
https://www.cpc.ncep.noaa.gov/products/precip/CWlink/pna/nao.shtml
https://www.cpc.ncep.noaa.gov/products/precip/CWlink/pna/pna.shtml
This was the NWS last week 2 forecast:
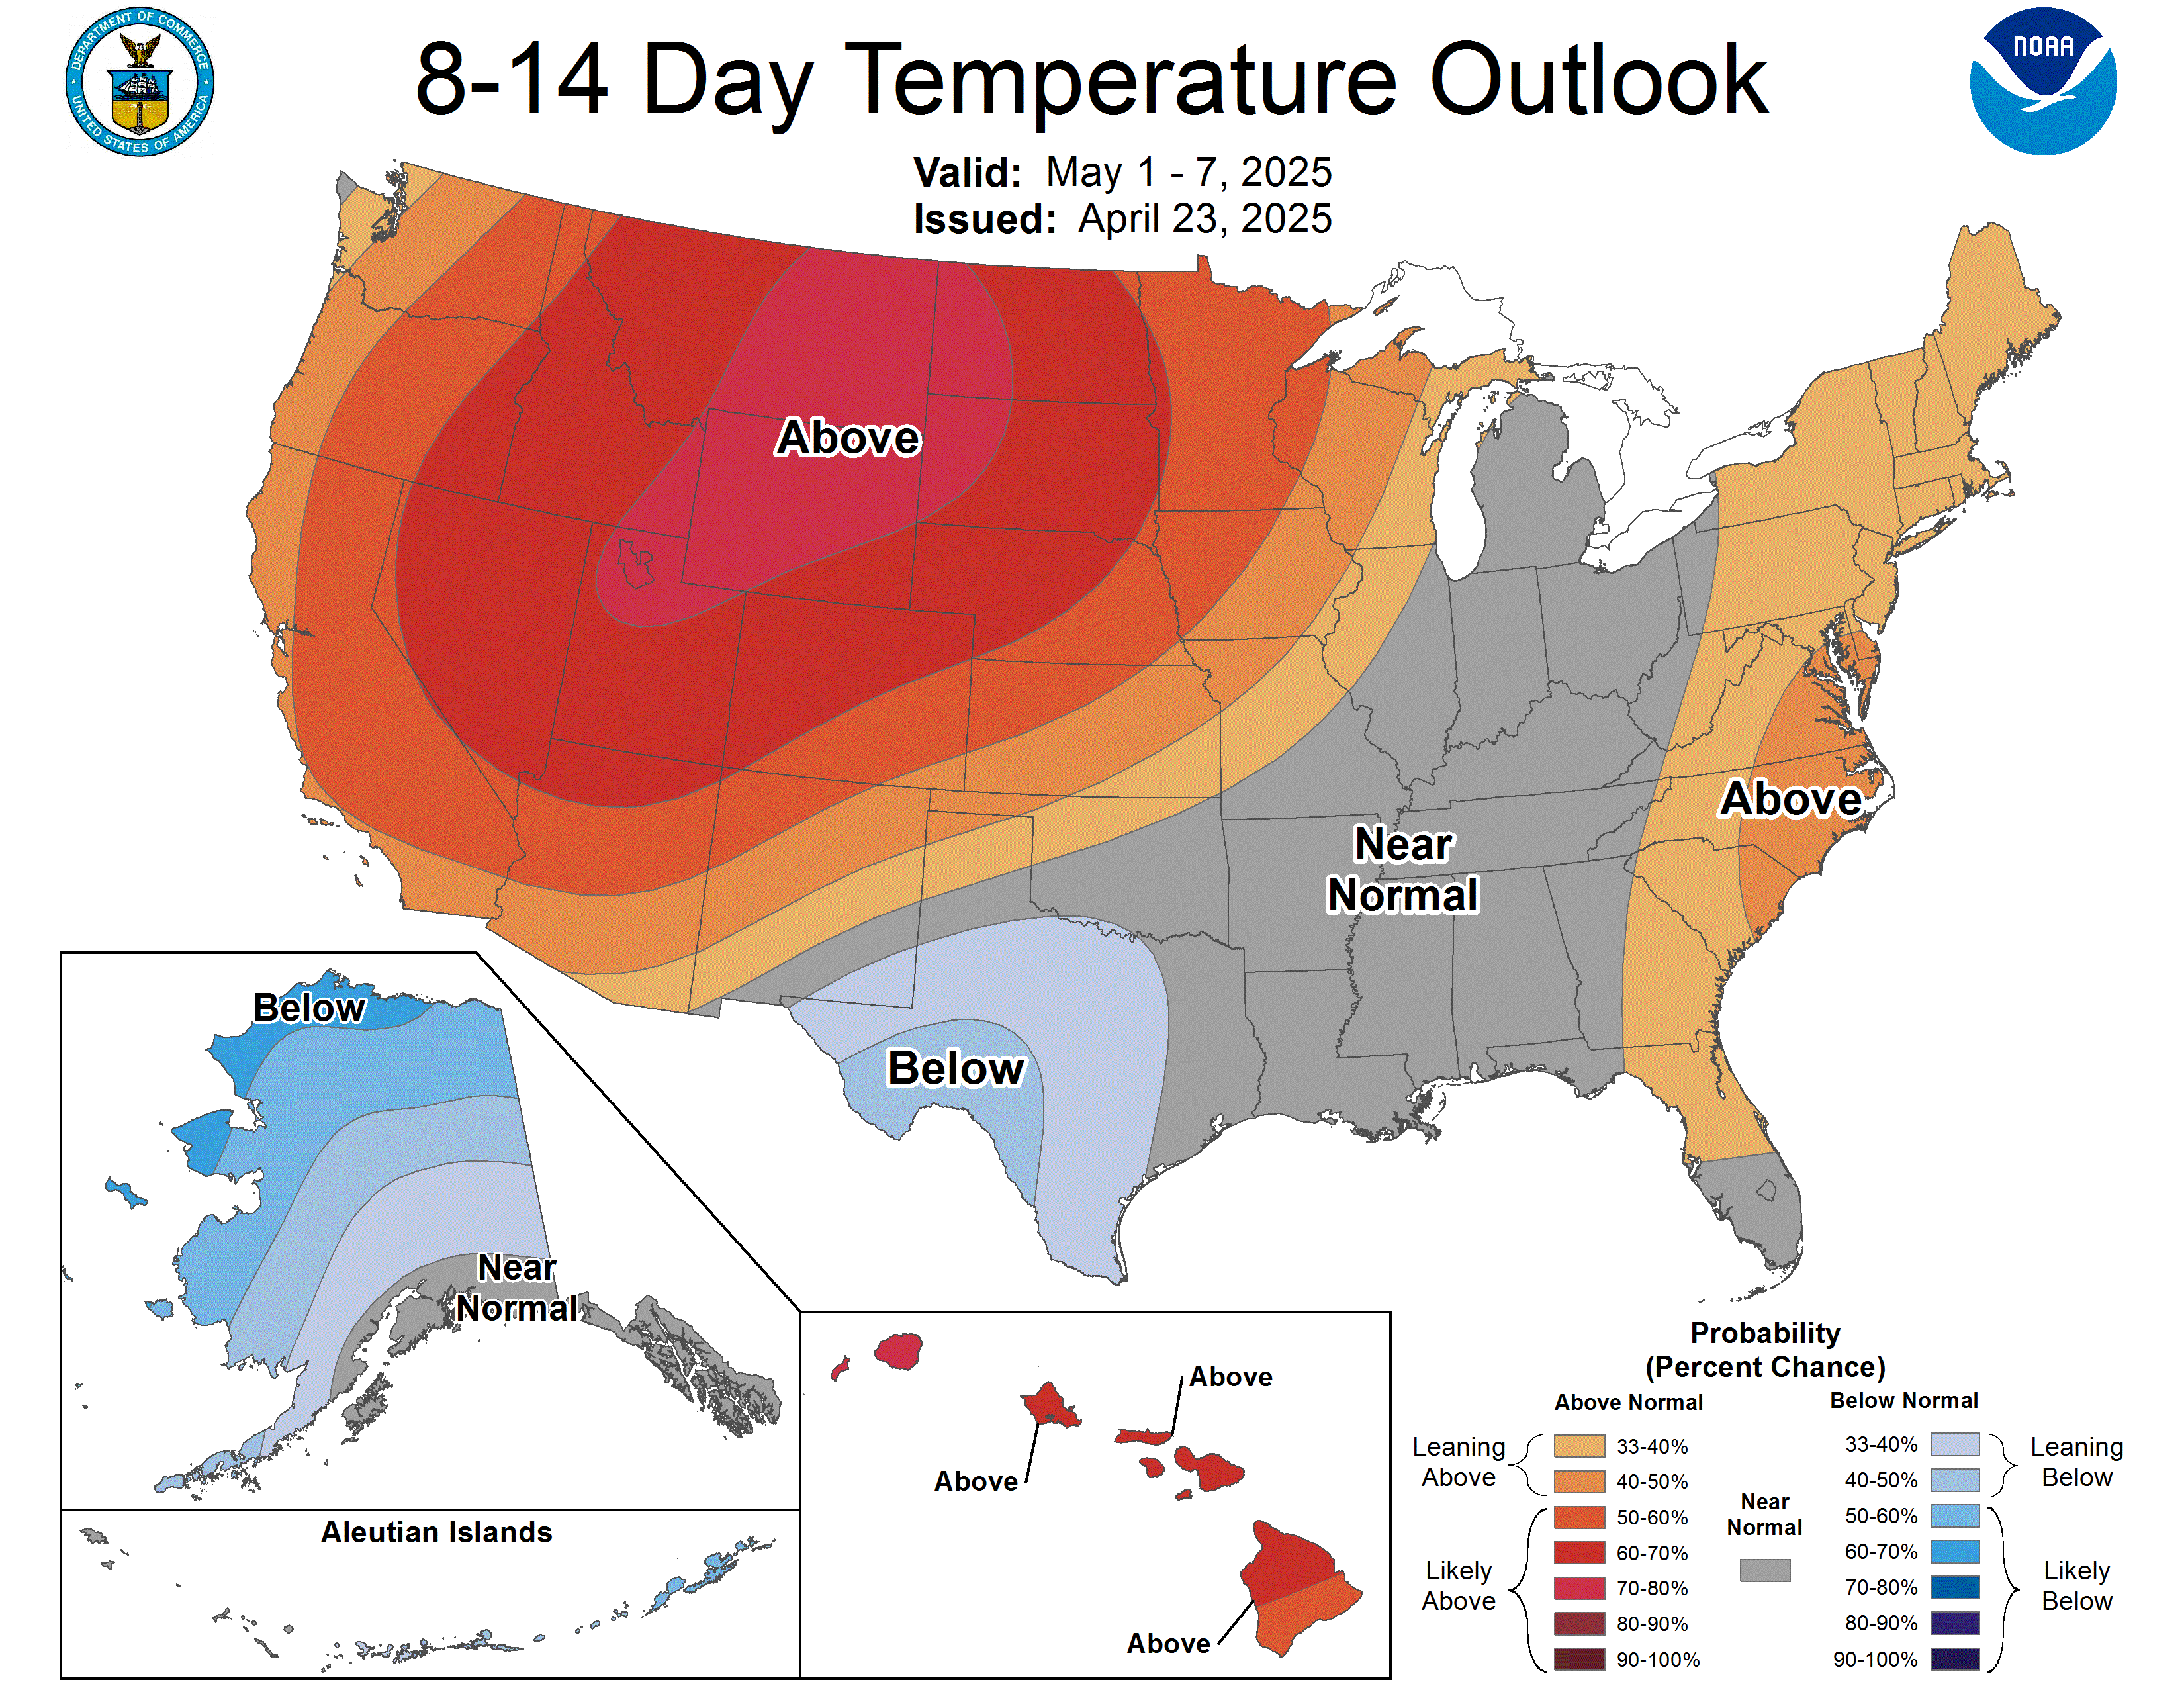
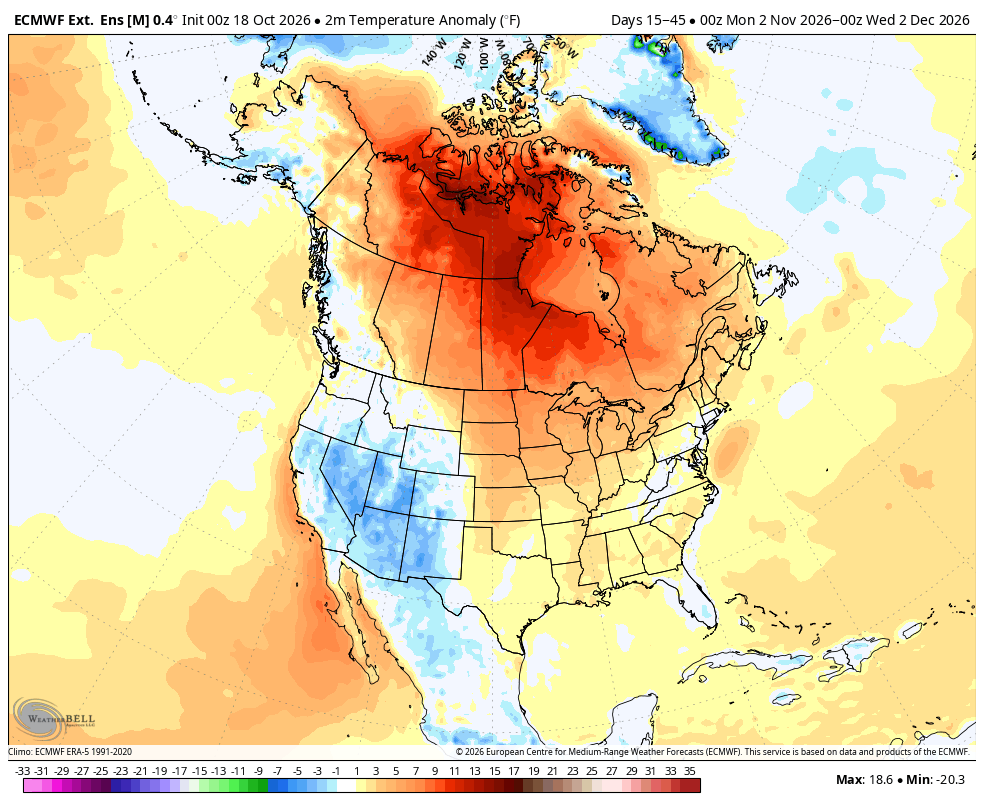
This was the latest 30 day outlook for November, updated this morning from the last 0z European Ensemble model:
++++++++++++
These were the temperatures for this Thursday's EIA report released at 9:30am.
In January, it couldn't be more bearish. However, there were probably enough CDDs LAST week to offset SOME of the lack of HDDs.
https://www.cpc.ncep.noaa.gov/products/tanal/temp_analyses.php

++++++++++
5:10 pm:
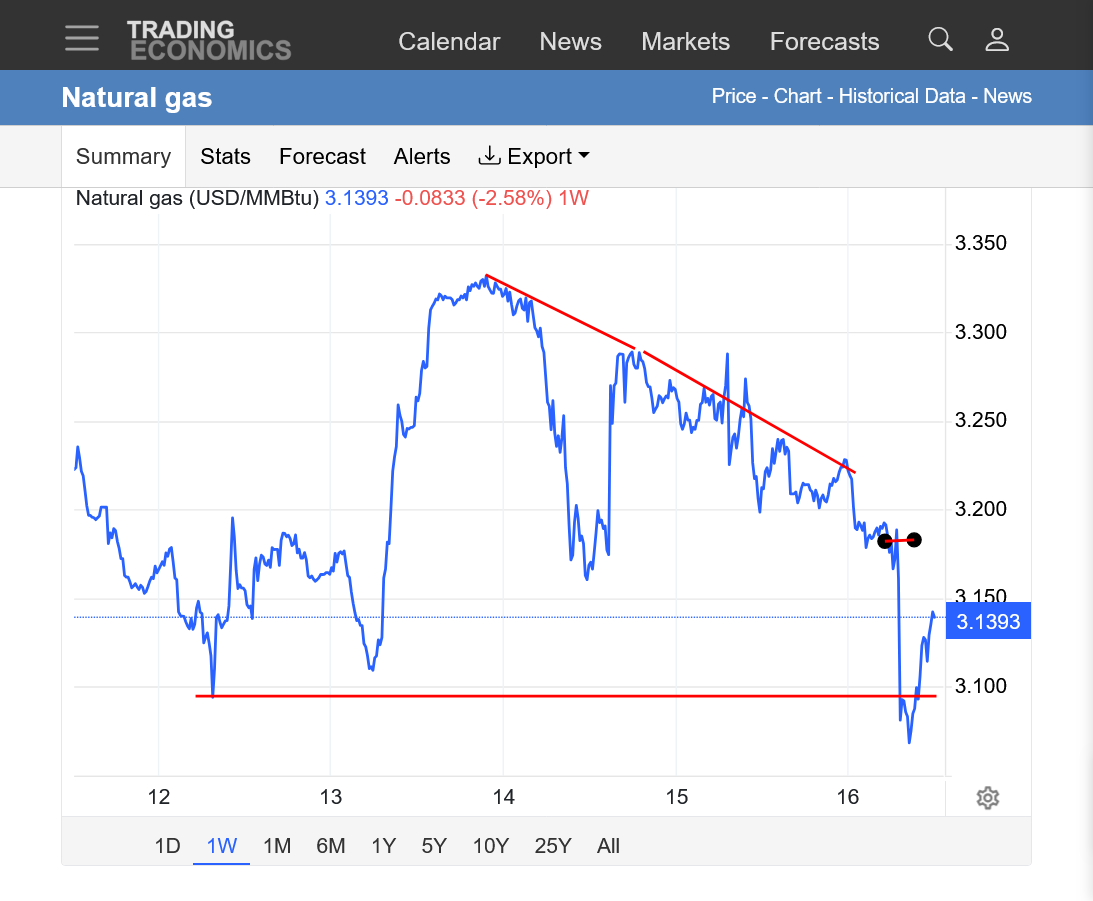
Natural gas opened a bit lower. It was under a bit of selling pressure until it went just below the low Friday, at which point it hit a bunch of sell stops, spiked to the early session lows and bounced back just above the Friday low and is just below that right now.
I should know better than to post my MEGA bearish thoughts here just BEFORE the Sunday Night open when planning to sell the open. No big deal to barely miss the trade but there are readers here that don't post who trade natural gas. I love sharing everything, all the time......except when it costs me money. Would we have opened at 3.095 instead of the high of 3.090 without my post? Maybe but we'll never know and I don't chase markets after missing the set up. It's October 18th and extremely early too. November-February weather maps like this and it would be load the boat short aggressively on the open.
We have the entire heating season ahead still.
6:10pm: Just to follow thru. If I was short from 3.095, I would put a buy stop in at 3.075. Please DO NOT DO THAT. This would just be me tonight in a low confidence trade protecting the early knee jerk drop down from warm temperatures. This would be early for the NG top, even in mild years, the uptrend is still intact and we sort of rejected the attempt to test $3 earlier/to follow thru after hitting all the sell,stops.
Also, I never tell people what trade to make or what prices and usually not my trades(which are not frequent like they used to be) . I'll tell you the weather and analyze prices charts and market fundamentals.........for free. You decide on the trades or just enjoy learning about markets/weather and other stuff which is great fun too!
4am; we’ve reversed higher. The EE added around 1 HHD AND 1 CDD but not enough to be bullish, I don’t think.
But the overnight trading bulls have taken control at this stage. 1 thing about natural gas. The day session traders come in around 6 or 7am and it’s an entirely new ballgame. Anything is possible including extreme whipsaw type action up And down and the market going in the opposite direction as it did overnight.
+++++++++
11:30am:
Not surprisingly, after the overnight bulls took control and spiked us higher(up ~$1,500 from the lows), the day traders came in and at exactly 7am, the spike higher peaked and they sold it hard.
This happens very frequently in the natural gas market. Sometimes it can be an hour earlier, sometimes a bit later. Sometimes it will go up then down or down then up.
How do you trade this with confidence?
There isn't a good answer to that because the ng market can be almost impossible to trade at times like this one. For me, it means greatly limiting trades to only very high confidence weather trades where the set up includes a huge change in the temperature forecast during a key heating (or cooling period).
1. In this case, we are not in a key time frame(that features high residential heating/cooling demand).
2. There was no huge change from last Friday
We are now back down to the open last night, shown in red at 3.090.
https://tradingeconomics.com/commodity/natural-gas
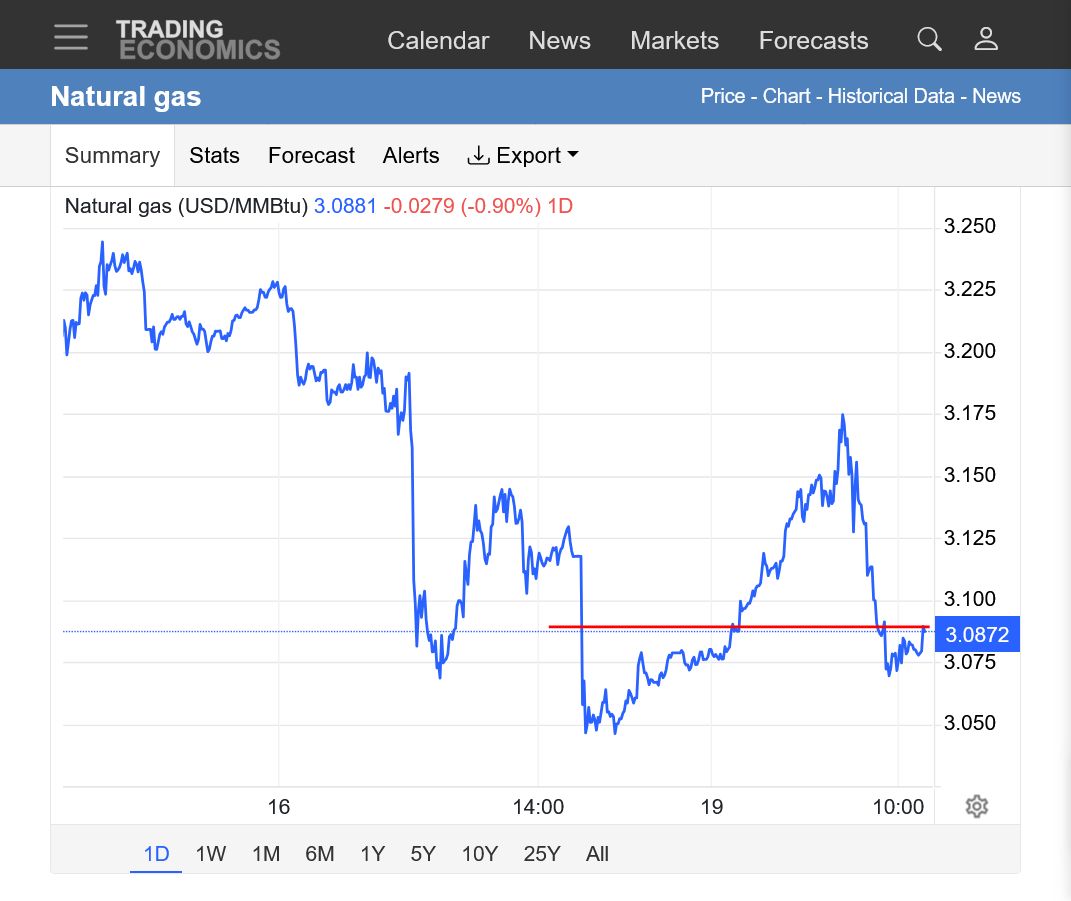
Natural gas continues to be pressured by mild weather forecasts!
1, 1 week with the open on Sunday evening. Rally overnight Sunday. Funds came in selling hard at 7am Monday. Under pressure since then, now testing $3.
Front month, November is being pressured by mild weather. December put in a POTENTIAL bottoming formation today. Almost new lows but back close to unchanged and the highs for this daily bar.
The contract lows were on October 2, 2026 and this could have been a test and double bottom. However the weather is BEARISH.
The source that I post here only graphs the front month.
https://groww.in/blog/candlestick-patterns
+++++++++
This is the candlestick formation for the December natural gas today.
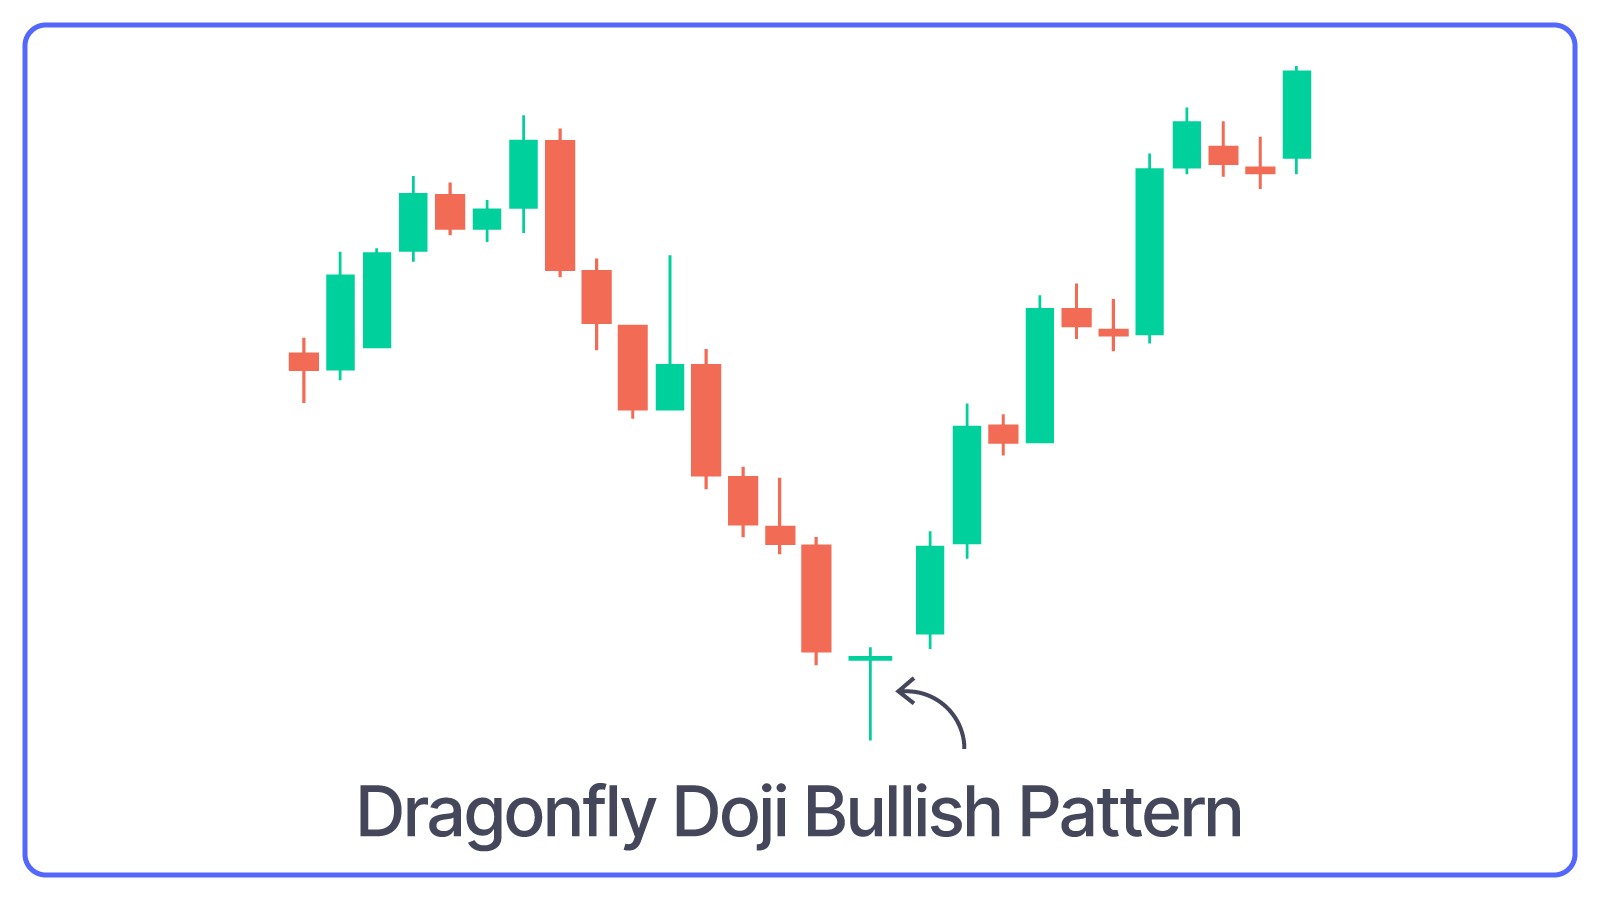
The Dragonfly Doji is a single candlestick pattern with a very small body and a long lower shadow that appears at the bottom of a downtrend.
What Dragonfly Doji Bullish Pattern Indicates: It indicates that a stock's open, high, and close prices are all near the same level. Dragonfly Doji Bullish Pattern might seem similar to Hammer Pattern but Dragonfly Doji has no body, while Hammer has a small body at the top.
Our internet with Spectrum has been down for 7 hours but looking on my IPhone shows zero follow thru to the potentially bullish daily candlestick bar from Tuesday.on December NG, with the wx forecast still too warm.
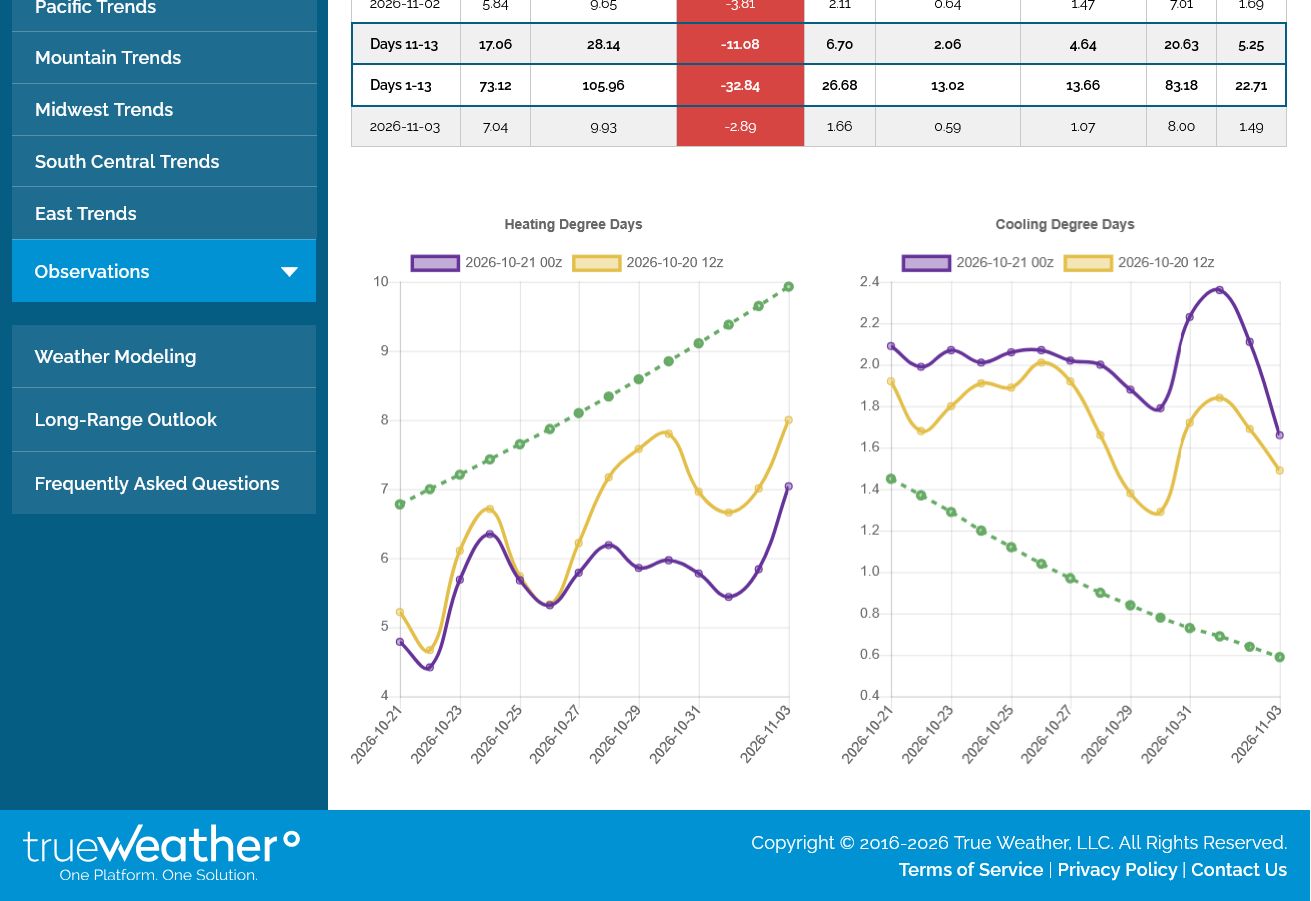
In fact, the last 0z European Ensemble model in purple on the LEFT was a whopping -10 HDDs compared to the previous 12z run from 12 hours earlier. NG isn’t going up on that! Most of that was week 2 warming as you would expect since that part of the forecast usually changes the most.
CDDs on the right look impressive but look at the different scales between CDDs on the right that only go up to 2.4 and HDDs on the left that go up to 10. So multiply the magnitude of everything on the left X 4 and in reality, at the end of week 2, the HDDs on the left are almost 4 times greater than the CDDs on the right even though they are close to the same level on the graphing page below.
The bottom line is:
1. Look how far below the climatological average (rapidly increasing in dashed green) The HDDs are of the left!
2. Note that the purple line from the last run went from being bearish to EXTREMELY bearish. Weather markets will respond to CHANGES in the forecast. This one is negative for ng prices.
Slightly bullish EIA # compared to the forecast but the temperature forecast remains extremely bearish. The blue line on the graph below that had been comfortably above the 5 year average, thanks to our mild 2026 Spring, has been eroded by late Summer/early Fall heat which caused it to converge with the 5 year average. Storage is now just +35 Bcf vs the 5 year average and -152 Bcf vs last year.
At the bottom of this post, I copied the EIA numbers for the next 18 reports issued on Thursday's at 9:30am to use for comparing the upcoming numbers with last years numbers. Next week, for instance we will be comparing it with the +74 Bcf injection for the same week in 2025.
Thanks to the upcoming mild weather coming up, that blue line should again establish a greater surplus(with the 5 year average) with a steeper upslope to the injections for numerous upcoming weeks. It will take along time to catch up to the levels of last year at this time. Considering the HUGE December 2025 drawdowns, we could could do it in December 2026!
for week ending October 16, 2026 | Released: October 22, 2026 at 10:30 a.m. | Next Release: October 29, 2026
| Working gas in underground storage, Lower 48 states Summary text CSV JSN | |||||||||||||||||||||||||
|---|---|---|---|---|---|---|---|---|---|---|---|---|---|---|---|---|---|---|---|---|---|---|---|---|---|
| Historical Comparisons | |||||||||||||||||||||||||
| Stocks billion cubic feet (Bcf) | Year ago (10/16/25) | 5-year average (2021-25) | |||||||||||||||||||||||
| Region | 10/16/26 | 10/09/26 | net change | implied flow | Bcf | % change | Bcf | % change | |||||||||||||||||
| East | 900 | 884 | 16 | 16 | 897 | 0.3 | 876 | 2.7 | |||||||||||||||||
| Midwest | 1,065 | 1,037 | 28 | 28 | 1,056 | 0.9 | 1,044 | 2.0 | |||||||||||||||||
| Mountain | 257 | 255 | 2 | 2 | 282 | -8.9 | 246 | 4.5 | |||||||||||||||||
| Pacific | 297 | 294 | 3 | 3 | 310 | -4.2 | 279 | 6.5 | |||||||||||||||||
| South Central | 1,125 | 1,097 | 28 | 28 | 1,250 | -10.0 | 1,165 | -3.4 | |||||||||||||||||
| Salt | 251 | 236 | 15 | 15 | 318 | -21.1 | 295 | -14.9 | |||||||||||||||||
| Nonsalt | 875 | 861 | 14 | 14 | 933 | -6.2 | 871 | 0.5 | |||||||||||||||||
| Total | 3,644 | 3,567 | 77 | 77 | 3,796 | -4.0 | 3,609 | 1.0 | |||||||||||||||||
| Totals may not equal sum of components because of independent rounding. | |||||||||||||||||||||||||
Working gas in storage was 3,644 Bcf as of Friday, October 16, 2026, according to EIA estimates. This represents a net increase of 77 Bcf from the previous week. Stocks were 152 Bcf less than last year at this time and 35 Bcf above the five-year average of 3,609 Bcf. At 3,644 Bcf, total working gas is within the five-year historical range.
For information on sampling error in this report, see Estimated Measures of Sampling Variability table below.
Note: The shaded area indicates the range between the historical minimum and maximum values for the weekly series from 2021 through 2025. The dashed vertical lines indicate current and year-ago weekly periods.
https://www.investing.com/economic-calendar/natural-gas-storage-386
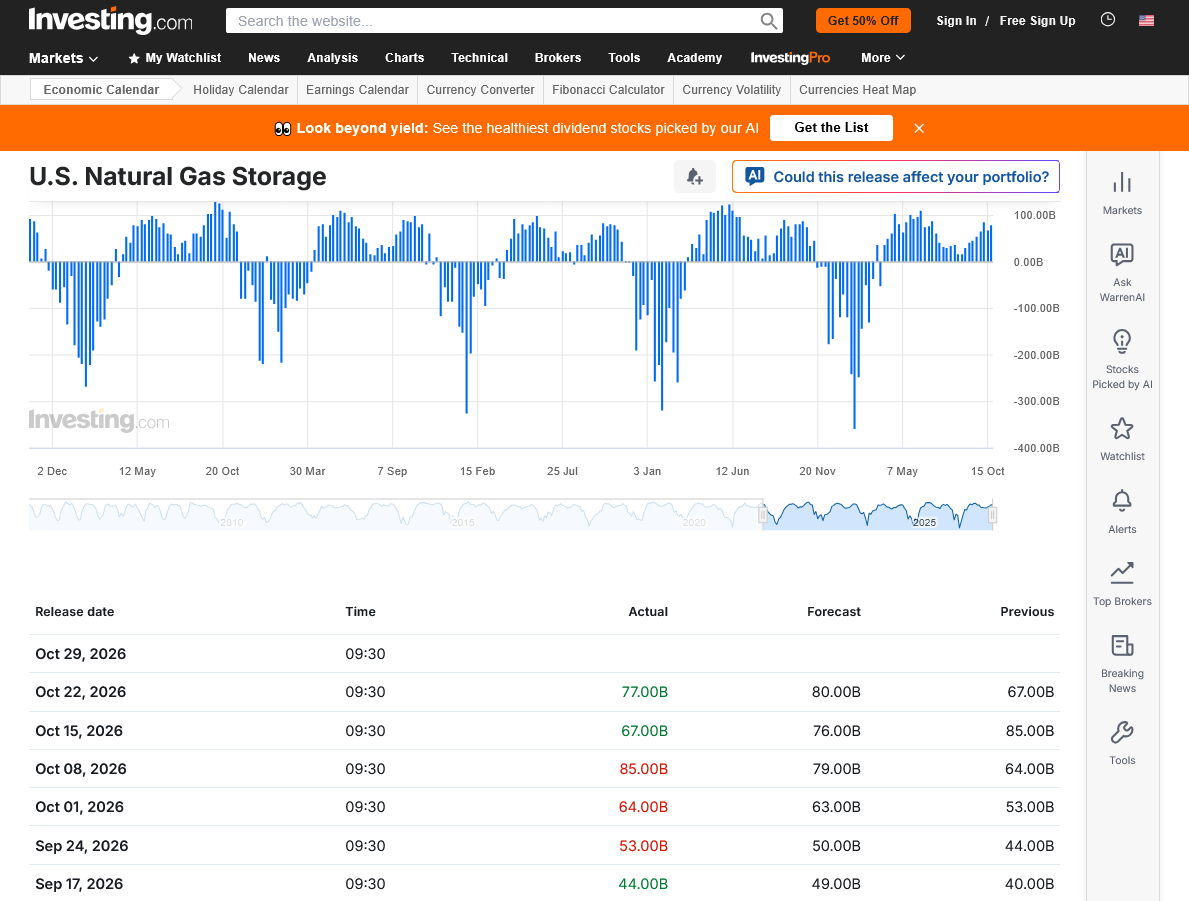
+++++++++++
Below are the numbers for the next 18 injections/withdrawals from 1 year ago to use in order to compare them with last year. Starting with the bottom up for next week. The first number was the ACTUAL number for that week. (2nd number was the estimate, 3rd number the previous week).
Next week, we will be comparing the injection with the +74 Bcf from October 30, 2026.
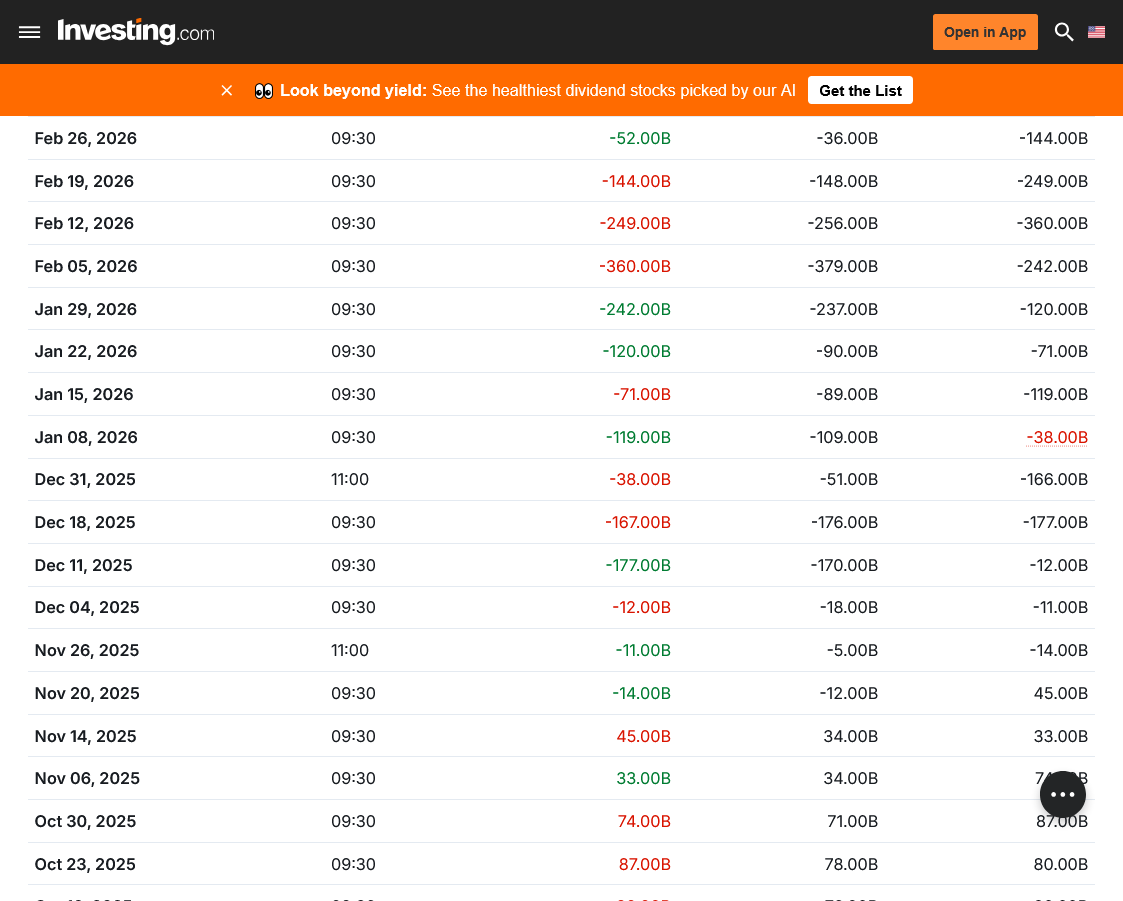
++++++++++++++++
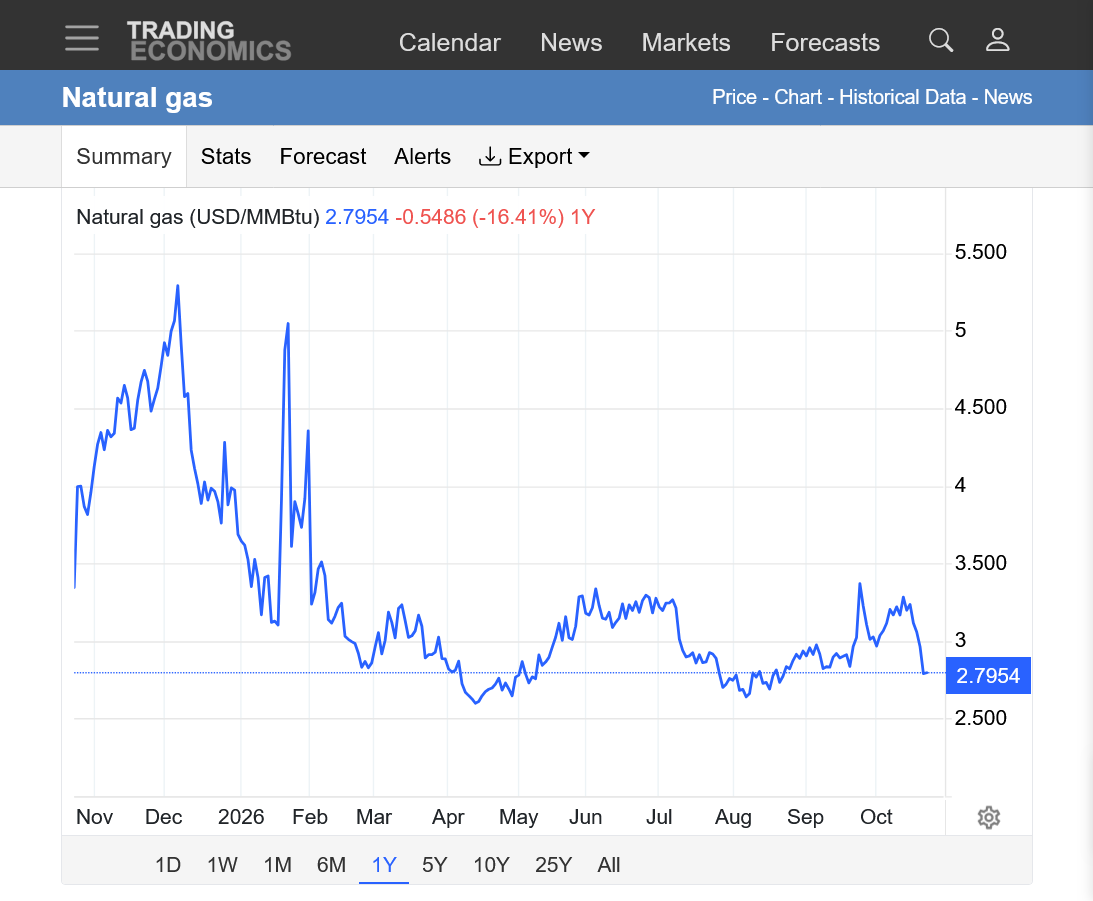
https://tradingeconomics.com/commodity/natural-gas
2 things to note on the graph below in comparing it with the data above.
1. The huge rally in November/early December 2025 and HUGE early Winter drawdowns above that caused it. Early Winter drawdowns are always more powerful (and overdone) when driving prices because the entire Winter still lies ahead and more speculators will buy into them.
2. The 2nd, extremely intense spike straight up on the price chart below. This was from the massive drawdowns at the end of January and the first 2 weeks of February 2026. After that, we had MILD weather into April which pressured natural gas to a late seasonal low earlier this year.
3. These are textbook, classical examples of how the weather impacts natural gas futures prices. The market will ALWAYS start reacting long before the actual weather hits. Often 2 weeks before the weather pattern change when it's a flip to the opposite pattern for temperatures in the high population centers with their huge residential heating demand.
https://naturalgasintel.com/news/natural-gas-sell-off-masks-a-troubling-storage-shortfall/
++++++++
Front month November Natural Gas expires next Wednesday. December volume will be passing up November volume, possibly as early as tomorrow.
This last 0z European Ensemble model, already extremely bearish was even more bearish, almost another -3 HDDs(purple line on the left).
Look how far below the rapidly increasing green line (average/seasonal HDDs) we are.
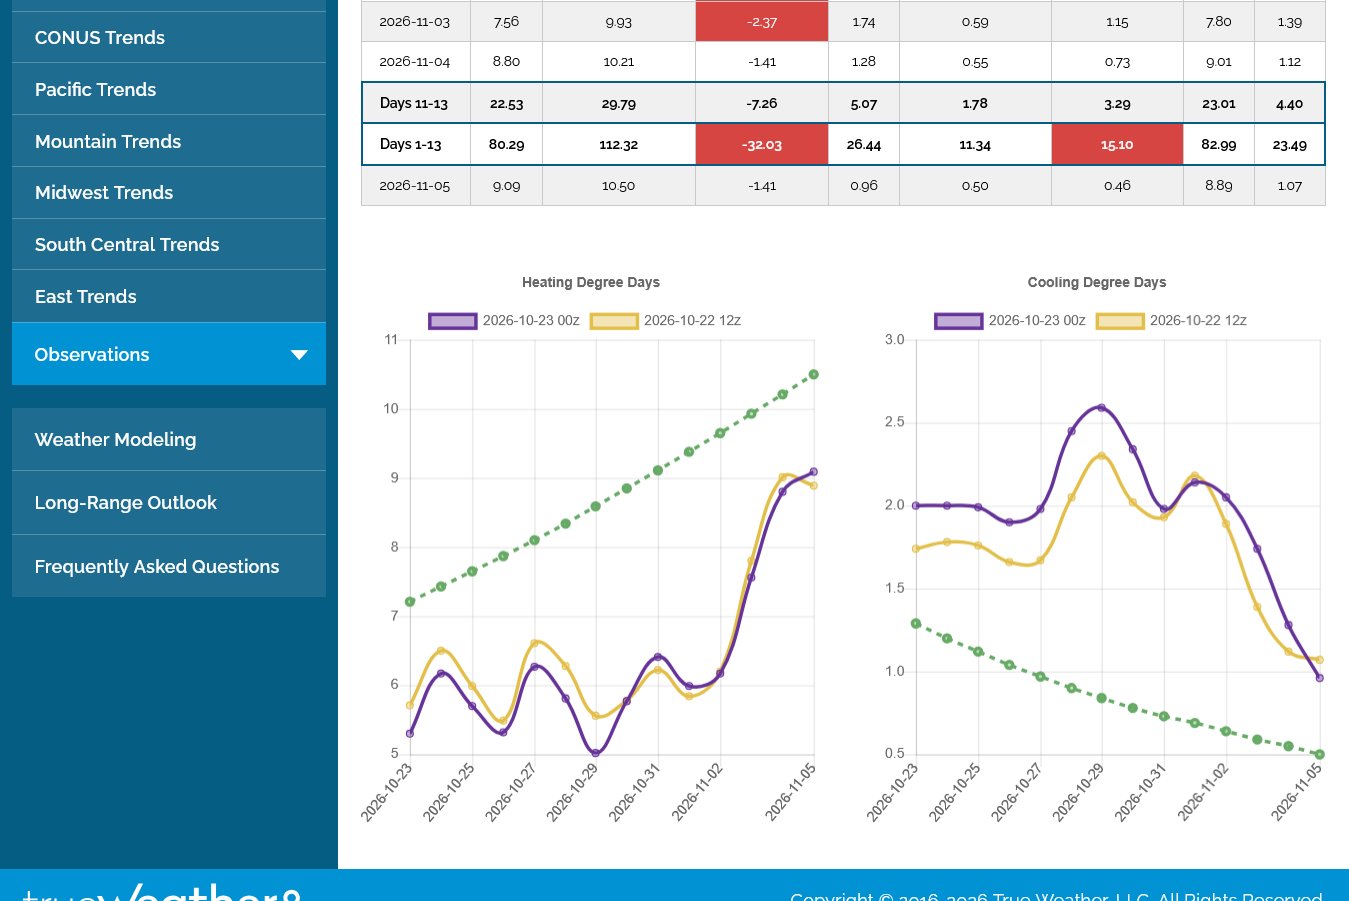
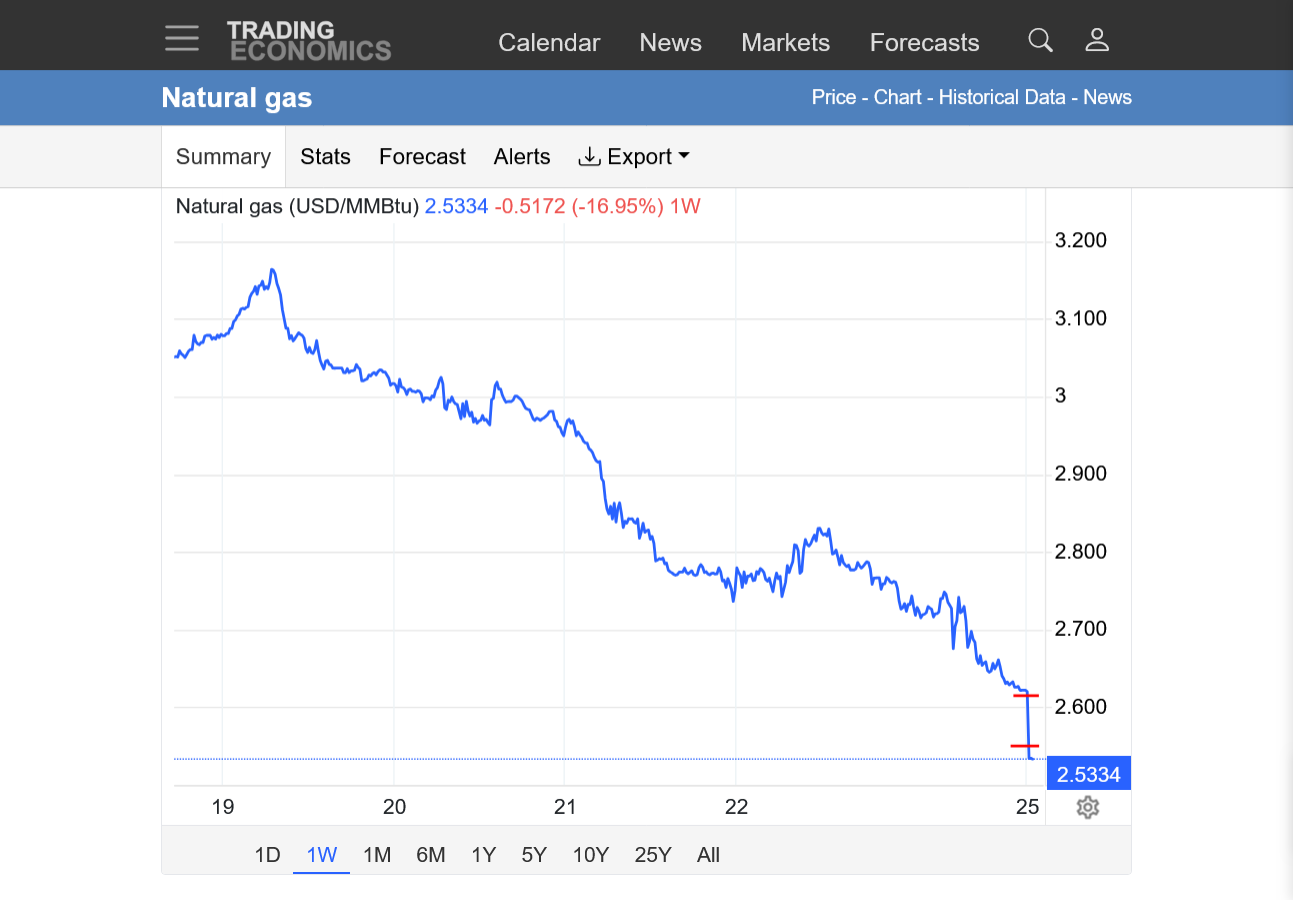
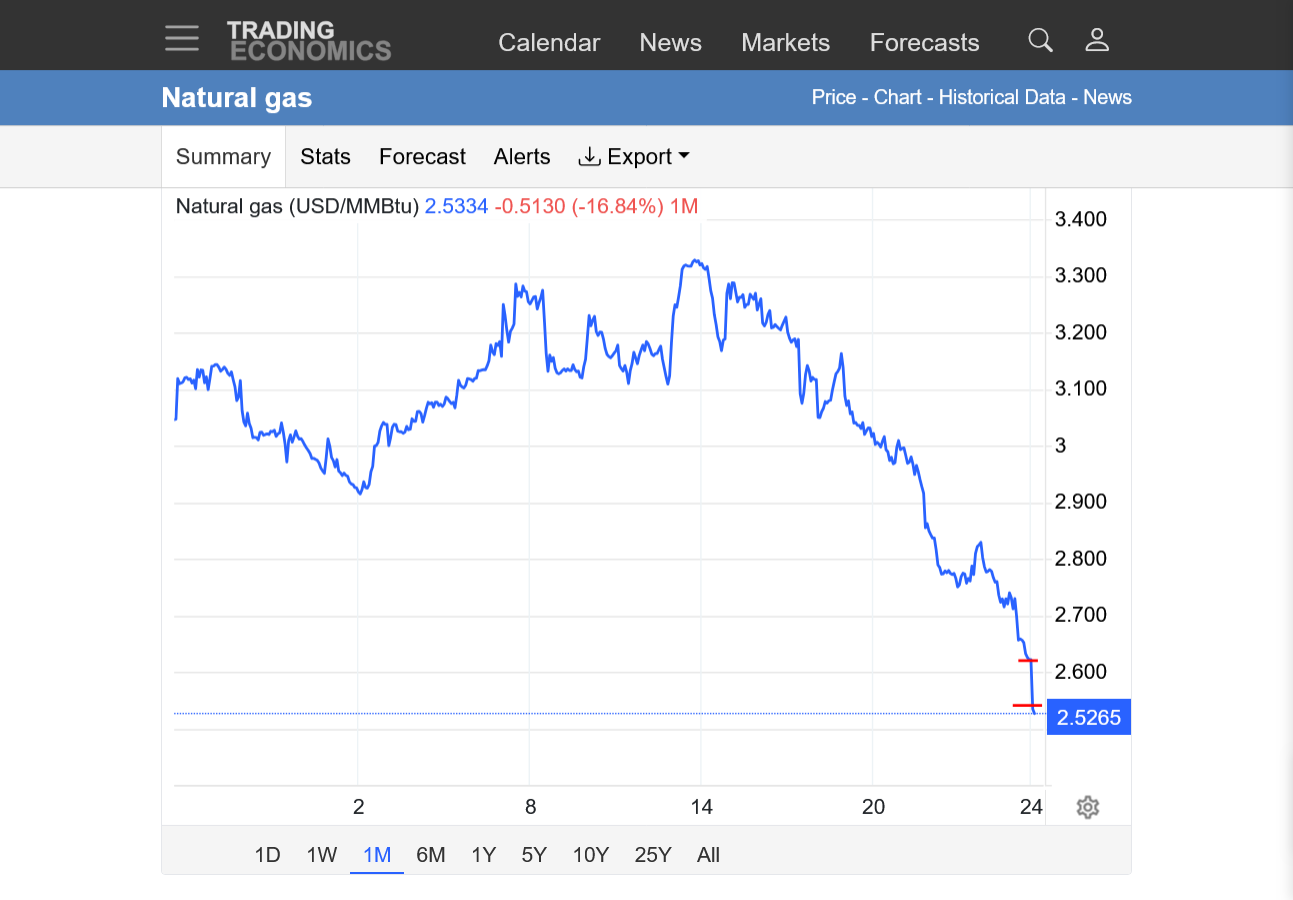
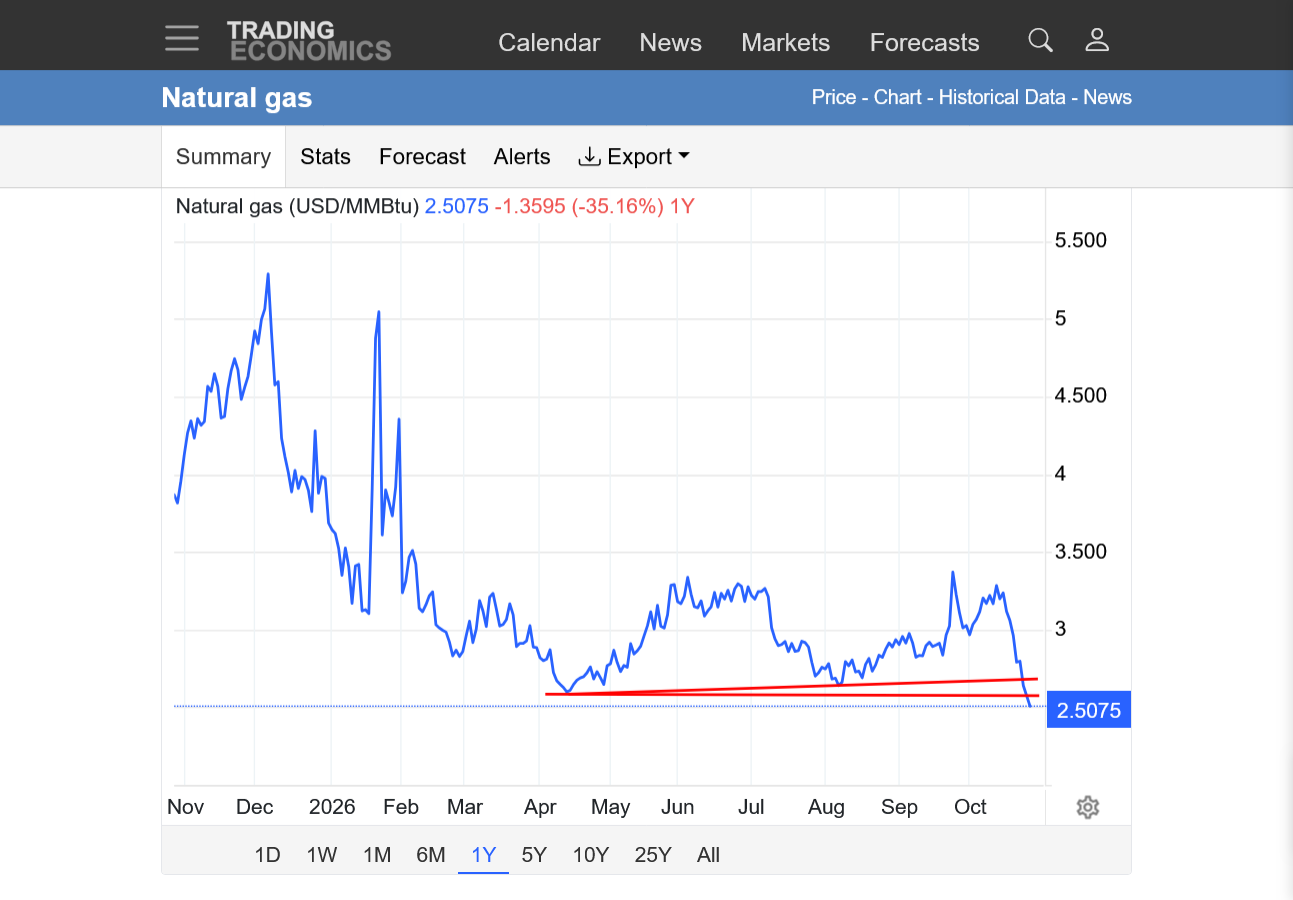
Natural gas gapped lower on the open for the daily, monthly and even made new lows for 2026, breaking below the Spring lows on the continuous chart.
When the soon to expire November contract rolls over to December, this price chart will show a fake gap higher because December is trading almost $5,000/contract higher than the November.
December volume tonight is almost 3,000 contracts in the first 20 minutes, now double the November which expires on Wednesday. This source never shows gaps but my red lines below are the gap price range(Fridays low/Sundays high)
1. 1 week: Gap lower daily and weekly!
2. 1 month: Downside breakaway gap lower monthly
3. 1 year: Gap lower below trendline and BELOW April 2026, Seasonal Spring lows. The typical seasonal Fall top in natural gas is in this time frame but EARLY this year because of the extremely bearish weather forecast and upcoming SUPER El Nino.
https://tradingeconomics.com/commodity/natural-gas
++++++++++++++
These were the temps for the 7 day period for this upcoming EIA on Thursday 9:30 am release time.
Should be a robust injection. Warm Northern Plains(reducing HDDs), chilly from TX to the Northeast and southward.
https://www.cpc.ncep.noaa.gov/products/tanal/temp_analyses.php

If the downside break away gap lower is filled quickly(with some follow thru), then it's a gap and crap, selling exhaustion gap.
With the front month, November expiring in 2 trading sessions, a spike in either direction that has no meaning is possible (other than one side covering their HUGE position before expiration-then we go back to trading the same fundamentals we were before they covered).
We did in fact have a gap and crap when last evening's gap lower was filled. $3 could be a strong area of support for December and we are still really early for natural gas prices to collapse before the heating season.
However, as mentioned before the front month November expires in 2 days and spikes in either direction are fairly typical and meaningless because they are often just big longs or shorts covering their position ahead of expiration.
https://tradingeconomics.com/commodity/natural-gas
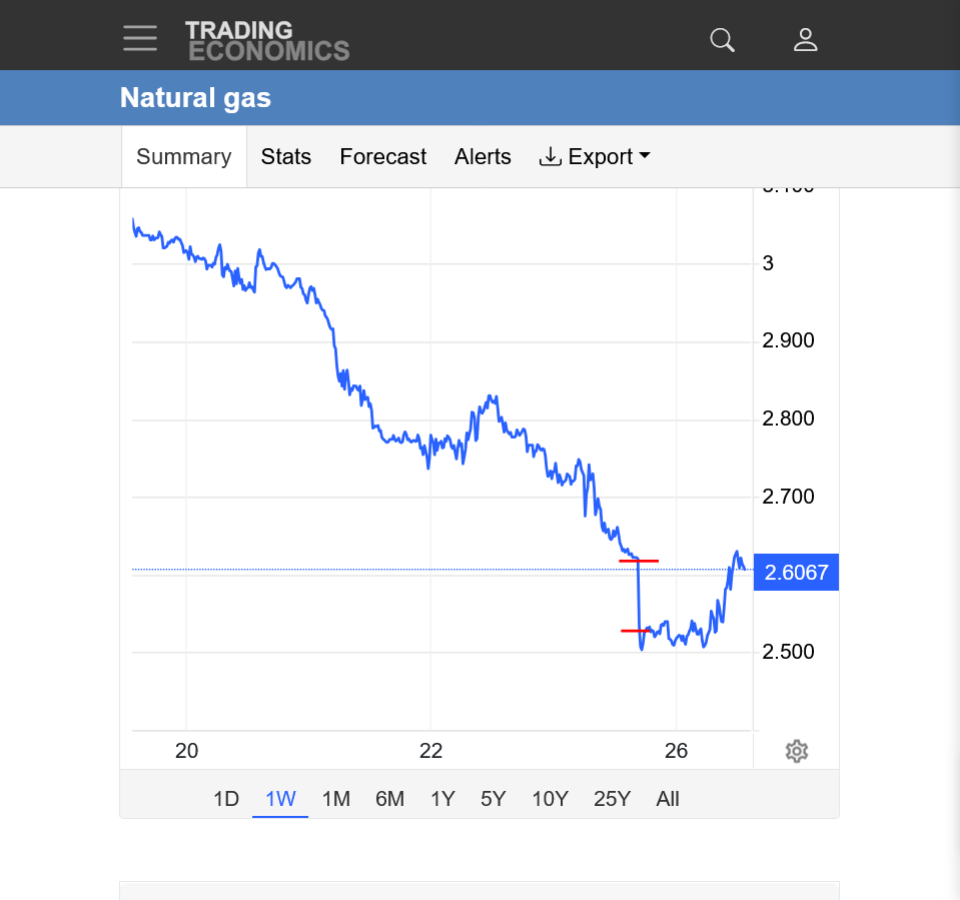
This is November with the gap prices, now filled but with no follow thru. When December takes over on this graph, tomorrow? it will show a massive gap higher of ~$4,000/contract.
1. 1 week: This is November. December NG is trading just above $3 right now and will close ABOVE the open but still slightly lower for the day. Volume for Nov is around 65K and for Dec ~168K. When Dec takes over it will be almost pointless to show a continuous chart because of it being so distorted. The November contract trades during the biggest injections of the year. December catches the first big cold waves when injections turn into drawdowns so the huge increase in demand is reflected in the price being $4,000 higher!
+++++++++++++++++
7pm: 1 month below. The natural gas market may have gotten ahead of itself with the magnitude of the recent drop before Winter has even started.
NG.X26 dropped ~$8,000 in 8 sessions.
NG.Z26 dropped ~$7,000 in 8 sessions and is trading just above $3 right now.
Tomorrow, this will roll over to December and make it look like a gap higher of $4,000. However, December natural gas has had a similar plunge but from a higher level. There is no sign of any strong cold waves in the near future.
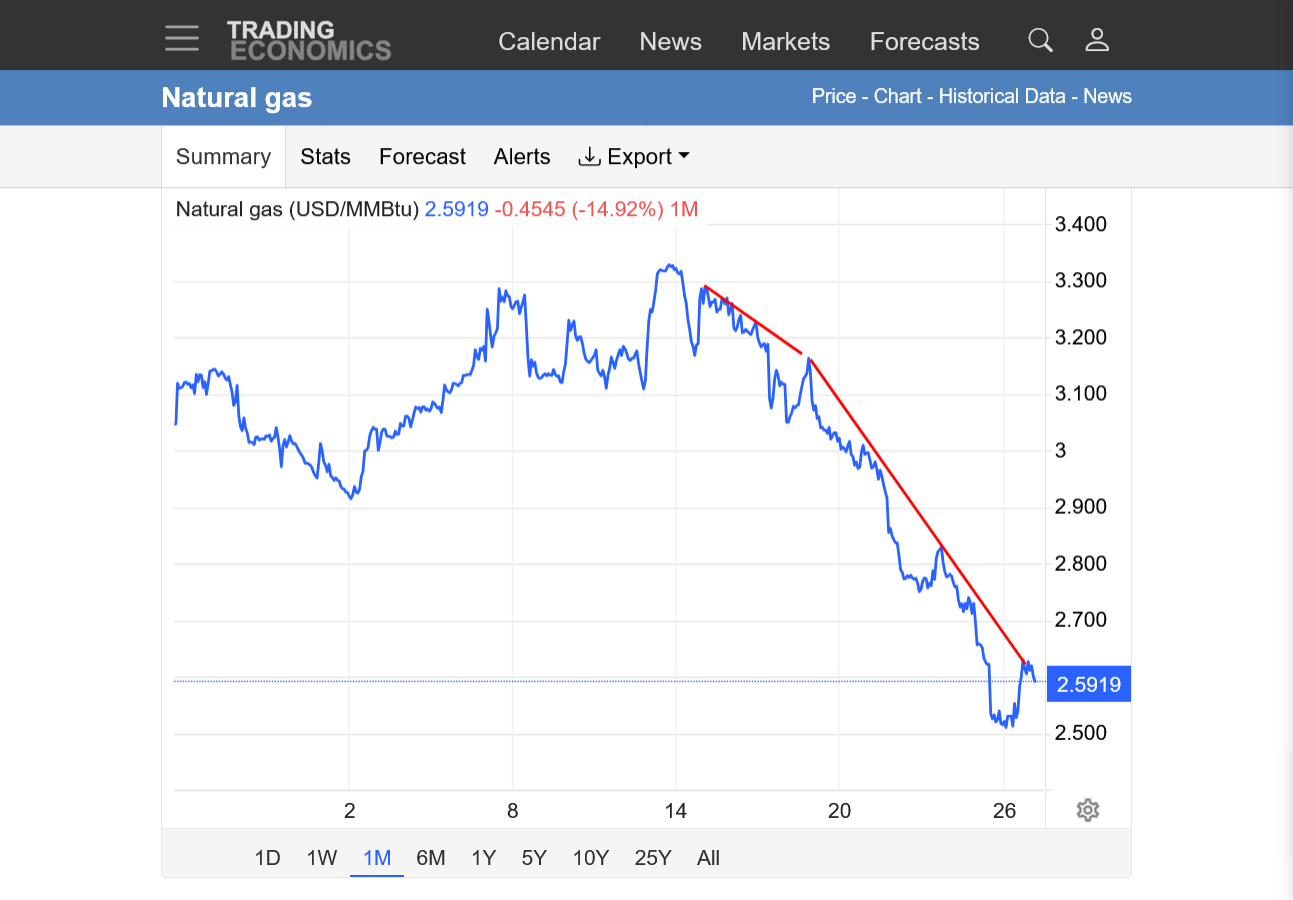
Expiration of the November contract tomorrow is leading to some wild fluctuations down Sunday Night, up on Monday, down Monday Night, up since 6am.
Looks like the small traders overnight are trading bearish weather but the huge traders during the day are covering their shorts.
1. 1 day below
https://tradingeconomics.com/commodity/natural-gas
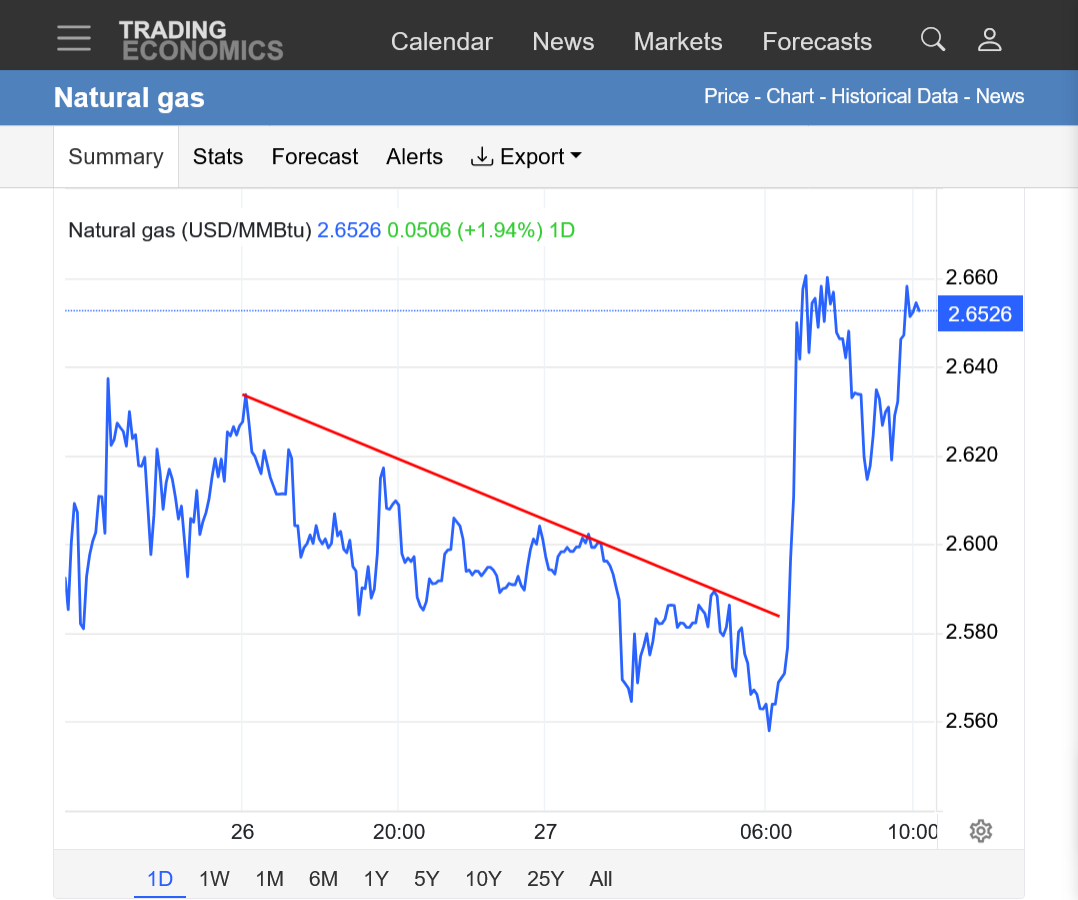
11am: November up $700, with December down a tad. More evidence of shorts covering before the expiration tomorrow.
November natural gas was trading $5,000 BELOW the price of December last week.
It expired today at LESS THAN $2,000 BELOW the price of the December contract which is now the front month.
So the December/November spread closed by a whopping $3,000 in just 1 week. Likely a huge factor was from the long lived November shorts covering because they needed out before expiration. Some of them might have been rolling over to the December contract?
Also, the volume for November was really drying up so buying XXX contracts this week had a much greater impact than buying XXX contracts a month ago, when liquidity was at a maximum.
For instance, if a fund that was short wanted to buy 100 contracts of the November this week, they would have had to go pretty far ABOVE the market price to get filled......taking the price significantly higher.
If they were rolling that short over to December, selling those 100 contracts they could be filled quickly, closer to the market.
Just like if they put the short on back in September(for example) when November liquidity was MUCH greater and getting 100 contracts filled (during the day session) could have been done fairly close to the market price.
++++++++++++
Can you tell when this price quote source below rolled from the November to the December price yesterday(when the differential was $3,000/contract)?
Messes up my graphing here because this free source only uses the front months.
This is greatly flawed because WINTER contracts with their massive heating demand and big drawdowns, will always be much higher priced than Spring and Fall months with low demand (and big injections).
https://tradingeconomics.com/commodity/natural-gas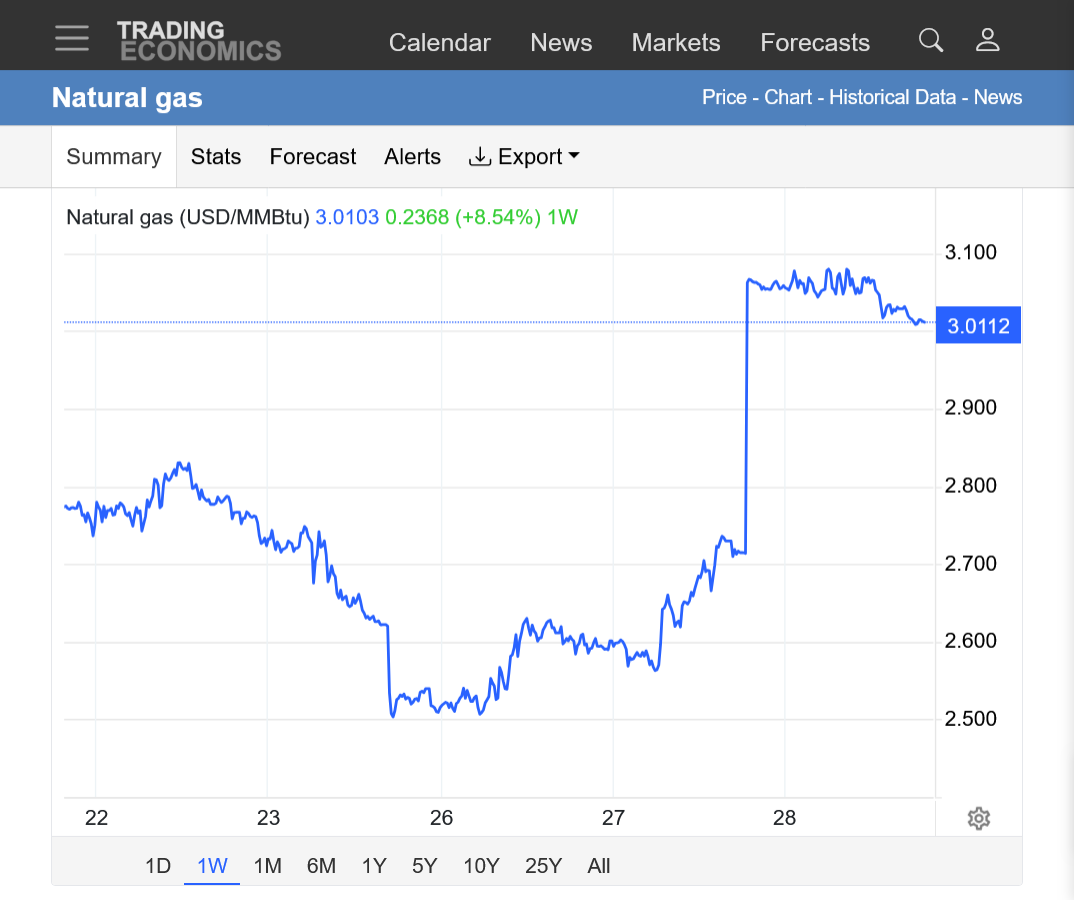
Scroll down for more analysis from November!
As expected, a bearish +80 Bcf injection as we start to increase the amount in storage compared to previous years thanks to the MILD/BEARISH weather coming up.
It's the South Central region that has depleted supplies
for week ending October 23, 2026 | Released: October 29, 2026 at 10:30 a.m. | Next Release: November 5, 2026
| Working gas in underground storage, Lower 48 states Summary text CSV JSN | |||||||||||||||||||||||||
|---|---|---|---|---|---|---|---|---|---|---|---|---|---|---|---|---|---|---|---|---|---|---|---|---|---|
| Historical Comparisons | |||||||||||||||||||||||||
| Stocks billion cubic feet (Bcf) | Year ago (10/23/25) | 5-year average (2021-25) | |||||||||||||||||||||||
| Region | 10/23/26 | 10/16/26 | net change | implied flow | Bcf | % change | Bcf | % change | |||||||||||||||||
| East | 913 | 900 | 13 | 13 | 911 | 0.2 | 892 | 2.4 | |||||||||||||||||
| Midwest | 1,088 | 1,065 | 23 | 23 | 1,081 | 0.6 | 1,068 | 1.9 | |||||||||||||||||
| Mountain | 258 | 257 | 1 | 1 | 285 | -9.5 | 248 | 4.0 | |||||||||||||||||
| Pacific | 297 | 297 | 0 | 0 | 315 | -5.7 | 281 | 5.7 | |||||||||||||||||
| South Central | 1,168 | 1,125 | 43 | 43 | 1,278 | -8.6 | 1,196 | -2.3 | |||||||||||||||||
| Salt | 274 | 251 | 23 | 23 | 334 | -18.0 | 310 | -11.6 | |||||||||||||||||
| Nonsalt | 894 | 875 | 19 | 19 | 945 | -5.4 | 886 | 0.9 | |||||||||||||||||
| Total | 3,724 | 3,644 | 80 | 80 | 3,871 | -3.8 | 3,686 | 1.0 | |||||||||||||||||
| Totals may not equal sum of components because of independent rounding. | |||||||||||||||||||||||||
Working gas in storage was 3,724 Bcf as of Friday, October 23, 2026, according to EIA estimates. This represents a net increase of 80 Bcf from the previous week. Stocks were 147 Bcf less than last year at this time and 38 Bcf above the five-year average of 3,686 Bcf. At 3,724 Bcf, total working gas is within the five-year historical range.
For information on sampling error in this report, see Estimated Measures of Sampling Variability table below.
Note: The shaded area indicates the range between the historical minimum and maximum values for the weekly series from 2021 through 2025. The dashed vertical lines indicate current and year-ago weekly periods.
++++++++
The injection was ABOVE all estimates!
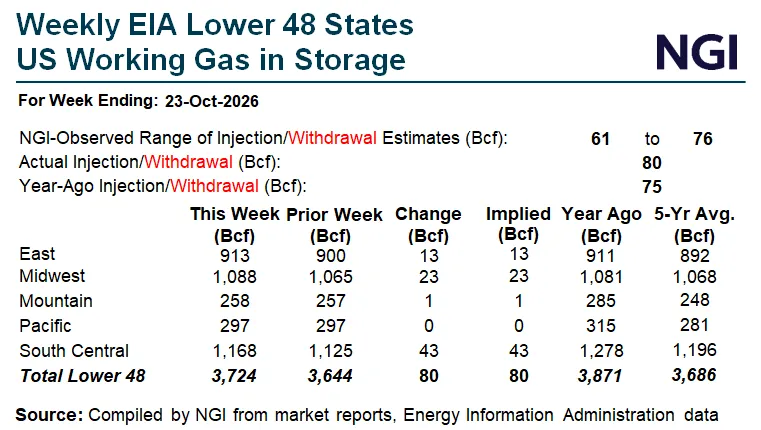
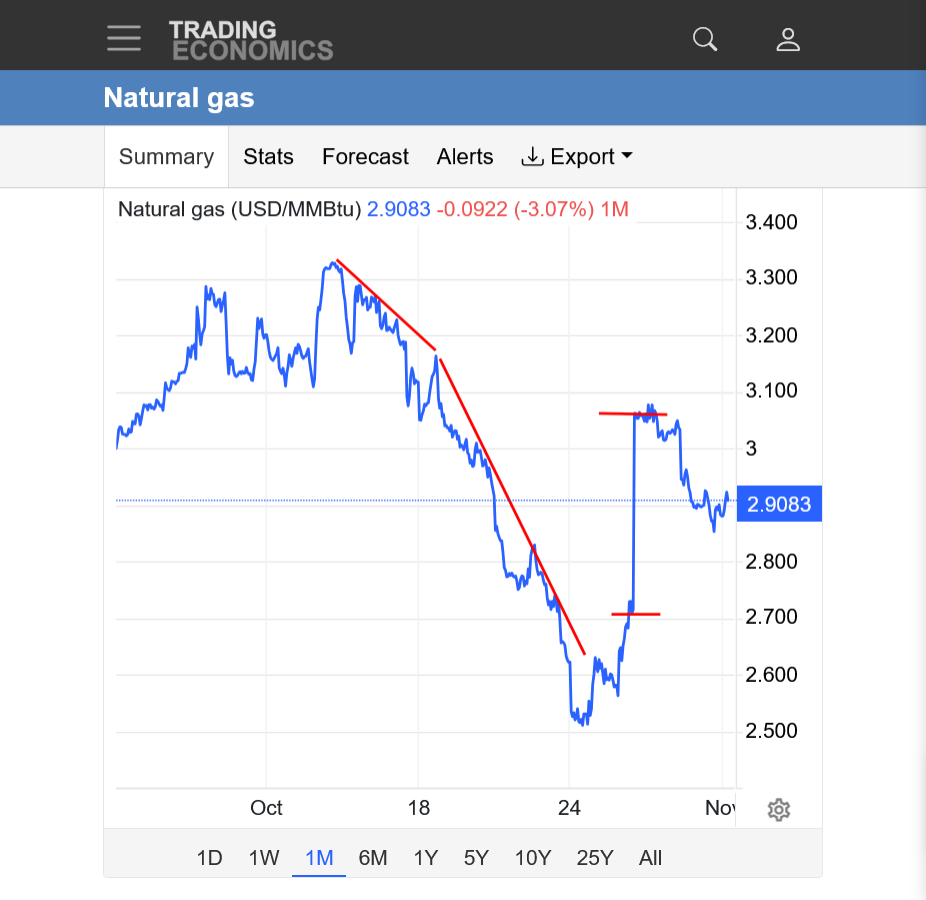
Now for a deceptive looking chart with an explanation.
https://tradingeconomics.com/commodity/natural-gas
1. 1 month below. Most of the recovery took place between the horizontal lines when we rolled from the November to the higher priced December (~+$4,000/contract). This makes the continuous contract month look bullish and it isn't.
The high for the December contract was 3.652 on October 14th, with the contract low set just last Friday at 2.830(a drop of over $8,000 in 2 weeks. It doesn't get much more bearish than that.
The little dead cat bounce that we're having here, now at $2.907, up a tad for this current session is still almost $7.500/contract lower than the price on October 14th, when natural gas topped.
We probably did fall too far too fast before the entire heating season and maybe dialed in ALL the mild air for the next X number of weeks.
So it's not unreasonable to expect the potential of a short covering recovering. However, it's' not supported by the needed weather pattern change to much colder which would REALLY cause a huge rally because its the complete opposite of what the market is trading.
This would be the ideal buying trading set up IF the weather pattern turned sharply colder. Everything is perfect to buy but only if we get the weather pattern change.
Here's a much more detailed discussion(s) about this:
Historic SSW coming early Nov ‘26
By metmike - Oct. 30, 2026, 7:25 p.m.
++++++++++++++++
Re: Historic SSW coming early Nov ‘26
By metmike - Nov. 1, 2026, 8:19 p.m.