Previous thead:
Gas prices/Crude June 12, 2026
52 responses |
Started by metmike - June 12, 2026, 4:55 p.m.
https://www.marketforum.com/forum/topic/120781/
++++++++++++
Last thread there:
Re: Re: Re: Re: Re: Gas prices/Crude June 12, 2026
By metmike - Aug. 2, 2026, 5:57 p.m.
Let's see how close we open to this:
https://hyperdash.com/asset/cl-hyperliquid
%20Perpetual%20Futures%20Live%20Price%20&%20Funding%20Hyperdash.png)
We knew it would be sharply lower but it looks like hyperliquid wasn't quite low enough and once the regular market opens, it follows.
%20Perpetual%20Futures%20Live%20Price%20&%20Funding%20Hyperdash.png)
++++++++
Natural gas traders on hyperlink were fooled and way too bullish(not bearish enough this weekend) !!!!
https://hyperdash.com/asset/NATGAS
%20Price%20Chart%20%26%20Trading%20Hyperdash.png)
"Perimeters of a deal"?!?!
They're not even trying anymore. And still a $5 drop.
Exactly, patrick!
Nobody believes Donald Trump about anything anymore because its much, MUCH more likely for the complete opposite of what he says to be true than for what he says to be true but the market reaction today tells us the market doesn't need a REAL agreement to go lower. News of lack of an agreement or other bullish news is not powerful enough to make the market go higher today.
All the traders buying on bullish news previously are already long(or liquidating) with fresh buying needed to go up more completely absent because the buying was exhausted.
This graph below is updated daily.
1. National gas prices in blue.
2. Indiana gas prices in red. 60c state gas tax taken off in May, coming back now.
3. The price of gas in Evansville, IN. in green.
https://www.gasbuddy.com/charts
https://www.gasbuddy.com/gasprices/indiana/evansville
++++++++++++++++
US president hits out at ExxonMobil and Chevron, saying they should ‘give some of that back to the public’
++++++++++++++++
Trump steals $1,776,000,000 from the Treasury
36 responses |
Started by patrick - May 18, 2026, 4:14 p.m.
https://www.marketforum.com/forum/topic/120295/
++++++++++
$250 bill with Donald Trump on it!
24 responses |
Started by metmike - May 28, 2026, 4:18 p.m.
Lake swimming yesterday & forgot the EIA.
Flat stocks, due to a 500KBPD increase in crude imports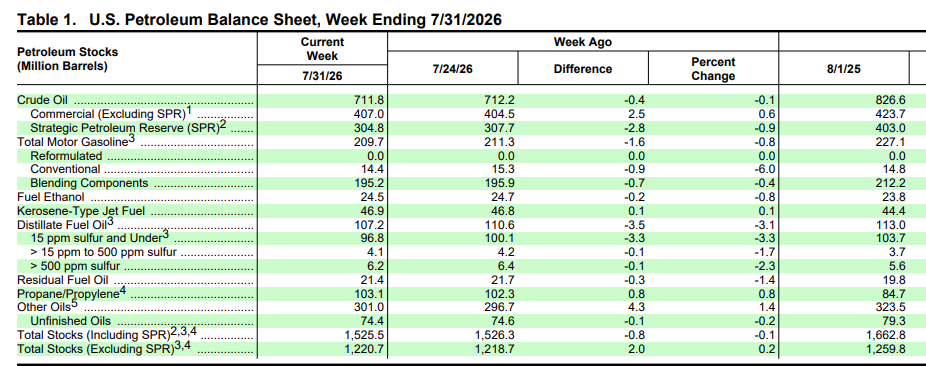
Thanks, patrick!
This time of year, the lake temperature must be up around it's peak and shallow lakes must be like bath water.
In New England? Never! It was perfect for a vigorous (if inept) swim.
Just wait another 200 years with global warming and we'll get there
I grew up in MI (Detroit area) and vacationed on Lake Michigan and Lake Huron the first 2 weeks of July growing up. We just accepted the invigorating nature of a swim in the water.
After moving to Southern IN and having kids, they would squawk in June about our pool water that was 10 degrees warmer than the warmest I ever swam in as a kid and insist that I turn on the heater.
Chicago, summer 1980, between Promontory Point & 57th St beach.
Until a sewage issue from Hammond ended the season in August.
Don't think I'd last 5 minutes in that now.
We have our Scholastic Chess of Indiana team chess championships in Hammond every March. Imagine how cold the water would be to swim in then
Here's a chess post that incorporated a gasoline market element.
Chess Tournament March 21, 2026
Started by metmike - March 20, 2026, 2:45 p.m.
For the past several months, Hoosiers have enjoyed some of the lowest gas prices in the country.
Braun cited Ukrainian strikes on Russian oil refineries, shipping in the Black Sea and wildfires in Alberta, Canada as the grounds of a "new emergency" separate from the Iran conflict that triggered the first gas tax holiday.
++++++++++++++++++++
We'll take it, regardless of the lame reason!
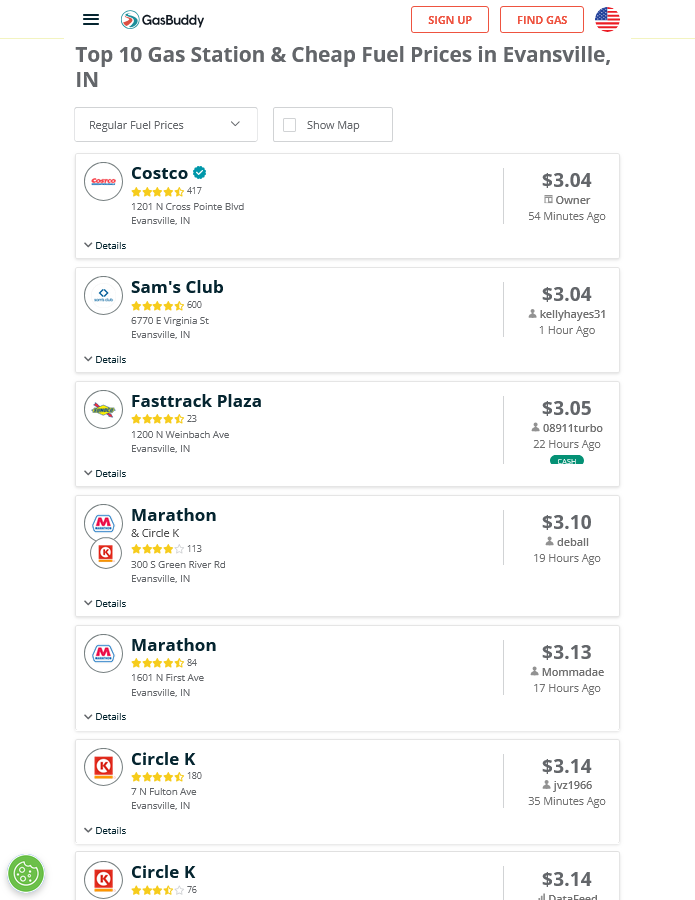
Evansville, IN has the lowest gas prices in the country right now!
This graph below is updated daily.
1. National gas prices in blue.
2. Indiana gas prices in red. 60c state gas tax taken off in May, coming back now.
3. The price of gas in Evansville, IN. in green.
https://www.gasbuddy.com/charts
https://www.gasbuddy.com/gasprices/indiana/evansville
+++++++++++
Some stations are LOSING MONEY by charging less than the cost and less than the cash price to make room for the space to take delivery of the contracted gas they bought previously and avoid the penalty for not taking delivery!
++++++++++++
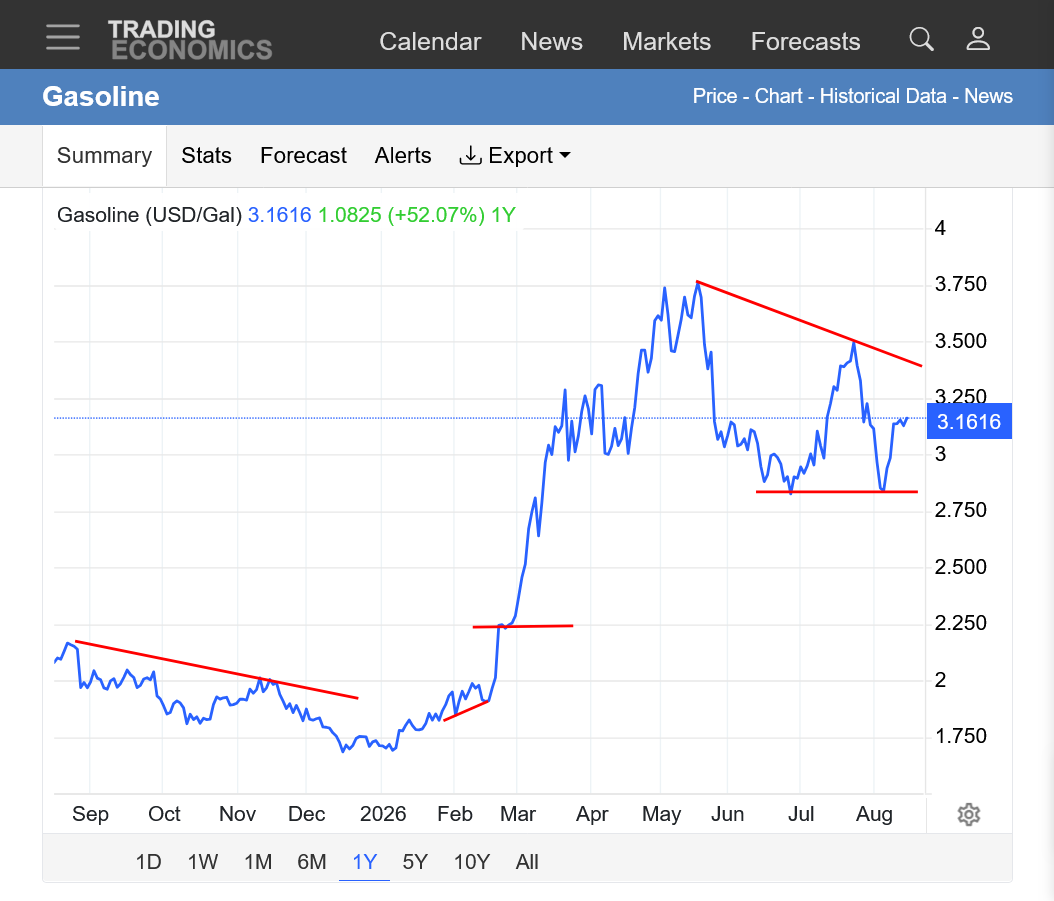
https://tradingeconomics.com/commodity/gasoline
1. 1 year: Downtrend in 2025. Horizontal line was the start of Donald Trump's unjustified war on Iran. Peak in May with a lower high in July. Recent support on the right.
The last price is higher than actual prices in Evansville at many stations.
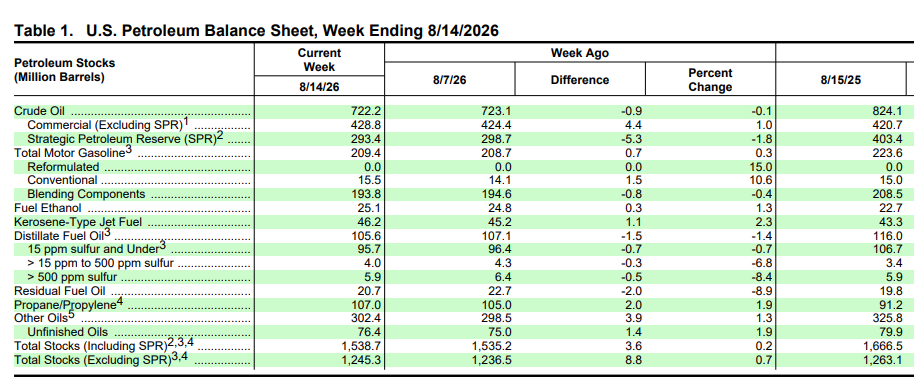
Travel last week. Back to another flat EIA report.
Wondering if this means trouble elsewhere? Check out the IEA report for July.
https://www.iea.org/reports/oil-market-report-august-2026
A small excerpt from a big, useful report, which includes a table for OPEC countries production:
At the same time, our forecast for global oil demand in the second half of 2026 is reduced by roughly 550 kb/d versus last month’s Report, as the continued closure of the Strait of Hormuz disrupts international supply chains and curtails product availability. Elevated fuel prices are putting further downward pressure on oil use. Global oil demand is now expected to decline by an average of 1.6 mb/d this year. Demand is projected to contract by 4.9 mb/d in 2Q26 and 2.8 mb/d in 3Q26, before flipping to growth of 580 kb/d in 4Q26.
Increasingly tight product markets pushed Atlantic Basin refining margins to all-time highs in July as diesel, jet fuel and gasoline cracks surged amid seasonally higher demand, supply shortfalls and depleted stocks. Despite a monthly increase of 1.8 mb/d, global refinery crude throughputs in July remained nearly 5 mb/d below year-earlier levels, with capacity elsewhere in the system currently unable to offset product supply bottlenecks. Seaborne product trade fell in tandem, down 3.8 mb/d y-o-y, even as US exports rose by 700 kb/d. Diesel exports from Russia, the Middle East and Asia were 1.3 mb/d lower y-o-y, equivalent to about 20% of global seaborne trade. Jet fuel exports from these regions fell by around 670 kb/d y-o-y, equal to 34% of global trade.
The global oil balance is now expected to show a deficit of 1.8 mb/d in 3Q26, more than double the estimate of around 800 kb/d in last month’s Report. After some brief respite in June, global observed oil inventories plunged by 69 mb, or 2.2 mb/d, in July, dragged lower almost entirely by a drop in oil on water. By the end of July, observed stocks had fallen below 7.9 billion barrels for the first time since April 2025. Cumulative stock draws between the end of February and the end of July reached 410 mb, or 2.7 mb/d on average. Although the market is projected to return to surplus towards the end of this year, risks remain substantial and the urgency of reopening the Strait has increased, as previously available inventory buffers are rapidly depleting.
Excellent post, patrick especially the synopsis!
The Strategic Petroleum Reserve continues to be depleted. Now down to the levels of the April 1983, shortly after it was created. The blue dot on the far left shows that level/time.
https://www.eia.gov/dnav/pet/hist/LeafHandler.ashx?n=PET&s=WCSSTUS1&f=W.png)
AI Overview
+++++++++++++++++++
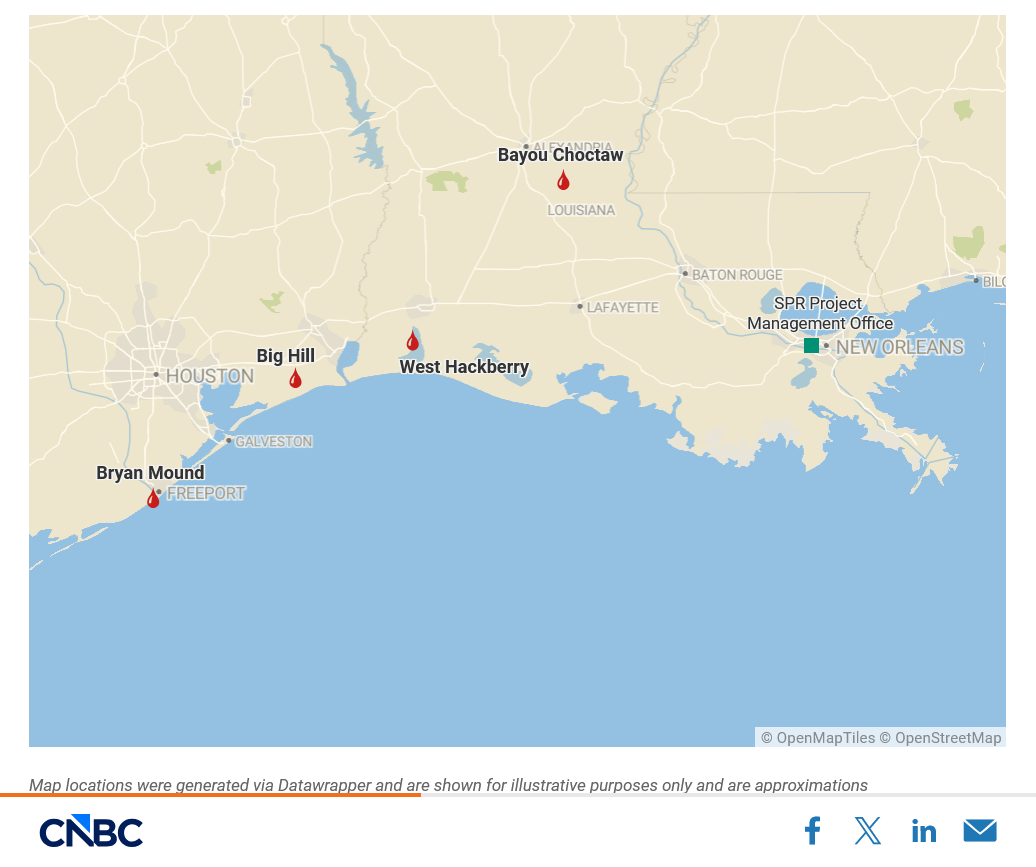
https://www.cnbc.com/2026/08/15/strategic-petroleum-reserve-spr-oil-iran-war-caverns.html
Last swim of the summer yesterday & missed the EIA report.
Anybody have news of the tanker fleet taking the Northern Passage to China?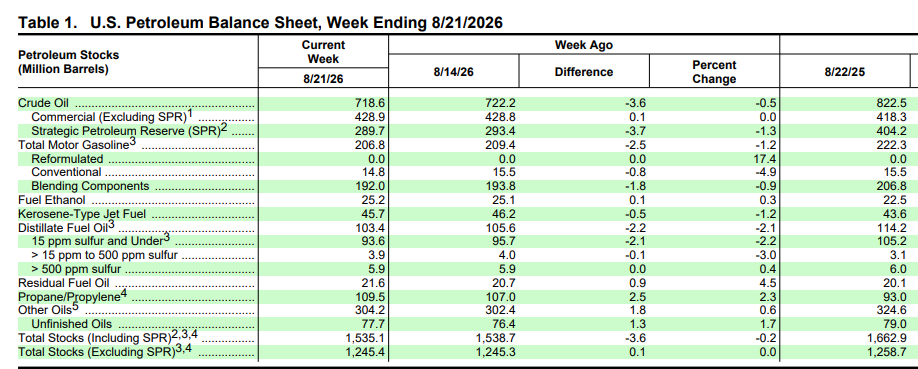
Thanks, patrick. Swimming season coming to an end but not the big heat here in Southern IN.
8-28-26 Late Summer heat wave
Started by metmike - Aug. 28, 2026, 8:45 a.m.
https://www.marketforum.com/forum/topic/122444/
++++++++++++
Somebody forgot to tell the oil market about Donald Trump's MEGA bearish oil supply news as we gapped HIGHER not lower on the open tonight.
Re: Re: Re: Re: Donald Trump wants me to join MAGA!
By metmike - Aug. 30, 2026, 6:43 p.m.
Today's message from Donald Trump to my mailbox:
The White House<communications@mail.whitehouse.gov>
Biggest Oil Deal in World History + America Controls the Strait of Hormuz + Lake Ontario Is Now Lake America
+++++++++
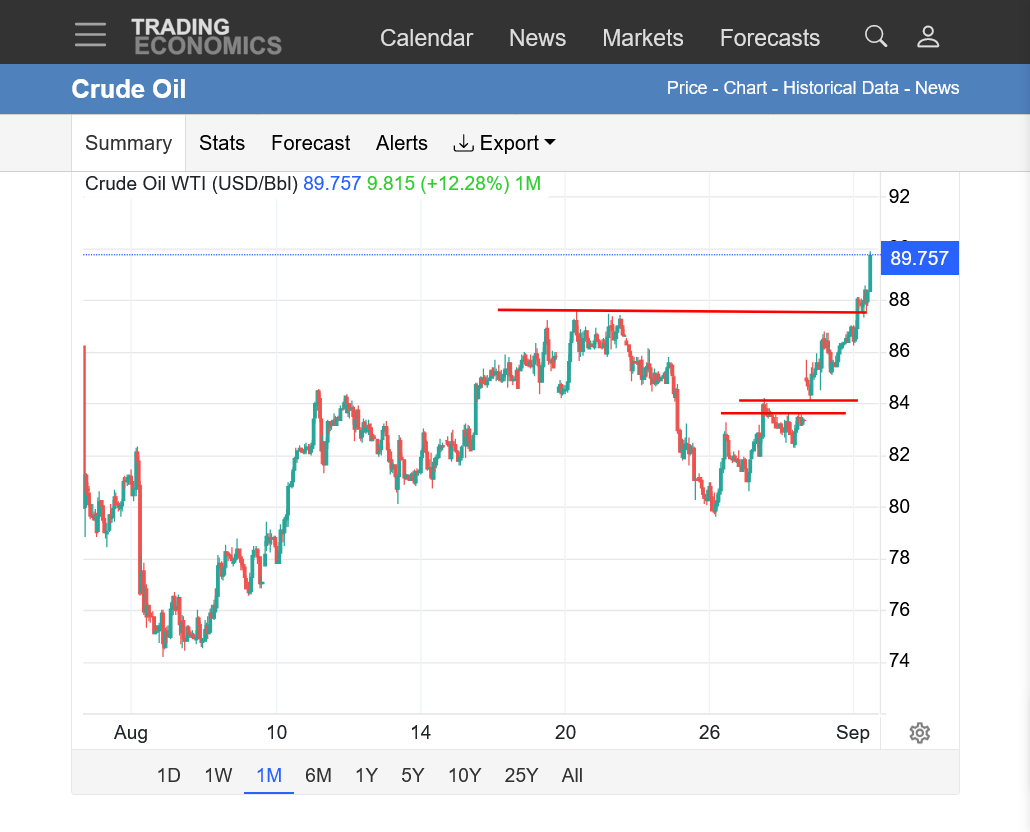
https://tradingeconomics.com/commodity/crude-oil
1. 1 week: Upside gap higher tonight from an ascending wedge/triangle(higher lows).
2. 1 month: Upside break out above resistance/previously broken support and out of an ascending triangle.
3. 1 year: Gap higher from the start of the Iran at the end of Feb. Quick spike up, then lower and lower highs as the market anticipated the war to end and Strait of Hormuz to open. WRONG! Gap filled barely to start July but then serving as rock solid support and more buying as it became more clear that Donald Trump has no clue how to get out of the war and restore lost crude supplies. Symmetrical triangle with lower highs and higher lows and the market, right now testing the downtrend line from lower highs.
4. 10 years: That spike lower in 2020 from COVID was REAL! 2022 spike higher from Joe Biden's Ukraine war. Steep downtrend in 2024/25, mostly from Joe Biden's energy policies (encouraging record production, despite his words) then Donald Trump's unjustified war with Iran to serve Israel because Netanyahu understands his diseased brain and convinced him this would result in Donald Trump being an historical Middle East legend.
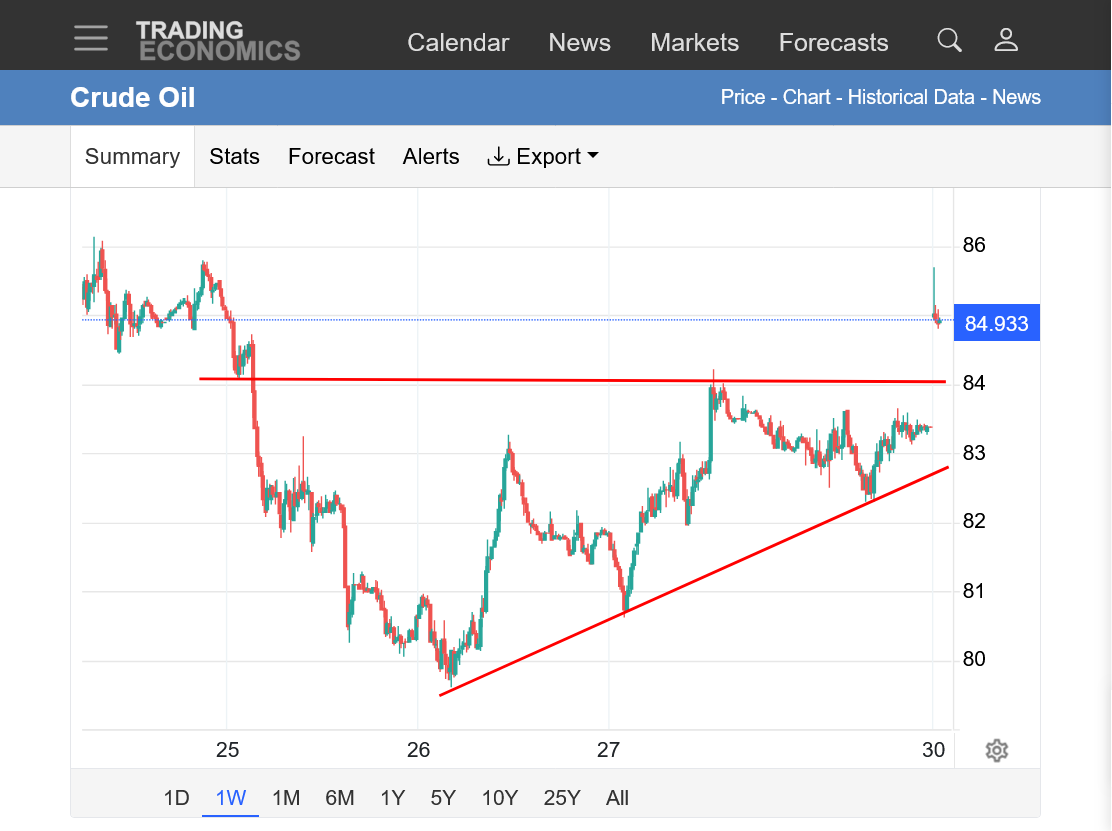
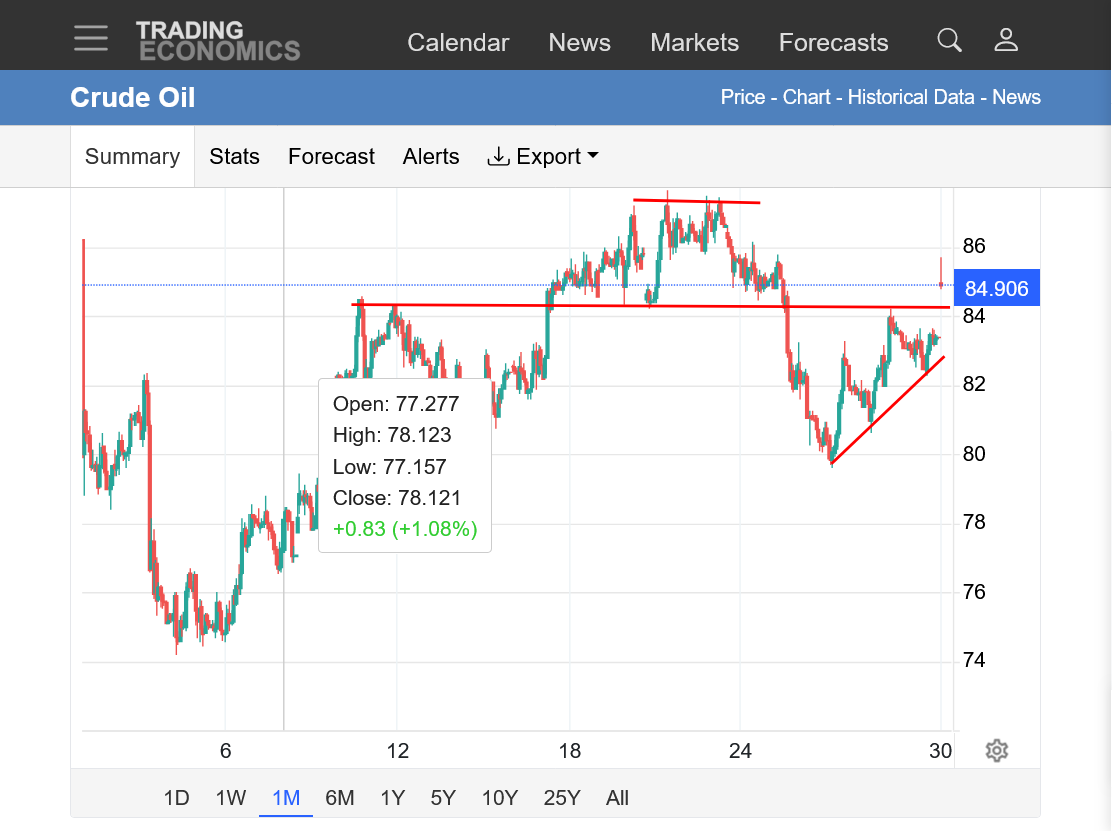
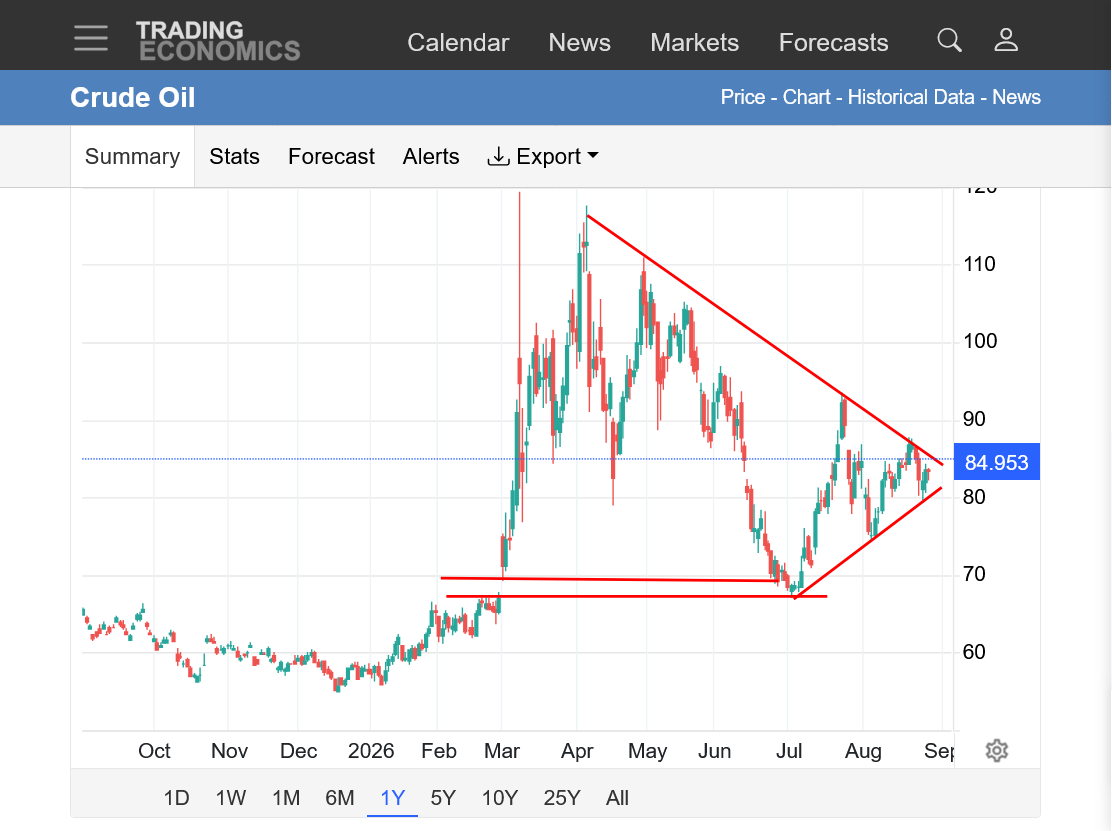
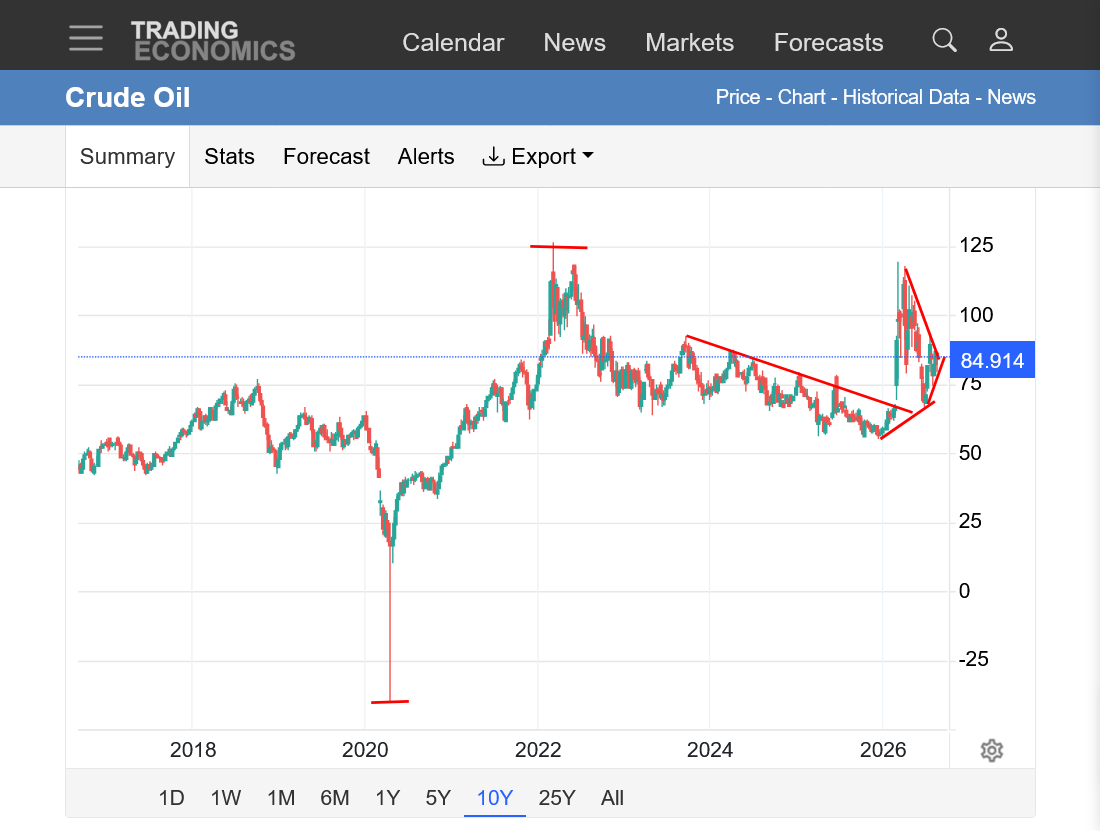
| Where do we go from here? The lines on the charts above are reacting to THE NEWS. So THE NEWS will determine the next move. With us at the apex of the symmetrical triangle on the 1 year chart above, it could break either way..........then go in the other direction if the news changes again. This is not a weather market and I have not and will never trade crude oil but the analysis is a load of fun and we have readers here that actually DO trade crude and appreciate the analysis. 7:40pm- No follow thru on the gap higher so it could end up being a small gap and crap buying exhaustion. Just depends on news that I DON'T KNOW! +++++++++++++ 2pm: We had a couple of wimpy, failed attempts to fill the decent sized gap higher open last night then lots of follow thru for this now, well defined, bullish upside break away gap. cutworm, the well respected market follower/trader might call it a measuring gap and have a good upside projection. The chart below is just the past day, going back to Friday afternoon. https://tradingeconomics.com/commodity/crude-oil 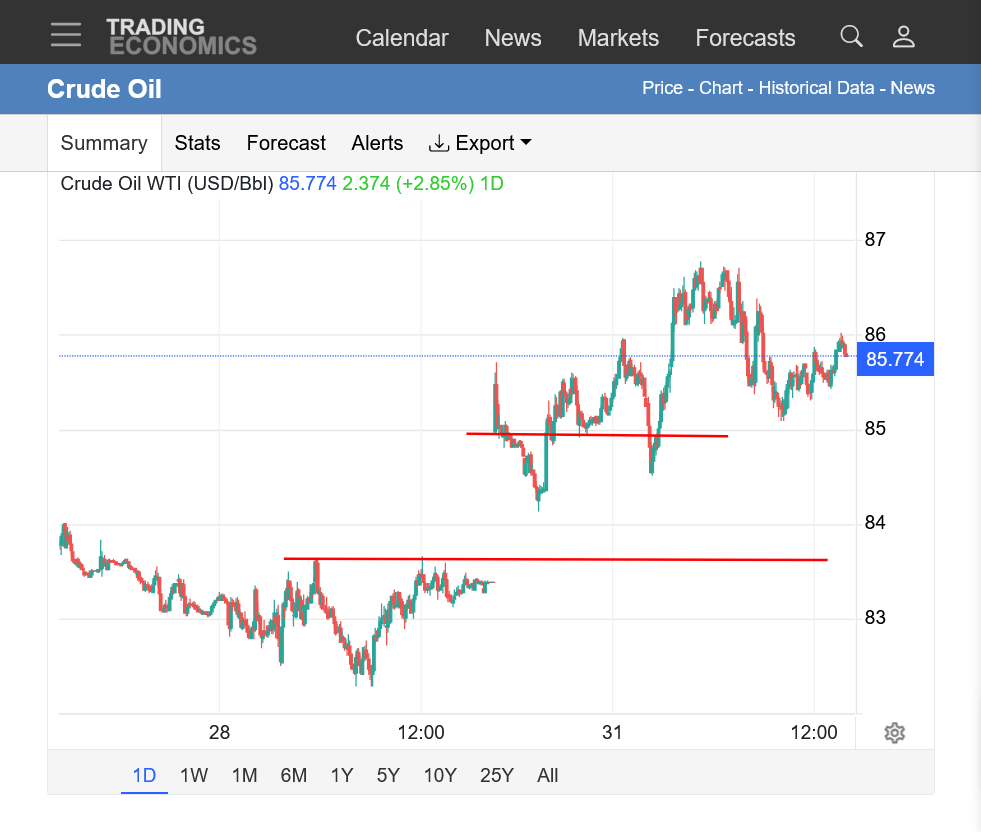 |
Crude/NG traders need to check the new TD #5 thread since it is in the far NW GOM:
Thanks a ton, Larry!
Crude continues with more follow thru to solidly confirm the chart patterns shown previously with the upside break out after the bullish, break away gap higher on Sunday Night. This is just the last month, below.
WTI is within $1.28 of Brent. Seems odd to me that now of all times they're converging.
Nov/nov and dec/dec appear correct No way to compare oct wti versus no brent for oct
Thanks! Yes, it makes more sense if you look at the rather optimistic timelines.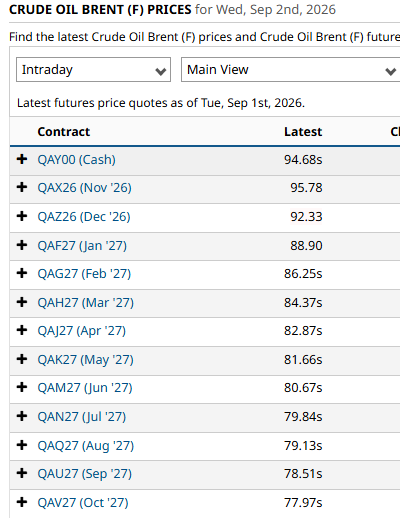
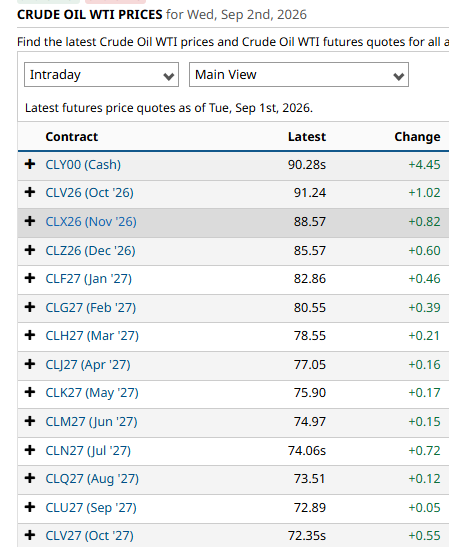
Great contributions!
https://www.theguardian.com/us-news/2026/aug/17/gas-prices-august-record-iran-war
Larry/MetMike
Gentlemen, based upon your years of NatGas trading, what is the likelihood of a breakaway weekly gap in NatGas?
I am familiar and have experienced grain trading examples AND MetMike certainly has also, just curious as to NatGas.
Thanks for the question, tjc!
There's not much more I can add on natural gas that is not being stated daily in the natural gas thread.
Weather and seasonals are BULLISH right here but the weather can't get much more bullish than it has been for the market for the past 2 weeks.
Natural Gas July 23, 2026
38 responses |
Started by metmike - July 23, 2026, 9:53 a.m.
I forgot to post the EIA again this week. Crude stocks were down 7.5.
The news, in case anyone missed it, is that the shipping war in the Persian Gulf is heating up. According to the radio, 3 Iranian tankers were destroyed. Nothing about oil spills or other damage.
Some joint reporting that leaves out a lot of unverified claims, but seems rather bullish for when the oil market opens:
US Central Command (CENTCOM) said its forces struck three Iranian vessels, including a tanker off Kharg Island, the hub through which Iran exported 90 percent of its crude before the war.
Another tanker was struck near Jask, and an unladen vessel was hit in the Gulf of Oman after its crew was told to abandon ship.
CENTCOM said the attacks followed Iranian ballistic missile launches against a US aircraft carrier and navy destroyer, which it said successfully evaded the strikes. No US personnel were injured.
https://www.aljazeera.com/news/2026/9/6/us-iran-engaged-in-tanker-war-where-is-the-months-long-conflict-headed
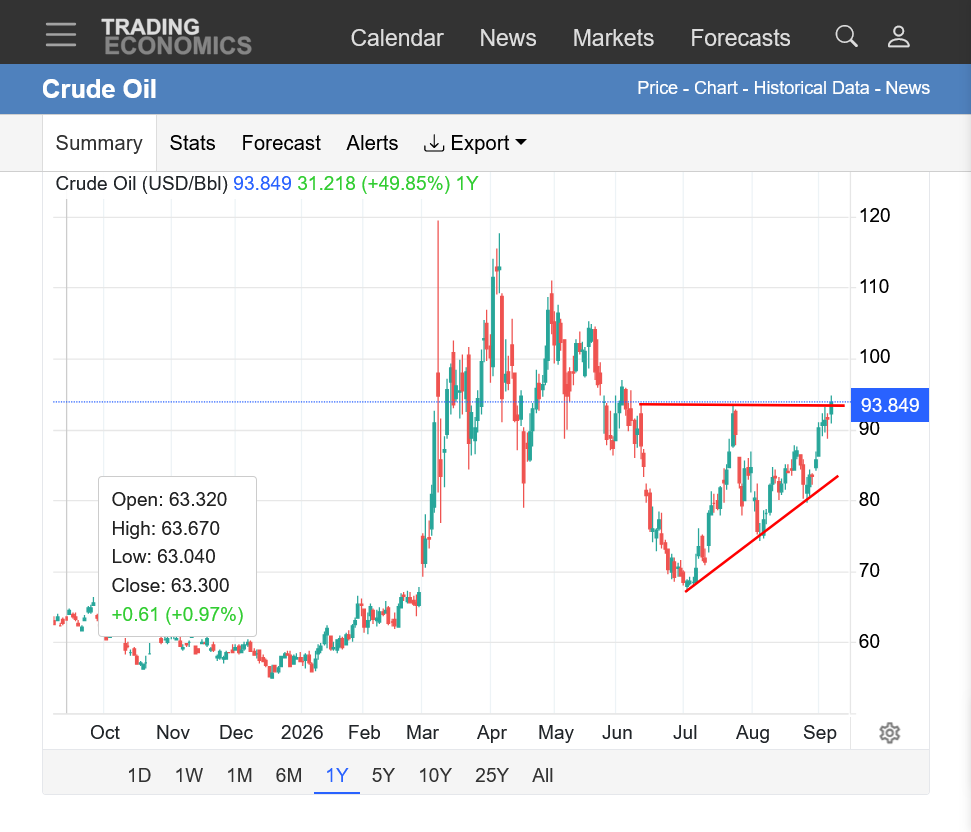
The current front month, October crude is setting life of contract highs right now. The charts below are continuous of front months that roll over every month.
So the spike earlier to highs on the graph below was from Spring front month prices.
NEWS continues to drive the price of crude!
https://tradingeconomics.com/commodity/crude-oil
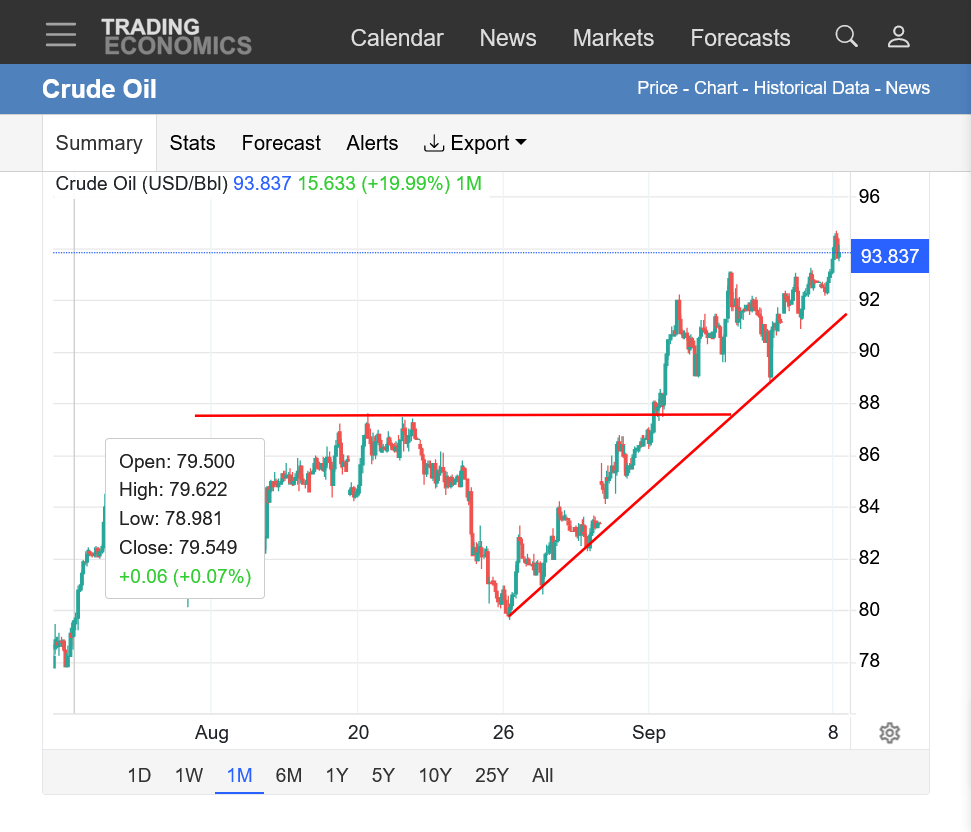
1. 1 year: Breaking out to the upside from an ascending wedge/triangle. Still below the Spring highs but this is the highest price ever for October 2026 crude oil(which was lower than this when May crude oil was the front month spiking much higher on the chart below and the market thought the war would be long over in September, with LOWER crude prices.
2. 1 month: Sharp uptrend
+++++++++++++
Crude seasonals appear to be neutral here with a strong negative that kicks in at the end of October. However, NEWS is what's driving this market!

++++++++
Unleaded gas frequently peaks mid/late October with the same negative seasonal as crude in November but again, NEWS matters the most.
https://charts.equityclock.com/united-states-gasoline-fund-lp-seasonal-chart

https://tradingeconomics.com/commodity/crude-oil
Upside break out continues but NEWS can change everything.
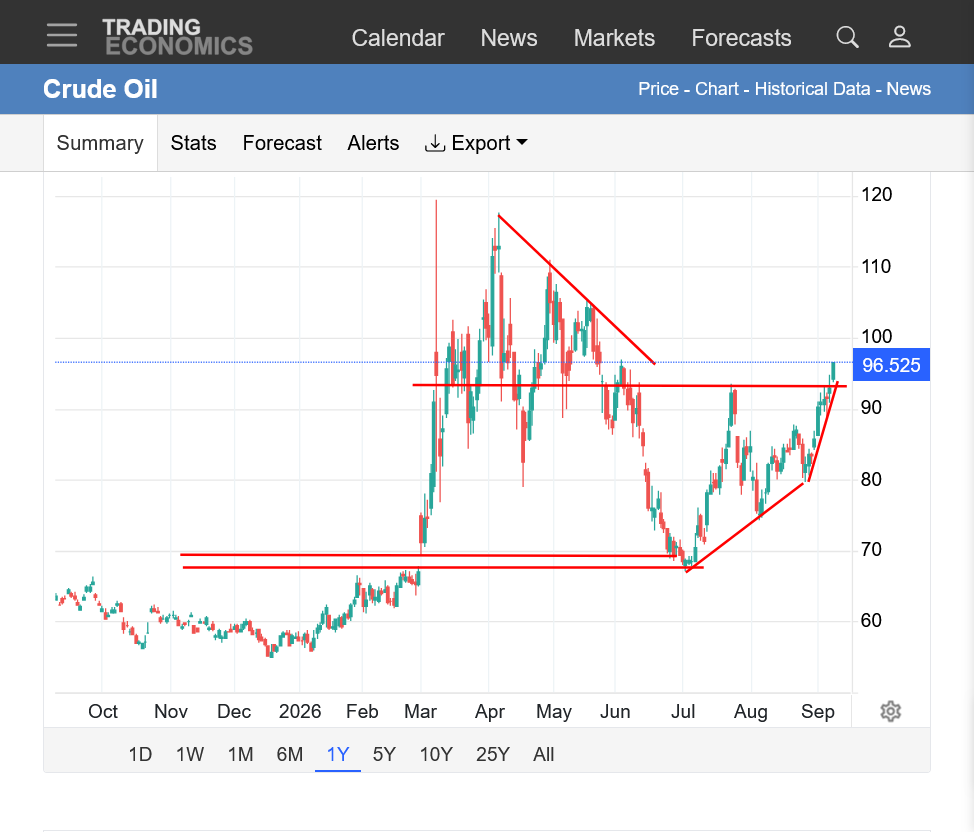
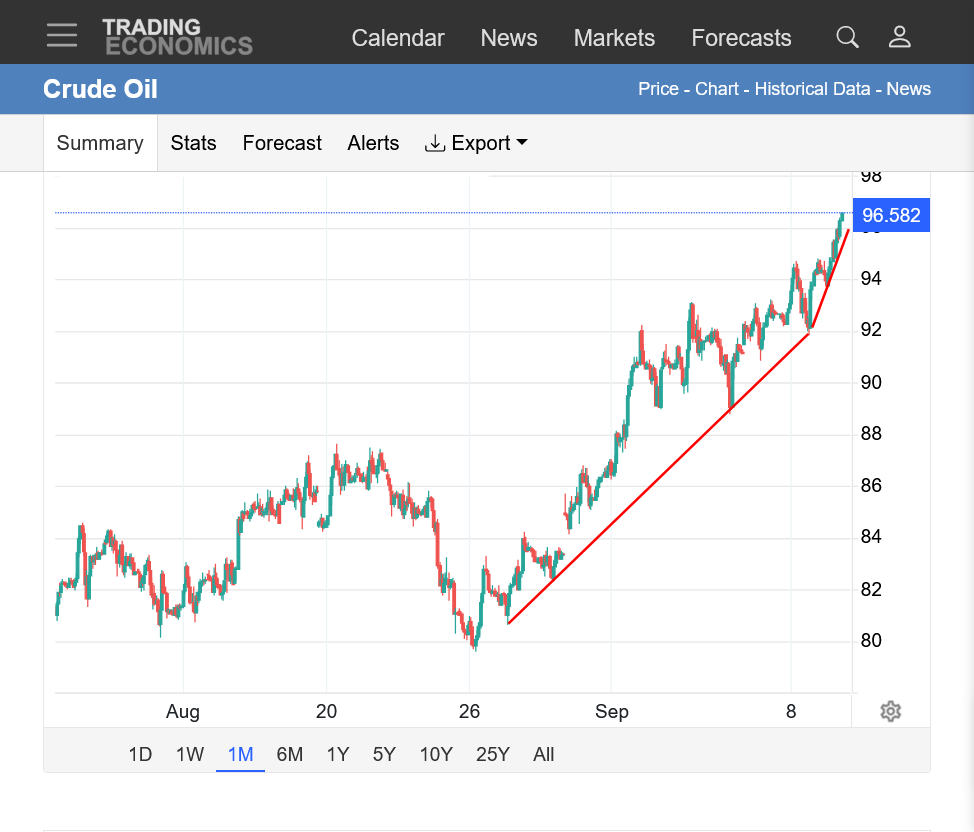
1. 1 year: Upside break out from ascending wedge. New life of contract highs for October 2026 crude. We just barely filled the gap higher from the open after the war in Iran(when the market thought the war would be ending soon) and that was rock solid support when the NEWS turned bullish again.
2. 1 month: Powerful uptrend/move up. Now accelerating.
Per Investing.com’s history of daily prices:
The high today for the most active crude month (Oct?) is in the high $96s. The last day that the most active month traded this high was way back on June 3rd!
Thanks, larry but that link won't work for me. I wish I could show just the October, front month which is at life of contract highs. Back in June, when we last traded at this price on the CONTINUOUS chart, the market expected the war to be over in September/October and so there was a tremendous amount of premium in the front months.
That extremely abnormal backwardation has returned.
The front month, October is trading $25 higher than the January 2027 contract!
https://www.investopedia.com/terms/b/backwardation.asp
:max_bytes(150000):strip_icc()/backwardation.asp-final-66a475f384d04ac296eabc200556b64b.jpg)
++++++++++
AI Overview
A futures market is in backwardation when near-term (front-month) prices are higher than prices for later-dated delivery. [1]What High Front-Month Backwardation Means
https://www.gasbuddy.com/charts
I filled up at $3.07 at Sams on Monday in Evansville, IN. Look at our prices here
https://www.gasbuddy.com/gasprices/indiana/evansville
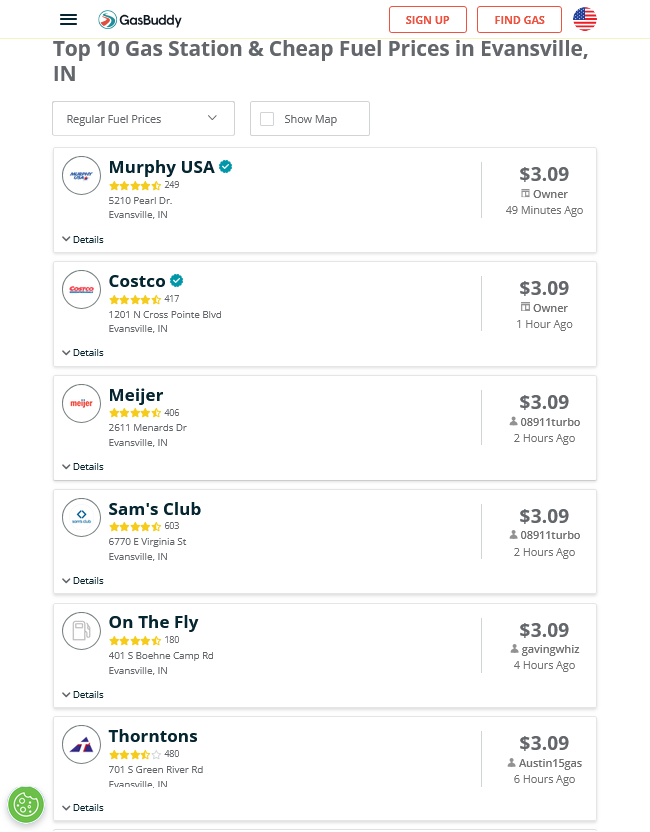
But look at the futures prices, HIGHER than the price in Evansville! They are LOSING money by selling gas less than the cost for regional distributors to buy it!!!!!!
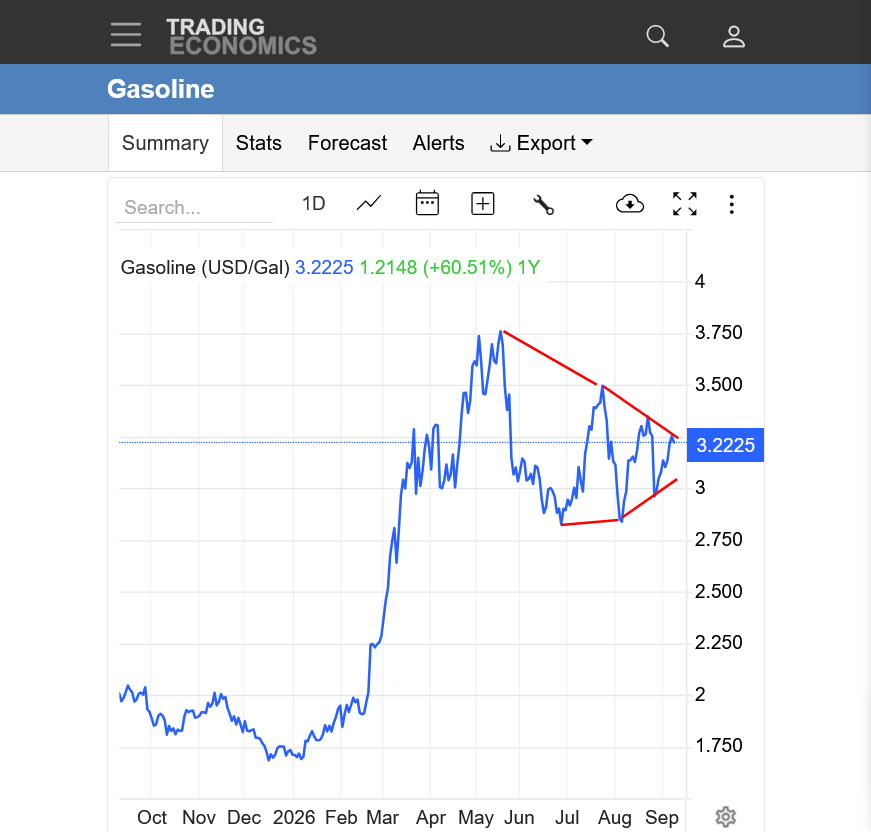
https://tradingeconomics.com/commodity/gasoline
1. 1 year below. Coiling pattern. Symmetrical wedge(lower highs and higher lows with potential upside break out.
Indiana has taken away the 60c state tax on gas but still, some stations are charging less than the cost to replace it and less than the cash price to make room for the space to take delivery of the contracted gas they bought previously and avoid the penalty for not taking delivery!
For this to happen, demand must very VERY LOW!
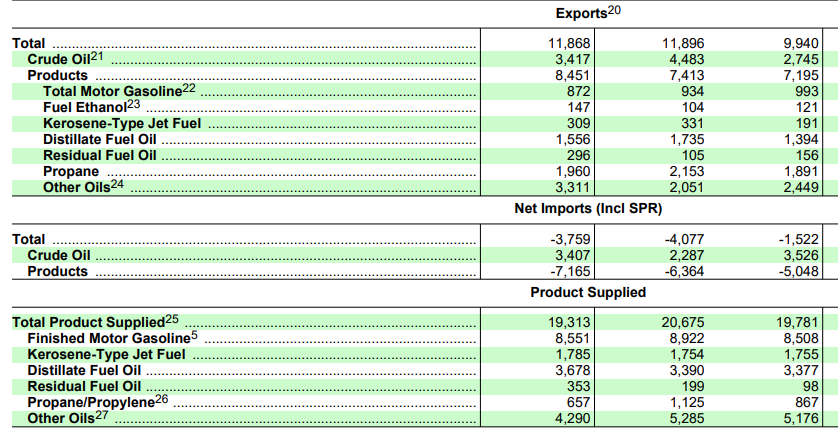
Labor Day delayed EIA report is flat on low consumption.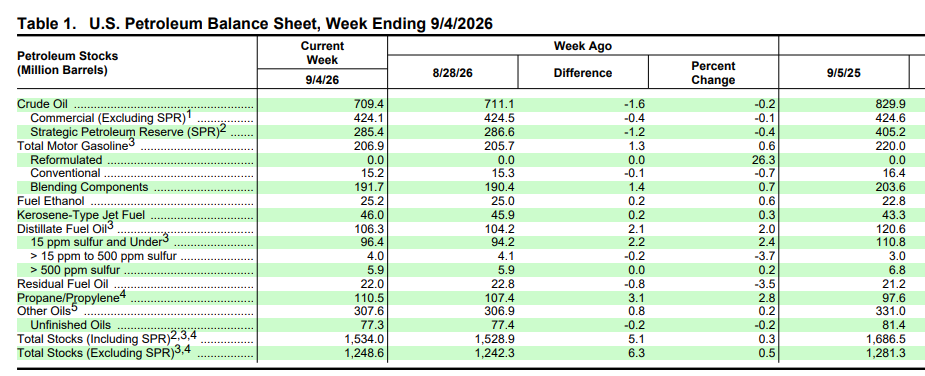
Crude--108 Can be touch a line in the Sand my 2cents
Crude, which peaked way up at >$102 yesterday, is down $3.70 right now.
The Bab-al-Mandab* Strait is at the SE end of the Red Sea. The Yemen coast next to it, and Mayyun Island, which is about 10 miles from Djibouti, have been taken over by the Houthis. This could cut off shipping between Europe and Asia, as well as Saudi exports in that direction. It seems rather important, but is barely getting covered.
https://www.aljazeera.com/news/liveblog/2026/9/13/iran-war-live-saudi-arabia-and-houthis-trade-strikes-over-bab-al-mandeb
*The spelling of these places in English varies a lot.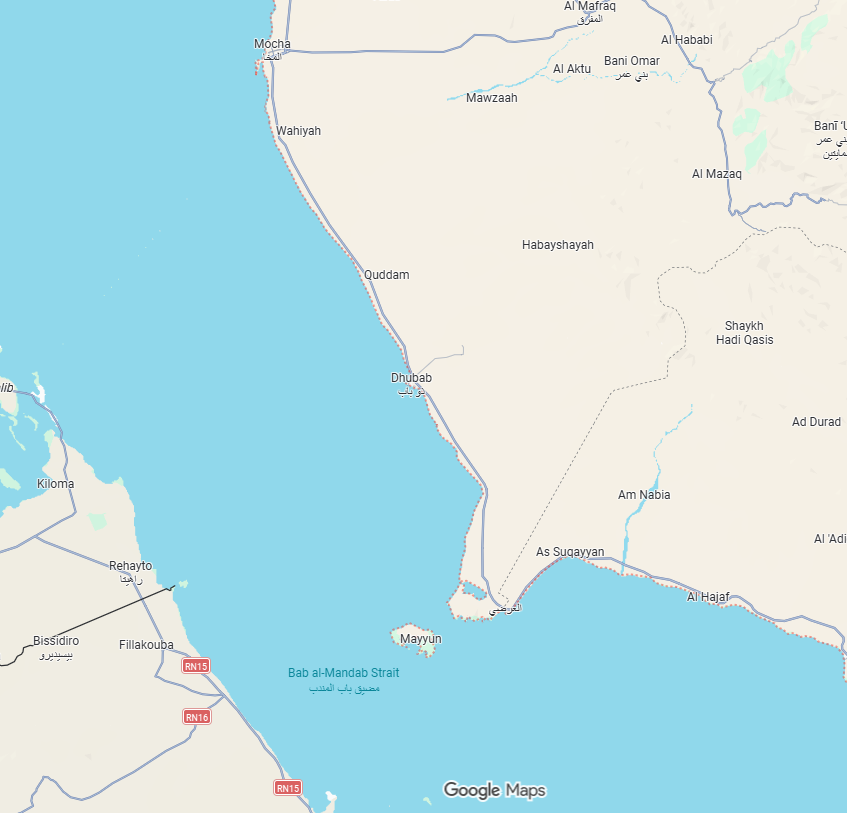
Thanks, patrick!
Higher open tonight!
Lower stocks!
The time stamps here are in EDT.
5:30pm CDT Crude UP $3! Stock market lower.
++++++++++++++===
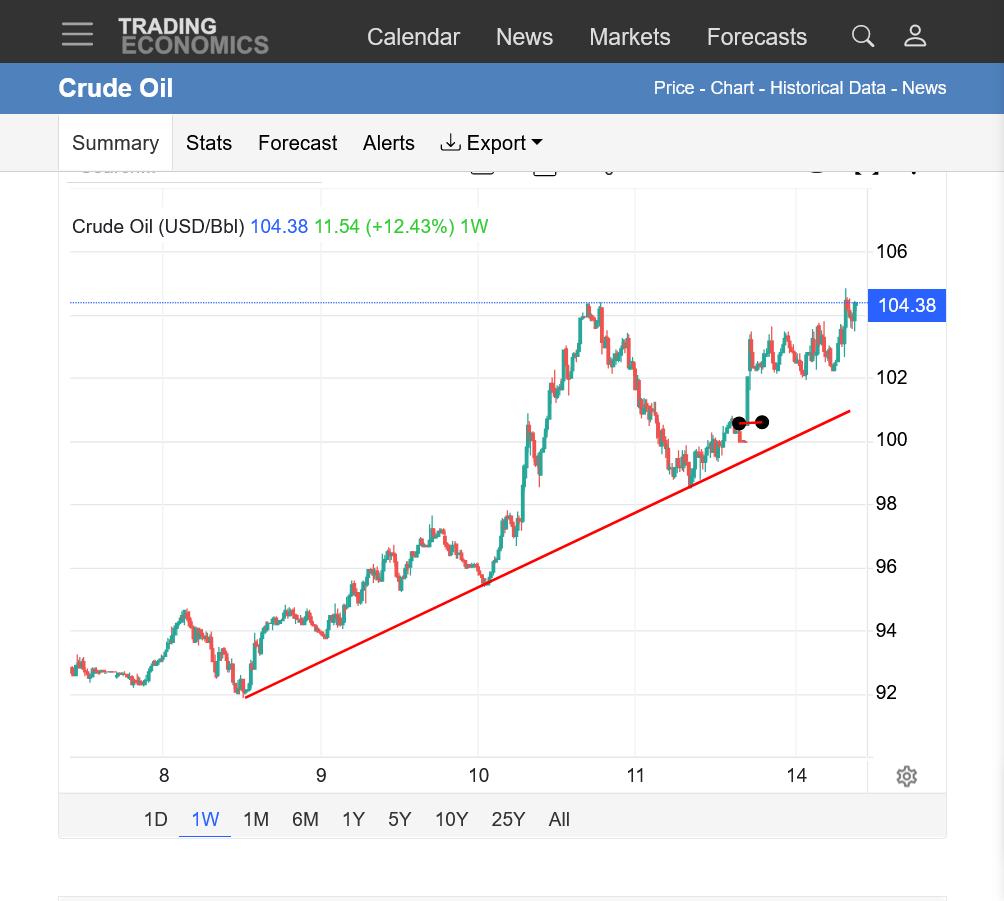
https://tradingeconomics.com/commodity/crude-oil
1. 1 week below. Strong uptrend that was tested on Friday-higher lows +higher highs. Open/low with black circles, followed by strong buying IMMEDIATELY! Close to the highs of the session and highs for the move.
NEWS continues to be a major driver! Although that bullish news is telling us about the short term bullish fundamentals.
105 ish still room 108 and spike high 110 thn down it goes any close above 110 on daily basis Bull ___ dominance lower side 97.30 strong support
Barchart has a pretty good survey of the wreckage -
https://www.barchart.com/story/news/4592280/crude-prices-surge-as-saudi-arabia-closes-its-east-west-pipeline
One nit to pick is that when they say:
Last Thursday's EIA report showed that (1) US crude oil inventories as of September 4 were +0.1% above the seasonal 5-year average, (2) gasoline inventories were -5.5% below the seasonal 5-year average, and (3) distillate inventories were -14.0% below the 5-year seasonal average. US crude oil production in the week ending September 4 rose +0.6% w/w to a record 13.947 million bpd.
That's only commercial crude. At 285.4 the SPR is about 100 million barrels below average, 120 below last September.
Thanks, patrick!
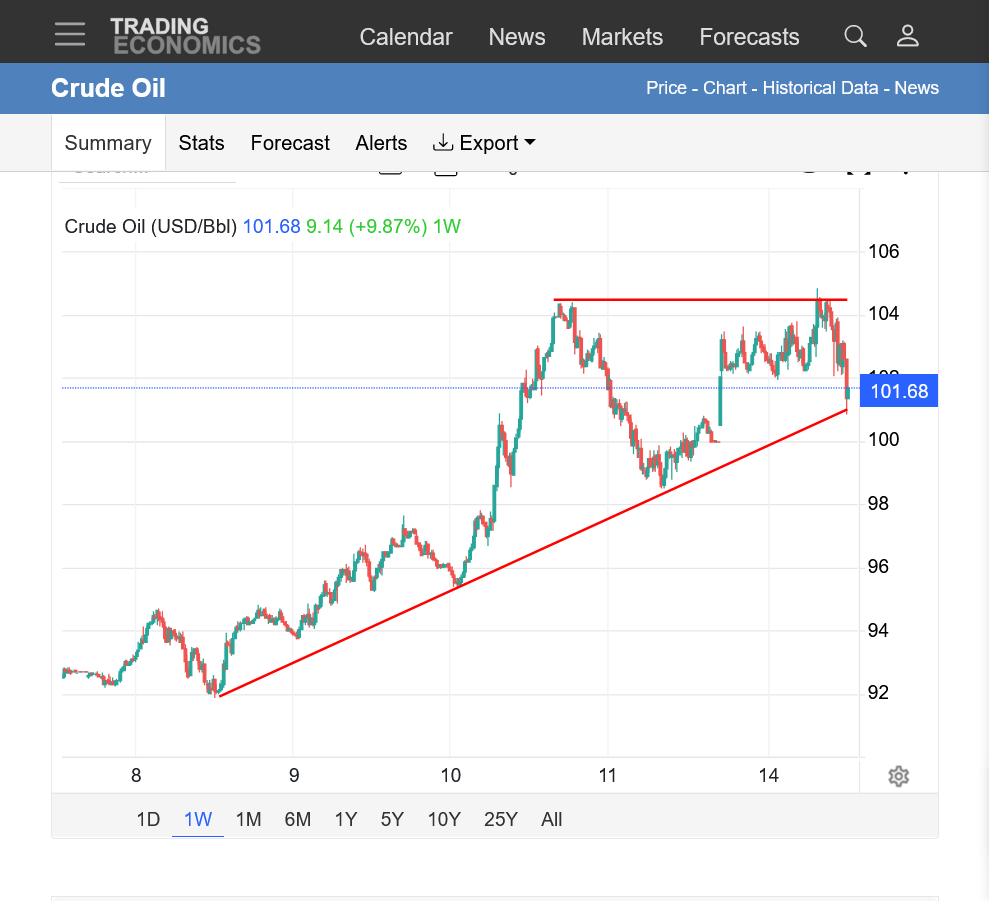
Crude could have just experienced a double top!
https://tradingeconomics.com/commodity/crude-oil
++++++++++
Regarding SPR crude oil, storage is now down to the lowest since May, 1983, just shortly after we established the SPR(blue dot on the graph below):
https://www.eia.gov/dnav/pet/hist/LeafHandler.ashx?n=PET&s=WCSSTUS1&f=W
.png)
A little history on that. During Biden, it was used to the tune of almost 300 billion barrels from late 2021 to mid 2023, mostly to fight high gas prices. Then it was very slowly being refilled, which continued in 2024,2025 (65 billion barrels) with lower crude prices then to buy it with, until this war broke out. Since then, its down another 120 bb!
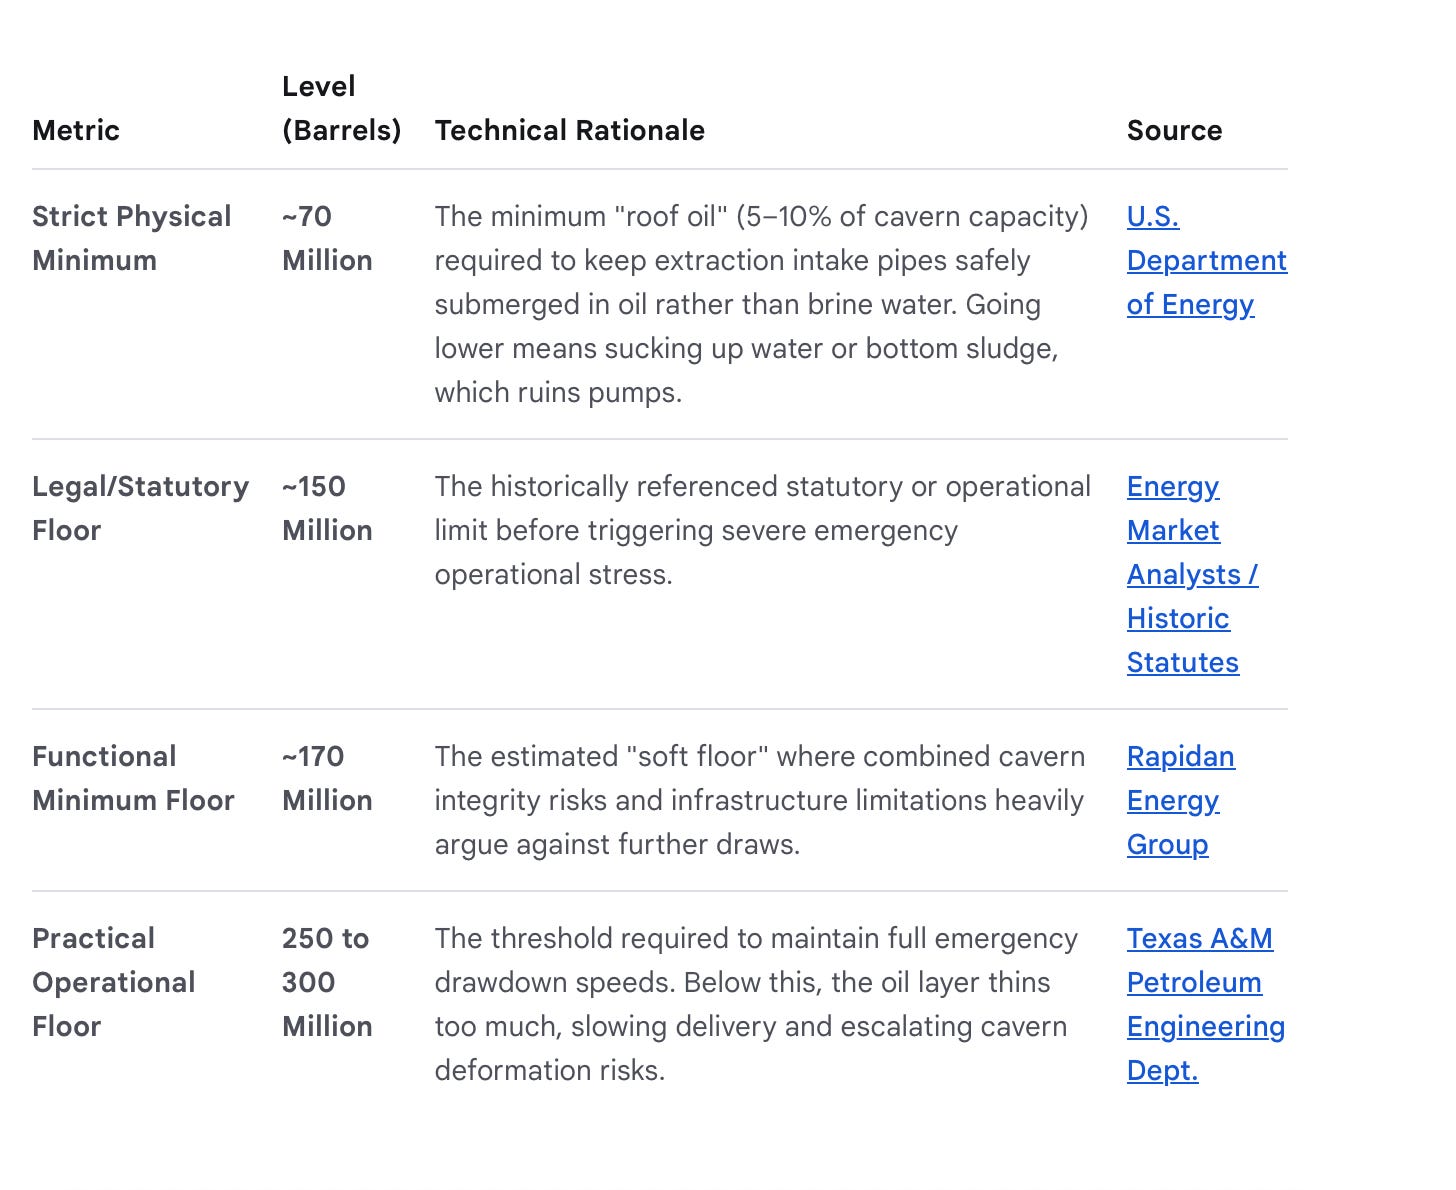
However, THIS BELOW is what's most important: It's suggests that we are now starting to damage the integrity of the SPR storage facility and the damage will increase the lower we go, according to some experts, like Texas A&M petroleum engineering department!
https://thepeopleseconomist.substack.com/p/americas-strategic-petroleum-reserve
Repeated drawdowns and refills of the SPR put pressure on the SPR’s infrastructure integrity.
Thanks very much, fayq!
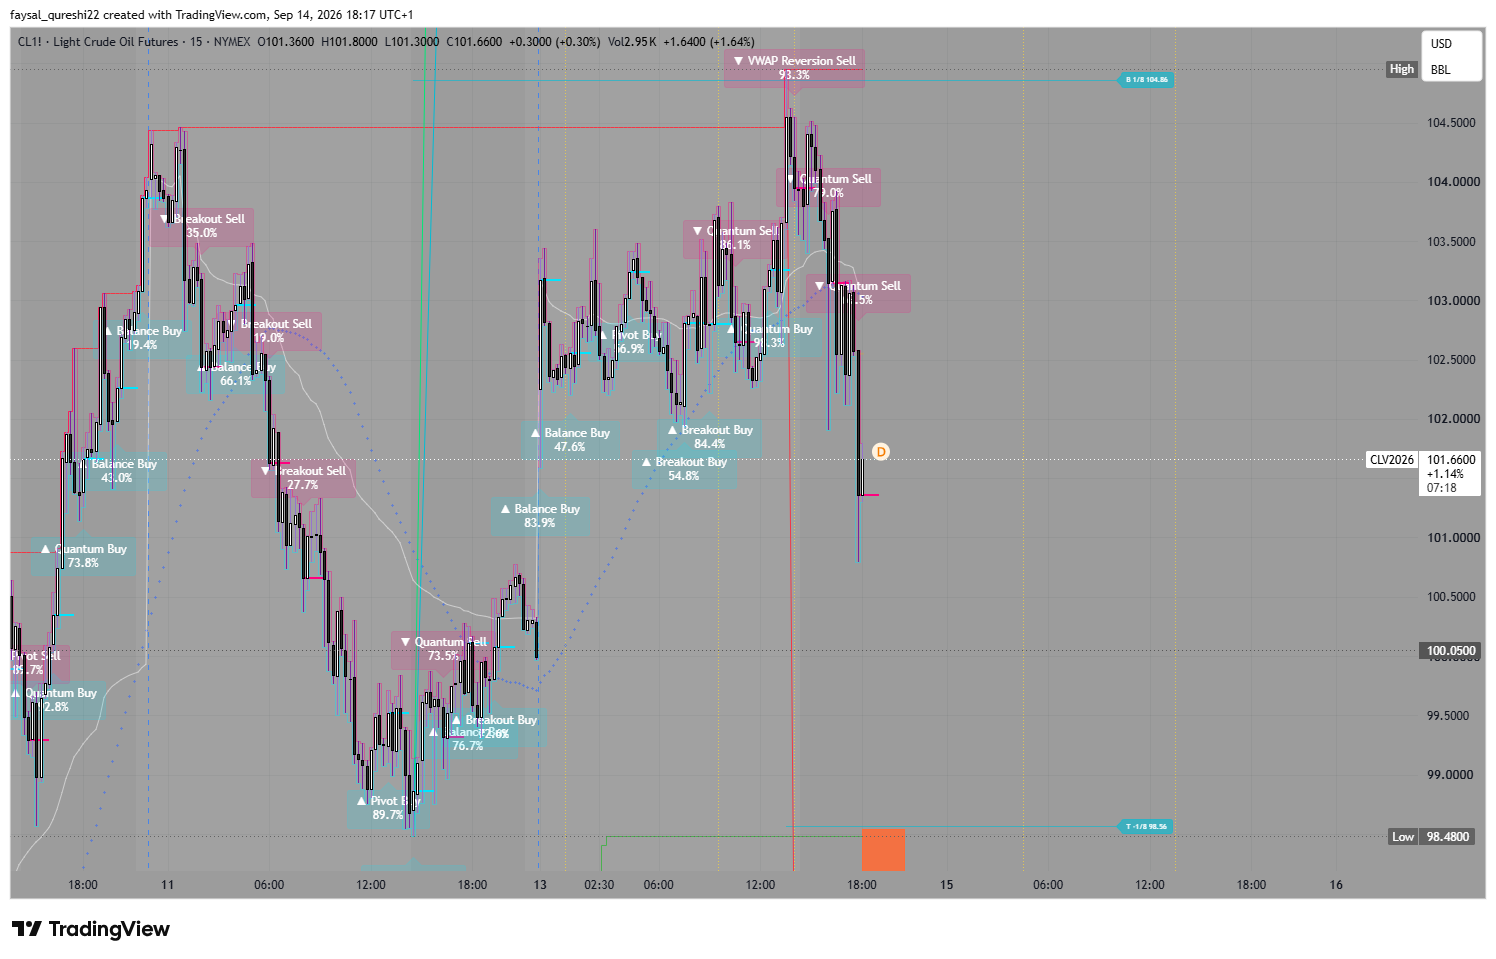
Would you mind explaining your system, please.
What is the white line? What triggers buy and sells signals? What is the difference between the labels/verbiage of buys/sells? What is the time frame? for instance. Thanks.
I won't scrutinize it without first letting you have the opportunity to explain it!
white line is avg Tick data for number of bars 00 i use 22 and VWAP distribution and accumulation time frame 15 minutes and when Shark buy and sell based on VWAP --triggers buy and sell and CRT candle Range theory with RSI and other indicator divergence
Thanks fayq,
Are you taking all those signals? Using stops? Have price projections/objectives?
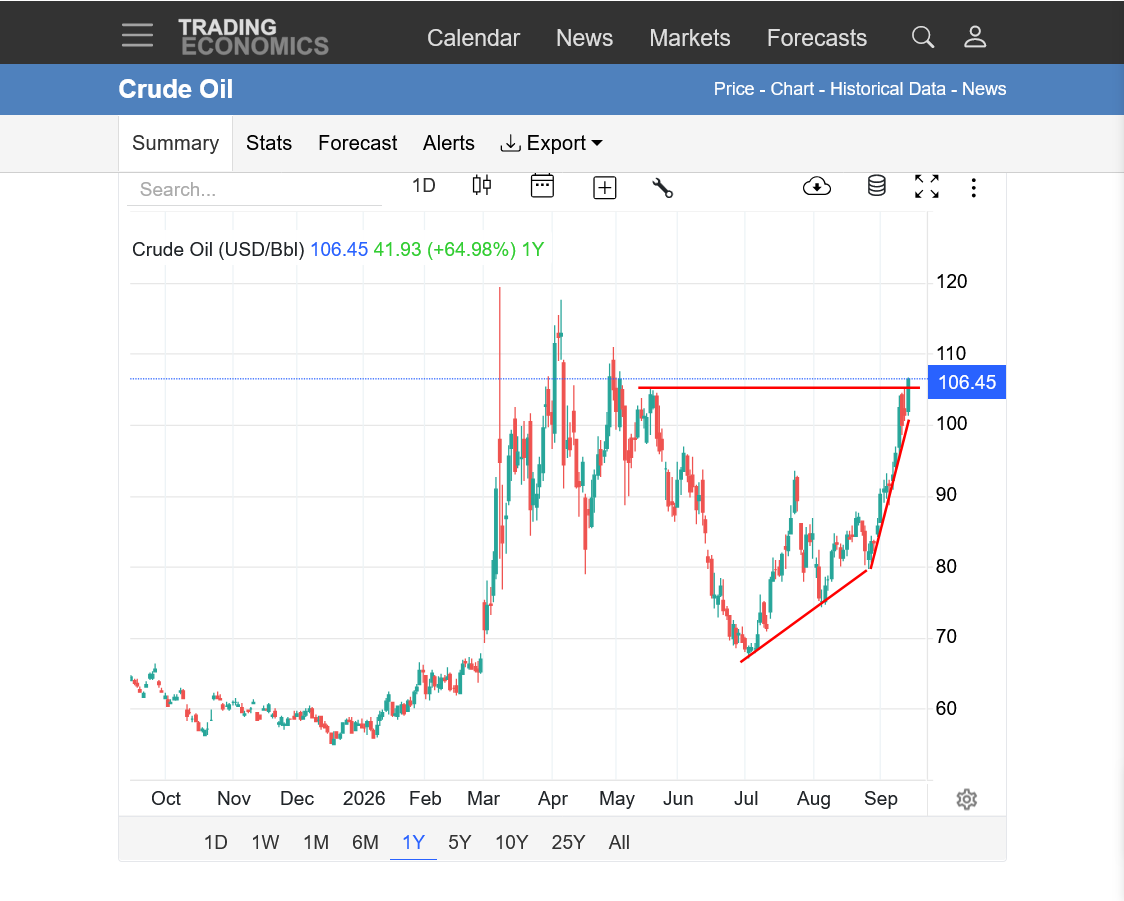
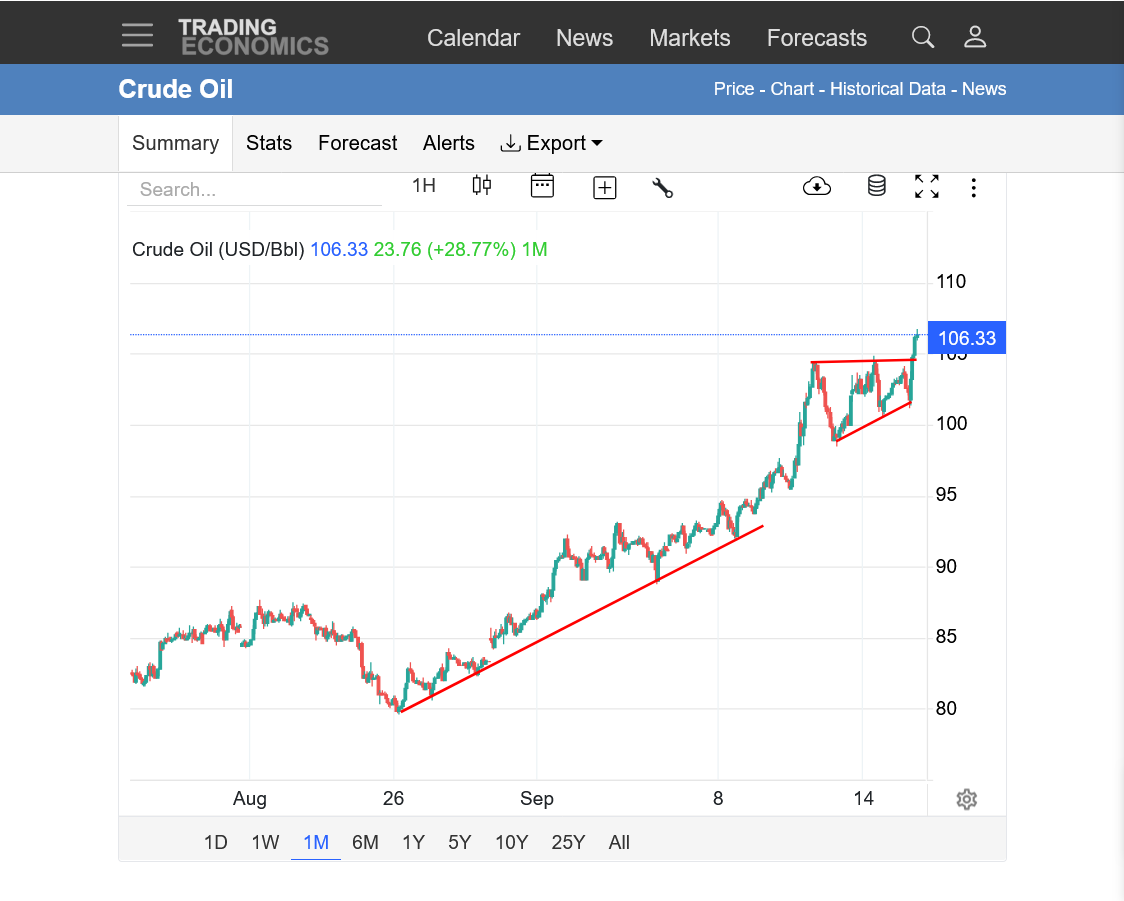
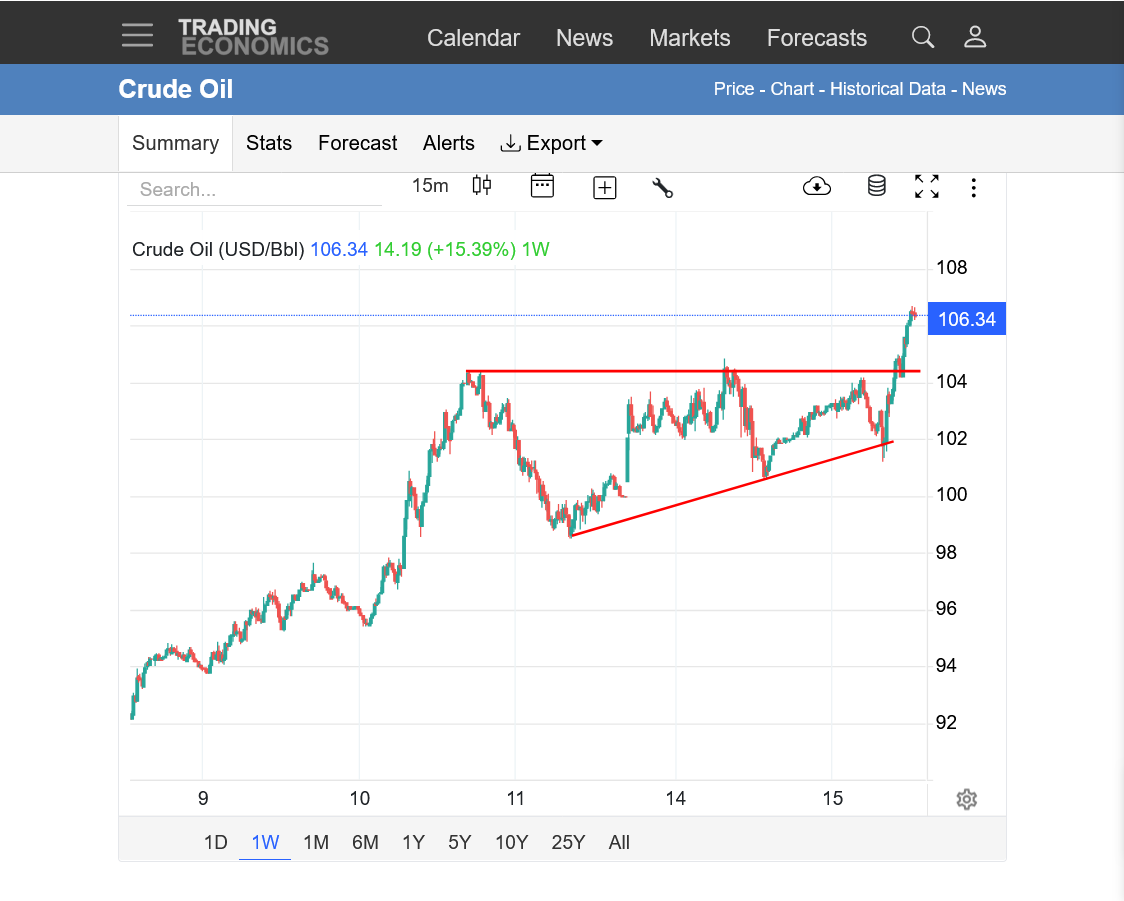
Front month crude is up $5+ today and completely blowing away the October contract, life of contract highs. The charts below are continuous, front month contract prices, which are also breaking out above previous resistance and the highest price since May.
They speak for themselves without interpretation, except to remind everybody that NEWS is the most important driver of prices.
https://tradingeconomics.com/commodity/crude-oil
1. 1 year
2. 1 month
3. 1 week
Despite high consumption & some shifts in imports & exports probably related to randomness, the holiday, & seasons changing, the EIA weekly storage is dead flat.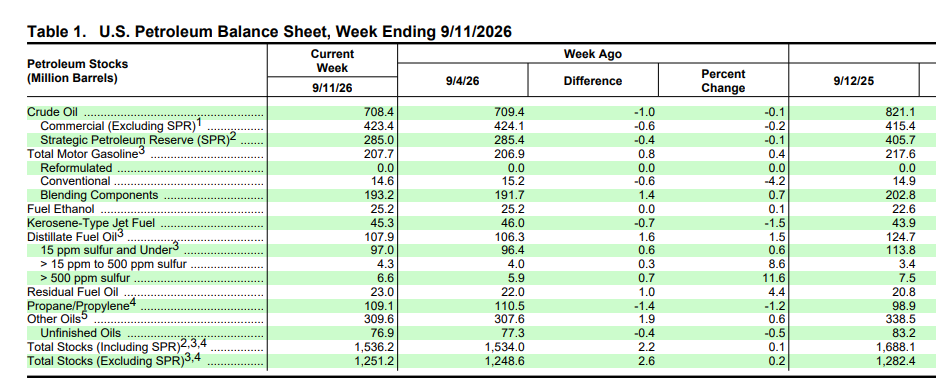
Thanks, patrick!
AI Overview
For the week ending September 11, 2026, the U.S. Energy Information Administration (EIA) reported that U.S. crude oil inventories dipped by 0.6 million barrels. [1]Key Report Details
+++++++++++++++++++++++++
metmike The last bullet point was a joke by me. Sometimes, jokes have embedded truths!
+++++++++++++
Wanna bet? This is just an example of bets that are mostly 1 sided/resolved.
https://polymarket.com/event/will-us-crude-oil-reserves-fall-to-by-september-25