
Folks,
Wx history is about to be made per model consensus, the earliest Sudden Stratospheric Warming (SSW) event by ~11 days on record (records back to 1949)!
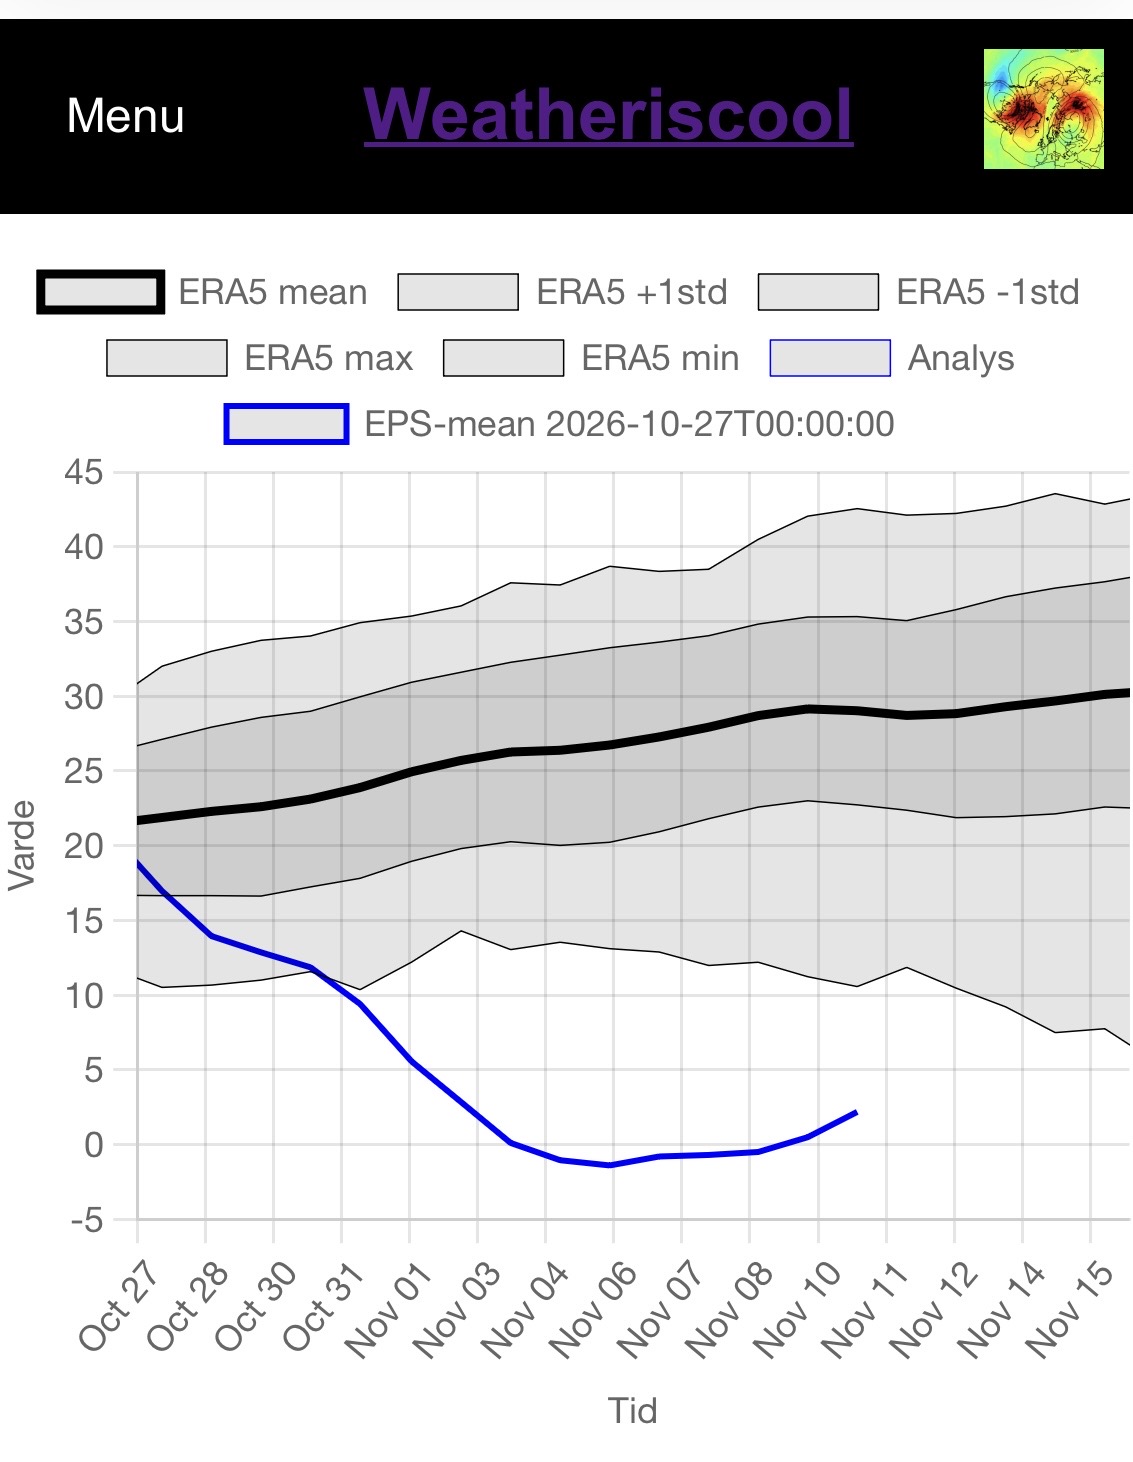
The 0Z 10/27/26 EE mean zonal wind at 10 mb/60N for the upcoming historic early Nov SSW event is forecasted to be a whopping 10-14 below the weakest on record for the day and 24-29 below the mean per ERA5 data Nov 3rd-10th! If it makes it to <0 or lower, that would mean a 60N mean zonal wind reversal up at the 10 mb level of the atmosphere and thus make it an official major SSW:
Per what I’ve read, it takes on average 35-40 days this early in the season for it to work it’s way down and produce a full effect on the troposphere, which would mean mid-Dec. What effect that would actually be is undetermined although it often means a -AO dominated period, which would then often favor a colder period for the E US.
The chart below has absolute 10 mb/60N winds back to 1949. According to it, Nov 2026 is (per ERA data) going to obliterate the old record (all of the way back to at least 1949) earliest SSW event whether it gets down to 0 (major SSW) or stays just above. The earliest major SSW on record is 1952’s ~Nov 15th reversal. So, 2026 is headed to possibly beat 1952 by ~11 days!
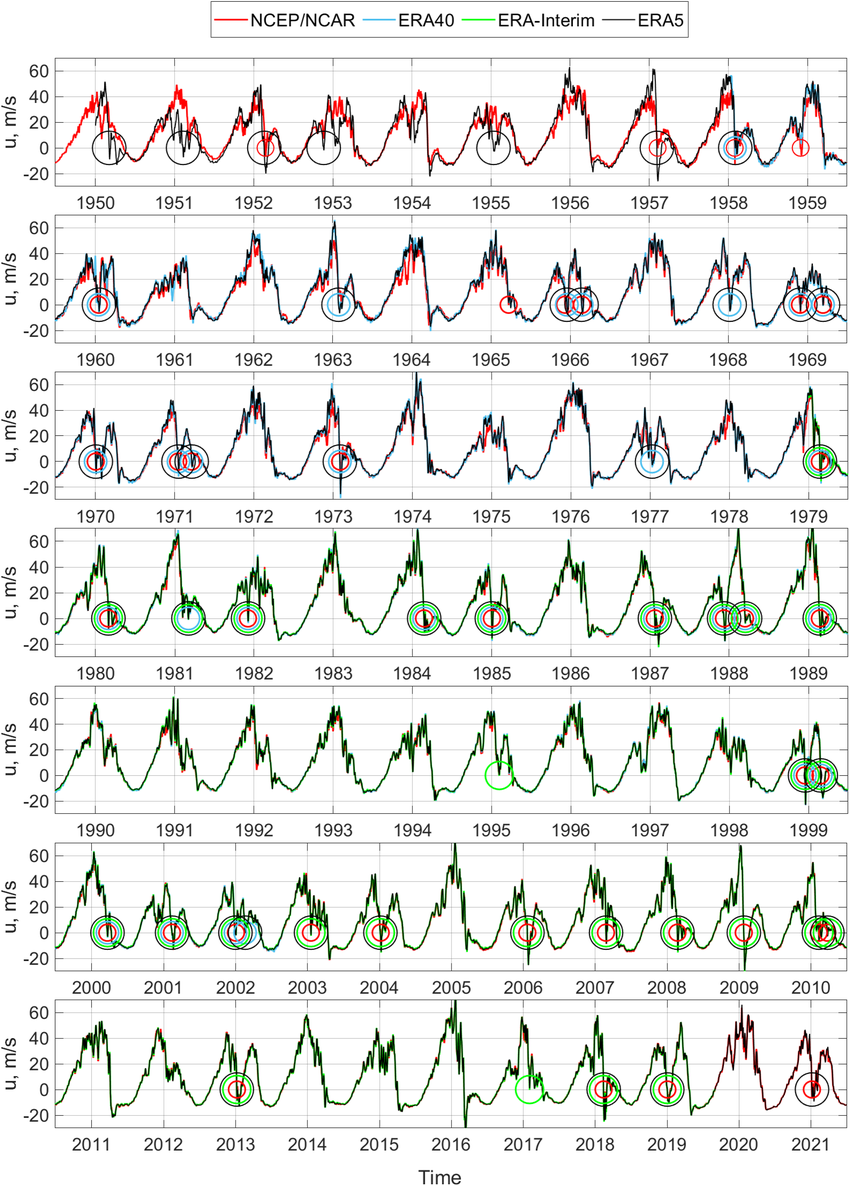
Looking at the above chart for only El Niño Novs, the only three that got to +5 or lower per ERA5 in Nov were 1968 (-5 on Nov 27th), 1976 (+4 on ~Nov 15th), and 2009 (+5 on ~Nov 15th). These three had the lowest DJF AO of any winters since at least 1949-50. Thus, these very strong winter -AOs were quite possibly connected to a large extent to the very weak Nov SPV period. Thus, a case could be made for a better than average chance for a strong -AO averaged out in 2026-7 despite the lack of seasonal model support:
1968-9: AO -2.3
1976-7: AO -2.6
2009-10: AO -3.4
The following chart presents the first reversal (major SSW) for the 34 winters since 1958 that had one (this doesn’t go as far back as the chart above):
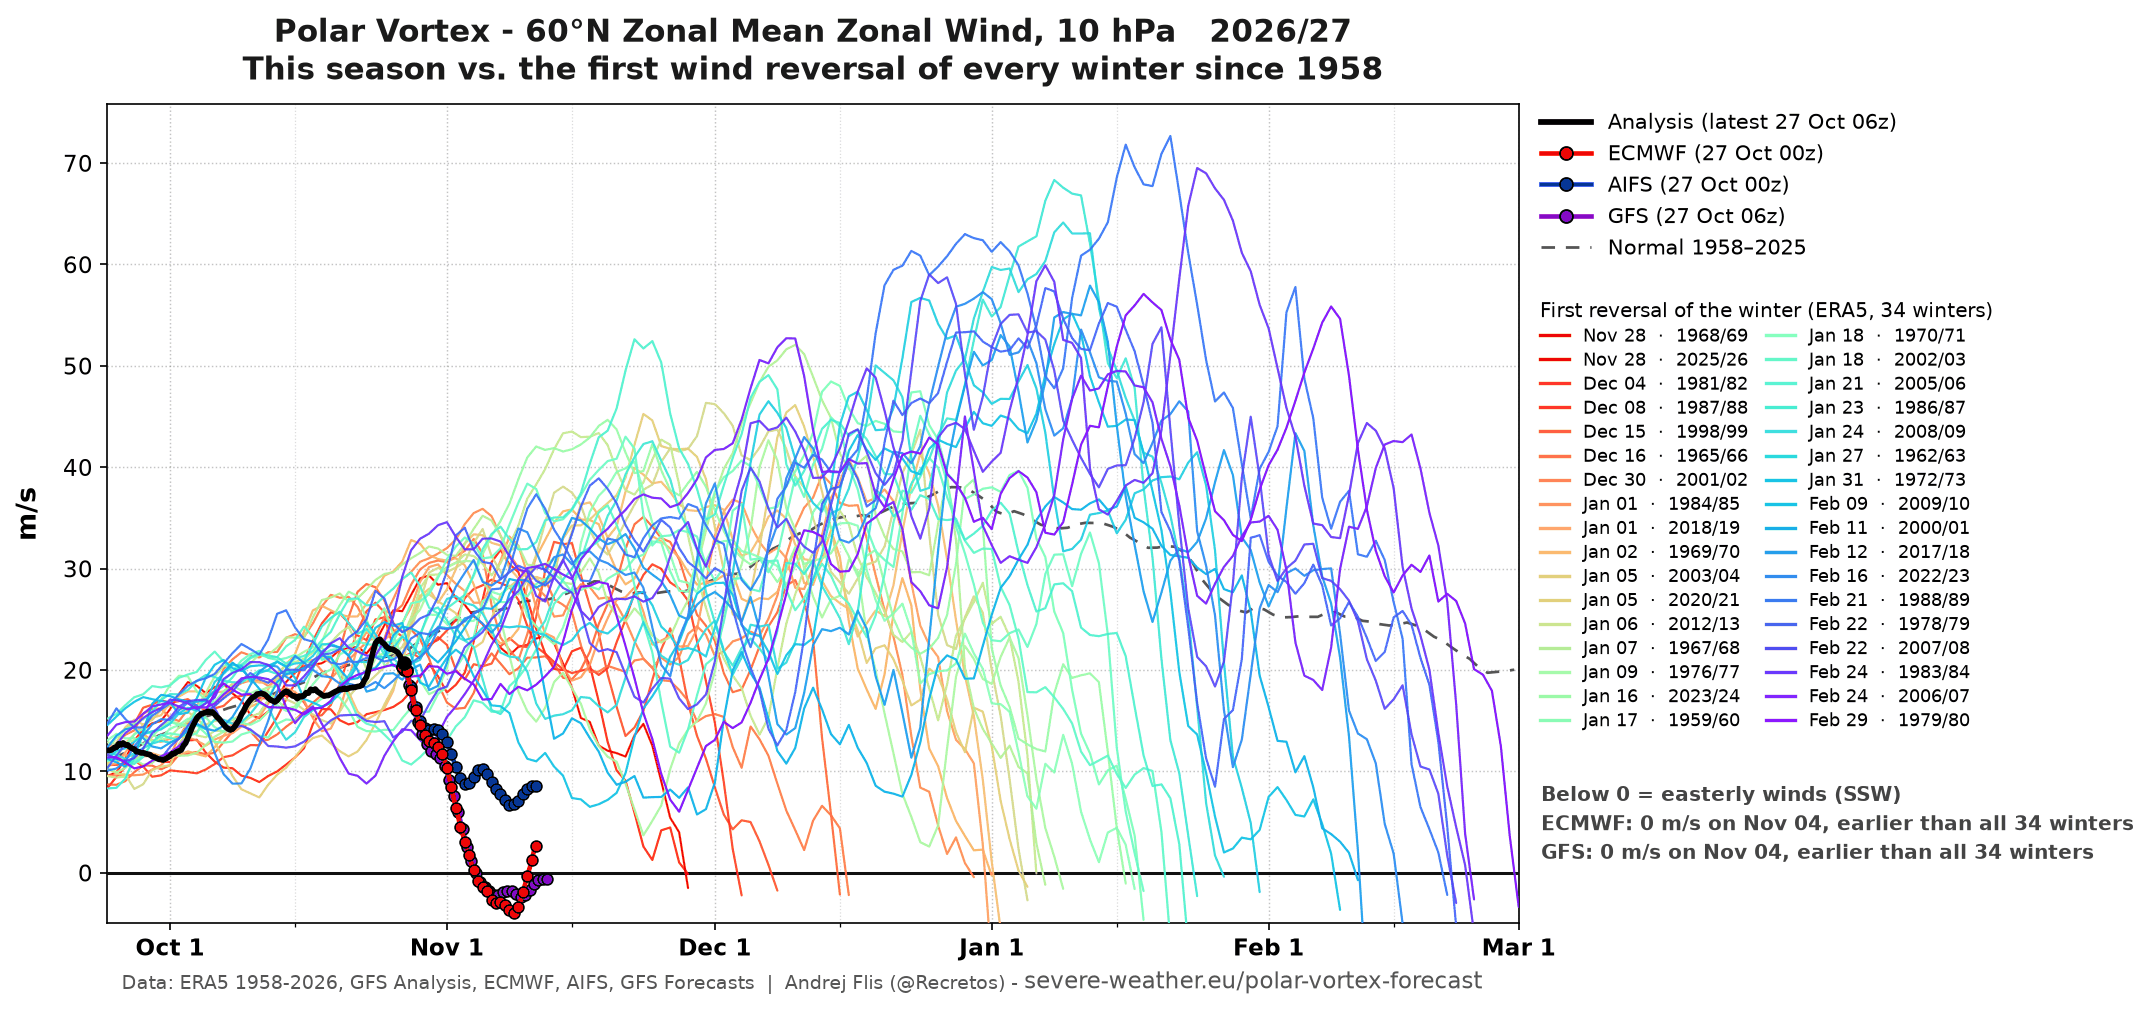 One can see from this how rare major SSWs have been (back to 1959) before Dec 30th and especially the none before Nov 28th! The one I mentioned earlier on ~Nov 15th is from 1952 and thus isn’t on this chart.
WOW!
Thanks extremely much, Larry!
This will be something to monitor very closely starting.........right now with your post.
https://weather.com/2026/10/27/forecast/national/polar-vortex-early-season-stretch-super-el-nino-us
++++++++++++++++++
Director, Seasonal Forecasting
Atmospheric and Environmental Research
JANUS Research Group
October 26, 2026
https://published.aer.com/aoblog/aoblog.html
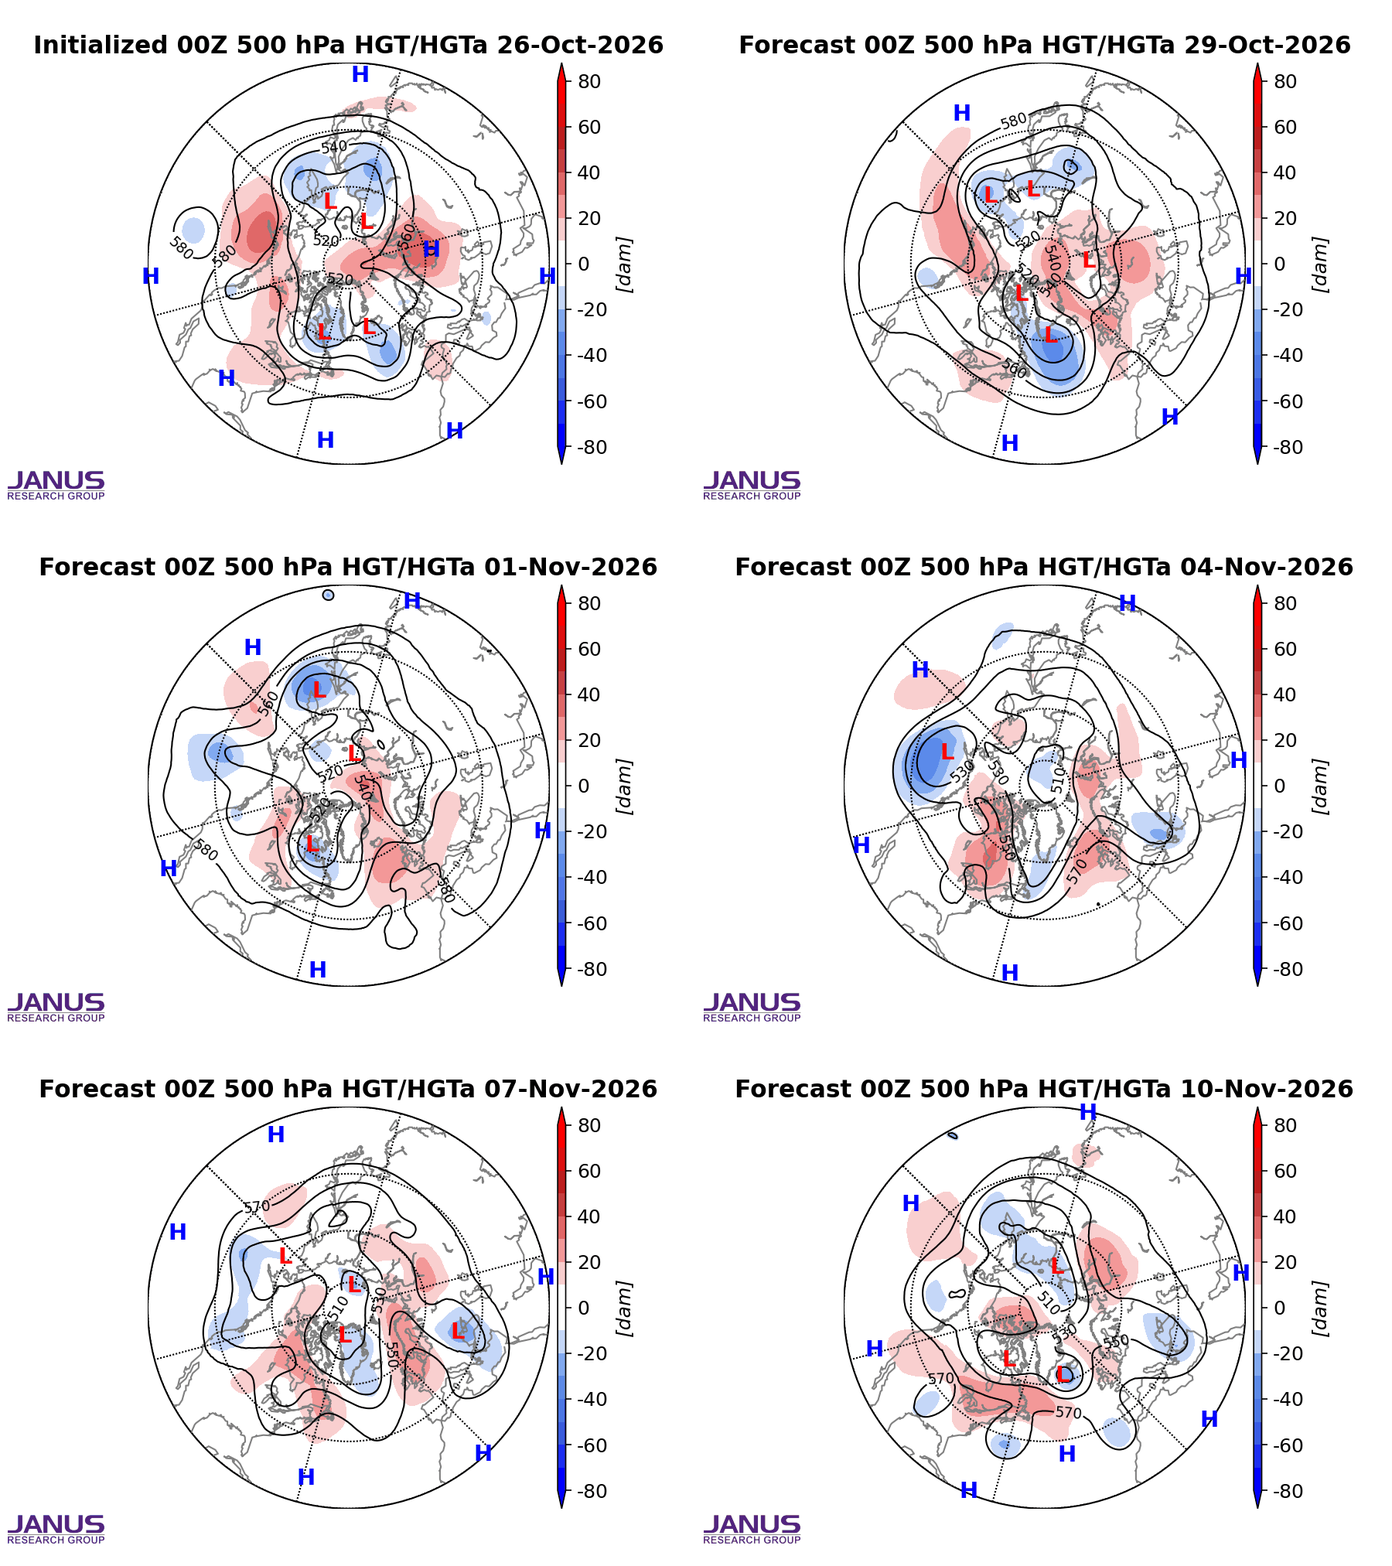
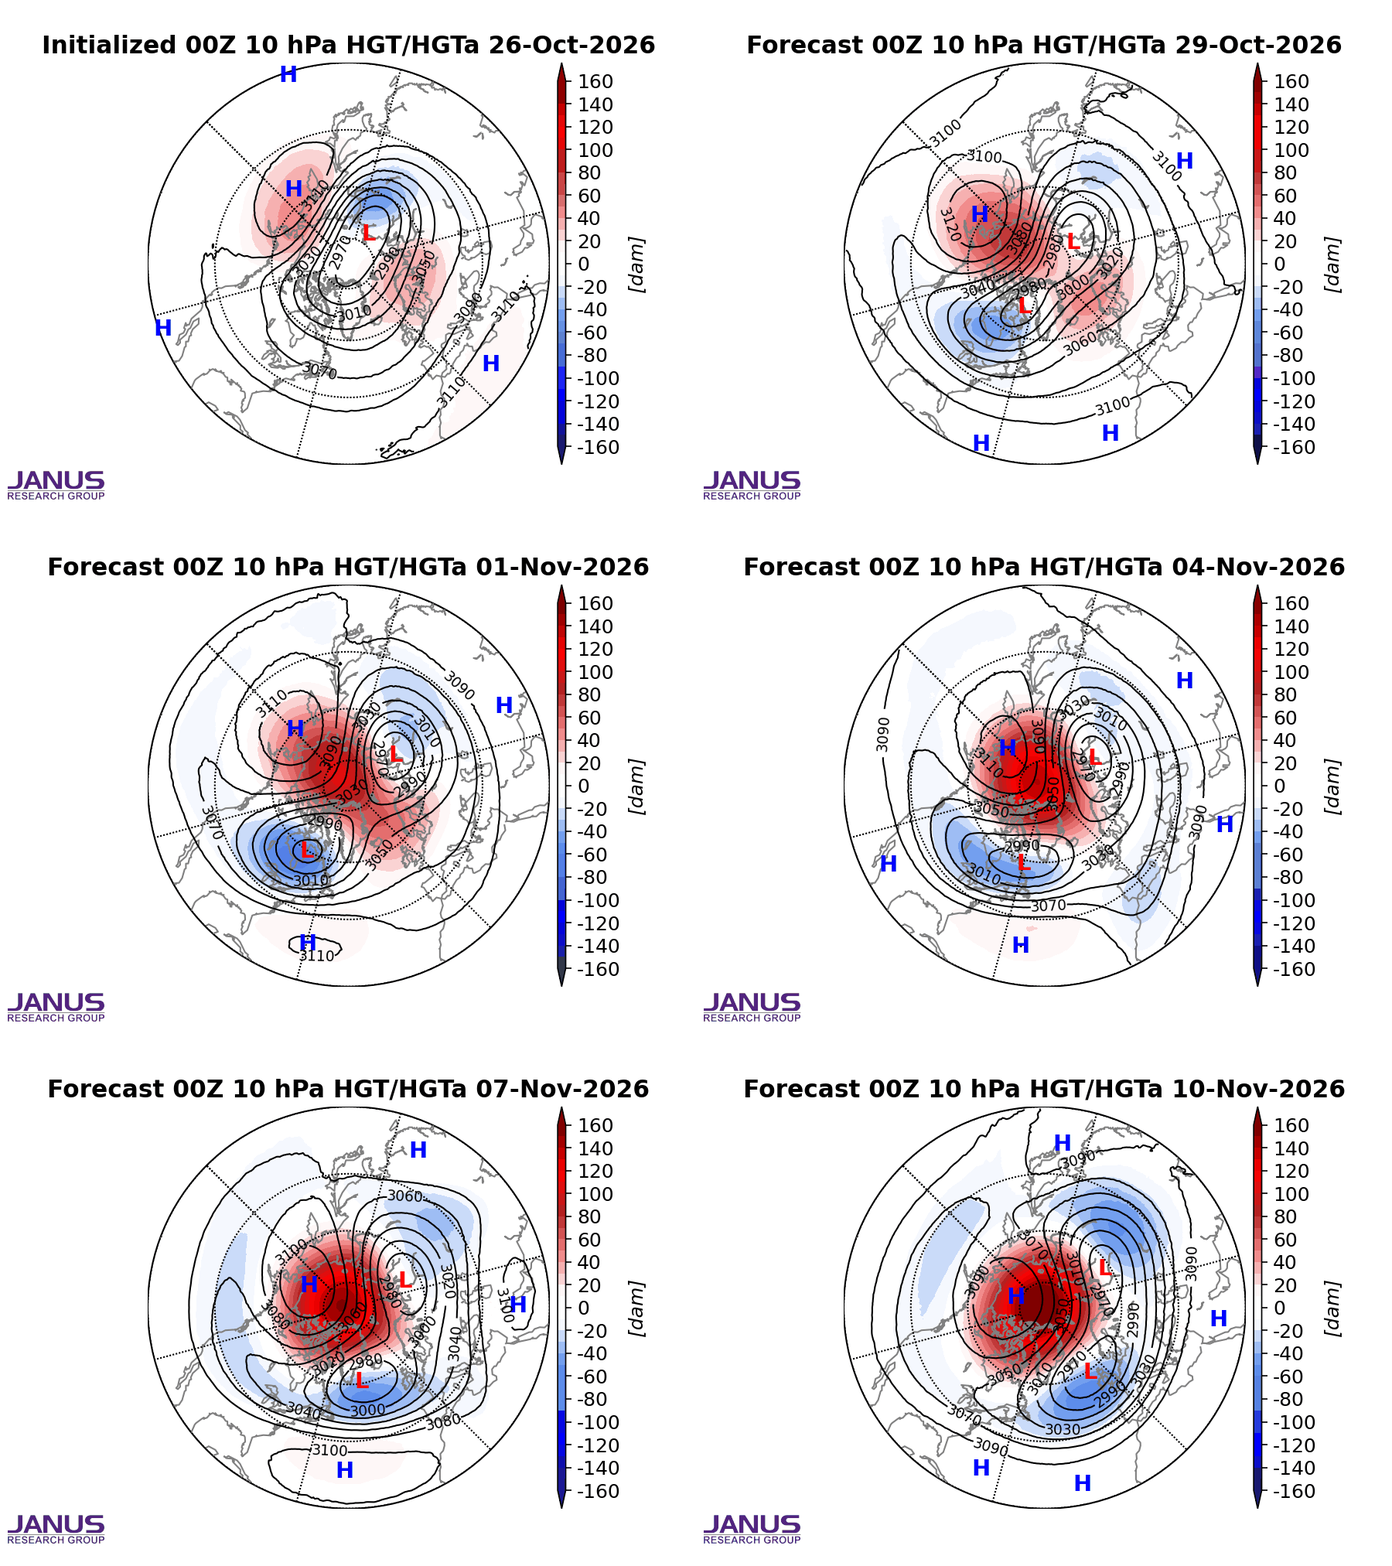
The AO is falling in week 2 below which is favorable for a troposphere that delivers cold from high latitudes to mid latitudes. Higher than average upper level heights in the higher latitudes.
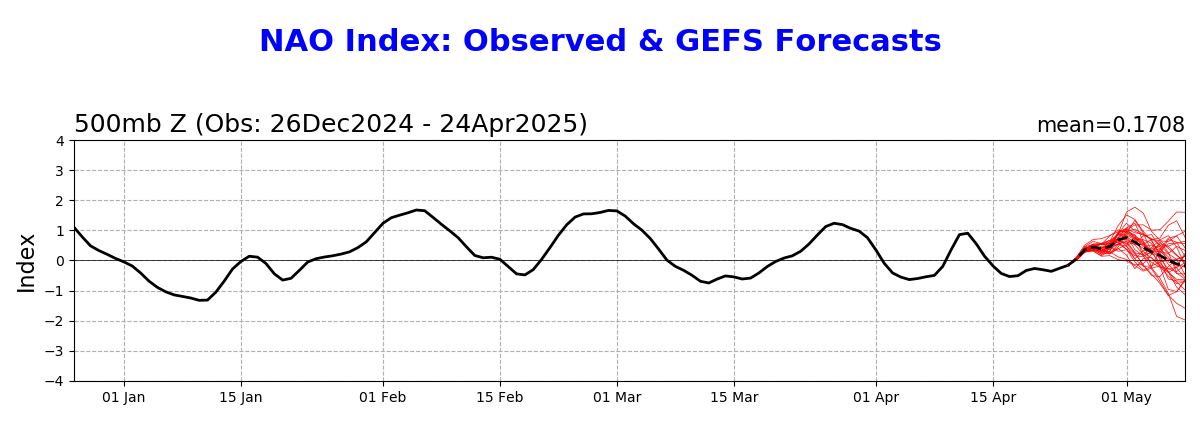
The NAO is close to 0 but is falling. A -NAO is needed to give cold air a push deeply into the eastern 1/2 of the US.
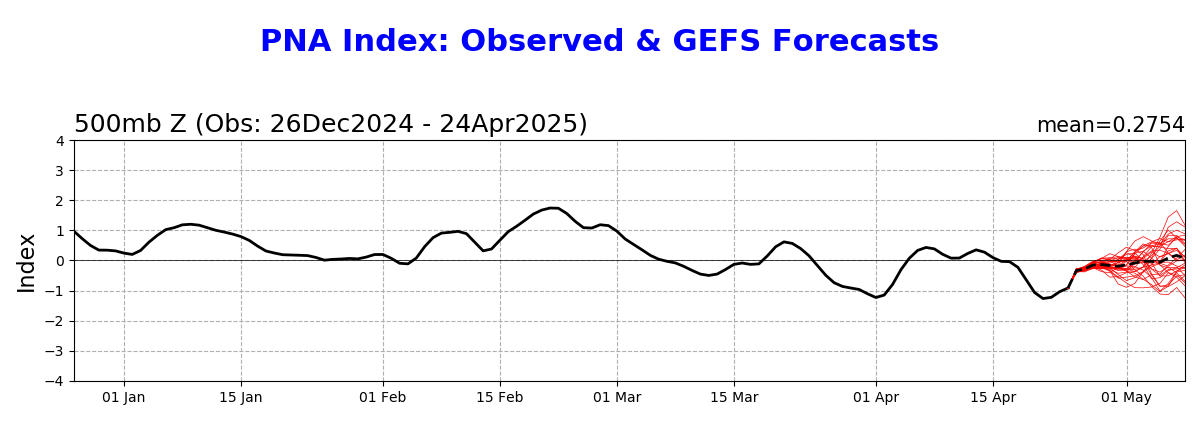
A +PNA is favorable for cold air delivery in the East, especially the Southeast.
Regardless, the steering currents thru 2 weeks are much too zonal with not enough meridional (north to south) flow for any major cold to hit the US.
https://www.psl.noaa.gov/map/images/ens/ens.html#nh
NCEP Ensemble t = 360 hour forecast 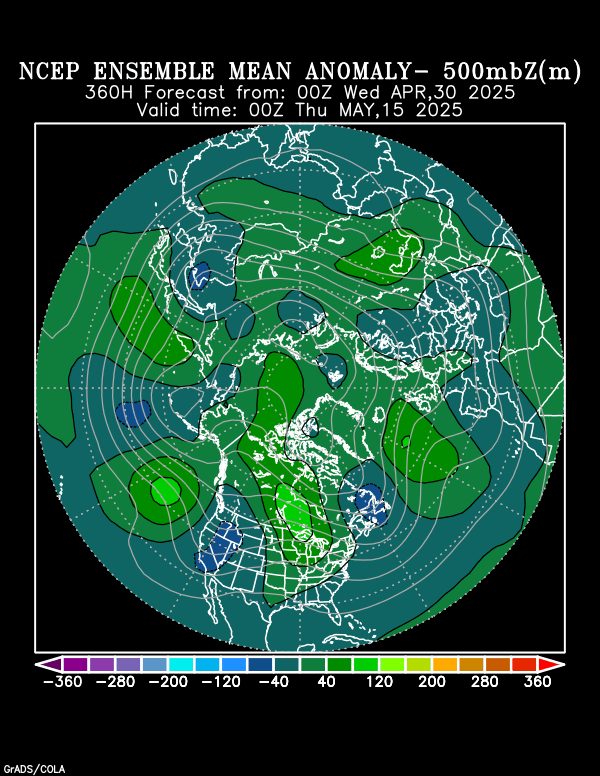
NCEP Ensemble t = 360 hour forecast 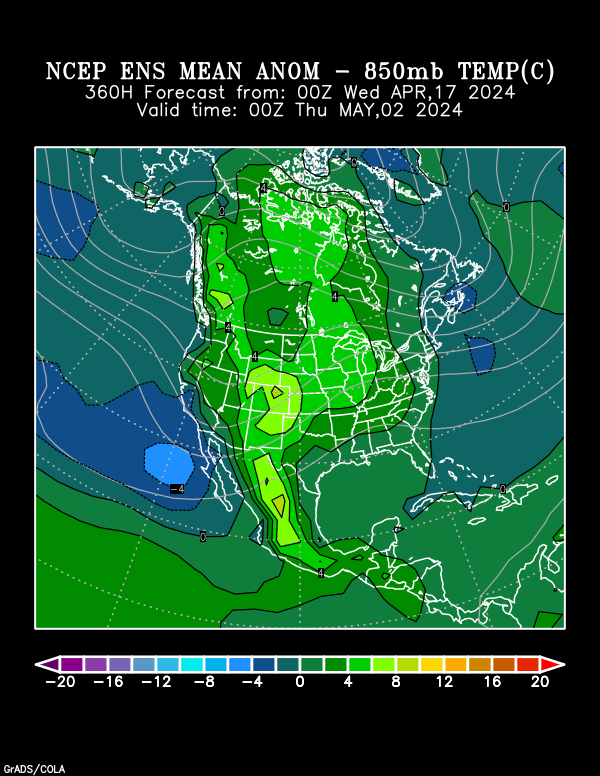
Arctic Oscillation Index, North Atlantic Oscillation Index, Pacific North American Index.
https://www.cpc.ncep.noaa.gov/products/precip/CWlink/daily_ao_index/ao.shtml
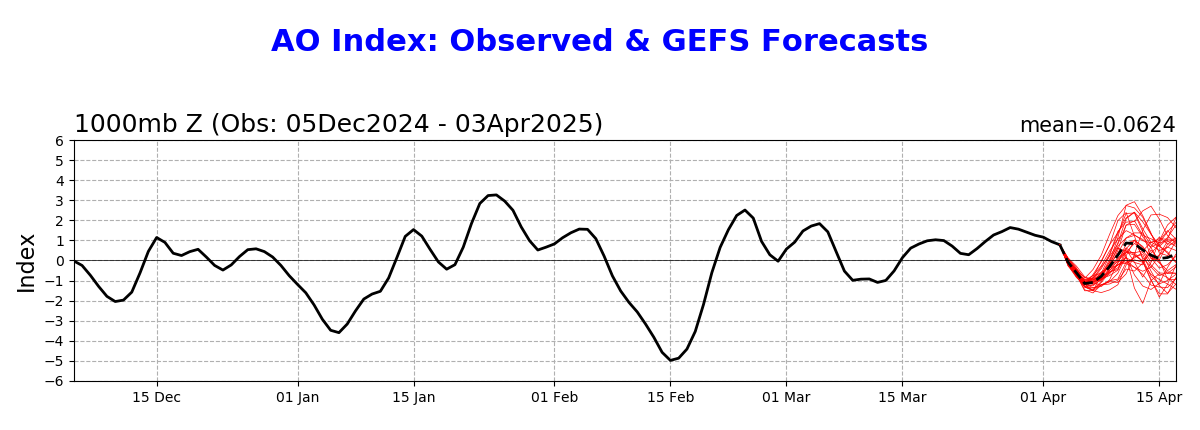
https://www.cpc.ncep.noaa.gov/products/precip/CWlink/pna/nao.shtml
https://www.cpc.ncep.noaa.gov/products/precip/CWlink/pna/pna.shtml
A couple outlier members of this last 0z Canadian model have the polar vortex impacting the US in week 2 but many more disagree.
more tomorrow.