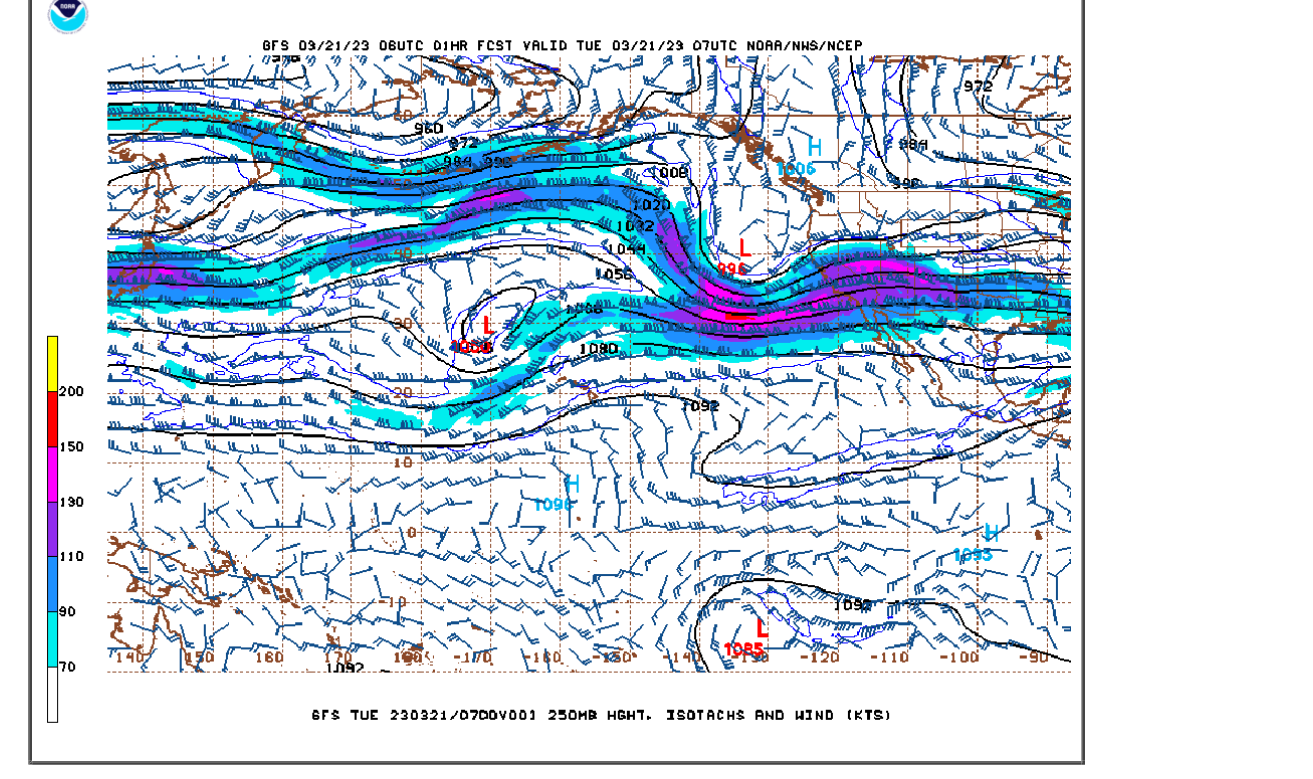
250 mb heights below which is around 34,000 feet (around 6.5 miles) up in the atmosphere and also the peak jet steam velocity Right now.
The current150 knot jet max isotach(shades of equal wind) in red below, is the equivalent of 180+ mph. It's part of an atmospheric river aimed at the West Coast. This is very typical during an El Nino Winter but can happen without El Nino.
https://mag.ncep.noaa.gov/Image.php
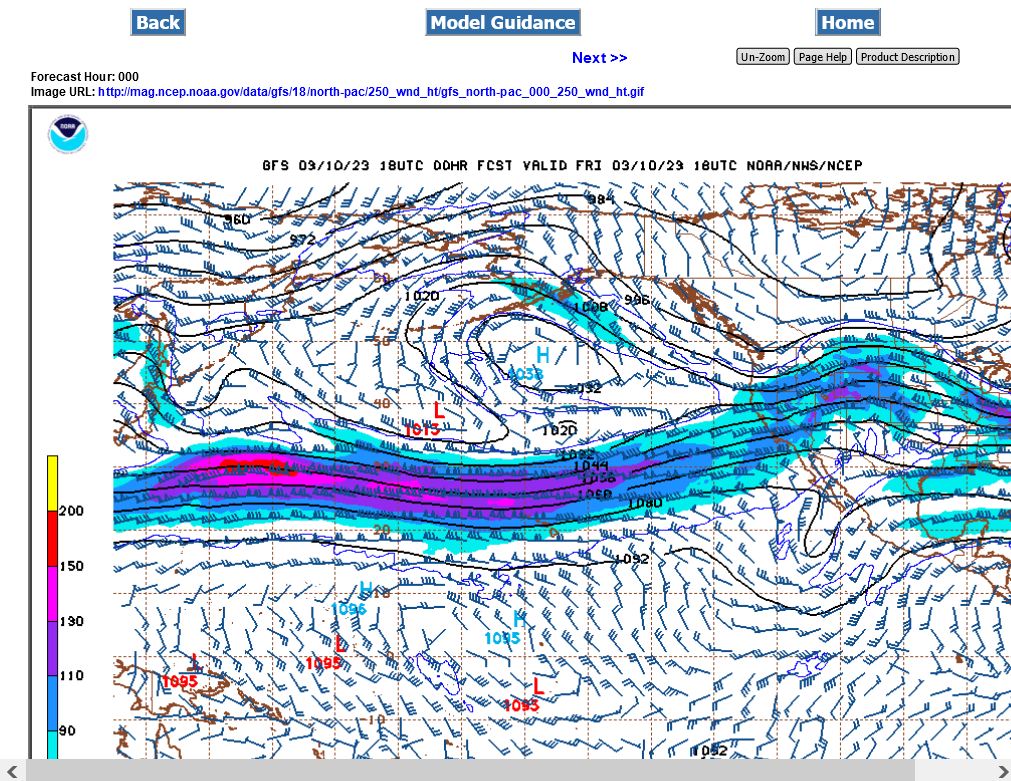
This jet stream is a classical El Nino Jet stream:
https://www.weather.gov/jetstream/enso_impacts

Ten or more atmospheric rivers can be happening at once across the globe.
A well-known and strong one is the Pineapple Express, with moisture transported from the tropical Pacific around Hawaii to the US and Canadian West Coasts.
The eastern half of the US also experiences atmospheric rivers, with moisture pulled from the Gulf of Mexico.
“Atmospheric rivers are more frequent on the East Coast than they are on the West Coast,” said Jason Cordeira, associate professor of meteorology at Plymouth State University. “They’re just not as impactful and don’t usually produce as much rainfall.”
Western Europe and North Africa also experience frequent atmospheric rivers, as do New Zealand and Australia.
+++++++++++
• California’s megaflood of 1861is the state’s most catastrophic atmospheric river. The 43-day pounding by unrelenting rain turned the Central Valley into an inland sea. Thousands of people died, and downtown Sacramento was submerged in 10 feet of water and mudslide debris.
+++++++++++
As the world warms, the atmosphere can hold more moisture – which will lead to rainier atmospheric river events.
“So, an atmospheric river, which is defined as a region of water vapor, will likely become more intense. Their frequency may not be more common, but their intensity could become larger.”
Atmospheric rivers will be “significantly longer and wider than the ones we observe today, leading to more frequent atmospheric river conditions in affected areas,” a NASA-led study found.
The frequency of the most intense atmospheric rivers will likely double, the study found.
+++++++++++++++
Not so fast, CNN. It's true that the 1 deg. C increase in global temperature the last 100 yeaers should lead to a 7% increase in moisture that the air can hold at the warmer temperature.
However, that's the AVERAGE increase in temps and most of it has taken place in the highest latitudes of the northern hemisphere.
In places without that much increase, we would NOT expect an increase in heavier rain events.
This particular area, with the recent atmospheric river extremes that we've had in 2023 has actually seen a slight decrease in ocean temperatures during climate change. So you can't blame global warming when it's been global cooling in that area!
By Chad Small | December 16, 2022
https://thebulletin.org/2022/12/whats-wrong-with-these-climate-models/
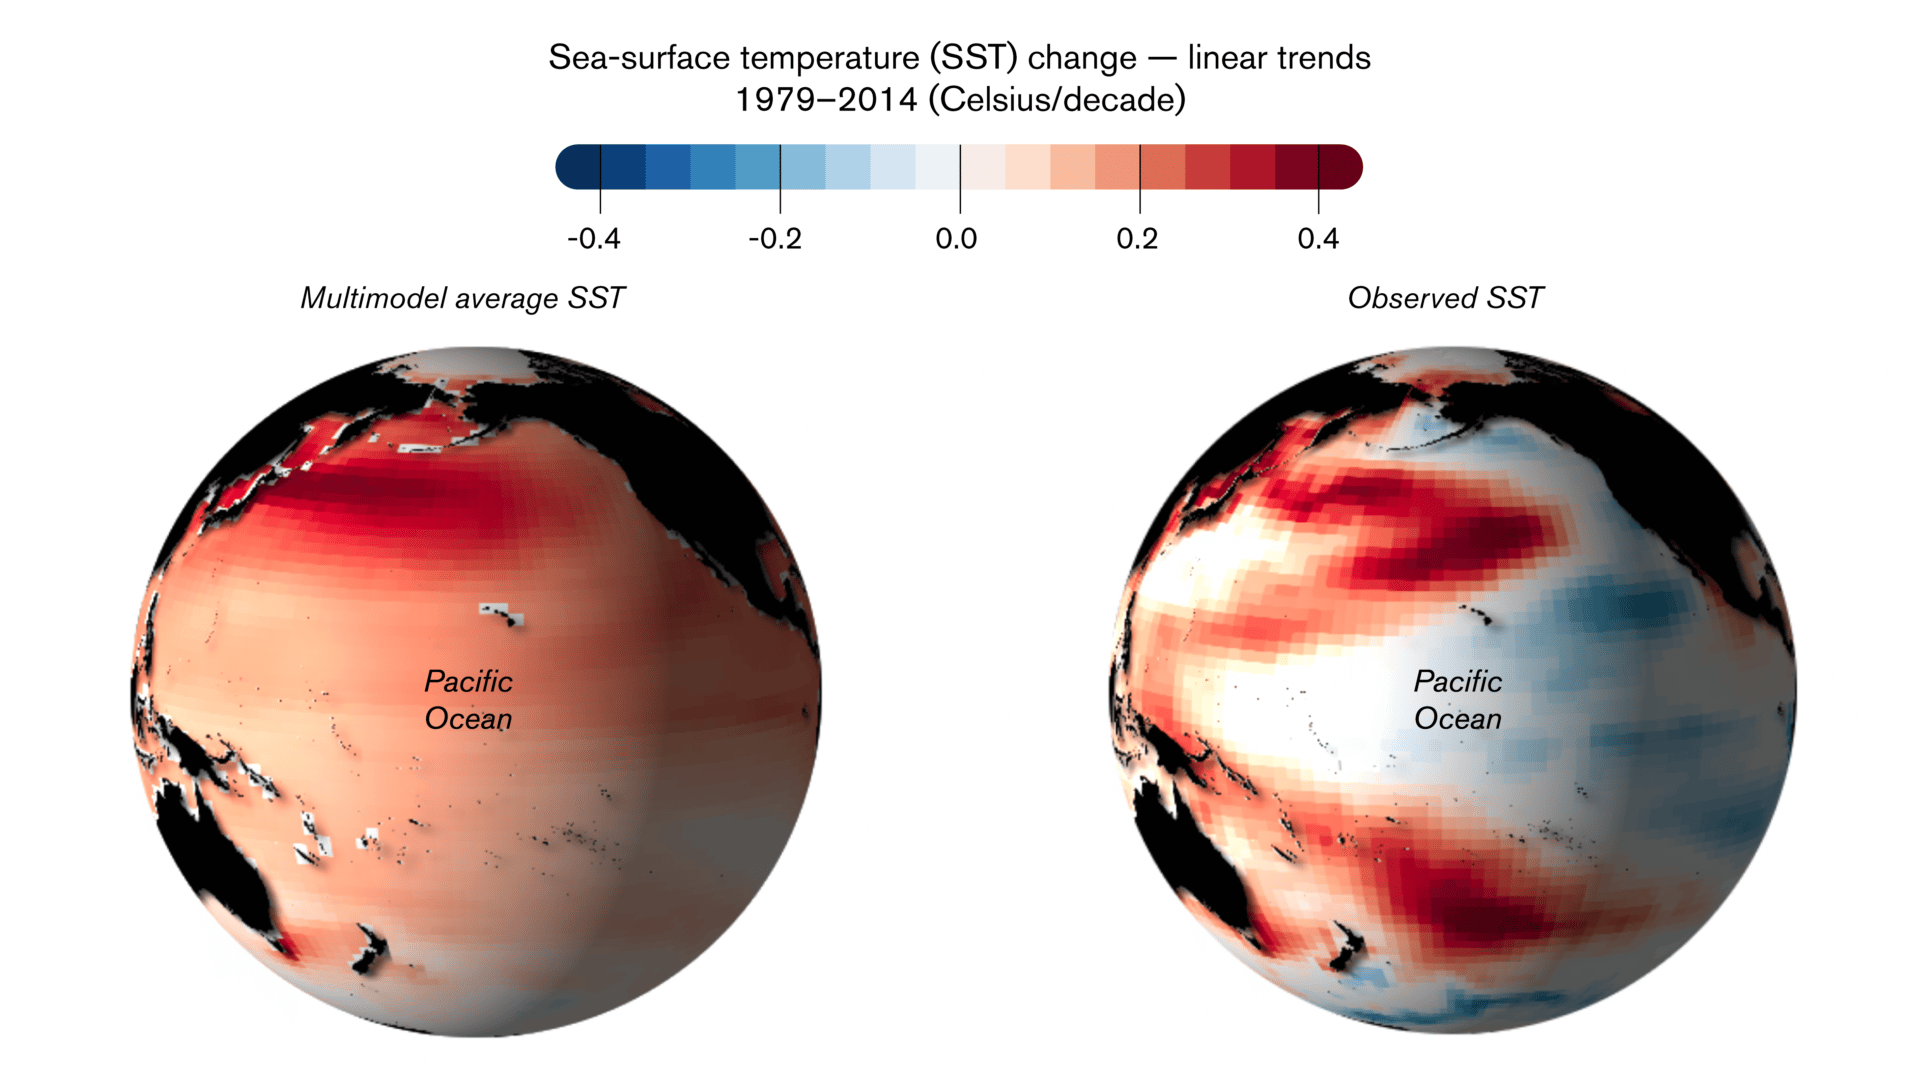
Since 1979, a composite of global climate models has shown warming in every part of the world’s oceans, including the Eastern Pacific. But observed sea surface temperatures over the same time period have shown a surprising cooling trend in the Eastern Pacific Ocean while the rest of the rest of the world’s waters steadily get warmer. [White blocks indicate coastal regions where composite model data are not included.] (Dong et al., 2021 / Erik English / Chad Small)
1. August 1931 Yangtze River, China 3,700,000 killed
2. September 1887 Yellow River, China 2,000,000 deaths
3. June 1938 Yellow River, China 800,000 deaths
4. August 1975 Banqiao, China 230,000 dead
5. 1935 Yangtze River 145,000 dead
6. November 1530 St. Felix Flood, Holy Roman Empire/Europe 100,000+ killed
7. August 1971, Hanoi/Red Rivers, North Vietnam 100,000 dead
8. May 1911 Jiangsu-Anhui, China 100,000 dead
9. December 1287 Holy Roman Empire/Europe 50,000+ dead
10. September 1949 Guatemala 40,000 dead
11. June 1954 Yangtze River, China 30,000 dead
12. June 1974 Bangladesh 28,700 dead
13. January 1362 St. Marcellus Flood-Ireland/Britain/N.Germany 25,000+ dead
14. November 1570 All Saints Flood Netherlands 20,000+ killed
15. December 1999 Vargas mudslides Venezuela 20,000 dead
How many of these events took place in the last 40 years?
Answer: 1
So even with the increase in moisture in the atmosphere of 7%, mostly in the highest latitudes, where the moisture is MUCH less abundant to start with, an increase in rains(mostly beneficial) and also a slight increase in flooding, one of the few detrimental effects of climate change(slight uptick in flooding- slight increase in planting delays) is NOT resulting in any sort of flooding crisis that is challenging records of past flooding.
++++++++++++
They just keep vehemently violating the indisputable authentic science to support the politically manufactured/fake climate crisis. From Dr. Cliff Mass:
https://www.marketforum.com/forum/topic/88225/#88226
https://cliffmass.blogspot.com/2016/03/the-golden-rule-of-climate-extremes.html
++++++++++++++++++++++++++
Considering the substantial confusion in the media about this critical issue, let me provide the GOLDENRULE OF CLIMATE EXTREMES. Here it is:
The more extreme a climate or weather record is, the greater the contribution of natural variability.
Or to put it a different way, the larger or more unusual an extreme, the higher proportion of the extreme is due to natural variability.
US Rainfall Records
The map/link below shows rainfall records for the US for total rains, going from a time frame of 1 minute up to a time frame of 1 year. If you go to the link, you will see this better. It shows the date of occurrence for each of these 20 events. The surprise is that all of them occurred BEFORE 1983 and before man made global warming and climate change would have been a factor. I can't completely explain this as I had recently done a study on our local region going back 120 years that did show heavier rain events over the last 30 years with an especially big increase in the last 15 years..
I think that we have in fact had at least a slight increase in the # of extreme rain events, however, this shows that regardless of humans the really extreme events have always happened and will continue to happen.
http://www.nws.noaa.gov/oh/hdsc/record_precip/record_precip_us.html
| USA Records-HDSC/OWP www.nws.noaa.gov Disclaimers: Some data are estimates. Not all data have been verified. "*" indicates questionable veracity. Coordinates are approximate. |
Duration Amount (in) Location Start date
1-min 1.23 Unionville, MD 4 Jul 1956
5-min 2.03 Alamogordo Creek, NM 5 Jun 1960
12-min 2.30 Embarrass, WI 28 May 1881
15-min 3.95 Galveston, TX 4 Jun 1871
30-min 7.00 Cambridge, OH 16 Jul 1914 42-min 12.0 Holt, MO 22 Jun 1947
13.8* Burnsville 6 WNW, WV 4 Aug 1943
60-min 12.0 Holt, MO 22 Jun 1947
12.0 305 Kilauea Sugar Plantation, Kauai, HI 24 Jan 1956
90-min 14.6 Burnsville 6 WNW, WV 4 Aug 1943
2-hr 15.0 Woodward Ranch (D'Hanis), TX 31 May 1935
2.17-hr 19.0 Rockport, WV 18 Jul 1889
2.75-hr 22.0 Woodward Ranch (D'Hanis), TX 31 May 1935
3-hr 28.5 Smethport, PA 18 Jul 1942
4.5-hr 30.7 Smethport, PA 18 Jul 1942
12-hr 34.3 Smethport, PA 17 Jul 1942
18-hr 36.4 Thrall, TX 9 Sep 1921
24-hr 43.0 Alvin, TX 29.42 -95.24 25 Jul 1979
3,4,5 4-day 62.0 Kukaiau, Hamakua, HI 27 Feb 1902
8-day 82.0 Kukaiau, Hamakua, HI 28 Feb 1902
1-month 149 Mt. Waialeale, Kauai, HI 1 Mar 1982
12-month 739 Kukui, Maui, HI 1 Dec 1981
++++++++++++++++
However, there were a number of individual STATE rain records broken in 2018/19. with a 1 year anomaly/spike higher.
Since 1970, the US has been slightly wetter, as seen on the graph below.
https://www.wunderground.com/cat6/Summary-US-State-Historical-Precipitation-Extremes

This has been the same pattern with the US state temperature records the past 130 years.
https://www.marketforum.com/forum/topic/87294/#87332
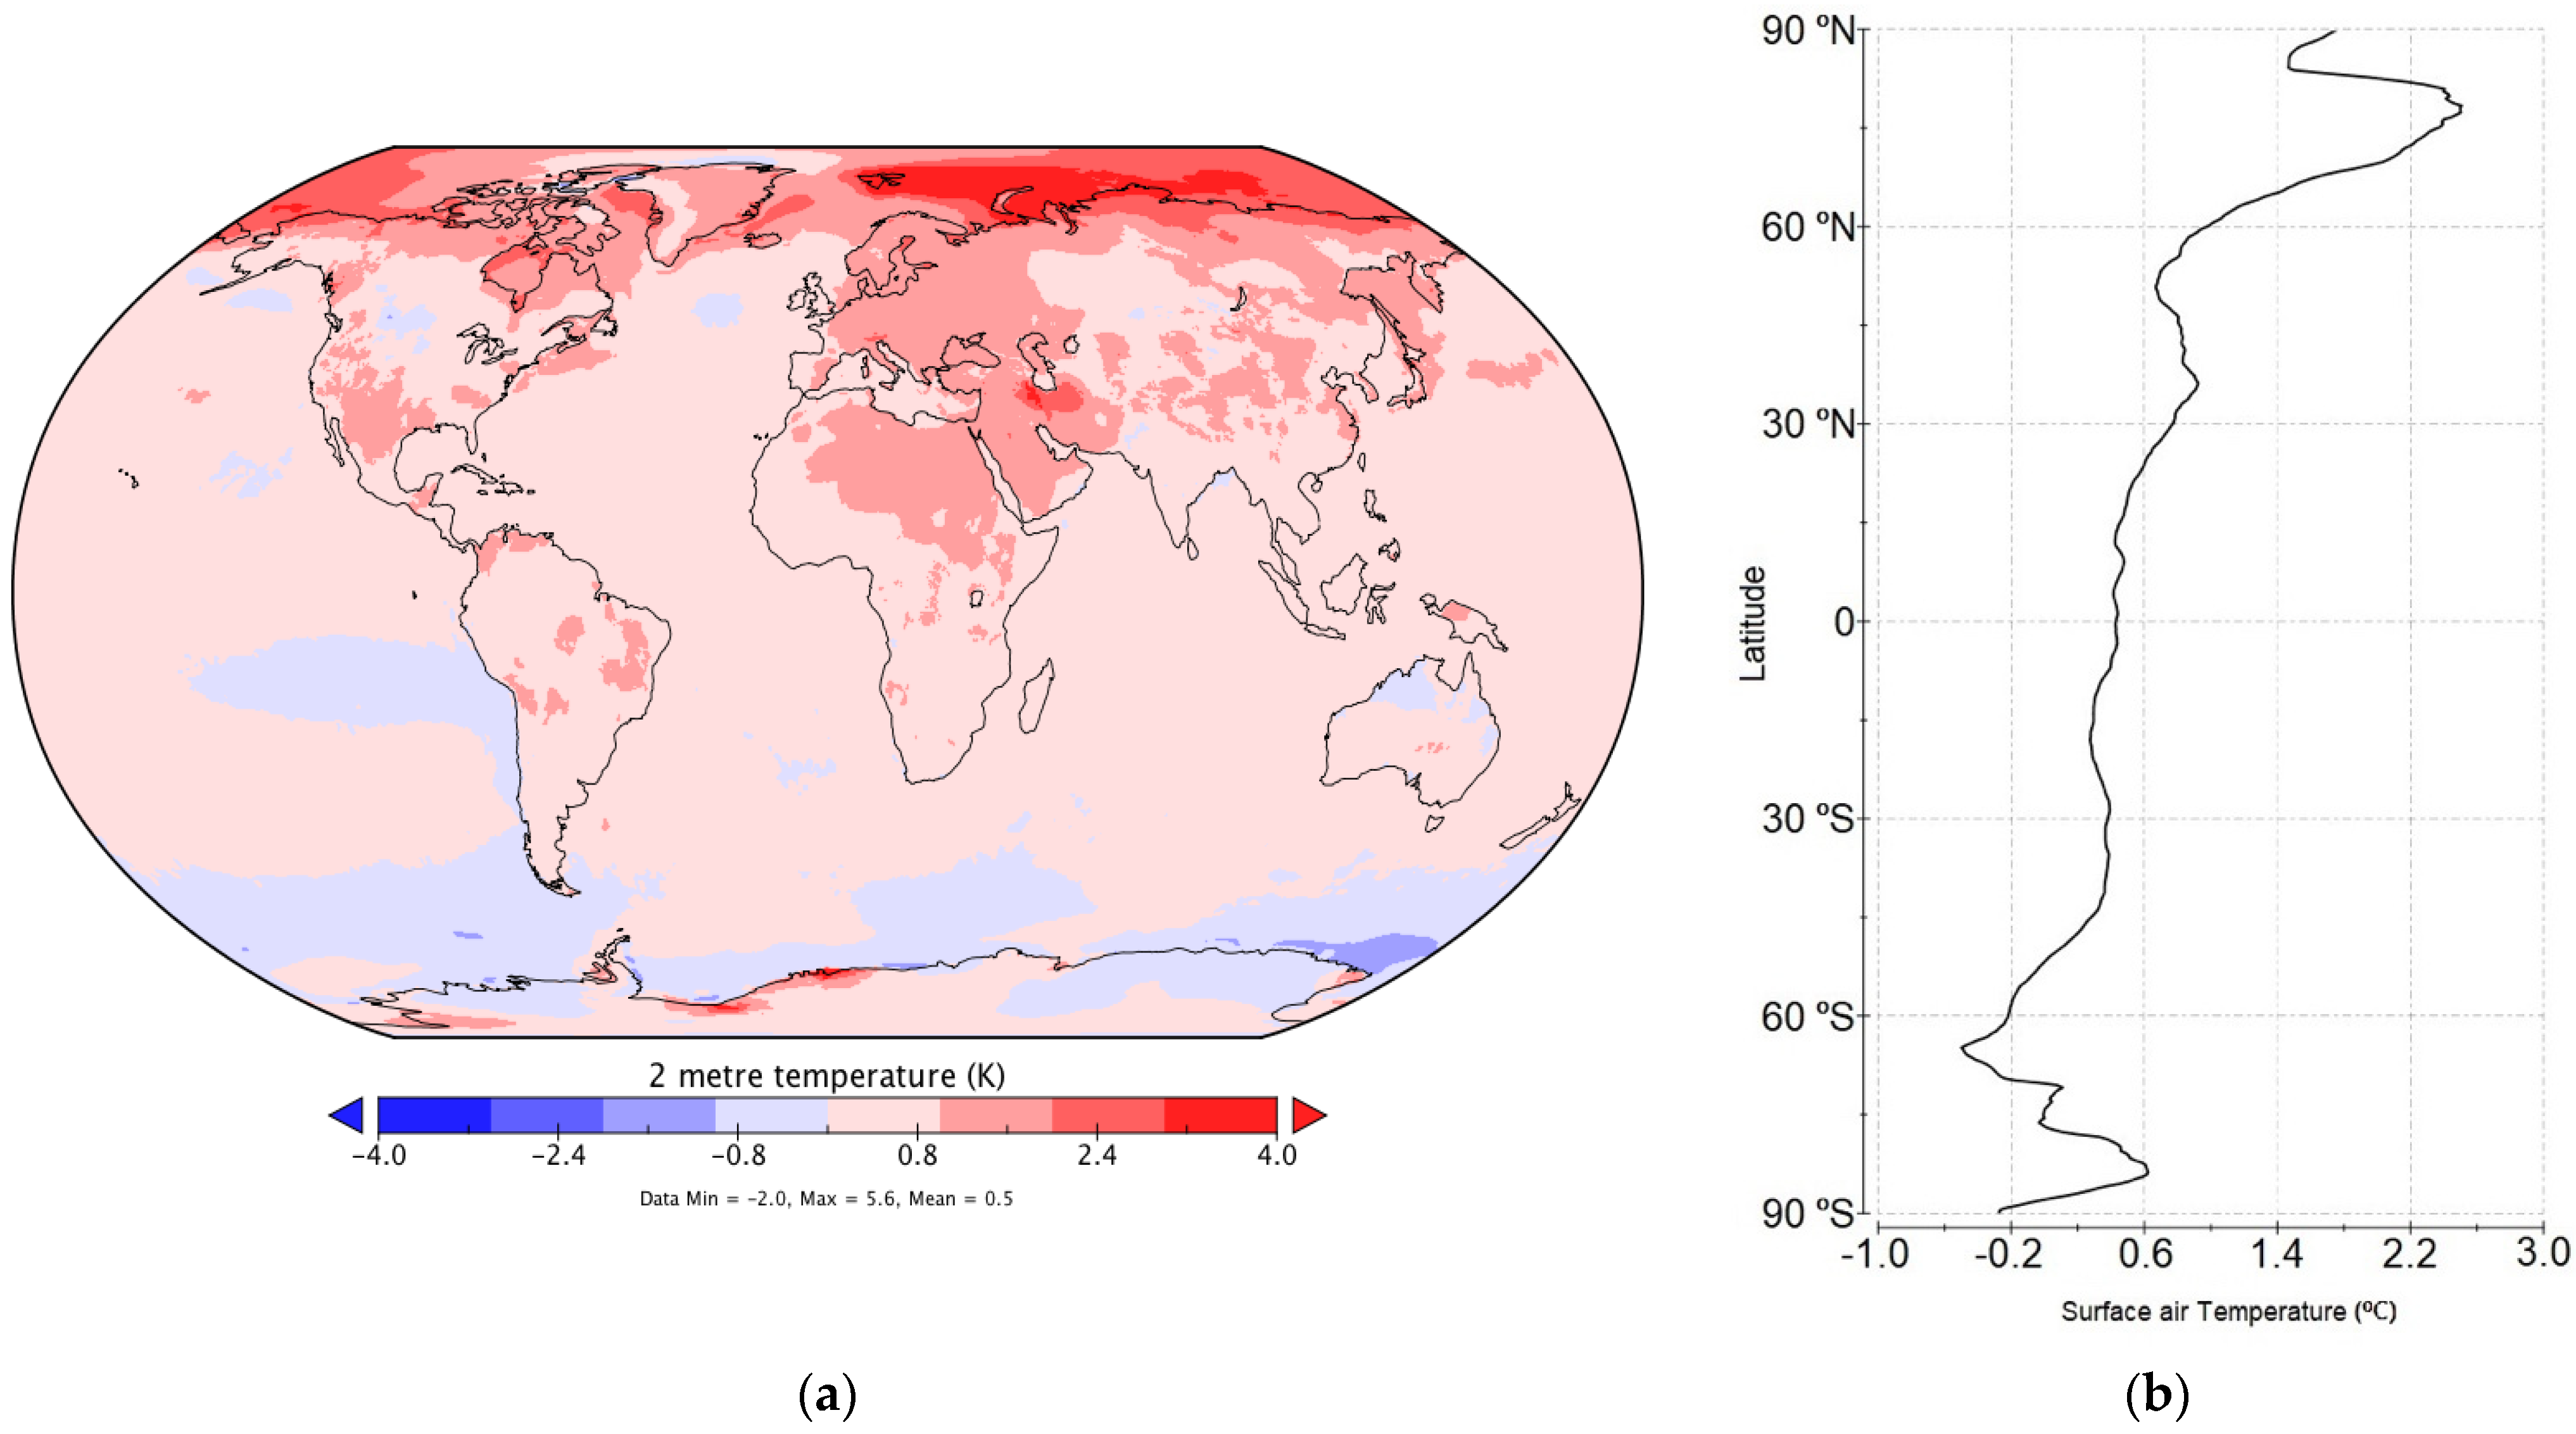
The darker reds in the Arctic are the areas most likely to see a substantial increase in heavy precip events, while other areas should also see a slight uptick, modulated by outlier, naturally occurring meteorological events which are not the result of climate change.
https://www.mdpi.com/2073-4433/12/11/1494
Figure 2.(a) Global map of the polar amplification measure obtained from long-term observations of the near-surface air temperature (°C) for the 2010–2020 period relative to the 1980–1990 period. (b) Zonal mean of the near-surface temperature (°C) for the 2010–2020 period relative to the 1980–1990 period.
Back to the current Pacific Ocean and the La Nina being dead:
https://www.foxweather.com/weather-news/la-nina-over-el-nino-looms
Previous discussions:
Good bye La Nina
16 responses |
Started by metmike - Jan. 19, 2023, 10:05 p.m.
Latest ENSO discussion:
ENSO: Recent Evolution,
Current Status and Predictions
"But observed sea surface temperatures over the same time period have shown a surprising cooling trend in the Eastern Pacific Ocean while the rest of the rest of the world’s waters steadily get warmer."
----------------
It wasn't surprising at all because that cooling was because of La Niña as of late 2022. That is already changing drastically as La Niña has ended.
Thanks, Larry.
I updated the data above with some links links because the links in my records from when I obtained them no longer work.
On this one with Pacific Ocean temps, the data was thru 2014, so this current very long lived La Nina would not be a factor.
New links:
https://thebulletin.org/2022/12/whats-wrong-with-these-climate-models/
+++++++++++++++++
The link with all the US rainfall records no longer exists and there is no place to be found that carries it but fortunately, I copied the data already......so I'm the only source (-:
https://www.marketforum.com/forum/topic/93716/#93719
Larry,
In doing the search for more rainfall records, I stumbled on some great info.
An extreme word of caution that I have is that the person that runs this site, Jeff Masters(that I graduated with at the U of Michigan and got better grades than me) is a climate crisis alarmist. Data is data, regardless of the source.......but sometimes it can be manipulated or be different based on what the source intends to show.
In the graphs below that are both representing the same thing...... yearly rainfall in the US, there are some contradictions that you can see if you eyeball the graphs.
For example, on the first graph with the record rainfall year in the late 1950's(wettest in history to that point-almost 34").
The same year on the 2nd graph shows less than 32" and just slightly above average.
Regardless, they both show the increase of precipitation with time that can't be denied but I don't trust this source because of observing them showing extremely biased, one sided data so many times and never showing data that contradicts the climate crisis narrative.
https://www.wunderground.com/cat6/us-precipitation-1901-2019-a-decade-by-decade-look
From the link above from this source:

From this same source but from a previous link:
https://www.wunderground.com/cat6/Summary-US-State-Historical-Precipitation-Extremes
Instead of just using words to make that accusation about Weather Underground, I'll show you what I mean:
Bob Henson · August 6, 2019, 11:09 AM EDT
https://www.wunderground.com/cat6/New-Models-Point-More-Global-Warming-We-Expected
One of the new models, the second version of the Community Earth System Model (CESM2) from the National Center for Atmospheric Research (NCAR), saw a 35% increase in its equilibrium climate sensitivity (ECS), the rise in global temperature one might expect as the atmosphere adjusts to an instantaneous doubling of atmospheric carbon dioxide. Instead of the model’s previous ECS of 4°C (7.2°F), the CESM2 now shows an ECS of 5.3°C (9.5°F).
“The model runs aren’t all available yet, but when many of the most advanced models in the world are independently reproducing the same disturbing results, it’s hard not to worry,” said Gergis.
+++++++++++++++++
This is a scientifically laughable crock of ____ A clear example of the ANTI scientific method and shows how climate science has been blatantly hijacked/corrupted and unfortunately dominated by biased/flawed scientists serving as gatekeepers of the false narrative messages, like at this site.
https://www.marketforum.com/forum/topic/93687/#93702
https://www.marketforum.com/forum/topic/93687/#93704
https://www.marketforum.com/forum/topic/93687/#93705
https://www.marketforum.com/forum/topic/93687/#93706
If you really think about what's happened here........they're taken the current climate optimum for life on this greening planet, with the best weather/climate in over 1,000 years(the last time that it was this warm), mostly because of the increase in the beneficial gas, CO2.
The CO2 is being emitted by the energy source that his lifted humanity out of poverty and gifted all the developed countries with the economies we have today that feature incredibly advanced technology and medicines. Directly responsible for our wonderful quality of life.
The same fossil fuels that are used to make all the synthetic fertilizer in the world which is responsible for 50% of the world food production. CO2, an atmospheric fertilizer, along with the best crop growing weather in history are responsible for even higher yields/food production and much more food for animals with the planets booming biosphere.
And they have turned this into a fake climate crisis caused by pollution =CO2 that they are using for political agenda, fake green energy wrecking the planet for crony capitalism, sensationalism boosting ratings/sales and corrupted, biased scientists taught to believe in absurd, theoretical global climate models that are diverging from the real world more every year.
All because this false narrative carries so much weight in people's mind that it scares them so much that it trumps their common sense and desire to fact check and/or use critical thinking.
"We have to act now to SAVE THE PLANET"
https://www.marketforum.com/forum/topic/92155/#92347
Who could possibly be against this???
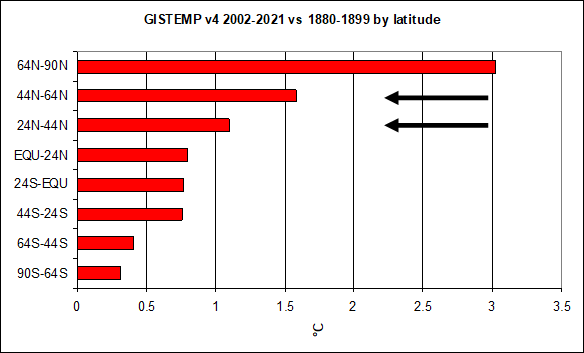
This graph shows the global warming by latitude which would also correlate to the increase in precip potential going higher with latitude.
A great deal of people live in the N.Hemisphere in the area that has seen a 1+ deg C temp increase that equates to the atmosphere being able to hold 7%+ more moisture.
So the atmospheric physics/meteorology indisputably links the additional rains in the extreme events by that amount.........everything else being equal.
Not 70% but more like 7%. A 10 inch rain, for instance can become a 10.7 inch rain because of climate change. NOT a 17 inch rain.
We should keep in mind that in the late 1800's, the planet was still recovering from the Little Ice Age and some of the warming above was NOT from increasing CO2.
Also keep in mind that this warming is most in the coldest places of the N.Hemisphere, mainly during the coldest times of year. This clearly DECREASES the temperature gradient which DECREASES several elements of weather that cause extreme precipitation.
This would COUNTERACT the effect of the atmosphere holding more moisture in some instances by reducing the conditions for extreme weather events.
Generally, American agriculture is more damaged by La Nina than El Nino. If the globe jumps into El Nino it means more rain for the Midwestern corn belt and grains in general and could be beneficial, said Michael Ferrari, chief scientific officer of Climate Alpha, a firm that advises investors on financial decisions based on climate.
++++++++
Climate change has featured more El Nino's the last 4 decades, with this long lived La Nina being an exception.
All those El Nino's with the beneficial slight global warming and uptick in beneficial CO2 caused the best 4 decades of growing conditions in the US since we've been able to measure weather. Best climate/weather for life on this greening planet.
Looks like the last powerful jet streak/max with this spell of active weather will be coming thru with this current storm.
The lastest 12z GFS at 250 mb below. This is around 34,000 feet up. There's a small segment that features and epicenter of red shade. That represents 150+ knots, which is 180+ mph.
Winds not as strong with the jet stream looking upstream across the eastern and central Pacific.
The atmosphere has often acted like a full fledged El Nino since January because the big CHANGE induced from the rapidly dying La Nino has imparted El Nino characteristics to the atmospheric flow.
Previous discussions:
Good bye La Nina
16 responses |
Started by metmike - Jan. 19, 2023, 10:05 p.m.
When we get into April, the seasonal changes to the jet stream make stormy weather in California less and less likely.
This may be the last hurrah with regards to MAJOR storms.
Last of the big storms for this go round has hit the West Coast but still more precip the next 2 weeks.
All the weather here:
https://www.wunderground.com/cat6/March-Weather-Madness-Most-Extreme-Month-Year
On March 27, 1984, Brownsville, Texas, recorded its hottest temperature on record (for any month) with 106°F. This is the only major site in the U.S. to have measured their hottest temperature on record during the month of March. As for cold, the only significant site I’m aware of that has broken its all-time coldest temperature during March is Waterloo, Iowa, with a –34°F reading on March 1, 1962 (later tied on January 16, 2009). There is no other month of the year in the contiguous U.S. that has seen at least one all-time record high and all-time record low temperatures broken.
+++++++++++++++
metmike: The most extreme heat waves by far were during the Summers of the 1930's.
1936 was the worst:
https://en.wikipedia.org/wiki/1936_North_American_heat_wave
Summer (June–August) 1936 average temperature, in degrees Fahrenheit. Record warmest and coldest is based on a 112-year period of records (1895–2006).[1]

Summer (June–August) 1936 precipitation, in inches. Record wettest and driest is based on a 112-year period of records (from 1895 until 2006).

Plot of NOAA/NCDC state high temperature records by decade with atmospheric CO2 concentration overlaid. From C3 Headlines with thanks – click to visit website
+++++++++++++
Note that almost all that record smashing extreme weather above was well BEFORE climate change happened.
Soilmoisture anomaly:
These maps sometimes take a day to catch up to incorporate the latest data(the bottom map is only updated once a week).
https://www.cpc.ncep.noaa.gov/products/Soilmst_Monitoring/US/Soilmst/Soilmst.shtml#
![]()


++++++++++++++++++++++++++++
https://mrcc.purdue.edu/cliwatch/watch.htm#curMonths

https://droughtmonitor.unl.edu/
Drought Monitor:
March 21, 2023

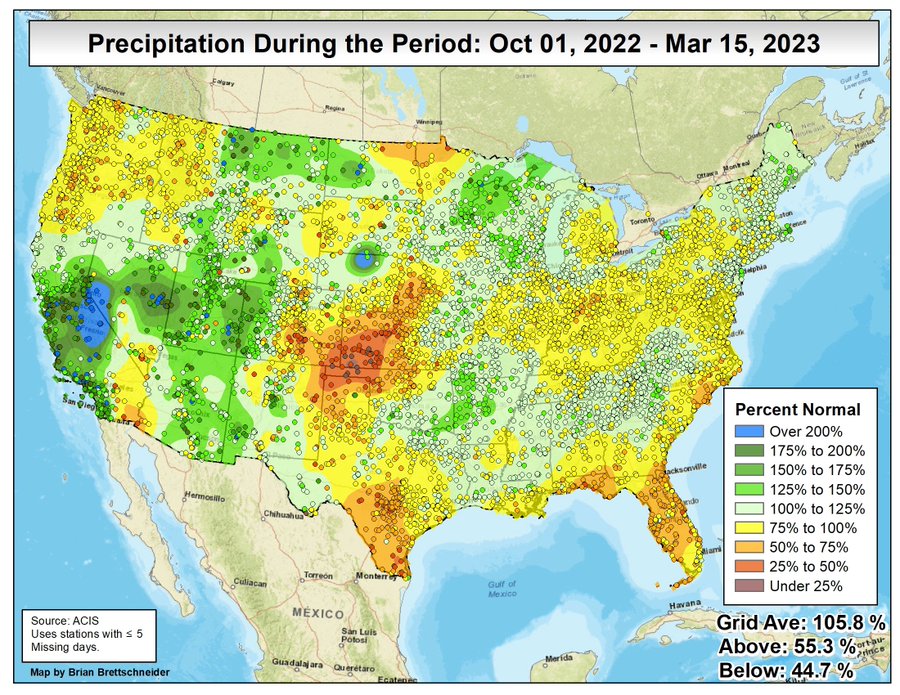
Drought monitor previous years: You can see the natural La Niña, (cold water-in the tropical Pacific)causing the drought! Starting in 2020, then worsening for 2+ years!
The ending of La Niña in 2023-heading towards El Nino, is causing the opposite weather-bombarding us with moisture.…..too much in some cases. This is a natural cycle NOT climate change!
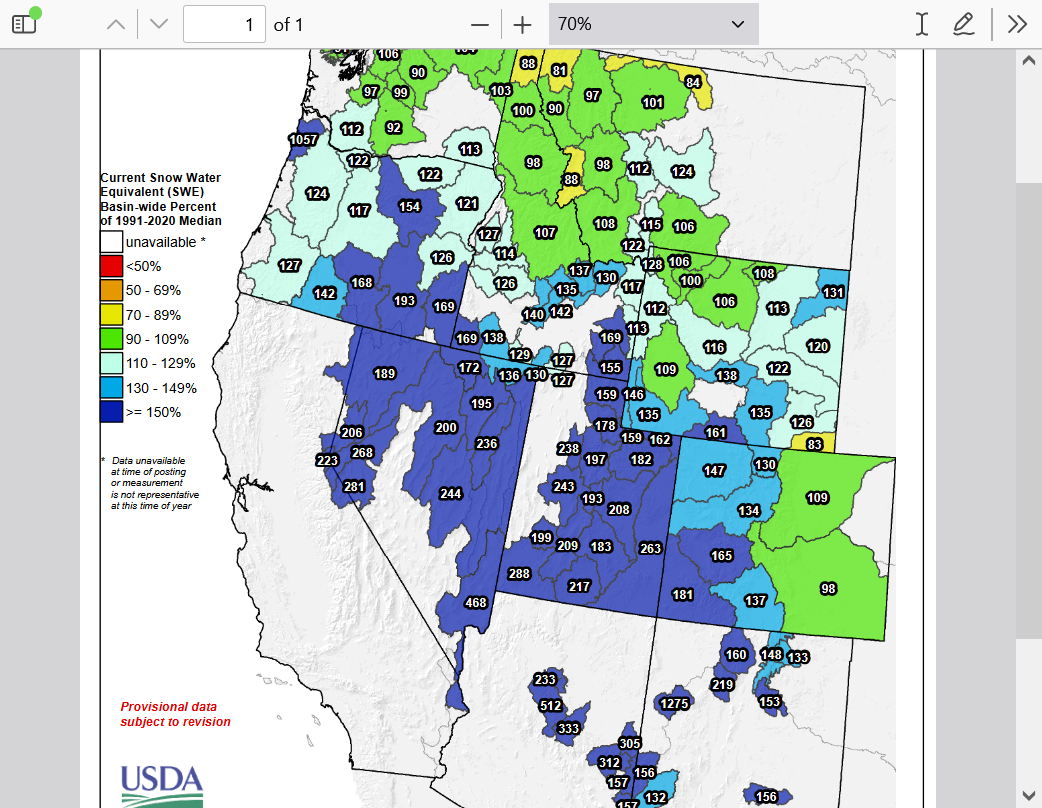
Highest snow pack in the last 10 years for the Southwest with more on the way.
This is astounding and just what the drought doctor ordered!
Why only reporting on how extreme and bad this is by media?
That doesn't sell!
This is mainly thanks to the global warming pattern/El Nino kicking in again in the Pacific after the pause caused by the La Nina(cold water in the tropical Pacific) which caused the drought....is over!
Climate change INCREASES precip!
https://www.wcc.nrcs.usda.gov/ftpref/data/water/wcs/gis/maps/west_swepctnormal_update.pdf
The tornado adds to the latest bout of extreme weather California is experiencing.
https://www.vox.com/science/2023/3/23/23653712/los-angeles-tornado-montebello-california
There have been growing instances of extreme weather worldwide over the last few decades, with a 2020 United Nations report noting a huge uptick in major natural disasters from 2000 to 2019, compared to previous decades. That report attributed a surge in instances of flooding and storms to global warming.
While climate change’s relationship to these tornadoes is uncertain, what is evident is that thunderstorms and tornadoes of this magnitude are uncommon in this region, and that this week’s events were a product of the right conditions being in place. Those include warmer, humid air near the ground and drier, cold air higher in the atmosphere. The warmer air contributing to recent extreme weather could also become more common as global warming worsens, as could storms. Climate change leads to warmer air, and “warmer air can hold more moisture,” which can mean more precipitation, per the New York Times.
+++++++++++++++++++++++
HOGWASH!!!!!!!!!
https://www.marketforum.com/forum/topic/92155/
https://www.marketforum.com/forum/topic/93926/
They just keep vehemently violating the indisputable authentic science to support the politically manufactured/fake climate crisis.
From Dr. Cliff Mass:
https://www.marketforum.com/forum/topic/88225/#88226
https://cliffmass.blogspot.com/2016/03/the-golden-rule-of-climate-extremes.html
++++++++++++++++++++++++++
Considering the substantial confusion in the media about this critical issue, let me provide the GOLDEN RULE OF CLIMATE EXTREMES. Here it is:
The more extreme a climate or weather record is, the greater the contribution of natural variability.
Or to put it a different way, the larger or more unusual an extreme, the higher proportion of the extreme is due to natural variability.
+++++++++++++++++++
There have been 469 tornadoes like this one in California, with 90 injuries and no deaths because they are always WEAK tornadoes, like this one with winds around 100 mph.
https://data.redding.com/tornado-archive/
The tornadoes that kill 90% of people have winds of 200+. It's impossible for the atmospheric dynamics to have a tornado like this in California.
Many more weak tornadoes have been detected by Doppler radars that can see the wind, that were installed in the US in the 1990's.
The strong/violent tornadoes have DECREASED because of climate change as a result of the warming of the higher latitudes, with less temperature contract and weaker jet streams.
Reposting this 2019 blog post by Dr. Roy Spencer.
May 29th, 2019 by Roy W. Spencer, Ph. D.
https://wattsupwiththat.com/2021/12/12/recent-tornadoes-are-due-to-unusually-cold-weather/

https://www.deseret.com/utah/2023/3/24/23655000/utah-friday-storm-snowpack-record
https://www.nohrsc.noaa.gov/nsa/


| North Dakota Snow Depth and Snow Accumulation |
https://www.weatherstreet.com/weather-forecast/north-dakota-snow-cover.htm
++++++++++++++++
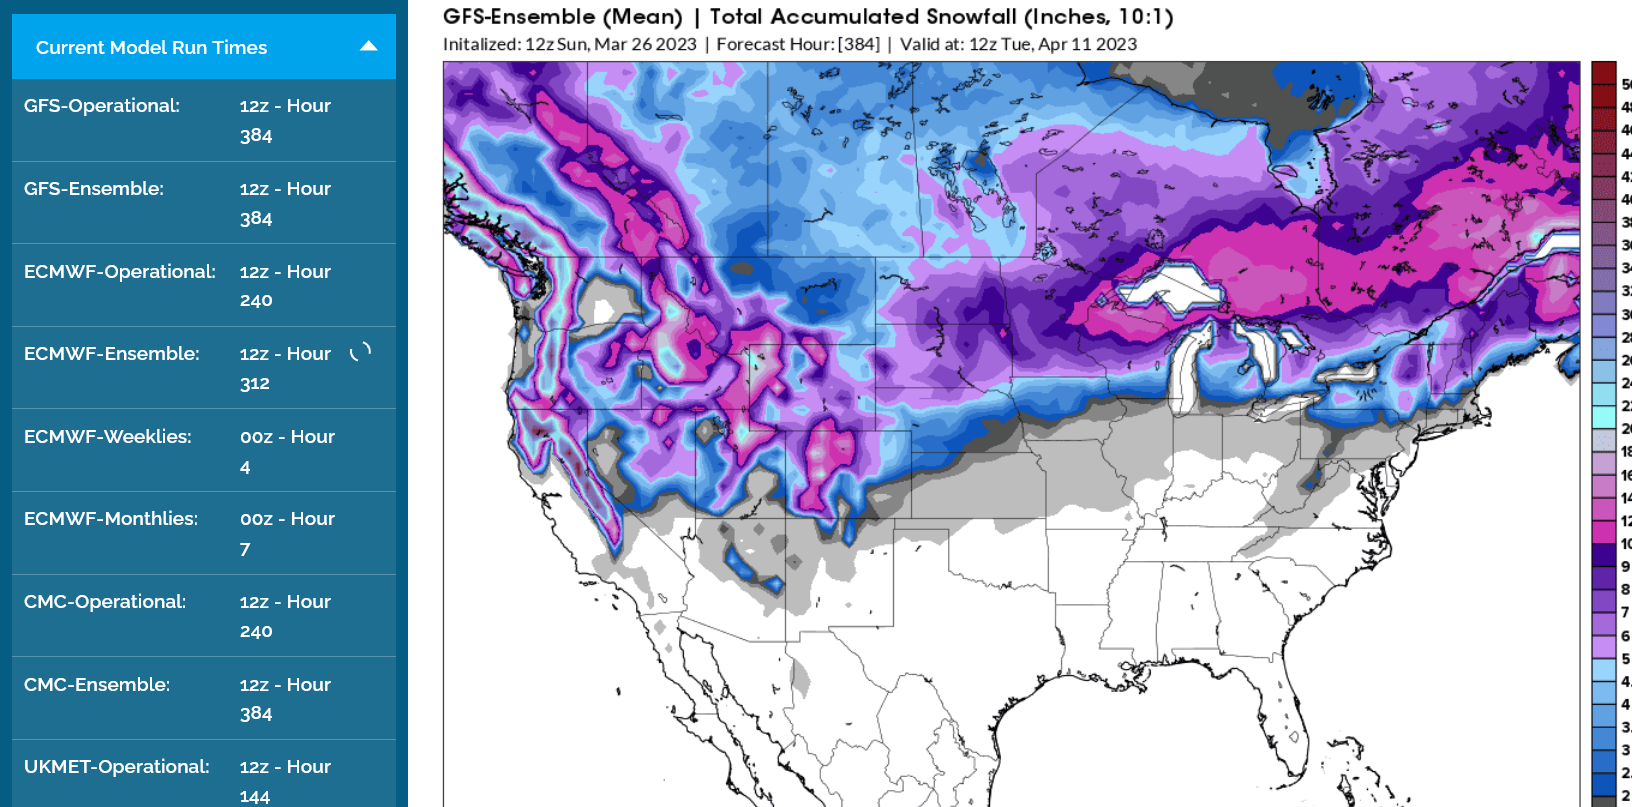
Total snow forecast the next 384 hours from the 12z GEFS model:
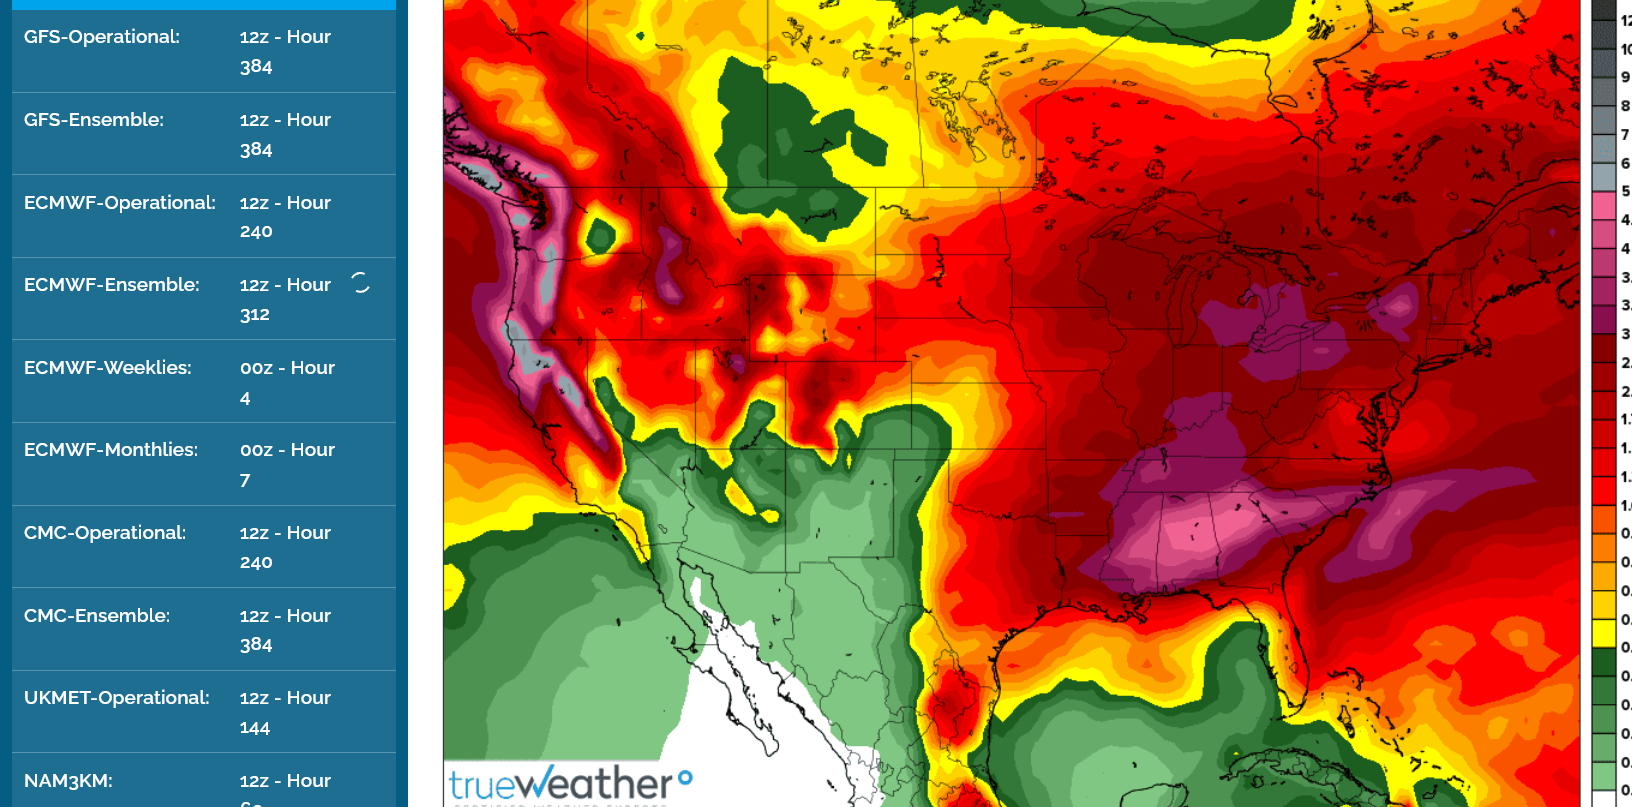
Total liquid equiv. precip from that model:
Robust amounts many places, especially West Coast but also
The last year with MAJOR planting delays was 2019(before the La Nina caused dryness). Here's a great thread capturing the dynamics and thinking then:
Grains June 3
24 responses |
Started by metmike - June 3, 2019, 7:53 p.m.