Met Office spokesman Grahame Madge said it was "potentially a very serious situation", with a 50% chance of temperatures reaching 40C - likely along the A1 corridor, running from London northwards towards Yorkshire and the North East.
The highest recorded temperature in the UK was 38.7C in Cambridge in 2019 and BBC Weather presenter Matt Taylor said there is now a realistic possibility of hitting 40C in the UK.
Thanks much Larry!
Very impressive.
This IS the climatologically hottest time of year in the Northern Hemisphere.
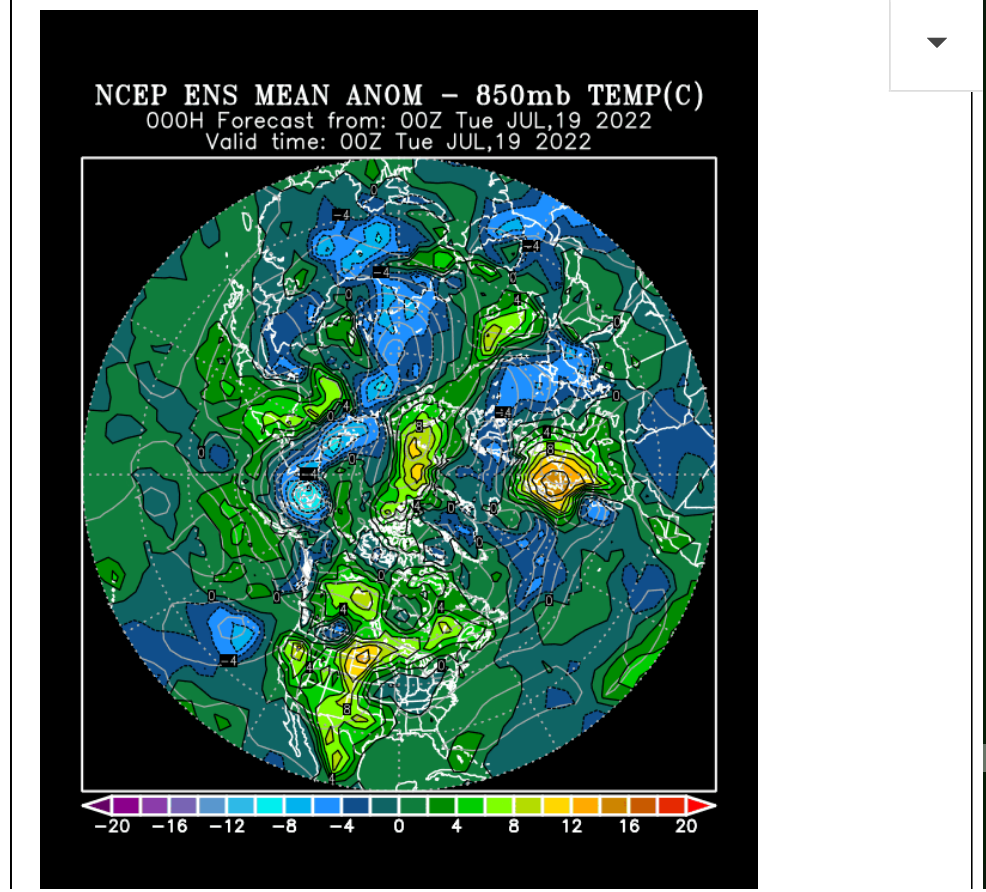
On the last NCEP Ensemble model below for global 850 temperatures late this weekend(1 mile up), you can see the isolated positive (hot) anomaly over that spot.
There are 2 other hot spots on the planet. A very small one over the N.Pole and a HUGE one in the US, from the West Coast to the Plains to S. Canada, (from the weather pattern in the US caused by the cool water anomaly in the E/C tropical Pacific/La Nina).
These warm/cold anomalies(extremes) are on the map 365 days a year, often much greater than this one, especially in Winter, almost entirely from weather patterns.
Since this is exactly the hottest time of year, any such weather anomalies on the planet have a great chance to be the "hottest ever".
When you superimpose +0.9 Deg. C of global warming (in the UK) from increasing CO2 on top of that, it contributes a potential +2 deg. F warmer than the world 100 years ago based on all other things being held constant.
https://www.psl.noaa.gov/map/images/ens/ens.html#nh
https://www.psl.noaa.gov/map/images/ens/t850anom_f048_nhbg.gif
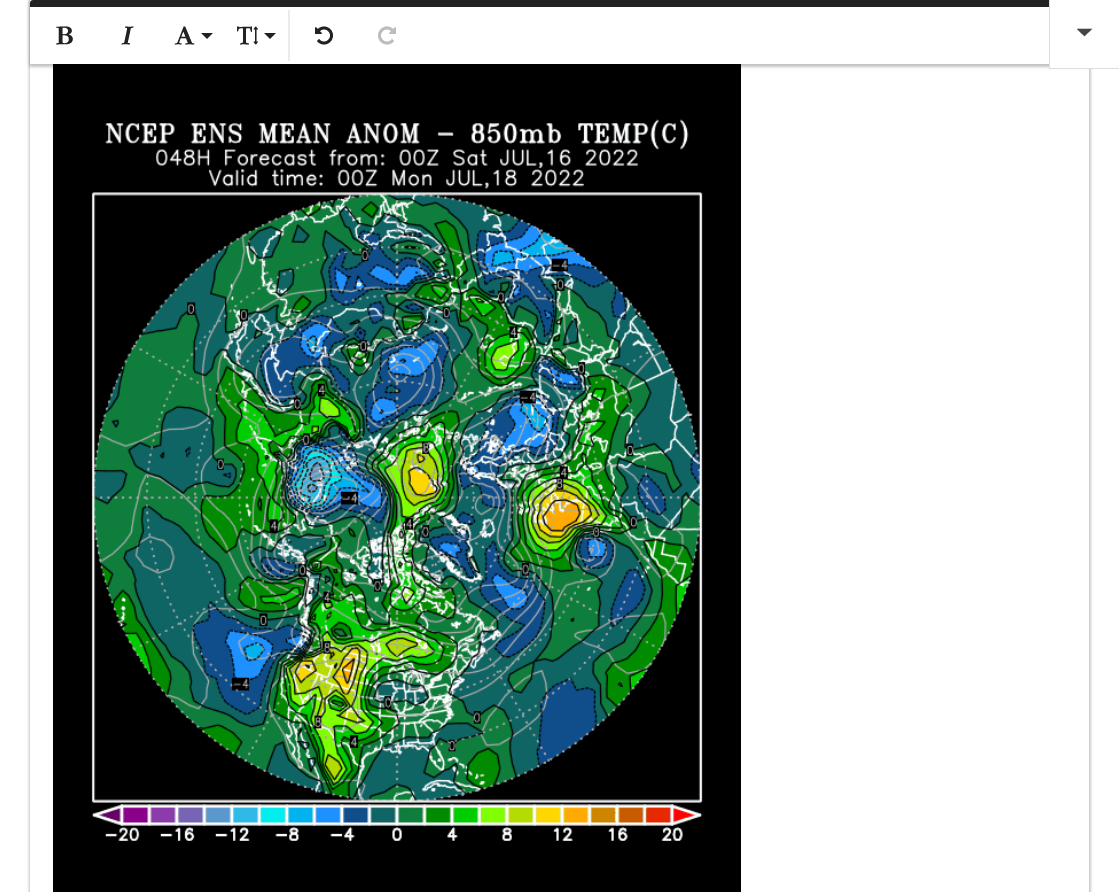
This is where the UK is.
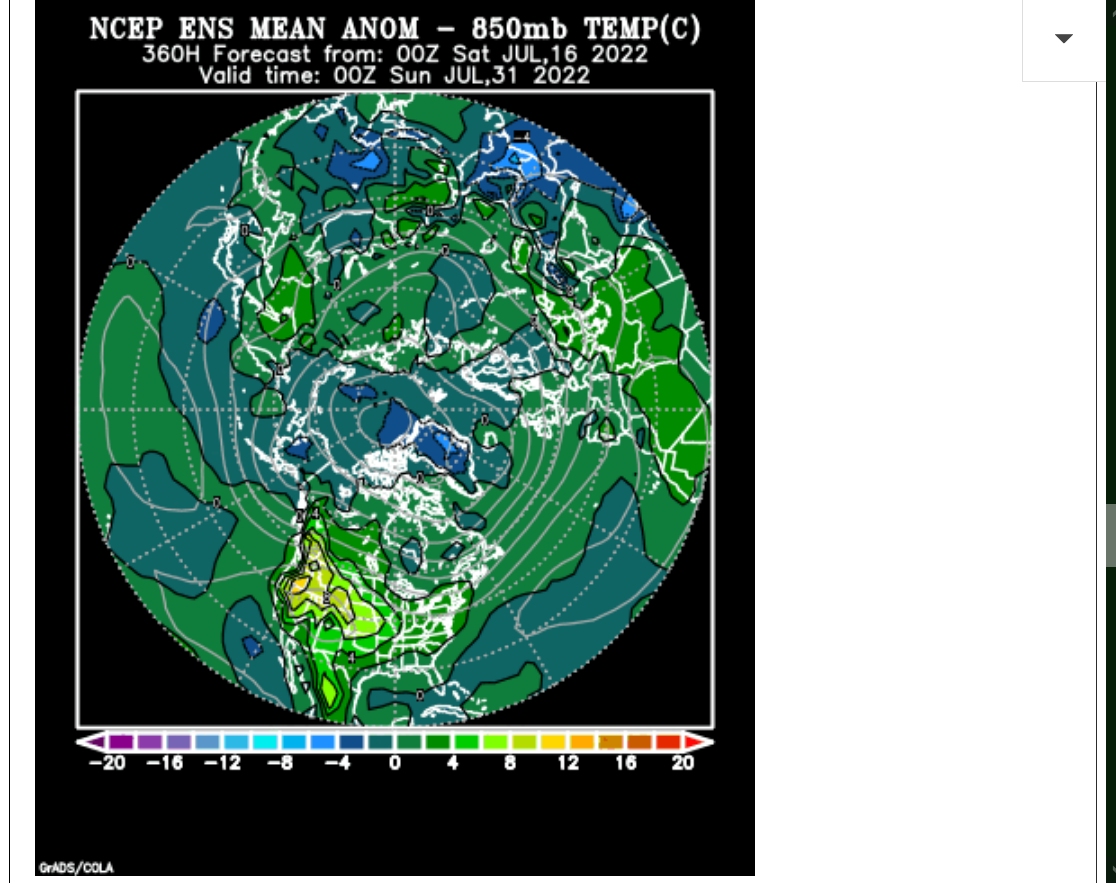
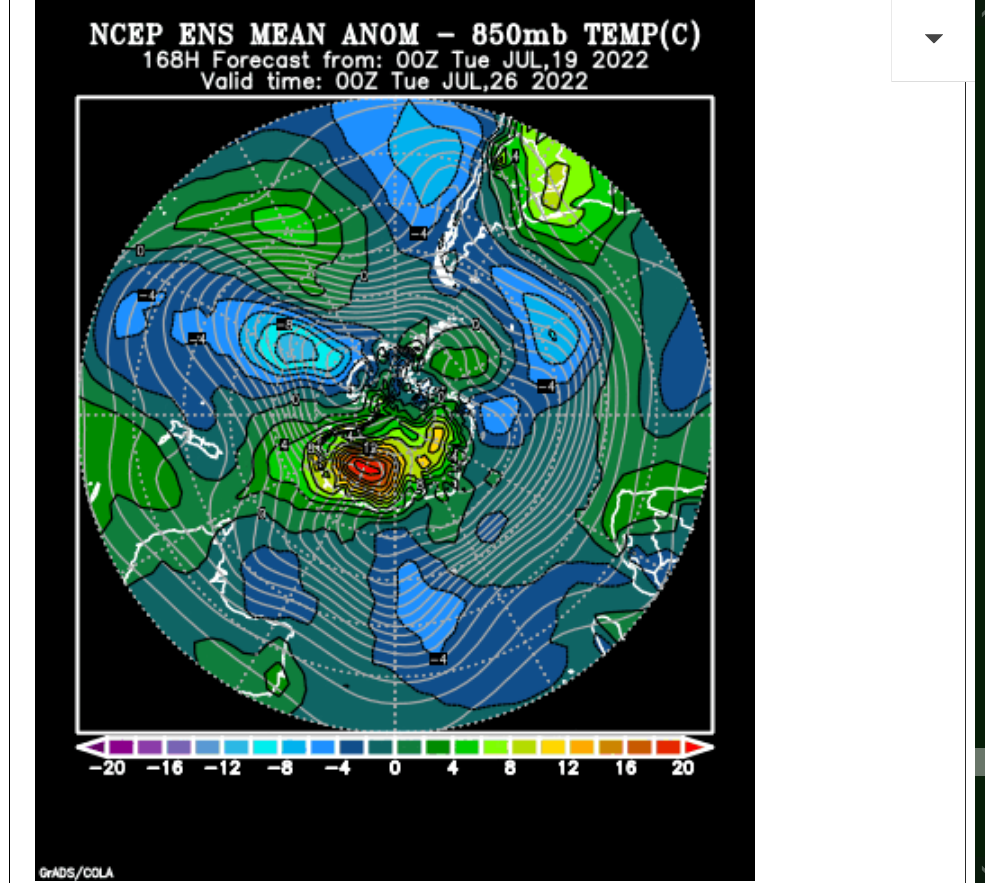
Here's the same anomaly map in 2 weeks.
Climatology washes out a lot of the extremes on models but there's no question where the huge heat wave is going to be raging.
https://www.psl.noaa.gov/map/images/ens/t850anom_nh_alltimes.html
Again, this Summer's hot/dry weather pattern(like the previous 3 Summers) has a strong correlation value to the current area of cooler than average temperatures in the C/E Pacific Ocean and the downstream impact on the US.
https://www.marketforum.com/forum/topic/83698/
https://www.marketforum.com/forum/topic/83698/#87038
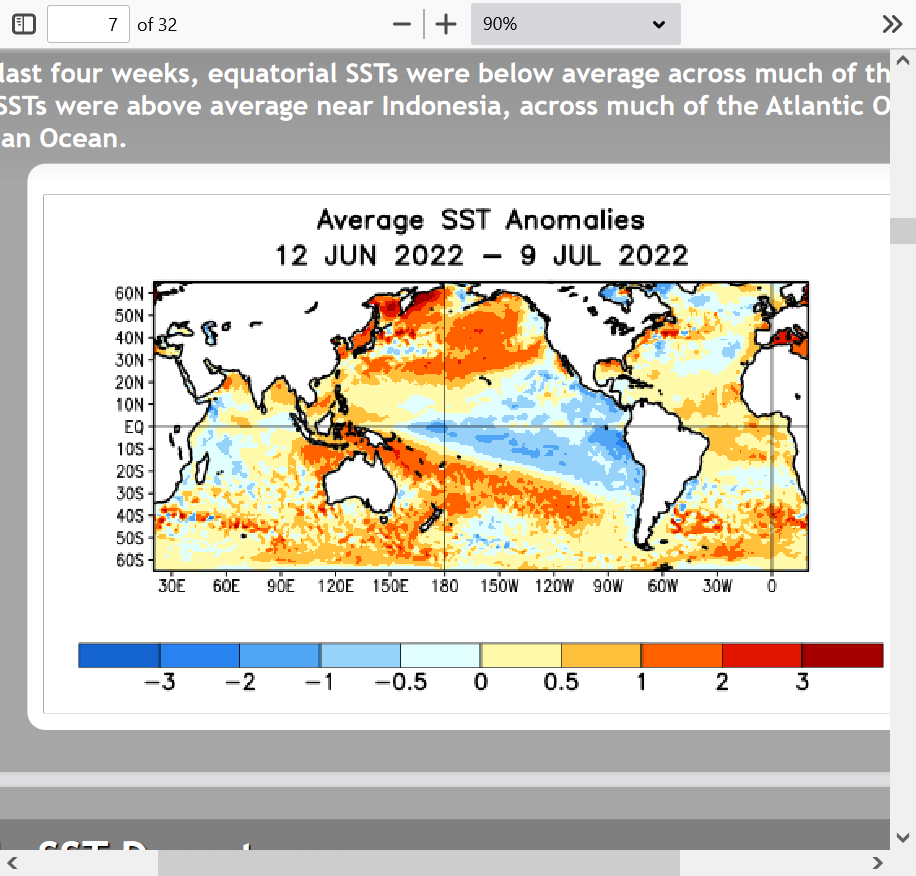
This is also why June temperatures in the tropics, were the coolest in 22 years.
Globally = +0.06 deg. C vs the 30 year average.
https://www.marketforum.com/forum/topic/86627/
Thanks, Mike.
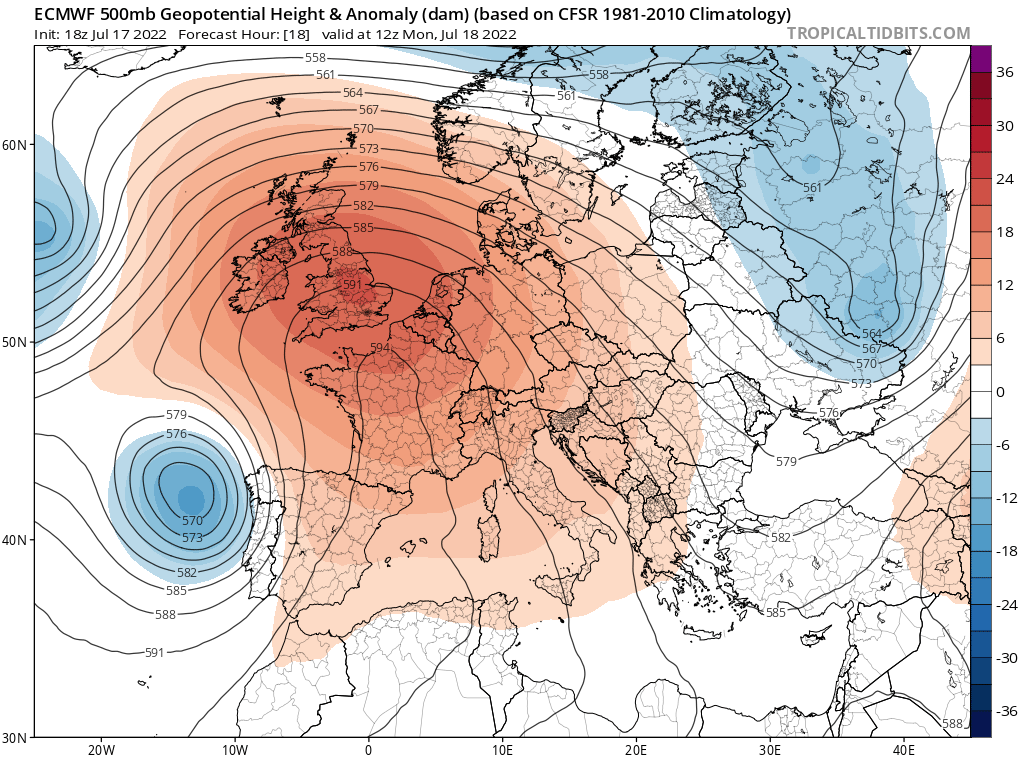
From the 18Z Euro, the peak 500 mb hts over southern England are near 592 dm at 12Z on 7/18/22:
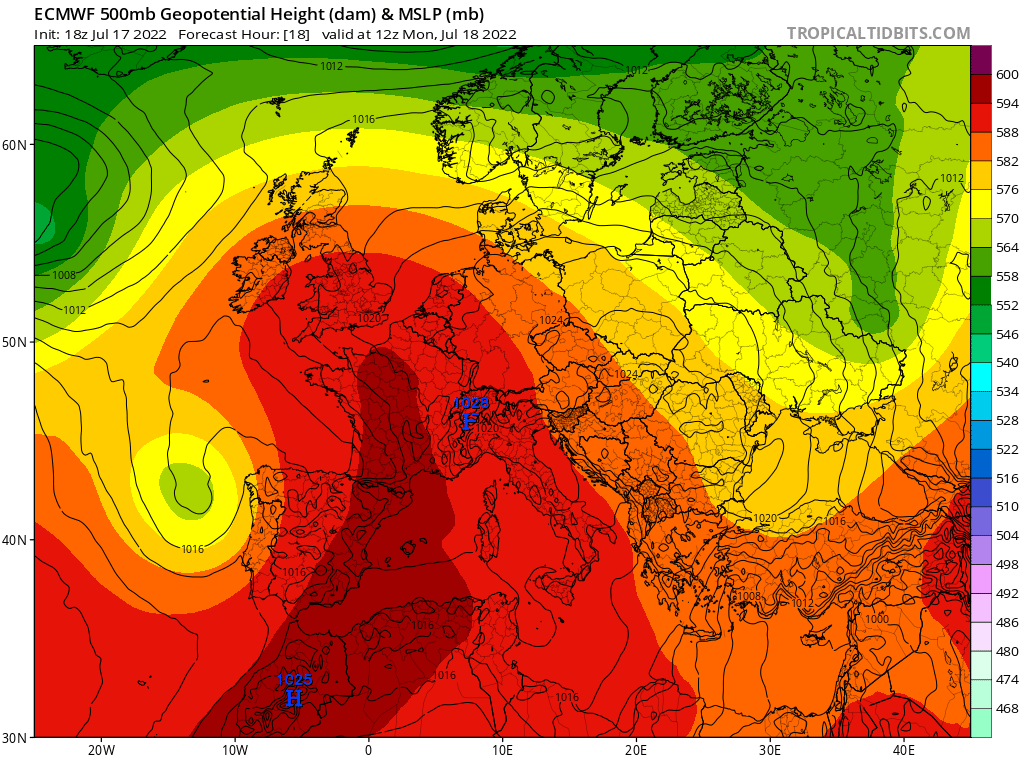
This is ~21 dm above the normal of ~571 dm:
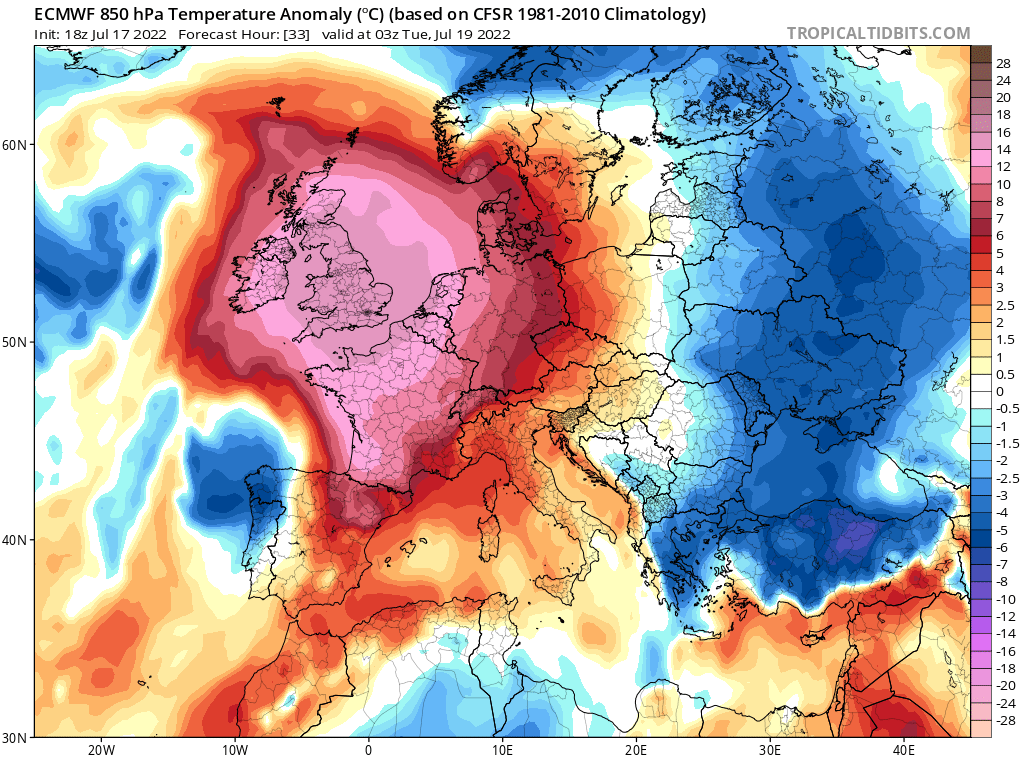
The peak 850 mb temp anomaly on the 18Z Euro over S. England is +15C to +16C (+27 to +29F) at 3Z on 7/19/22:
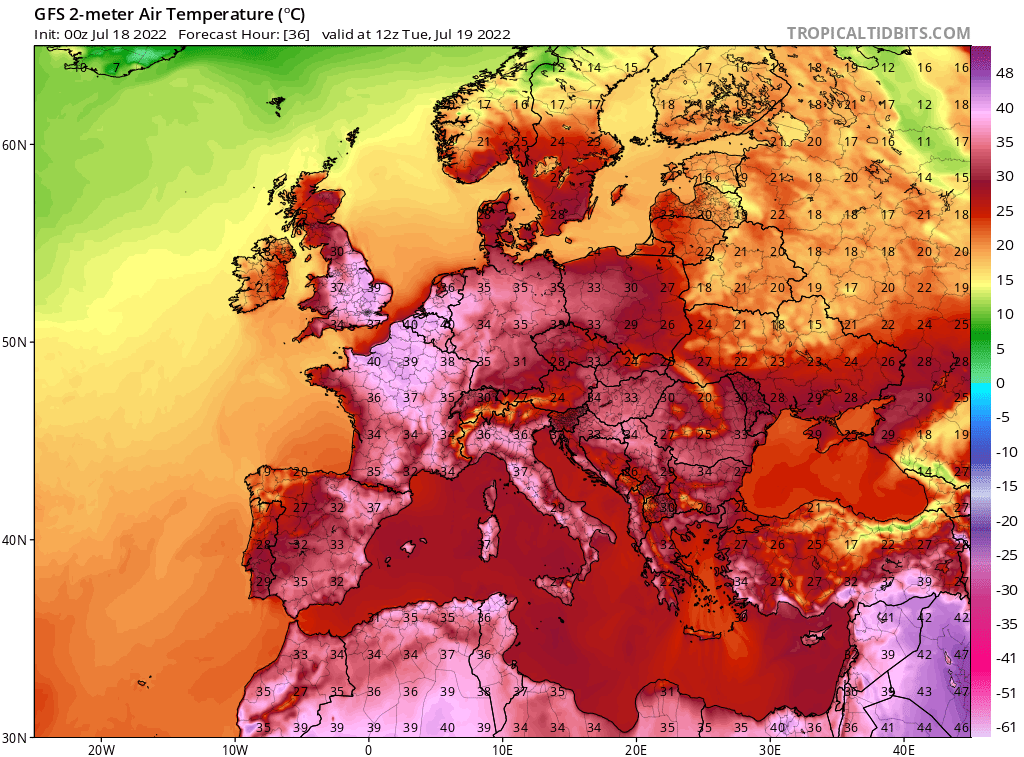
The peak 2M temperature on the 0Z GFS at London is ~+38C/+100 F as of 12z on 7/19/22 but the hottest would likely be near 15Z, which I don't have. The hottest on the 0Z GFS in S England at 12Z on 7/19/22 is near +40C/+104 F, but a 15Z map would likely be hotter: (I'm not familiar with what the GFS 2m temp bias is here.)
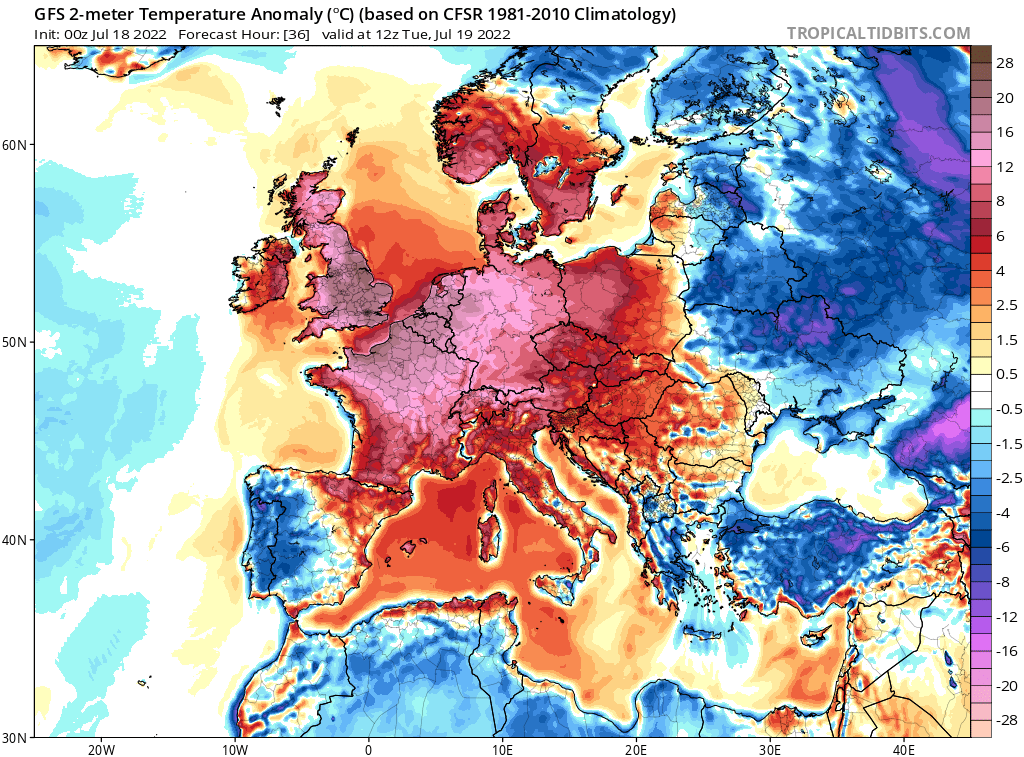
These 2m temp anomalies are +28 to +30F:
The all-time hottest daily low at London is +23.3C or 73.9F, set 7/29/1948. This has a good chance to be beaten on Tue 7/19/22 but we'll have to see if the temp drops back below that before midnight Wednesday:
https://en.wikipedia.org/wiki/Climate_of_London
This UK heat originated over N Africa and then traveled north to Spain with very little modification from the Mediterranean Sea due to traversing only a narrow portion of it. It will peak in W France on 7/18 before peaking in England on 7/19 on steady SSE winds meaning little modification from the English Channel. A surface low to the west of in combination with a surface high to the east is causing this hot wind flow. AGW is likely contributing several degrees to this heat as Mike said. In other words, without AGW, the same setup would likely result in the peak heat being several degrees cooler than what will occur. I'd love to see the maps for similar intense historic heatwaves to compare things like peak 500 mb hts, 850 mb temps, and surface features. I assume the setups would be similar.
Great stuff Larry!
It's odd in July to see extreme positive temp anomalies so close to extreme negative temp anomalies.
In Winter, not that unusual.
Obviously caused by an extraordinarily rare weather pattern/conditions.

Thanks Mike. Interesting observation about the big contrast!
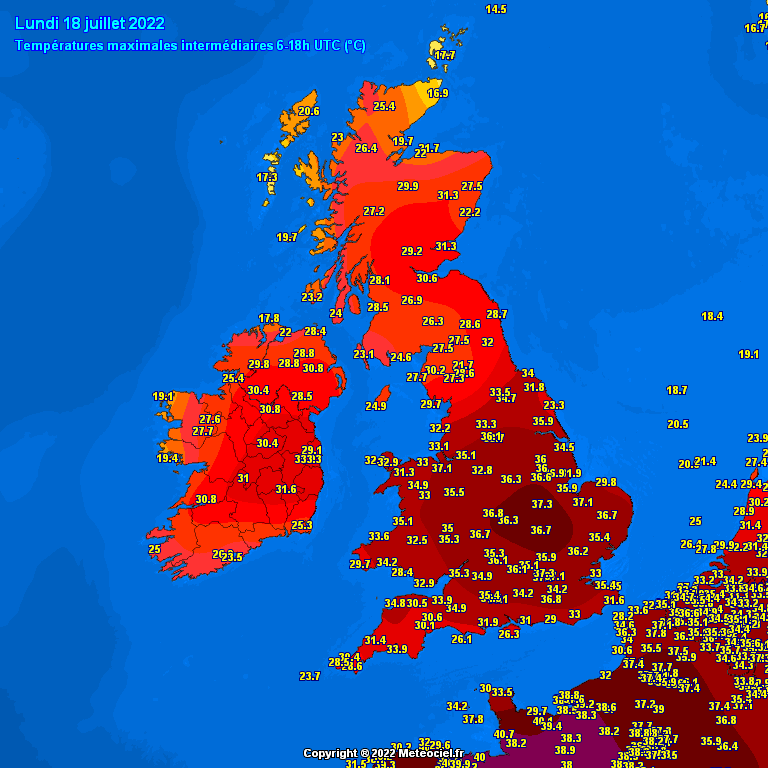
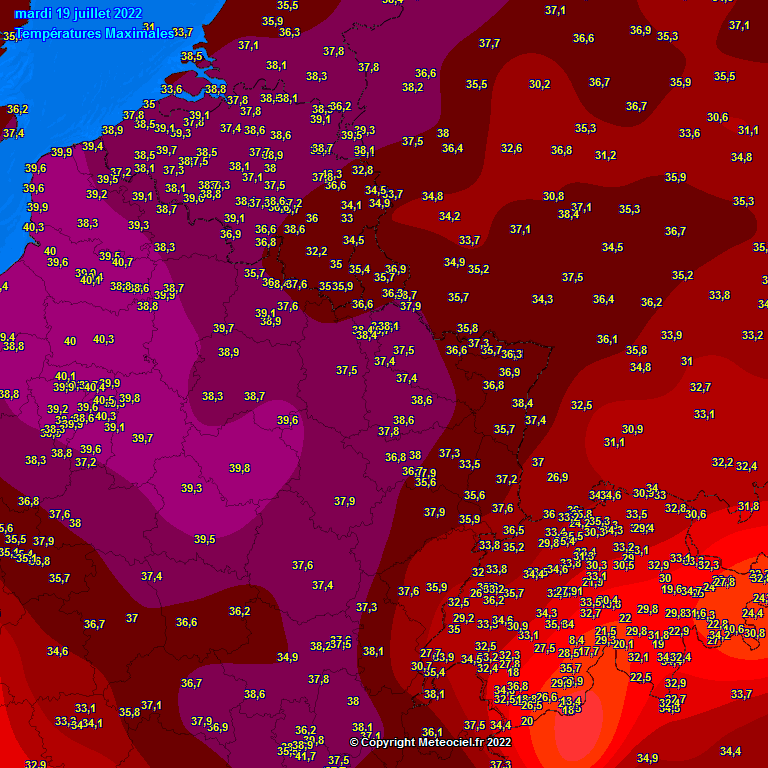
It appears that a new official record high for Wales was reached today at Hawarden in NE Wales at 37.1 C/98.8 F! The old record was 35.2 C/95.4 F at the same location 8/2/1990. So, today was a whopping 3.4 F warmer!
Below is the high temperature map. Note that Hawarden clearly sticks out as a hot spot in NE Wales as nearby stations are all 35.5 C or cooler. Some of the variation may be due to elevation differences as Hawarden is low and other differences may be due to more modification from nearby water. Regardless, the fact that the previous hottest Wales location today was 1.9 C/3.4 F hotter is all we need to know to realize the history made.
That's extremely hot for that area of the world!
I can tell how much you love the weather. Your like me. Sunny pleasant days near the average without much change are boring.
EXTREME weather is the most exciting and fascinating to analyze by an EXTREMELY wide margin.
Appreciate you sharing that with us Larry and me especially.
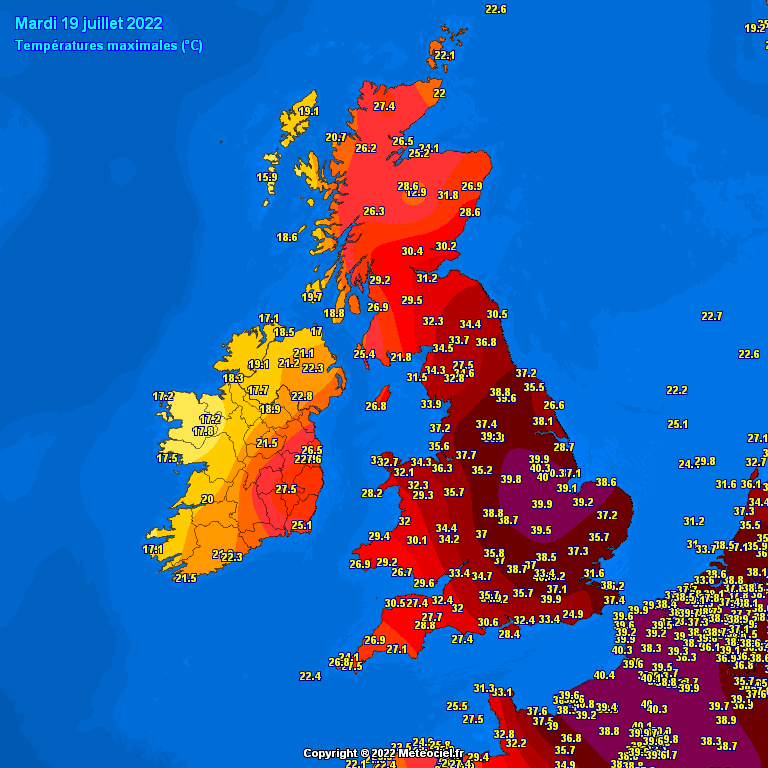
LONDON, July 19 (Reuters) - Britain recorded its highest ever temperature of 40C (104F) on Tuesday as a heatwave gripping Europe intensified, scorching fields and damaging airport runways and train tracks.
The Met Office said the provisional record, which still needs to be confirmed, was recorded at 12.50 pm (1150 GMT) at London's Heathrow Airport, surpassing the previous record of 38.7C recorded in 2019.
https://www.reuters.com/world/uk/after-warmest-night-britain-braces-record-temperature-2022-07-19/
So, it already hit 40C/104F at 12:50 PM, which is still 2+ hours away from their typical and forecasted hottest time of the day of 3-4 PM. So, the London high is more than likely going to end up even hotter than 40C! This is insane!
Wow!
Readers familiar with this map(which is probably just you Larry) will note that we have big positive extremes like this all the time..........IN THE WINTER.
This is the 850 temperature anomaly map that I like to use to see large scale blobs of heat/cold and track them thru 360 hours.
In the Summer, and especially right at the climatologically hottest week of the year over a high population area this is not as common of a weather dynamic.
+++++++++++++++++++++
The Southern Hemisphere is having their Winter right now and they have much more water vs the Northern Hemisphere, which makes anomalies like this less frequent/extreme(water doesn't warm/cool as much/as fast as land) but we have a typical big positive anomaly near the S.Pole/highest latitudes, similar to the typical big positive anomaly over/near the N.Pole in our Winter(much of it is caused by global warming, warming the coldest places the most, during the coldest times of year)
Related to heat vs cold related deaths in the UK.
This isolated weather event will add some deaths to the heat side, which during the past 2 decades has had an order of magnitude+ FEWER deaths than from cold deaths.

Larry,
I didn't want to bog down your thread on this forum with too much politics, so I started a new thread on this topic on the NTR forum that allows for ALL the politics:
Extinction Rebellion vandalize over lack of heat coverage
https://www.marketforum.com/forum/topic/87294/
I appreciate it, Mike.
Heathrow's all-time record high on 7/19/22 ended up at 40.2 C or 104.4 F.
At least 34 UK sites on 7/19/22 exceeded the old UK record of 38.7 C or 101.7 F!
7/19/22 map of UK highs:
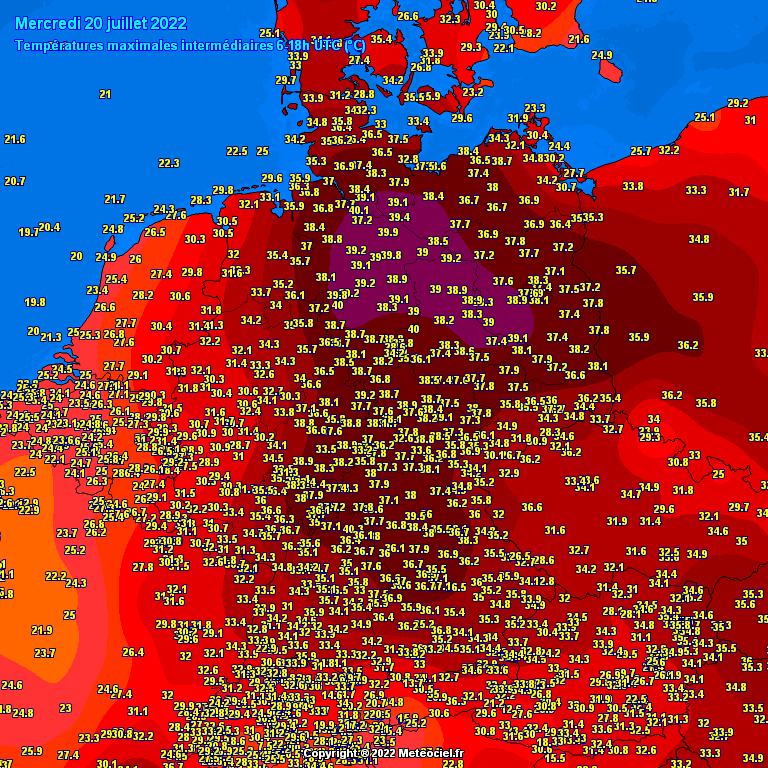
So as not to forget mainland Europe, below is a map of 7/19/22 highs showing much of France, Belgium, Luxembourg, southern Netherlands, and much of Germany with widespread highs from the upper 90s to low 100s F (37-40 C)! Although not posted, I should mention that Spain and Portugal were extremely hot earlier in the week as well as before that:
The UK will be much cooler on 7/20/22 (only a little warmer than normal) as this record heat is over there. Not to downplay it, but fortunately the extreme heat was only two days long. Then again when something is that extreme, it is hard for it to last that long.
However, areas further east like Germany may have their hottest day from this airmass on 7/20/22 while Poland has its hottest on 7/21/22.
Germany was the hottest country of this relentless European heatwave today (see image below). 40.3 C/104.5 F was the hottest and 7 of the 16 states set new all-time record highs within the 39.4-40.3 C range! However, the country's all-time hottest of 41.2 C, set 7/25/2019, wasn't reached.
Tomorrow is expected to be Poland's hottest day of this awful heatwave as the heat continues to move eastward while areas further west get a reprieve.
Germany 7/20/22 highs:
Thanks much Larry!
Not a long lasting weather pattern with temperatures back to average, later this month. Maybe a couple of days a bit below average as we end July for the UK and vicinity.
Been trying to find a good meteorological explanation with nice graphics to show the air mass moving up from the Sahara Desert but most of what's out there is focusing the blame on the climate crisis and NOT the meteorology/weather pattern.
Mike,
You're welcome. I touched on this earlier about the hot air from Northern Africa crossing over only a narrow portion of the 5+ F warmer than normal far western Mediterranean and thus to hardly cool off upon its arrival in Spain with the assistance of a strong upper level high (which later got to 20 dm above normal 500 mb heights in London). Spain and Portugal then roasted under this upper high for several days. The Bay of Biscay is also very warm. Then thanks to a combo of a surface low to the west and a surface high to the east, the hot air moved into W and then N France with hardly any cooling with a peak on 7/18. Then it moved over the warmer than normal and narrow English Channel into the UK on 7/18 leading to a new alltime high in Wales and upper 90s in London. On 7/19, the hottest moved into London and SE England giving the new alltime UK high over 40C/104 F. It also moved into E France, Luxembourg, Netherlands, and western Germany. On 7/20, the hottest moved into Germany giving them all-time record heat in 7 of 16 states. Poland is to be hit on 7/21.
Yes, indeed, the synoptic setup is largely being ignored by the MSM/Climate alarmists even though this couldn't at all have occurred without it in addition to very likely not occurring without AGW. Some of the alarmists want to make it seem the AGW is doing it on its own, which is absurd.
I see it as an evil partnership of the synoptic setup as I detailed above along with the extra hot air and waters (Mediterranean, etc.) that AGW allowed to occur. How do I feel very confident AGW has to also be a significant factor? Because of all of the widespread alltime European records being set in 5 of the last 8 summers and with them being shattered in many cases.
So, it is synoptic and AGW teaming up as I see it.
Thanks Larry,
Wonderful analysis.
I don’t follow the weather extremely close in Europe most of the time so this is especially appreciated.
with regards to climate change. We’ve warmed the planet, on average 1 deg. c during the last century….more than that in the higher latitudes, especially during Winter.
in the lower latitudes It’s been less than that.
we have the same planet, oceans, land air masses and so on, just 1 deg. Warmer.
same physical laws operating…just 1 deg warmer.
if Europe has had hot summers in recent years, greater than 1 deg C, that means other places were cooler by the same amount because the temp of the planet is not hotter by an amount to contribute more than 1 deg of warming.
Global warming isn’t this mysterious thing that can do magical things responsible for all these extremes….that would have happened regardless….just at 1 deg less.
CO2 is well mixed in the global atmosphere so it’s not pooling over Europe and amplifying the greenhouse gas affect there.
the amount of warming will not be distributed equally but it’s well proven that the difference is related to latitude.
dry air loses heat the fastest with water vapor increasing the heat capacity. water vapor added to dry/cold air will allow it to trap/absorb more long wave radiation at the wave lengths,that water vapor absorbs.
CO2 acts in a similar way when added to cold, dry air as it absorbs LW radiation in some of the same bands as H2O.
in winter and high latitudes, with no solar radiation, clouds, water vapor/h2O and CO2 all help to trap heat from escaping where the air is the driest, with less impact where humid air features some of the wavelengths about saturated in absorbing LW radiation.
I imagine that the increase in CO2 has also increased low temps in global deserts more than surrounding, more humid areas Based on the same principle.
I’ll check tomorrow. other than this, their is no reason to think we are having greatly amplified heat waves from an increase of 1 deg in the global temp.
by what,process would this happen?there isn’t a special law which allows CO2 to pull heat from,other places and focus it all in one place compared to less CO2.
Hi Mike,
So, I think you're asking if more than 1C/1.8F of extra heat regarding this European heatwave can possibly be attributed to AGW. In other words, are these extreme synoptic patterns, themselves (like the pattern I described that lead to the current heatwave), which lead to these heatwaves, made more likely by AGW as opposed to simply just adding 1C of heat? This is an excellent question assuming that's what you're asking and imho not one with an easy answer.
Here's one opinion fwiw:
Is this due to climate change?
Extreme heat events do occur within natural climate variation due to changes in global weather patterns. However, the increase in the frequency, duration, and intensity of these events over recent decades is clearly linked to the observed warming of the planet and can be attributed to human activity.
The chances of seeing 40°C days in the UK could be as much as 10 times more likely in the current climate than under a natural climate unaffected by human influence. The likelihood of exceeding 40°C anywhere in the UK in a given year has also been rapidly increasing
Whilst a 1°C background temperature increase may not seem significant, the resulting increase in the severity of extreme heat events is already evident in the observed record. This has widespread and significant impacts.
Thanks Larry....exactly!
We have hundreds of statements from the experts like that which say what you just copied.
I can't find 1 that explains, meteorologically how the physical laws of the atmosphere use the magical molecule, CO2 that is well mixed in the global atmosphere with GLOBAL warming to somehow cause intense heat to pool in a manner that is far greater than it's 1 deg. of warming blanketing the earth.
The reason I don't believe that it can is not that I believe it can't do this.
It's because I have never been ever to figure out how this is possible as a meteorologist and I can't find anybody that says it does this (and I've looked and looked) who includes the actual explanation.
This is consistent with most of the other not true claims about CO2 that I solidly busted with authentic data.
This one, I have not completely ruled out because maybe there's some reason that I'm overlooking.
If you saw it, you clearly would have posted it because you're the most savvy weather person that I know.
If neither of us can find somebody or figure it out themselves that actually gives the physical explanation using laws of meteorology that make sense.....then I'm going to continue to assume that we used the scientific method(trying to prove that we are wrong with any assumption) to debunk another climate crisis myth.
Regarding this latest item.
I AM, however able to find explanations that make total sense to me as a meteorologist and that line up with my understanding of the atmosphere from 4 decades of applying and learning new things which seem pretty conclusive for why +1 deg. C from the increase in CO2 isn't able to amplify massive, record breaking heat waves by much more than the actual 1 Deg. C added to the overall system.
https://cliffmass.blogspot.com/2021/07/was-global-warming-cause-of-great.html
You are extremely sharp and on numerous occasions have pointed out meteorology that I overlooked.
Can you do it again?
BTW, I have never read anything from Cliff Mass, above that isn't 100% rock solid meteorology/science and comes with clear reasoning/explanations.
If I did, however disagree with him on something, I would likely think that I must be wrong!
Trying to connect this to logical thinking.
Temperatures are usually determined by the origin of the air mass on top of that particular region +any changes imparted on that air mass as it traveled to the current destiny + any changes imparted on that air mass upon arrival.
Those changes are especially observable if the air mass is traveling over specific terrain capable of making a big influence, like over a mountain chain. Winds lift it it up on the windward side, condense out much of the moisture, then warm is up and dry it out with adiabatic warming while downsloping on the leeward side.
In the absence of huge vertically created dynamics like this, traveling over wet/dry terrain makes a difference. Also, large scale meteorological patterns are a huge contributor.
A building upper level heat dome will increase descending and compressing of air (which helps to heat it more) and causes clear skies, additional warming from the sun and can cause it to heat up even more.
The position of the jet stream often contributes to dynamics which build heat domes/upper level winds.
CO2's role?
Other than the 1 Deg C temp increase superimposed on the entire big picture/system, there's no physical reason for extreme heat waves to greatly exceed +1 Deg. C because of the increase in CO2 causing magical dynamics to an air mass which I can't figure out and there are ZERO solid explanations for anywhere.
H2O can increase or decrease in an air mass based on the above, which will be independent of the CO2 level in the air.
Temperatures can increase/decrease based on the above. ....again, independent of the CO2 in the air.
The planet is actually greening up, which is producing a NEGATIVE feedback to hot, moving air masses overall, which would be the exact opposite of CO2 AMPLIFYING the heat beyond +1 Deg. C.
https://earthobservatory.nasa.gov/images/146296/global-green-up-slows-warming
What say you Larry?
The thread opened on the NTR forum discussing this has turned into an authentic data producing fiesta that obliterates the fake climate crisis.
Most of the data/evidence is relevant here but we'll use that thread as an additional source that allows for politics too that stays down there:
Mike,
I read the very well written Cliff article (I see why you like him) as well as all of the replies. It is a lot to take in. I intend to make my next reply on this when I get time to carefully think it through and then type out my thoughts. I'm not ignoring you! It isn't something I feel I can reply to yet.
Thanks Larry!
I'm pretty sure that a new law of physics/meteorology won't be discovered between now and then(-: but if you search long enough, maybe you can find something, somewhere.
Larry,
While you are taking time to contemplate and respond, I did some heavy thing myself, going all the way down to the molecular physics level to have a definitive reasoning for why CO2 acts the way that it does in the atmosphere.
I knew most of this already but got to applying it specifically to the recent major heat waves.
It's actually quite clear that CO2 contributes LESS to major heat waves(when there is humidity involved) than it does at any other time of year.
More and more of the CO2 heat absorption bandwidth potential is taken away the more hot and humid the air mass becomes...via H2O stealing it.....or already occupying that space. If their bandwidth overlaps, only 1 of them can absorb heat, so CO2 becomes obsolete at all the wavebands which overlap with H20. The more H20 you take away(drier the air) the greater the warming from C02 being added to that drier air mass.
So based on that rock solid physical law, CO2 would absolutely NOT cause heat waves to be hotter than the temperature departure they cause the rest of the year.............with most of it in cold/dry climates.
https://www.marketforum.com/forum/topic/87422/
https://www.marketforum.com/forum/topic/87422/#87438
Mike said in another thread:
"So when you add CO2 to a place that's already warm and humid..........H2O has maxed out the heat absorption at many of the wavelengths of absorption for CO2.........and adding CO2 doesn't have nearly as much affect........in the very hot/humid environments.
When you add CO2 to a dry and especially cold place........where H2O is scarce, CO2 can do some mega heat absorbing/trapping because the wavelengths absorbing heat from CO2 are NOT saturated by H2O.
This is why the coldest places, during the coldest times of year are experiencing MUCH MORE warming than any other places on the planet by a wide margin."
-----------------------------------
Mike,
Interesting. Is that why every year the Arctic during summer has remained near normal and the winter has warmed the most?
Larry,
Very astute observation.
That's EXACTLY the reason.
Happens in the Antarctic Winter too but 6 months later.....which is right now.
During the core of Winter, more often than not, you'll find a huge positive temp anomaly located around and/or over both poles, often lasting for weeks and weeks!
Check it out right now:
https://www.psl.noaa.gov/map/images/ens/t850anom_sh_alltimes.html
I had also shown this above last week and noted the same reason:
Mike,
From Cliff's very well written article, I found this quite interesting:
"Does Global Warming Produce Stronger Ridges of High Pressure?"
"...high-pressure areas like that seen last week will WEAKEN under global warming. Just the opposite of what Professor Mann was suggesting."
"And last week I examined the frequency of high-amplitude ridging over our region from 1948 to today using NOAA reanalysis gridded data. I found no trend in the extreme highs aloft."
----------------------------------
Mike,
This is quite interesting since it is counterintuitive being that higher amplitude 500 mb ridges correlate to hotter low level temperatures. What do you think?
Wonderful point Larry and I was just thinking about that.
Maybe my memory is messed up but I could swear that in college and for several years after that, I think that I remember seeing 600 DM 500 mb highs numerous times in several Summers.
I was going to try to go back and do a search for 500 mb maps for many Summers those years.
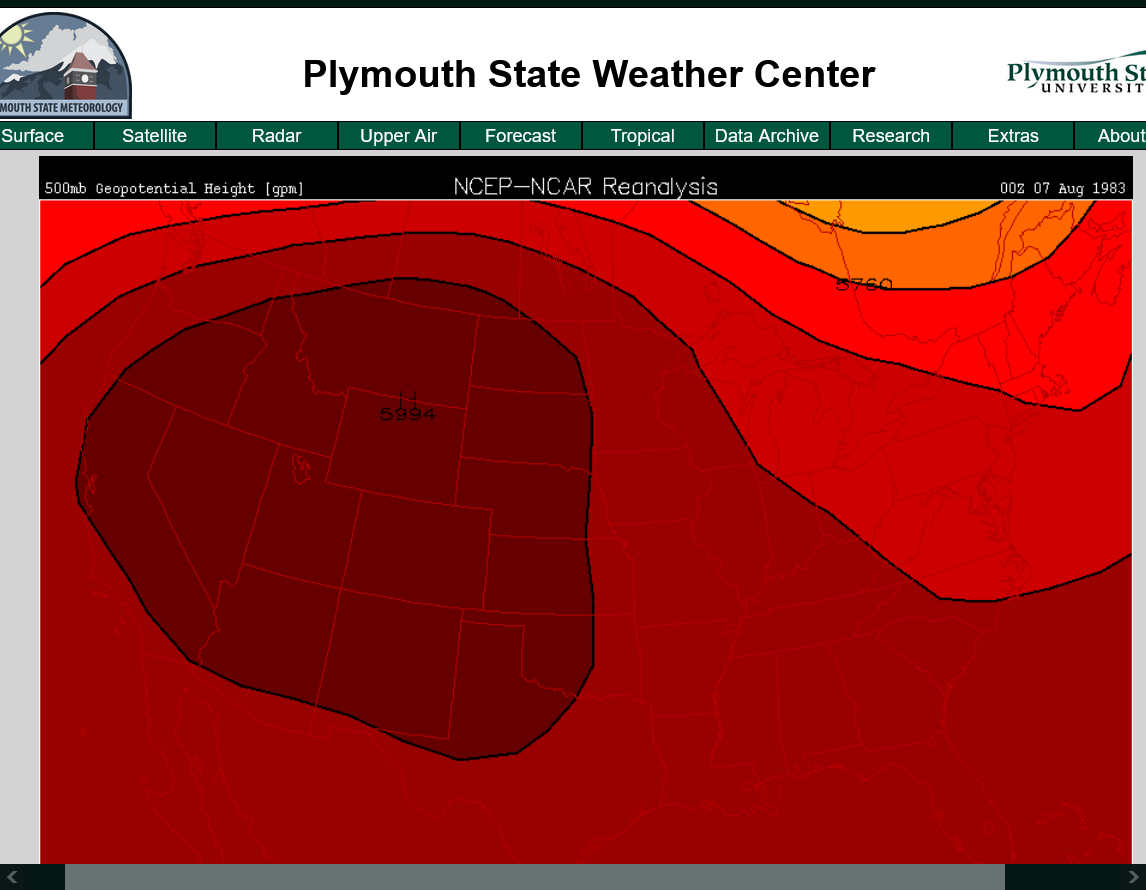
I'd bet that in 1983 we had a 600 DM high in July or August.
I passed on Cliffs article but actually hadn't read it since last year and need to do that again to refresh my memory.
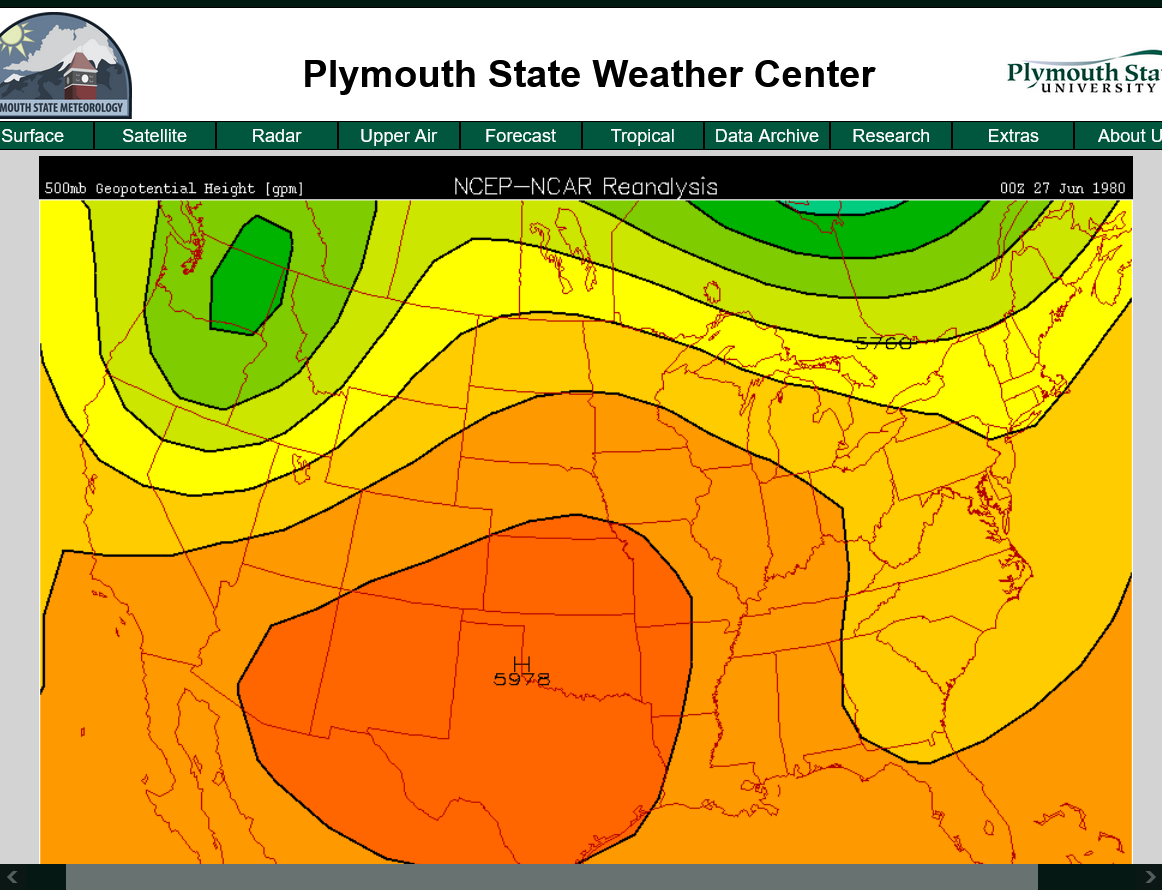
Haven't looked at alot but this is almost 600 DM! Aug 7, 1983.
https://vortex.plymouth.edu/myowxp/upa/reanalysis.html
This one on June 27 1980 was up there
Just found this from Cliff Mass:
July 21, 2022
The European Heat Wave and Global Warming
https://cliffmass.blogspot.com/2022/07/the-european-heat-wave-and-global.html
Golden Rule of Climate Extremes:
The more extreme a climate or weather record is, the greater the contribution of natural variability and the smaller the contribution of human-caused global warming.
Sucks to be them. Also sucks to be the west coast (US). But, welcome to natural global warming. It's not "man-made".
Mark said: "But, welcome to natural global warming. It's not 'man-made'".
--------------------------------------------
Mark,
Especially since I started and have been heavily involved in this thread, i can't let this go without a response. "Man made" GW or AGW has been proven to exist with virtually no doubt based on the science. Even Mike, the # 1 board expert on climate change/AGW, agrees 100% with this. Please don't confuse his saying certain things like that it is beneficial in certain ways, projected warming likely overdone by some climate models, it being used for political and monetary reasons and thus presented as a worse problem than reality, not being the crisis that alarmists believe, can't be proven to cause more than ~1 C of warming in any heatwave, etc, with him thinking that AGW doesn't exist.
Thanks much Larry!
I was hoping that you would chime in to make that correction.
Most of the warming has come from humans emitting CO2 and the greenhouse gas physics that I describe here:
https://www.marketforum.com/forum/topic/87422/#87438
It's equates to around 1 Deg. C or almost 2 Deg. F, with it strongly loaded at the coldest places in the coldest times of year and at night. The Arctic, is sort of like a night that lasts for months (-:
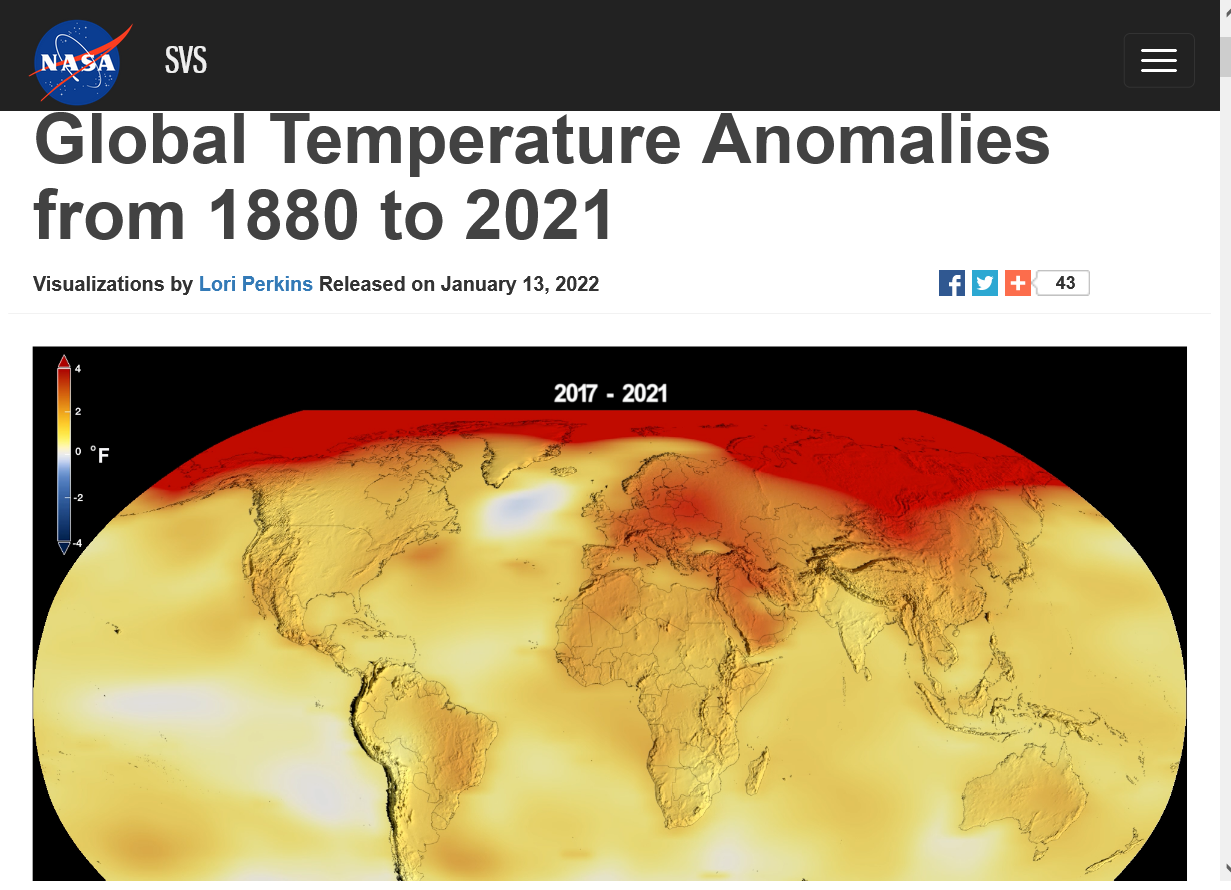
Here's a great image from that link/thread to illustrate this that I captured at the end of the video below.
You can play the video at this link too.
One should note that those places with the most warming by far are the coldest places in the Northern Hemisphere by far and it's extremely loaded towards Winters.
On another planet with honest science, the same thing would result in a celebration.........or, like the other 4 times that happened while humans were alive in our past..........calling it a climate OPTIMUM not a CRISIS.
Regardless, make no mistake about the rock solid physics at the molecular level showing strongly that at least half of this came from the increase in CO2.
https://svs.gsfc.nasa.gov/4964
Theoretically, some of that CO2 could have come from outgassing by slightly warmer oceans(that have 50 times more CO2 in them than the atmosphere) because that's what happened in the past, before humans played a role.... but the atmospheric level has leaped higher by so much that the oceans are actually absorbing more in order to maintain an equilibrium between them and the atmosphere.
And clearly, burning fossil fuels emits very large amounts of CO2 which is the main source of CO2 that got us from below 300 to almost 420 ppm right now.
BTW, below 300 ppm, plants and the biosphere were suffering from CO2 starvation.
How do we know that?
https://www.marketforum.com/forum/topic/69258/
Just look at the incredible response with the planet massively greening up because plants were so extremely CO2 deficient. The optimal level is 900 ppm and we are less than half that and will never get close. Even with China and India gushing out increasing amounts, I would be shocked if we would get anywhere close to 600 ppm. 500ppm is probably around the limit. Plants will continue to use up more and more CO2 to grow, some increasing food production for humans and the oceans will continue to soak it up.
Additionally, as CO2 increases, it's ability to absorb heat decreases logarithmically.
The amount of increased forcing going from 280 ppm to 380 ppm +100 ppm, will require going from 380 to something like 560 +180 to see an equivalent amount of increased forcing...or almost double that amount.
I don't think this is dialed properly into the models(that have doubled the real warming) and use H2O feedback improperly and can't model clouds and don't match up with accurate measurements of CO2 warming.
https://www.marketforum.com/forum/topic/57636/
+++++++++++++++++++++++
https://wattsupwiththat.com/2010/03/08/the-logarithmic-effect-of-carbon-dioxide/
![]()