Previous thread on this using authentic data and atmospheric science/meteorology:
https://www.marketforum.com/forum/topic/87294/
Our local station, WEHT, Evasnville Indiana, during their 5pm news just carried an ABC news report that claims the current heat waves were CAUSED BY climate change(global warming).
Not that climate change(global warming) increased the magnitude of the heat but that it CAUSED IT.
This is wrong.
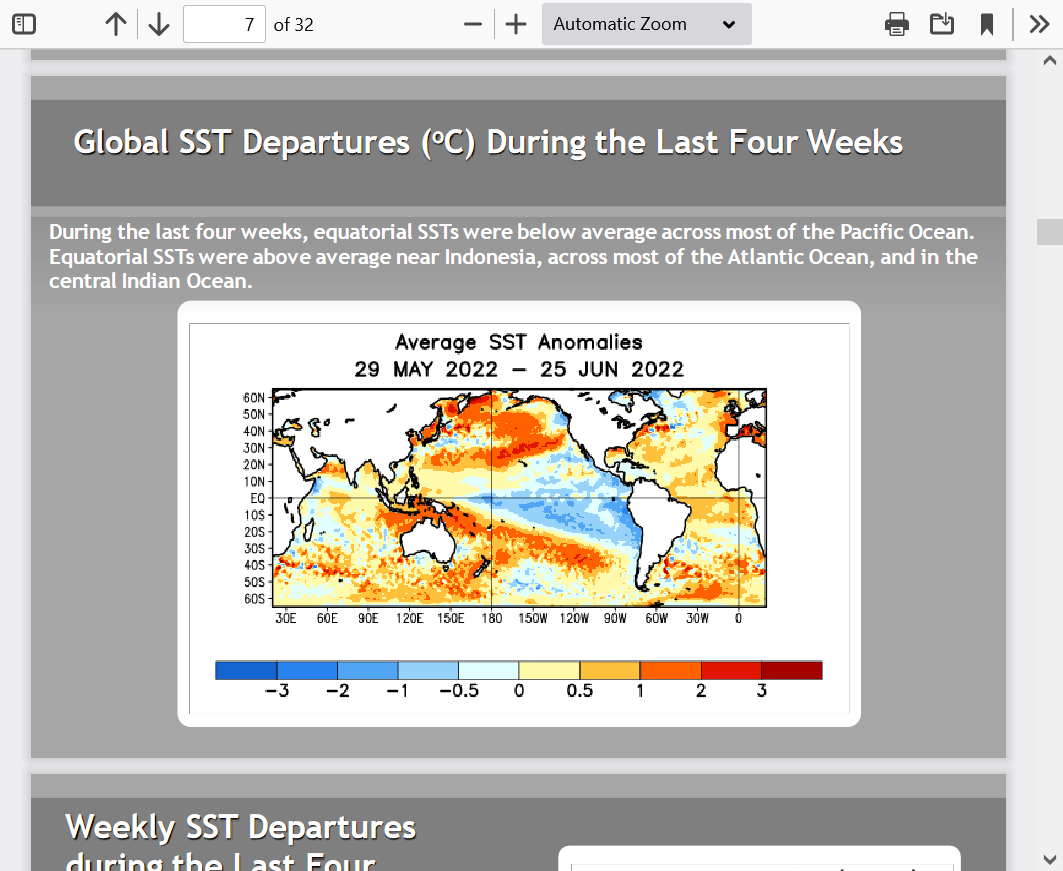
Fact is, our hot/dry weather pattern in the US, which has featured a severe drought in the West for the 3rd straight year is mostly being caused by the long lived La Nina that has been there..........for the 3rd year. This is a large area of cool water anomalies in the east/central Pacific Ocean.
Global warming CAN'T cause cool water anomalies in this area of the Pacific. In fact, La Nina's actually cool the planet while they are present. They are a natural part of weather that constantly ebbs and flows between La Nina(cooler water) and El Nino(warmer water).
Fact is, there are usually more EL NINO's during global warming and those are correlated with more FAVORABLE weather in the US, especially during our growing season.
Here the La Nina is below:
+++++++++++++++++++++++++++++++++++++++++++++
Here is a graph of the most recent monthly global temperature of the lowest layer of the atmosphere from the most accurate/objective measurement...satellites. Note how this La Nina has caused global temperatures to back off down to the 30 year average.........the OPPOSITE of dangerous climate change from accelerating global warming:
https://www.marketforum.com/forum/topic/86627/
July 1st, 2022 by Roy W. Spencer, Ph. D.
The Version 6.0 global average lower tropospheric temperature (LT) anomaly for June, 2022 was +0.06 deg. C, down (again) from the May, 2022 value of +0.17 deg. C.
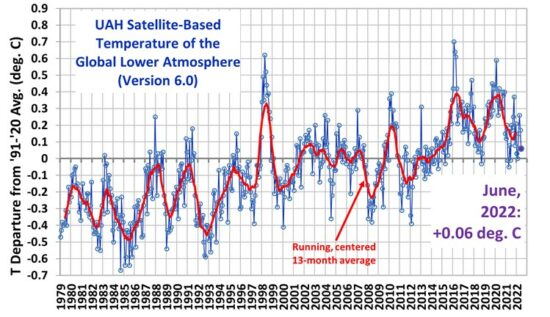
We should note though that there is still an uptrend and there has been global warming of up to 2 Deg. F compared to 100 years ago, when the planet was actually suffering from temperatures MUCH TOO COOL to be optimal for life.
Which is why, every other time that we were this warm (4 different times in the last 9,000 years, scientists referred to those periods as climate OPTIMUMS!
https://en.wikipedia.org/wiki/Holocene_climatic_optimum
Medieval Warm Period/Optimum was as warm/warmer than this:
https://www.marketforum.com/forum/topic/87294/#87335
Now, the same climate is ...............A CRISIS!
I wanted to do a follow up to the earlier thread that conclusively proves that we are NOT having a climate crisis with its dozens of authentic data sources.
https://www.marketforum.com/forum/topic/87294/
+++++++++++++++++++++++++++
This thread, will show another very comprehensive source, for the Midwest, which is where the viewers of WEHT live and also explain CO2 greenhouse gas warming better in a way that almost nobody understands and the media/information gatekeepers of the fake climate crisis messages are getting completely wrong.
Please read on and enjoy the enlightenment!
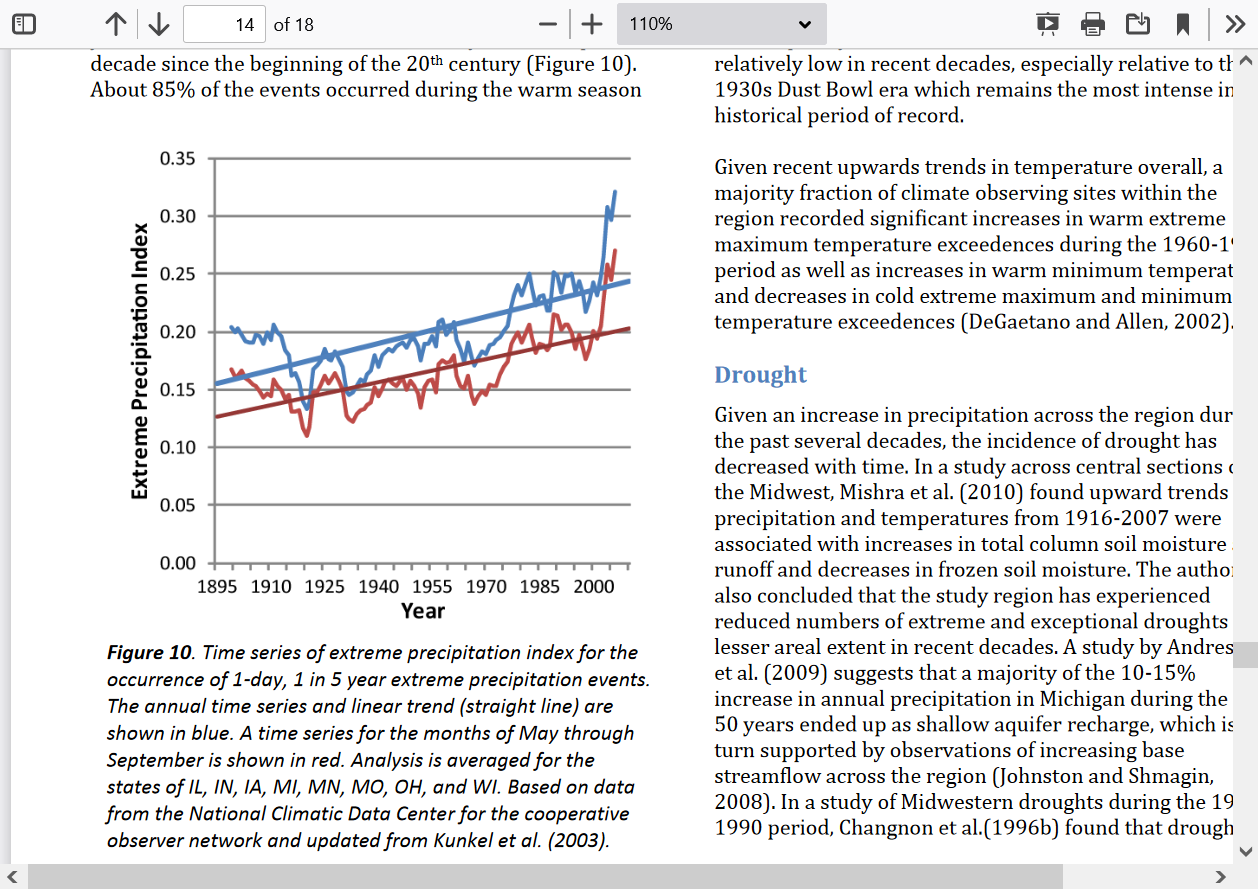
Historical Climate and Climate Trends in the Midwestern USA
WHITE PAPER PREPARED FOR THE U.S. GLOBAL CHANGE RESEARCH PROGRAM
NATIONAL CLIMATE ASSESSMENT
MIDWEST TECHNICAL INPUT REPORT
https://glisa.umich.edu/media/files/NCA/MTIT_Historical.pdf
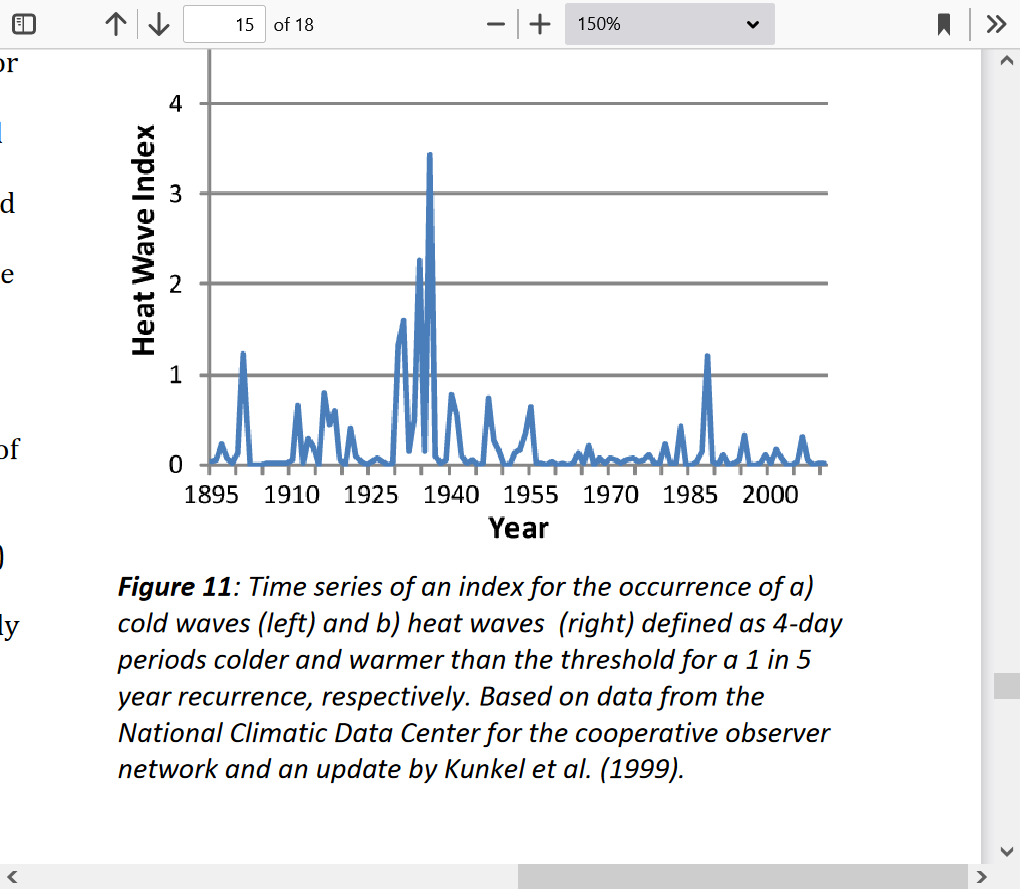
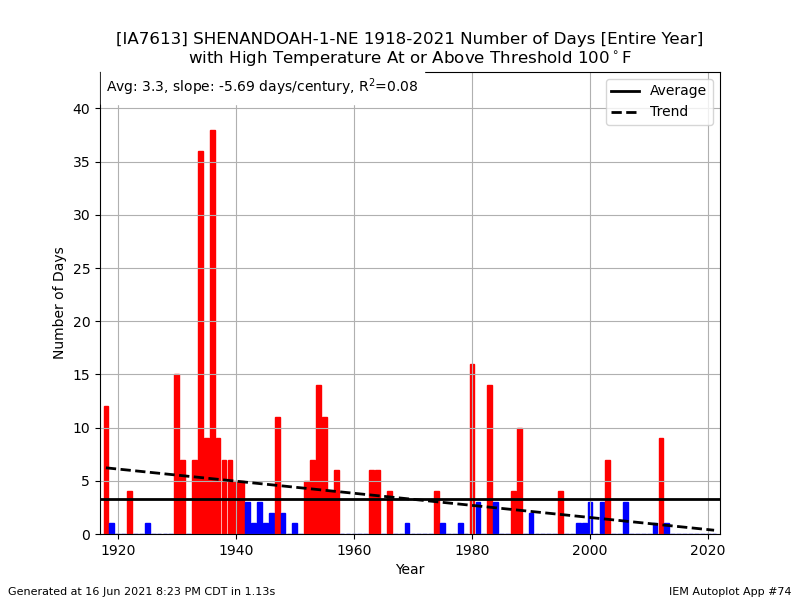
The spike in the 1980's was from the drought of 1988.
There was another one in 2012 from that drought but this study was done just before then.
Both those prior droughts(and heat), 1988 and 2012 were caused by La Nina's!
Where on this map do you see the global warming/climate change finger print for causing extreme heat waves in the Midwest?
+++++++++++++++++++++++++++++++++++++
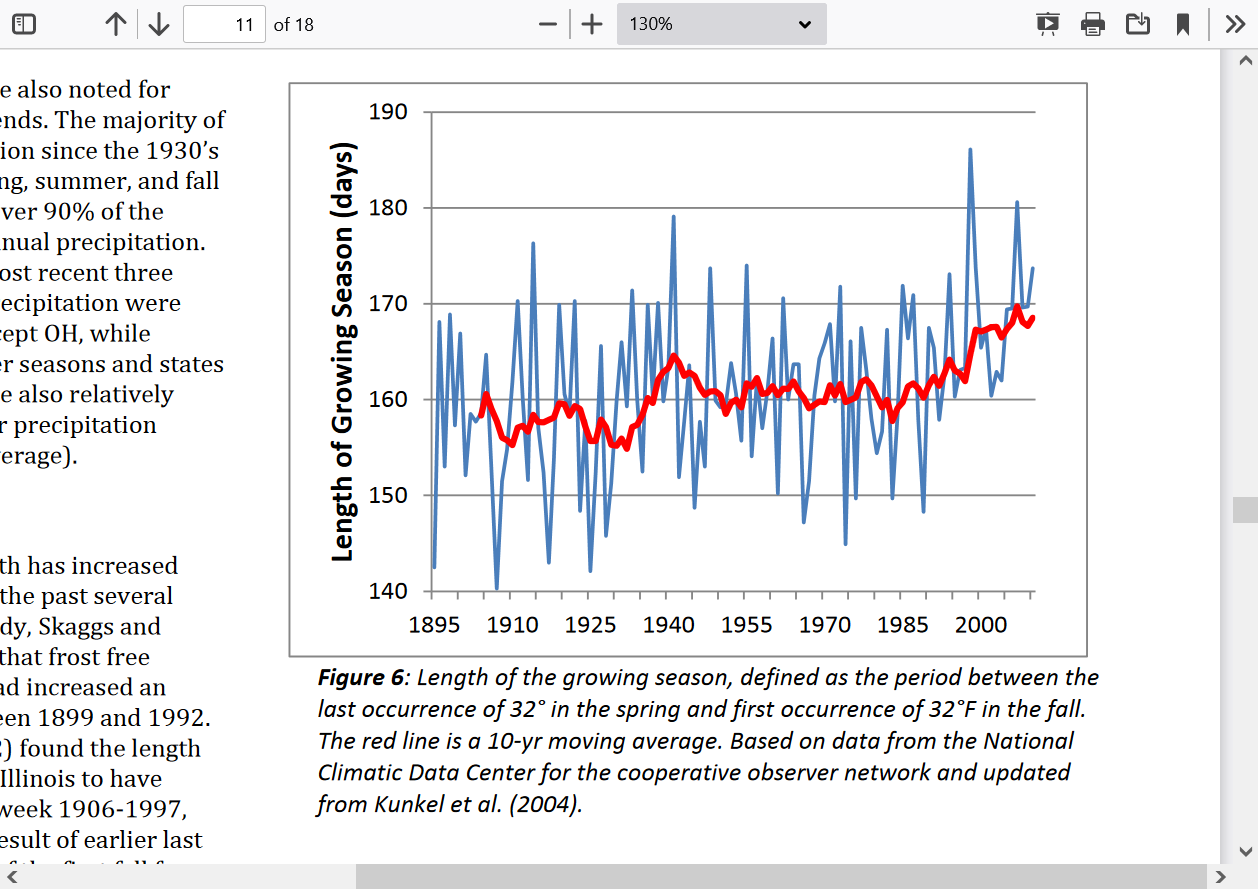
Also shown in the report was this map:
Farmers/gardeners in this area and northward, are relishing the expanded growing season.
 +++++++++++++++++++++++++++++++++++++++++++++++++++++++++
1 day heavy rain events have also increased which is a negative in almost all cases!
Previous data sources on heat, from the previous thread that completely contradict EVERYTHING we are being told about this current heat.............which is the main topic everywhere right now.
Only this time, I will follow up with an explanation about the actual molecular physics of warming from CO2 to help you understand why this data below is REAL data.
Below is actual RECORDED weather data. Data is data! You can try to hide it or not show it with certain graphs and adjustments but the raw data..........is the AUTHENTIC DATA!
https://www.marketforum.com/forum/topic/87294/#87332
Since this graph above was made, in the last 20 years (since 2000) the following states have made their all time record highs: CO, SD, SC, OR and WA.
++++++++++
https://www.marketforum.com/forum/topic/87294/#87333
100+ degree days at one site in southwest Iowa.
++++++++++++++++++++++++++++
https://www.marketforum.com/forum/topic/87294/#87334

People that are certain we have a climate crisis will view these maps and think "this must be some sort of data manipulation trick" or "this is just cherry picking data because I'm certain that it's hotter now than it was in the 1930's and previous years"
I will explain clearly what the confusion is about and why you are being completely misled here in July 2022(and for the past 3 decades) about the heat waves being unprecedented and caused by climate change/global warming.
Here's a map from the EPA that shows the warming going back to 1901 in the United States.
I'll explain why global warming is NOT affecting extreme day time highs, as much as at other times shortly.
First, I will point out that NOAA has greatly adjusted these temperatures in the US and they are YEAR ROUND temperatures not just Summer temperatures.
Tony Heller gives a good discussion on this. Regardless of what you think of him, I watched NOAA make the adjustments and have the actual data from the Summers in the 1930's and they were MUCH, MUCH hotter than the 2000's. It's not even close in the Midwest. The raw data PROVES that it was warmer. So who has the raw data? Almost nobody.
https://realclimatescience.com/2016/12/100-of-us-warming-is-due-to-noaa-data-tampering/
Since almost 50% of the all time hottest temperatures ever recorded in the 50 US states from the 1930's(24 out of 50 states) are still standing...........that is RAW DATA that can't be tampered with/adjusted and it's profound HEAT WAVE data that proves that extreme heat waves and extremely hot temperatures in the 1930's were extremely more frequent!
The explanation for this is coming up.
https://en.wikipedia.org/wiki/U.S._state_and_territory_temperature_extremes
++++++++++++++++++++++++++++++++++++
https://www.epa.gov/climate-indicators/climate-change-indicators-us-and-global-temperature

Even with those clearly much hotter Summers in the 1930's and a few other years and the adjusted data, unquestionably, the average YEARLY temperature in the US and World has clearly gone up from the increase in CO2 and greenhouse gas warming that's trapping more heat. Over the last century, that amount is close to 1 Deg. C or almost 2 Deg F.
So.......how in the heck could the heat of the Summer's of the 1930's and so many previous Summer's have been so much hotter BEFORE there was any global warming. It doesn't make sense!.... you might say
Actually, if you understand actual greenhouse gas warming molecular physics.... it does make total sense!
Here it comes...........
The warming is mostly occurring in the coldest/driest places in the coldest times of year. Cold/dry air does not have much water vapor, which is the main greenhouse gas, which is part of why its so cold. Water vapor absorbs long wave radiation/heat and helps to keep that location from losing heat. CO2 does the exact same thing and at many of the same wavelengths. Some of them are already saturated from H2O, so CO2 does NO HEAT TRAPPING at those H2O saturated wavelengths. ......where the absorption bandwidths overlap!
So when you add CO2 to a place that's already warm and humid..........H2O has already maxed out the heat absorption at many of the wavelengths of absorption for CO2.........and adding CO2 doesn't have nearly as much affect........in the very hot/humid environments.
When you add CO2 to a dry and especially cold place........where H2O is scarce, CO2 can do some mega heat absorbing/trapping because the wavelengths absorbing heat from CO2 are NOT saturated by H2O.
This is why the coldest places, during the coldest times of year are experiencing MUCH MORE warming than any other places on the planet by a wide margin.
Here's a graph that shows the absorption spectrum. You can see that H2O is 95% of the greenhouse gas affect and swamps CO2...............except, in places on the planet where there isn't much H2O(cold and dry) then CO2 can really exert much MORE greenhouse gas warming. Where it's warm/humid you are MAXIMIZING H2O greenhouse gas warming and MINIMIZING CO2 greenhouse gas warming......which is also during hot/humid heat waves.
When its really cold and there's not much H2O in the air........like the Arctic all Winter long........CO2 can flex it's muscles and trap more heat because the H2O wavelengths are not saturated.
There is one very narrow spot in the middle of the absorption spectrum that CO2 does not overlap with H20.
+++++++++++++++++++++
Break from the lesson:
One should also note that at almost 420 ppm CO2, that narrow heat trapping wavelength is almost saturated for absorption as a greenhouse gas and most of it's increase in heat absorption/trapping took place at lower levels of CO2. So each additional molecule of CO2 will have less and less heat trapping capability As the precious one.
This has been proven in recent years but NOT dialed into models. Actual accurate measurements of the amount of CO2 heat radiation being trapped for the past 2 decades show it's only just over half of what's in the models.......and that too is being intentionally ignored.....and the main reason that climate models are too warm and busting worse with time NOT getting better. Climate models are political tools NOT honest science......or else they would be getting adjusted based on the observations/measurements that continually tell us the real world is cooler than the modeled world/forecasts. We actually know why, so no adjustments mean its intentionally ignoring the authentic science.........a political tool.
https://www.marketforum.com/forum/topic/57636/
+++++++++++++++++++++
https://commons.wikimedia.org/wiki/File:Atmospheric_Transmission-en.svg

So the molecular physics of greenhouse gas warming totally explains why CO2 is causing us to warm so much overall but we are NOT having more extreme heat in the hottest/most humid places/times of year. with the same amount of contribution from CO2 as during the rest of the year.
Certainly more CO2 is always going to ADD heat trapping/greenhouse gas warming 365 days a year.
But the more moisture that's in the air(dictated by temperature) the more suppressed that affect will be.
The drier(colder) it is. The more enhanced the CO2 warming will be.
Let's look at US temperatures for the past 100+ years below.
There it is! This is YEAR ROUND temps. Note that where there has been little warming, in fact even slight cooling is where the highest humidity(H2O) is!
Some of the driest (and coolest) areas have the most warming(northern tier and desert s.west to CO.)
It's never going to be a 1 to 1 correlation because there are other natural cycles and variables.
https://www.epa.gov/climate-indicators/climate-change-indicators-us-and-global-temperature

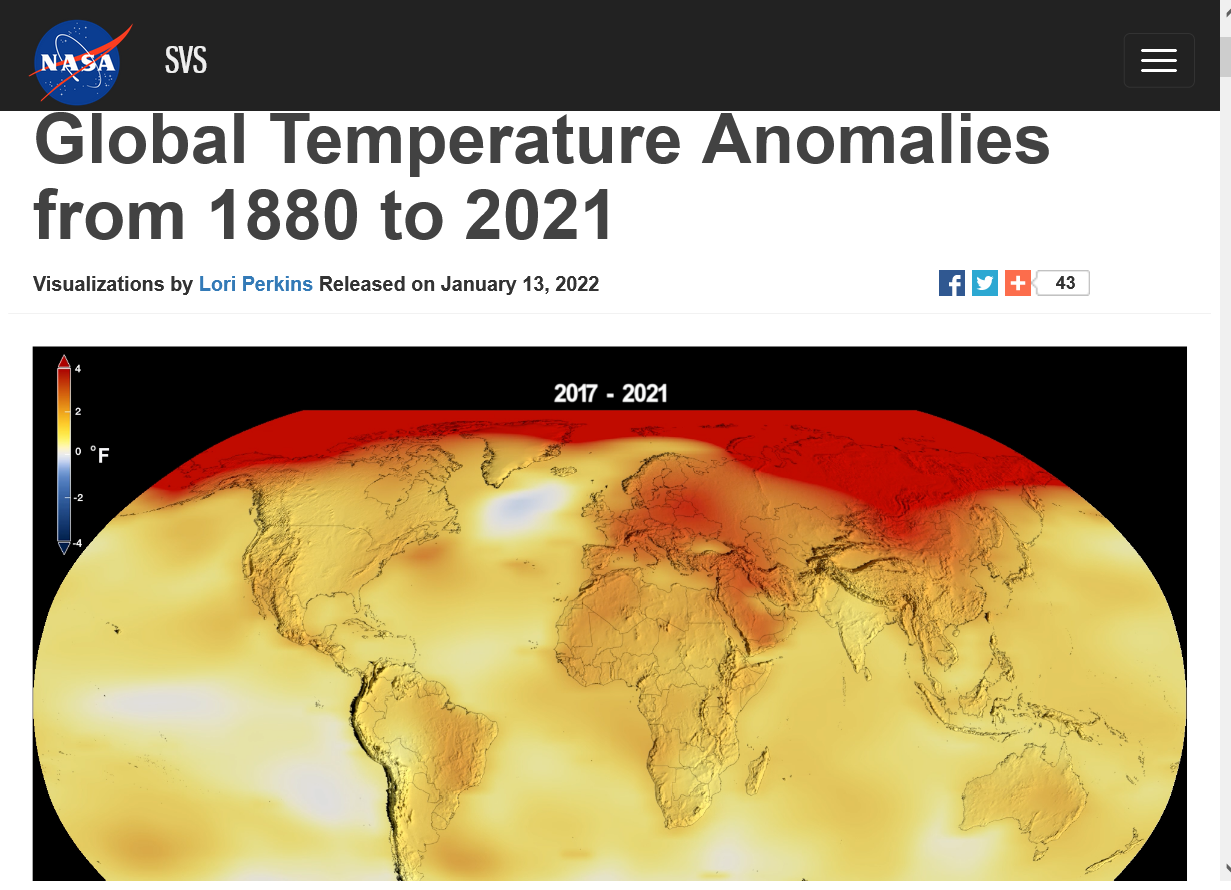
Here's another clear illustration of this affect:
Note the warming is extremely focused on the highest latitudes of the N.Hemisphere. These are LAND areas with very little moisture, so CO2 can do massive absorbing of heat, especially during the coldest times of year/Winter.
By a rational thinking person's account........this would actually be a good thing to warm up the coldest places on earth during the coldest times of year.
But the Southern Hemisphere has not warmed nearly as much?
That's because the SH is much more moist ocean, compared to the NH being much more (drier) land.
again, CO2 will always warm up cold, dry air by a much greater amount than it warms hot/humid air.
Water also warms slower than land, so it takes MUCH more heating to warm up the ocean dominated Southern Hemisphere.
You can play a video at this link too.
https://svs.gsfc.nasa.gov/4964
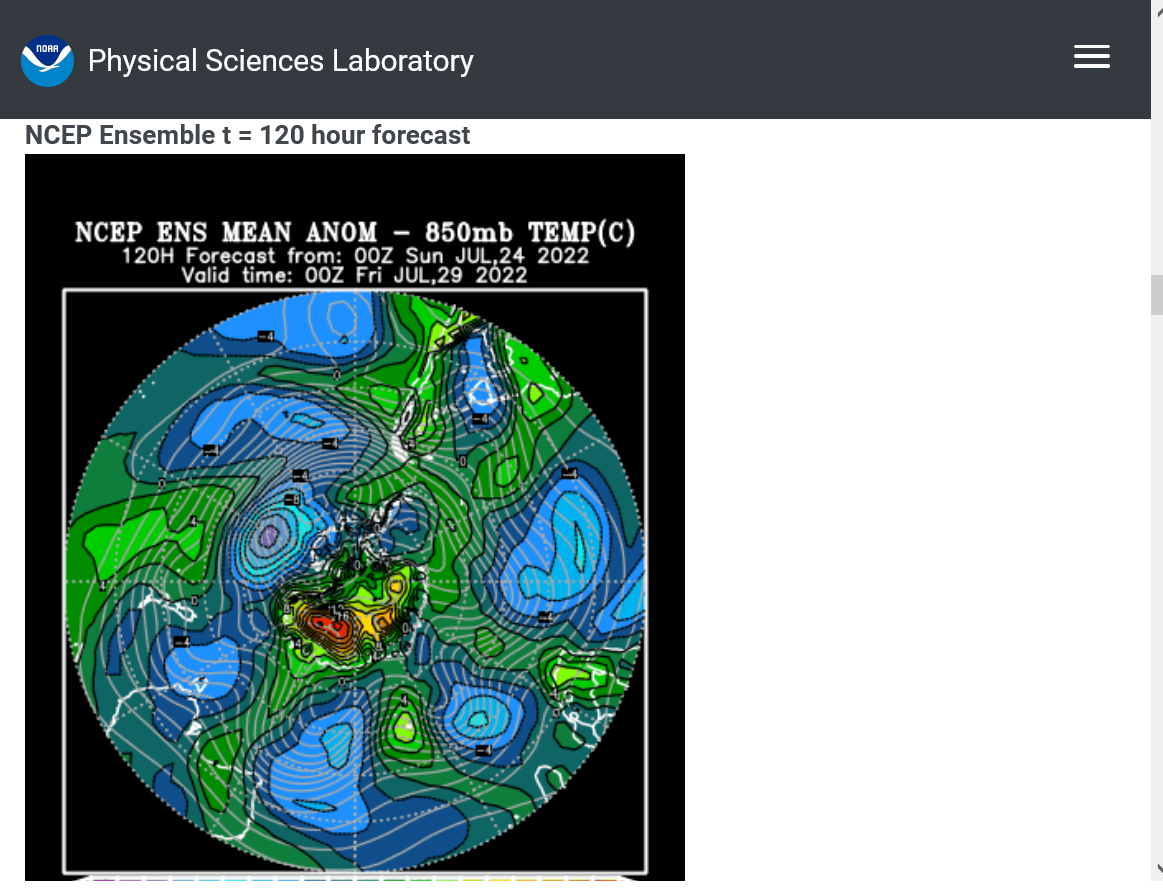
As we do every Winter, we are witnessing this effect during the Southern Hemisphere Winter right now.
These are the 850 temperature anomalies over the Southern Hemisphere from the NCEP Ensemble mean. Note the impact of the extremely magnified CO2 warming in the highest latitudes closest to the South Pole.
This will persist for much of their cold season..........then flip to the highest latitudes of the Northern Hemisphere during our upcoming Winter...........which ALWAYS happens because of the CO2 greenhouse gas warming's amplified impact in cold/dry climates.
This is the conclusive, real world evidence that greenhouse gas warming impacts the coldest places at the coldest times of year the most and is having very little(but some-maybe 1 to even 2 Deg. C) impact on heat waves in the hottest times of year.....when water vapor swamps/overlaps the CO2 greenhouse gas warming.
It's been happening just like this for decades, month after month after month(in the Winter).
That's the authentic science.
https://www.psl.noaa.gov/map/images/ens/t850anom_sh_alltimes.html
Additional discussions:
https://cliffmass.blogspot.com/2022/07/the-european-heat-wave-and-global.html
Golden Rule of Climate Extremes:
The more extreme a climate or weather record is, the greater the contribution of natural variability and the smaller the contribution of human-caused global warming.
I forgot to note above that Night time temps/lows are experiencing MUCH more warming than daytime highs.
Just like adding more H2O greenhouse gas warming will mostly increase the night time temps........same with CO2.
In heat waves, everybody focuses almost entirely on the maximum temperature during the day.
This is important of course but the metric that CO2 is really contributing the most towards warming in the mid latitudes, by a wide margin and including heat waves is record warm overnight temperatures.
The Arctic in Winter is sort of like night time for months and extremely demonstrates this principle on a wide and very long time scale.
As CO2 increases, it's ability to absorb heat decreases logarithmically.
The amount of increased forcing going from 280 ppm to 380 ppm +100 ppm, will require going from 380 to something like 560 +180 to see an equivelent amount of increased forcing...or almost double that amount.
I don't think this is dialed properly into the models(that have doubled the real warming) and use H2O feedback improperly and can't model clouds and don't match up with accurate measurements of CO2 warming.
https://www.marketforum.com/forum/topic/57636/
+++++++++++++++++++++++
https://wattsupwiththat.com/2010/03/08/the-logarithmic-effect-of-carbon-dioxide/
![]()
Just more evidence to support the Golden Rule of climate extremes. Thank you Cliff Mass and the National Academy of Sciences!
"The more extreme a climate or weather record is, the greater the contribution of natural variability." (and the less contribution came from climate)
"Or to put it a different way, the larger or more unusual an extreme, the higher proportion of the extreme is due to natural variability."
https://cliffmass.blogspot.com/2016/03/the-golden-rule-of-climate-extremes.html
This Golden Rule of climate extremes is violated much more than followed by many very biased scientists and politicians and by most news sources that sensationalize extreme weather from natural variability and wrongly blame it on a non existent climate crisis.
Let's demonstrate even more objective, authentic scientific perspective on this.
07.13.2021
If planet warms, net temperature-related deaths will decrease
Reichmuth summarizes:
If there are many more cold deaths than heat deaths, it is reasonable to expect that as the earth continues to warm, the number of cold deaths will decrease more than the number of heat deaths will increase. Thus the net effect of climate change would be positive.
Here are the annual average temperatures for our planet.
Blue is obviously the coldest places, which are very frigid in the Winter in mostly the higher latitudes.
Not many people live in those regions...mostly because it's too cold for humans and also many other forms of life.
A huge number of people live in the green and yellow shaded regions. Not very expansive in total geographic area but alot of people live there and it's cold enough to account for a great deal of the deaths by cold, which is 15 or so times greater than deaths from extreme heat.
Red shades, especially dark red is warm and even tropical warmth without much death from cold, even in the Winter.
If you had the power to change the temperature configuration of this map below to save the most lives by adjusting temperatures, what would you do?
Answer below this map.
https://commons.wikimedia.org/wiki/File:Annual_Average_Temperature_Map.jpg

+++++++++++++++++++++++++++++++++++++++
You can play a video at this link too.
https://svs.gsfc.nasa.gov/4964

This map above is temperature changes on earth compared to 140+ years ago that define climate change/global warming. The reds at the high latitudes illustrate temperature increases in some cases that are 3+ times more then the increase in temperatures at low/mid latitudes(where only slight warming has taken place during climate change).
Compare the first map to the 2nd one.
It's stunning to appreciate that most of the significant warming on the 2nd map is exactly where the blue/very cold is on the 1st map.
The coldest places, especially during the coldest times of year.
Critical thinking tells us why scientists referred to the last 4 natural warmings that were similar to this(even warmer during the Holocene climate optimum at high latitudes) in the last 9,000 years as climate OPTIMUMS!
https://en.wikipedia.org/wiki/Holocene_climatic_optimum
This shows clearly that global warming has been exactly what the planet has needed the most (warming the bitter cold regions the most) and the increase of CO2, the building block for all of life which is greening our world up, along with a booming biosphere.
We are having a Climate Optimum by almost every scientific standard.
The term Climate Crisis is political and based on busted models that are all too warm in combination with EXTREMELY exaggerated extremes which have been caused almost entirely by natural variation of the weather.
https://wattsupwiththat.com/2022/07/31/are-this-summers-heat-waves-extraordinary/
Mike Maguire
July 31, 2022 6:23 pm
This article is exactly right on the money! Almost half of the all time hottest temperatures in each state of the USA were set in the 1930’s and still stand today!
U.S. state and territory temperature extremes
https://en.wikipedia.org/wiki/U.S._state_and_territory_temperature_extremes
![]()
From Cliff Mass:
The Golden Rule of Climate Extremes
“The more extreme a climate or weather record is, the greater the contribution of natural variability.”
“Or to put it a different way, the larger or more unusual an extreme, the higher proportion of the extreme is due to natural variability.”
https://cliffmass.blogspot.com/2016/03/the-golden-rule-of-climate-extremes.html
Mike Maguire
July 31, 2022 9:39 pm
The only reason the earth might not be recognizable to some people is that it will be greener than at any time in human history. The ones expecting an increase in extreme drought and a dying, browning planet will be shocked.
However, the UN has been predicting a demise in the planet for 30+ years
U.N. Predicts Disaster if Global Warming Not Checked
PETER JAMES SPIELMANN Associated Press June 29, 1989:
https://apnews.com/article/bd45c372caf118ec99964ea547880cd0
And just the opposite happened.
One would have thought that by now, the fake climate crisis, fake green energy scam would be long over because of being extremely exposed in every way imaginable by authentic science/observations/data. How can something so wrong for so long actually get even more traction?
Maybe this is a new human condition related to advances in technology? I’m serious here.
Maybe the human mind has evolved/or has been taught to no longer be able to perform effective critical thinking like it had for thousands of year?
Maybe people in 2022+, permanently rely on information gatekeepers to tell them what they should be thinking because we have become so dependent for answers about everything based on looking things up on Google or going to echo chambers and other places to listen to the same things repeated over and over instead of figuring it out ourselves?
https://www.marketforum.com/forum/topic/69258/#69259
