Previous thread:
Corn--sold--gap and crap
51 responses |
Started by tjc - Aug. 23, 2026, 8:24 p.m.
https://www.marketforum.com/forum/topic/122381/
++++++++++++++
Get all the comprehensive weather here:
Awesome Eric was in with our weather this morning:
Sept 30, 2026: Widespread Flood Watches | Model Bias in Predicting Rains (ECMWF v GFS)...
FYI, just happened to be looking at this.
Maybe close to 50% of the crop yields in 2026 come from synthetic fertilizer, especially nitrogen.
https://ourworldindata.org/grapher/fertilizer-use-nutrient
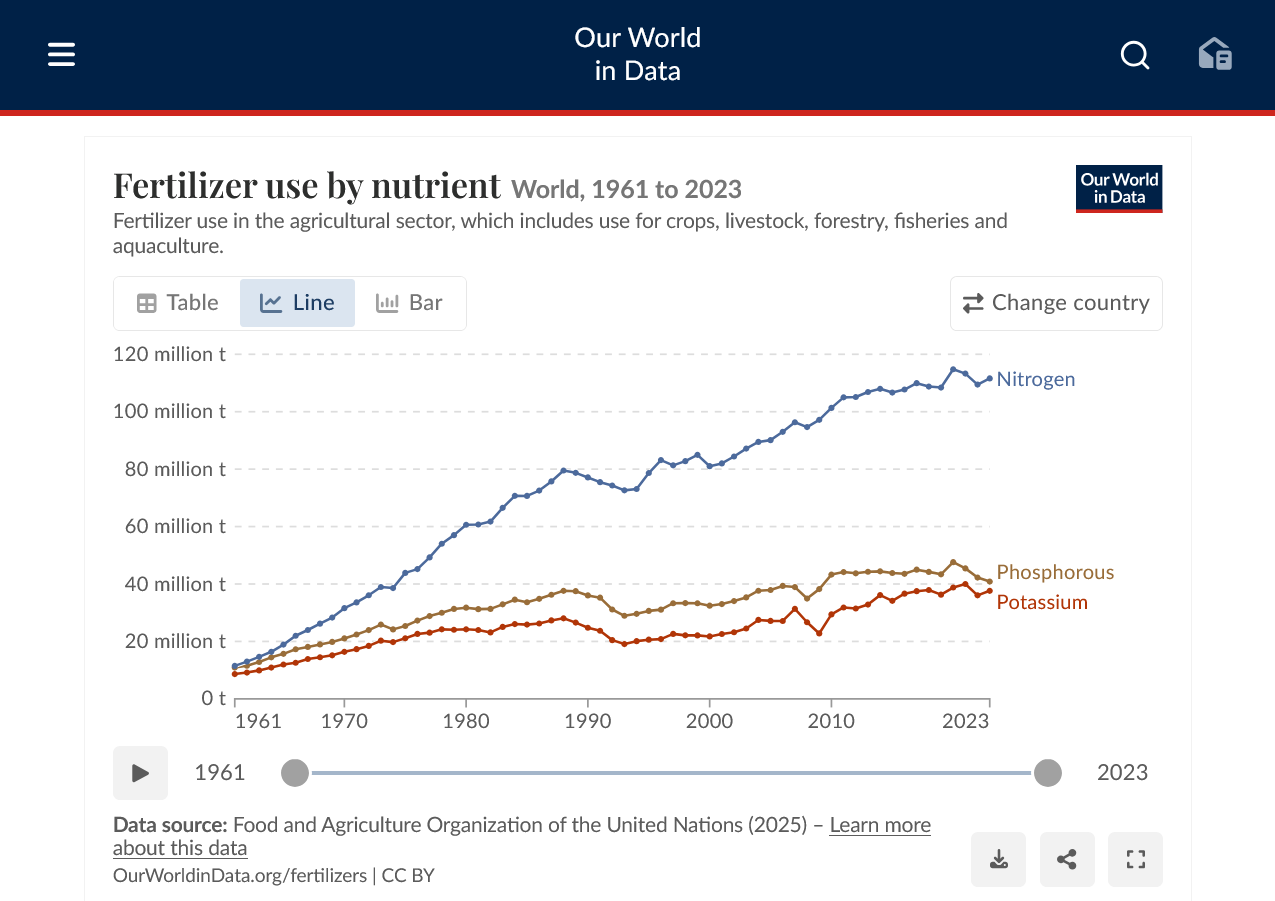
https://www.ers.usda.gov/data-products/fertilizer-use-and-price/summary-of-findings

Soaring fertilizer prices
36 responses |
Started by metmike - March 17, 2026, 11:21 a.m.
https://www.marketforum.com/forum/topic/118736/
+++++++++++++
It’s a miracle feeding half the planet!
Anothersecret about fossil fuels: Haber Bosch process-fertilizers feeding the planet using natural gas-doubling food production/crop yields. September 2019
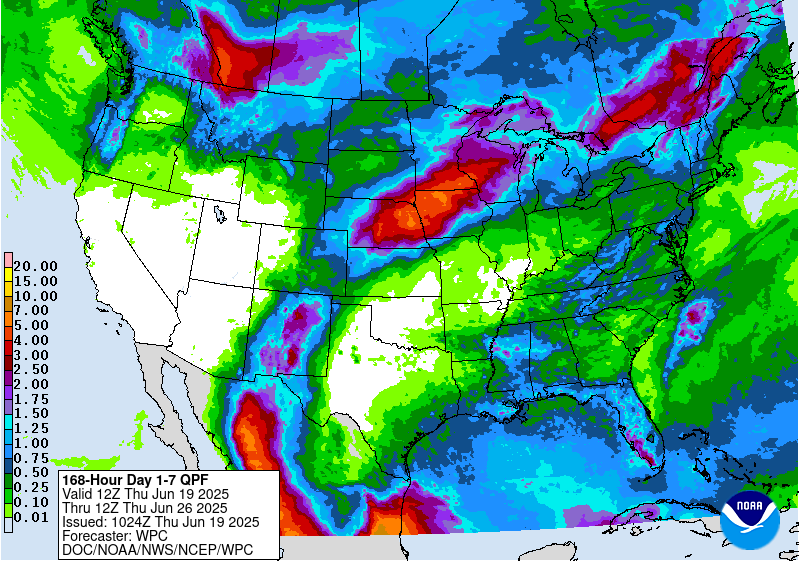
Some heavy rains early(next 2 days) in the Midwest, then becoming very dry across much of the country.
Heaviest rains in the south, especially along the Gulf Coast.
7 Day Total precipitation below:
http://www.wpc.ncep.noaa.govcdx /qpf/p168i.gif?1530796126
·
U.S. Sept. 1 corn stocks land above all trade estimates, while soybeans and wheat fall below the average guess.
USDA revises the 2025 U.S. corn crop lower by 57 million bushels after reviewing the Sept. 1 stocks survey results. Yield was unchanged, but acres were lower.


.S. farmers in 2026 harveted their smallest wheat crop since 1970, according to USDA. Winter wheat production landed above all pre-report trade estimates, though it was still the lowest since 1965. Spring wheat output landed below all estimates, at a five-year low.
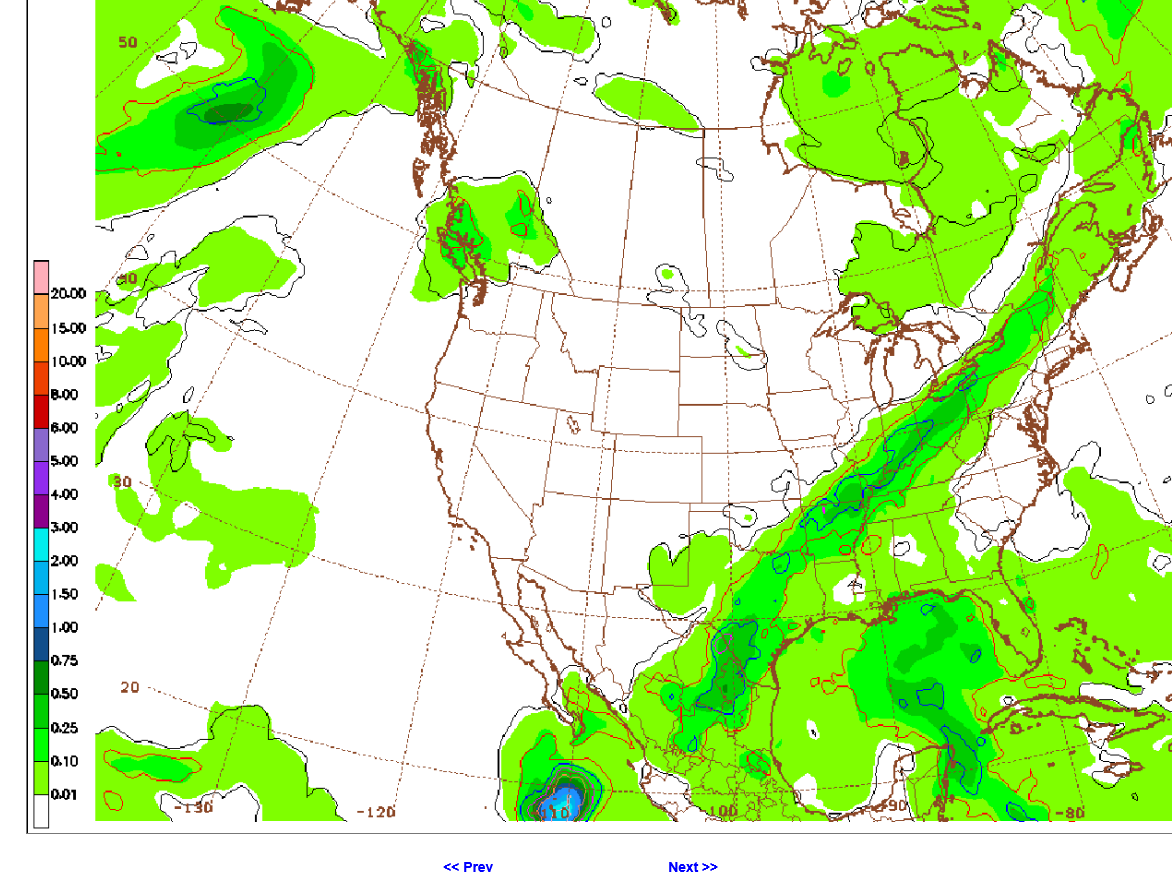
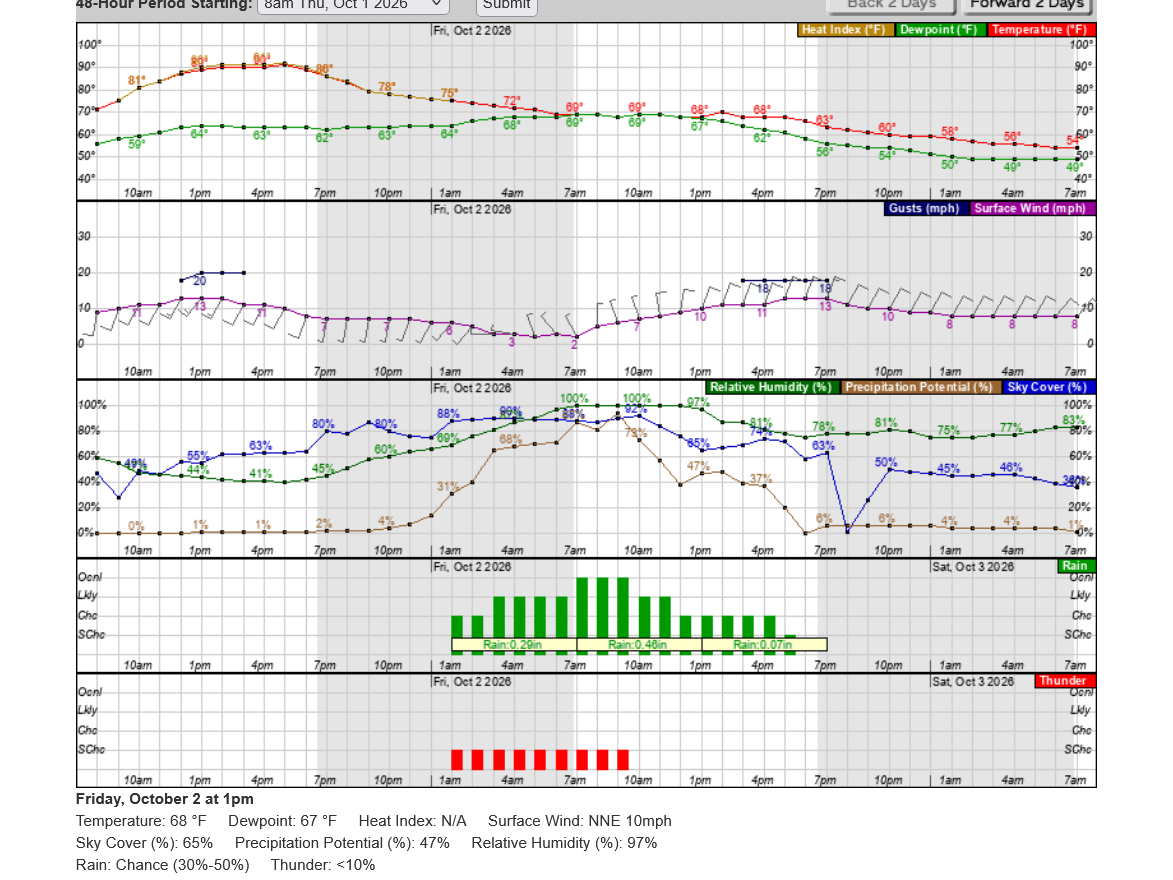
I was just using the above graphics for McCutchanville Elementary that has a field trip planned for tomorrow.
this will be our first rain in 3 weeks after going 3 weeks before that with no rain and intense heat part of that time.
Brain Splitt was in today with the charts. He shows a textbook head and shoulder pattern in feeder cattle at the end.
Great stuff, cutworm!
Added: After listening to his take about the beans, I have to disagree with higher yields in places like Arkansas, where I think the intense heat/dry end HURT pod fill and production and places around the periphery of the heat dome had excessive rains.
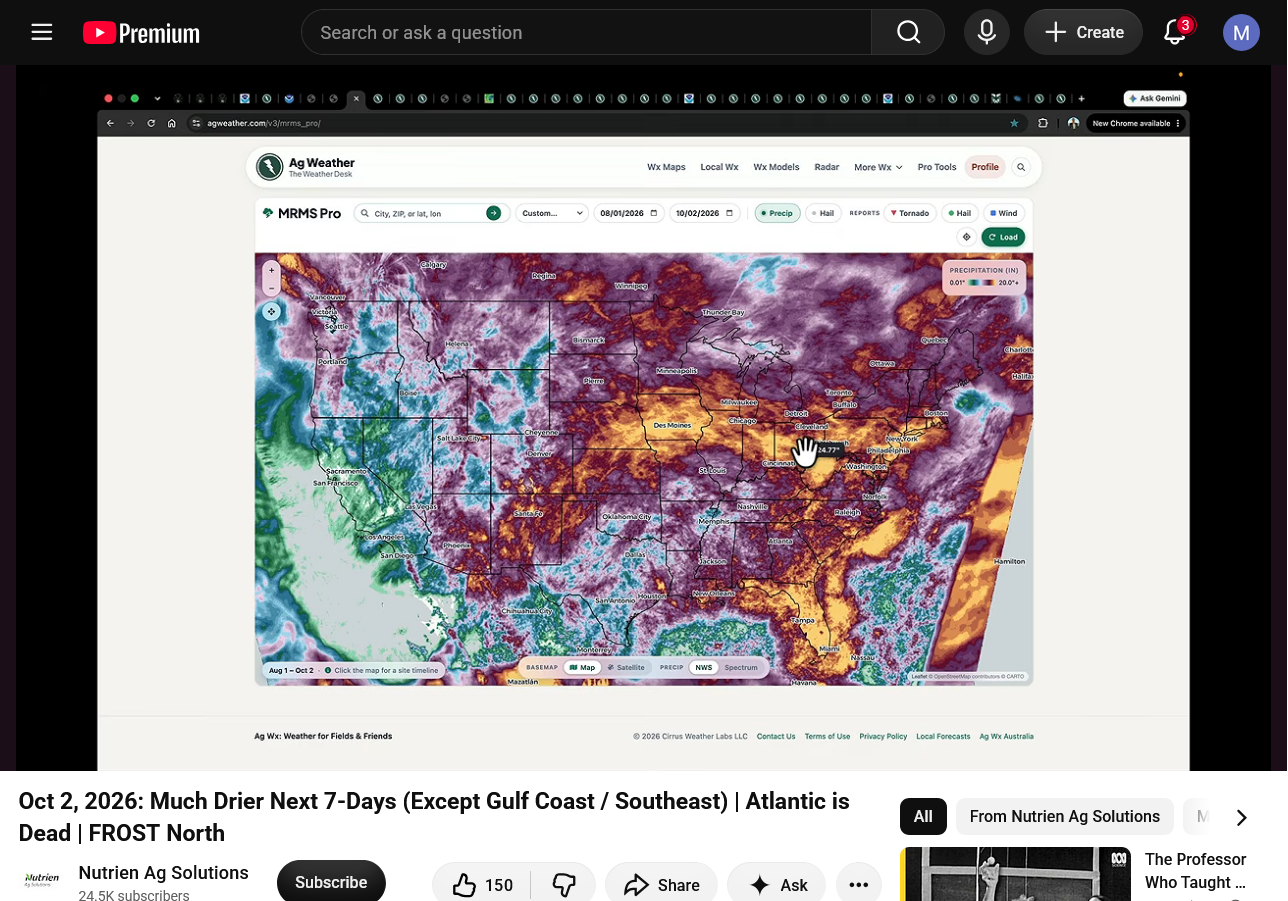
This was very similar to 2010 but shifted east. Rains below are for just August/Sept 2026. Excessive rains in too many places and almost no rain and extreme heat in too many places to NOT cause horrible finishing weather and early harvest weather for corn and beans.
I've been watching our radar.
Just .46" so far here with 1"+ south of the Ohio River that has more hurricane Polo remnants to work with. Some places 2". Happy for them and at least we got some rain but we need much more than this with another long dry period coming up.
At least the low sun angle doesn't bake the ground and increase evaporation rates in October. And crops are no longer growing, in fact dry is mostly good for harvest (beans exception below)
Another wave has formed in S. IL that will give us 1 last chance for a few tenths.

AI Overview
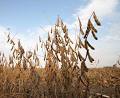
Yes, soybeans can definitely be too dry to harvest.
While the ideal moisture content for selling and storing soybeans is around 13%, letting them drop below 10% to 11% creates serious financial and mechanical problems.
Problems with Overly Dry Soybeans
Tips for Managing Dry Conditions
+++++++++++
Thanks to Eric for our weather! Widespread dry weather the next 10 days! Possibly thru much of October.
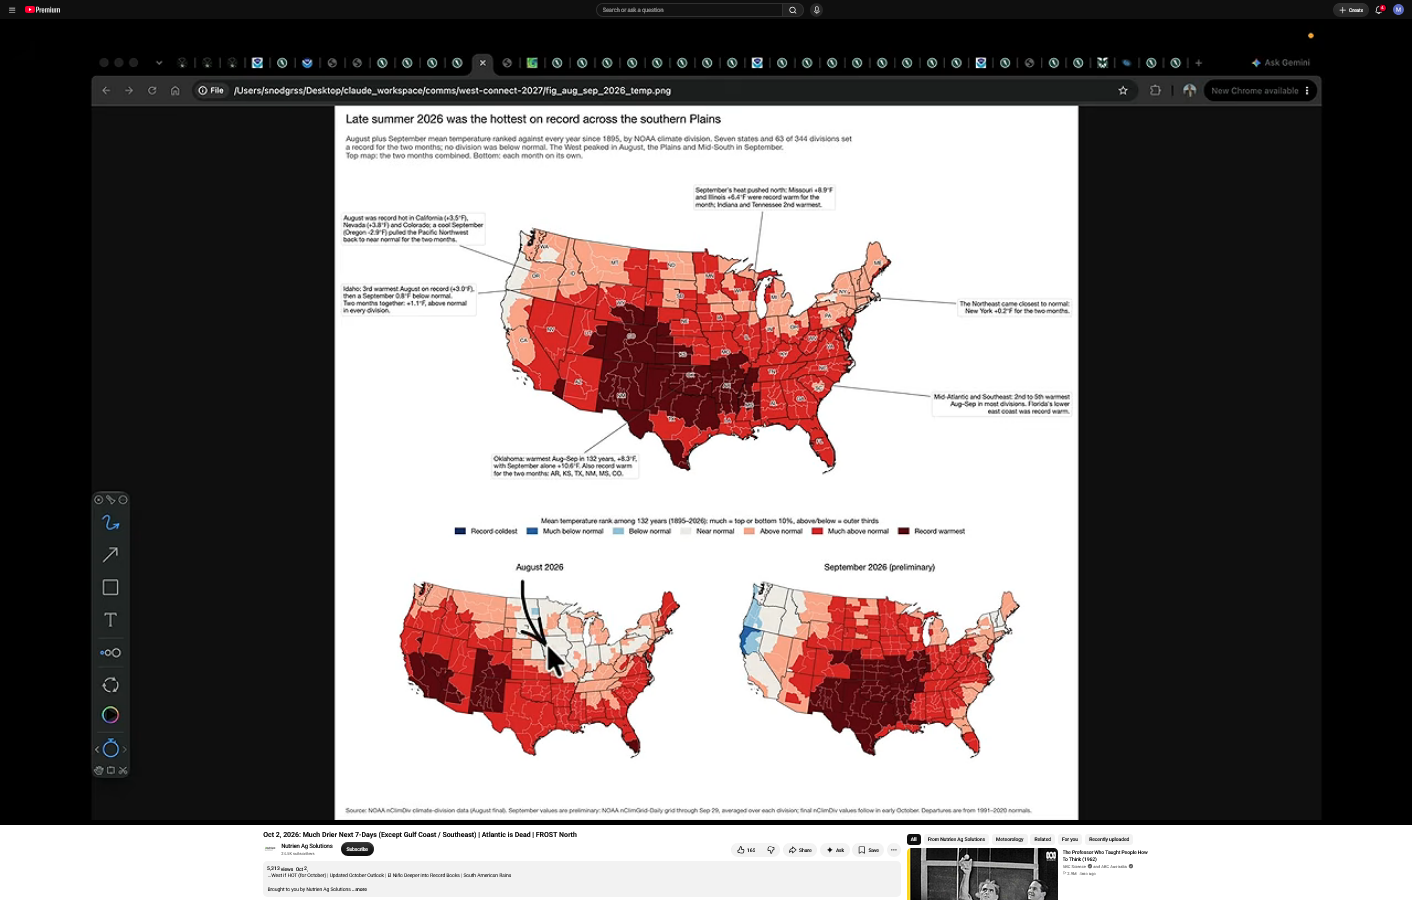
August/September period was the hottest in history in the dark reds. Good thing that the most intense heat didn't hit until the very end of pod/kernel filling and after it.
++++++++++++++
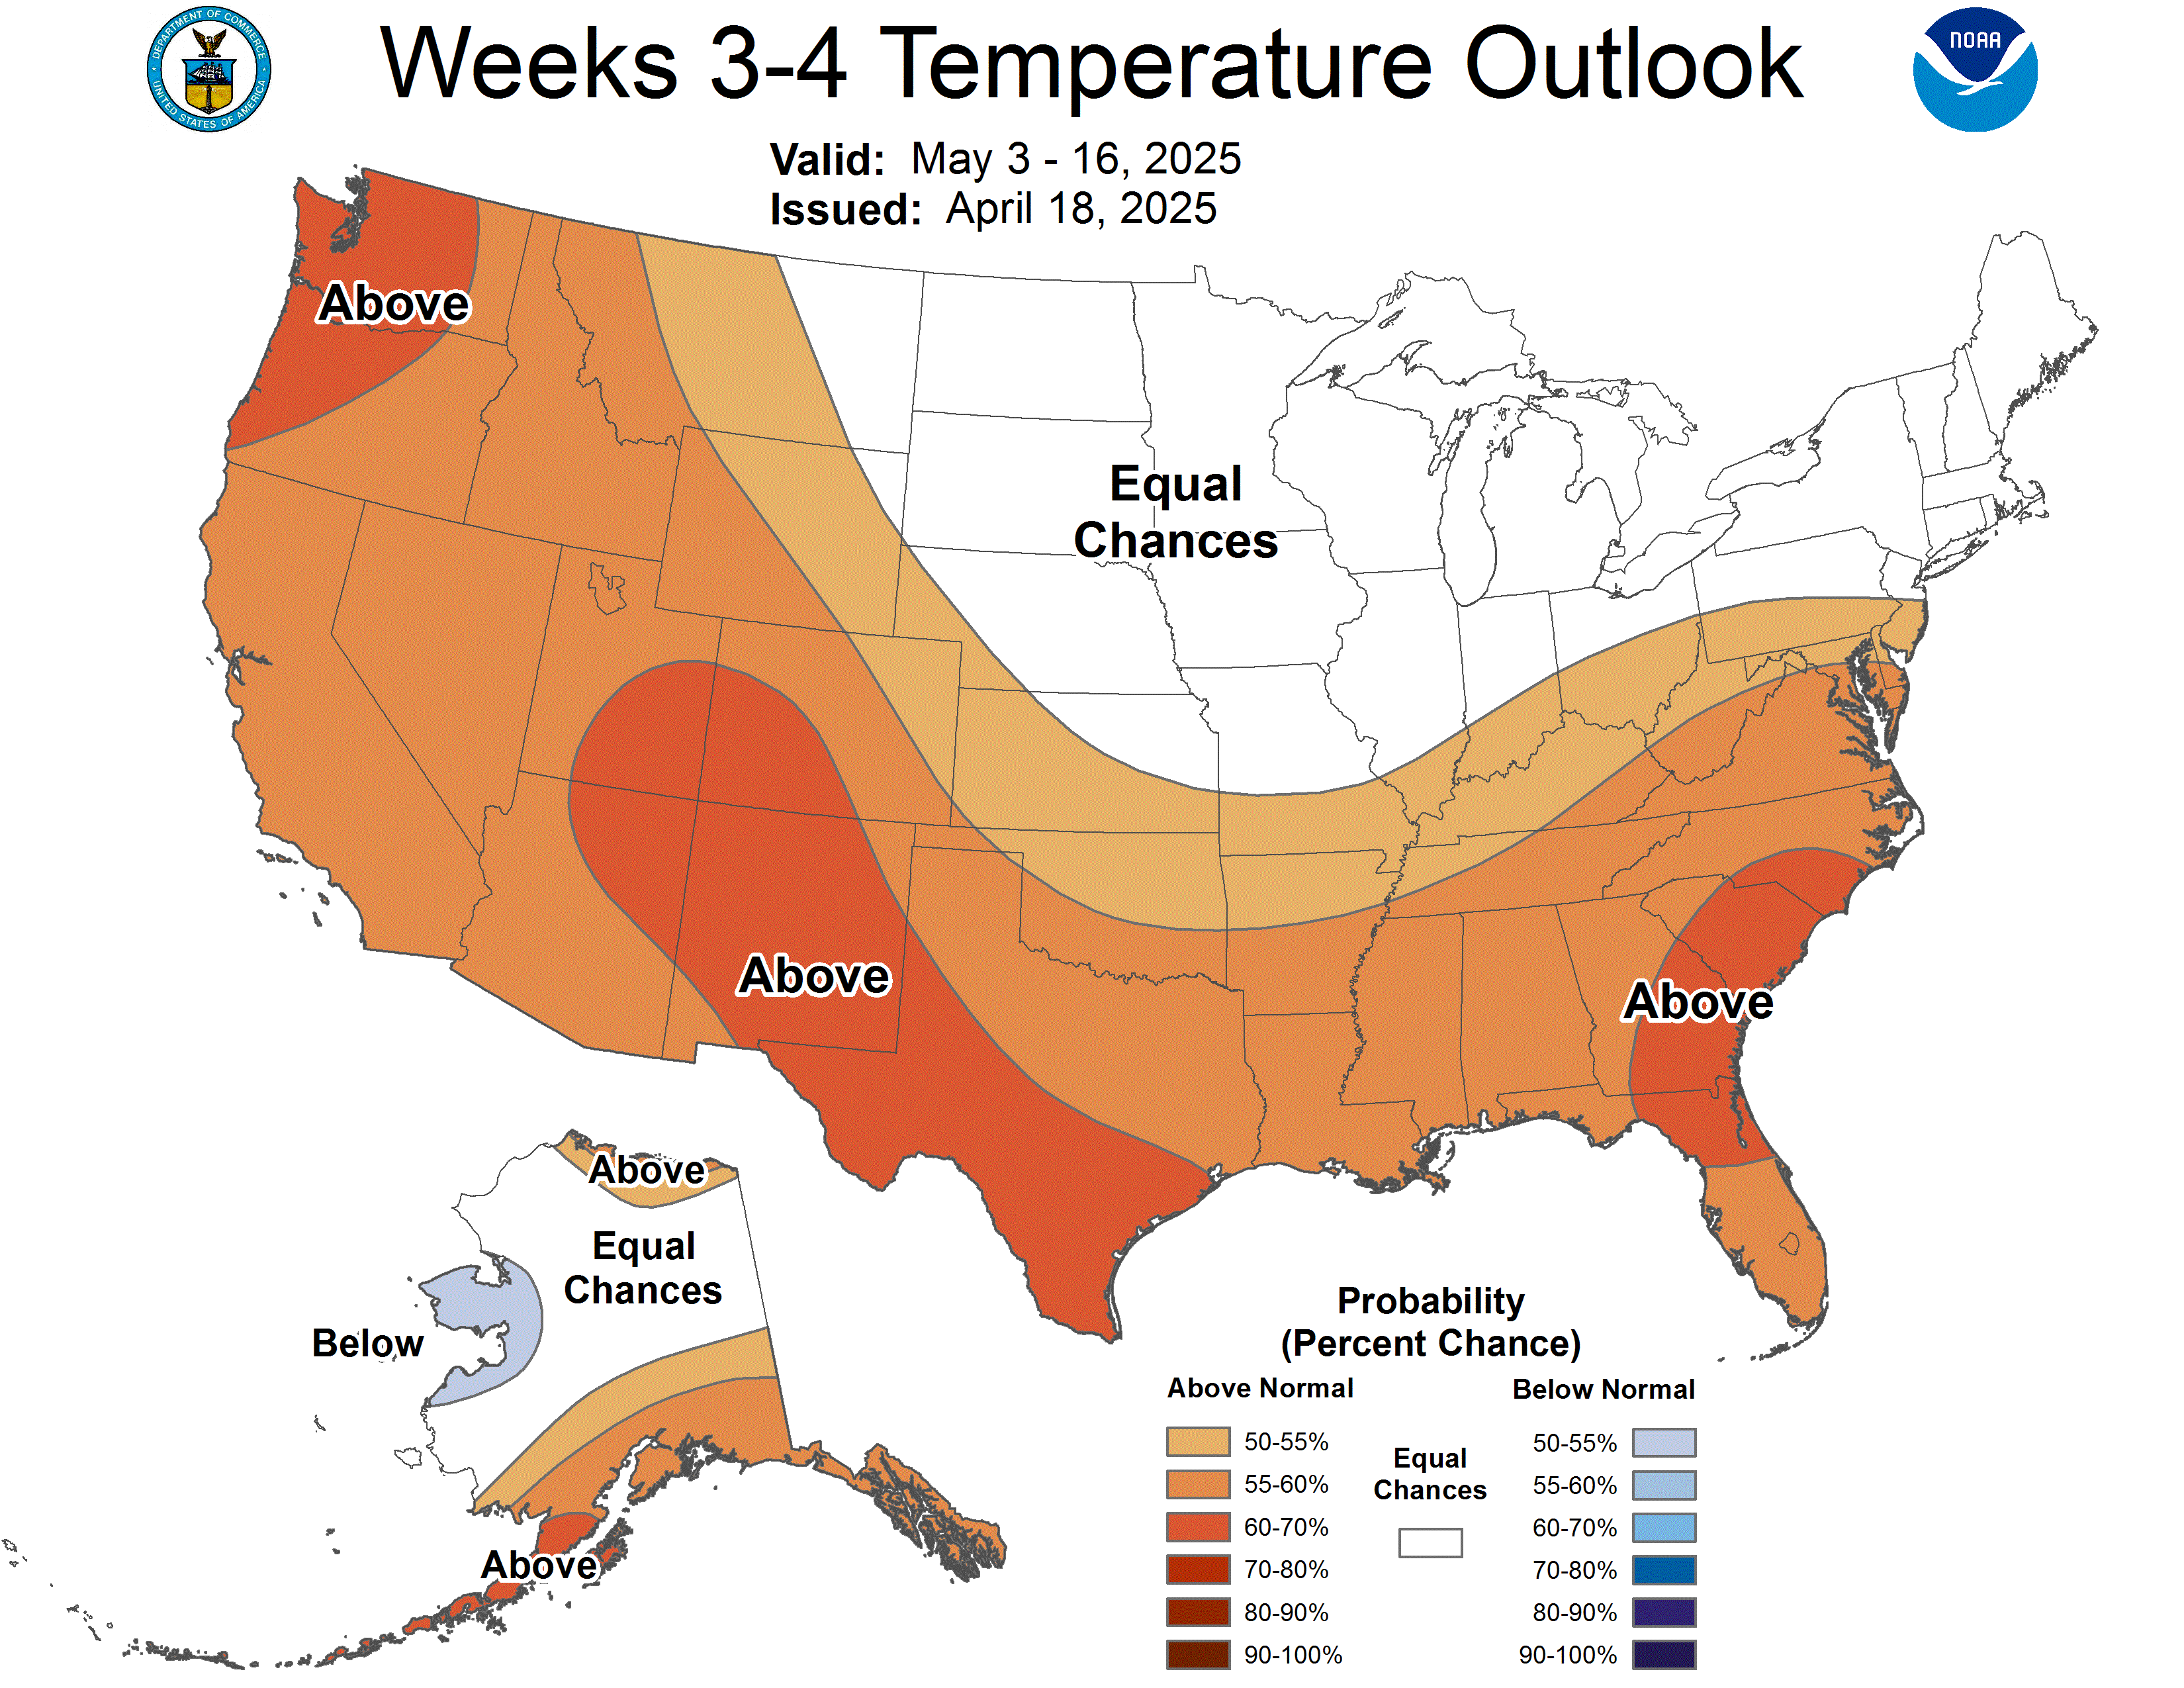
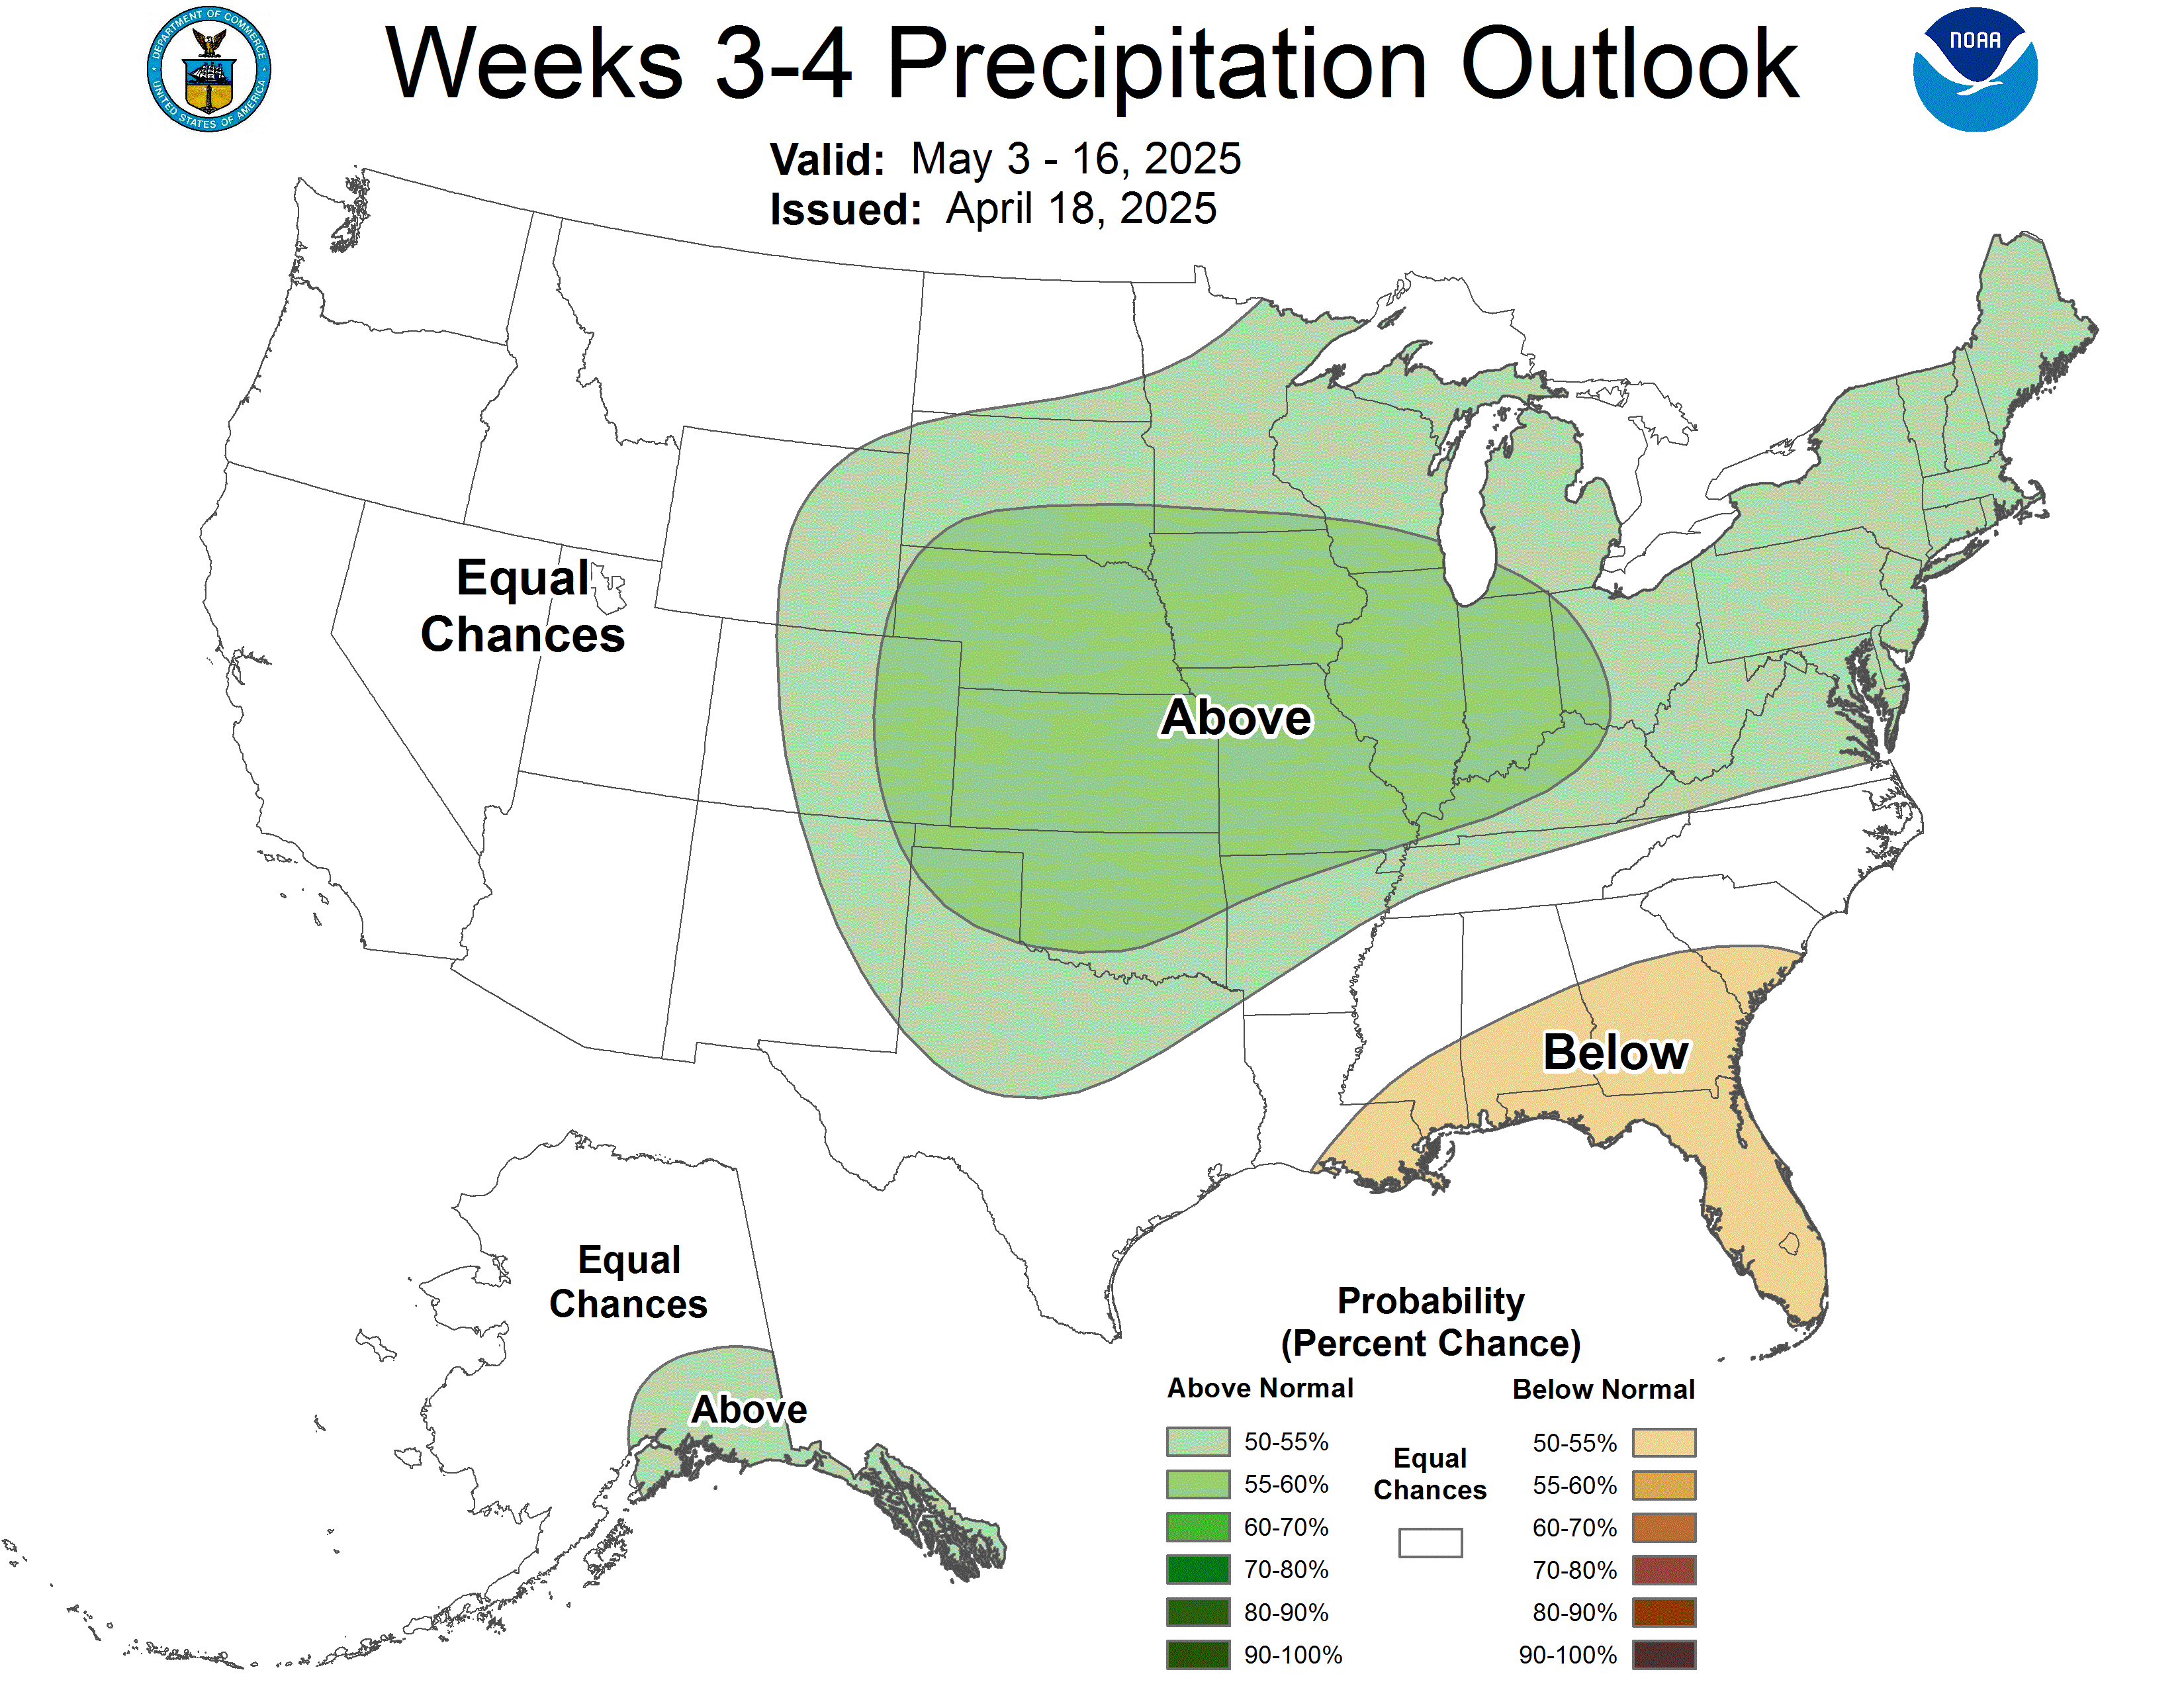
This is the low skilled week 3-4 outlook:
https://www.cpc.ncep.noaa.gov/products/predictions/WK34/
The grains are back up overnight.
A potential underlying bullish factor that has Been supporting the grains is the super duper El Niño.Odds are pretty high that it will wreck the weather pattern in a few places with enough extreme wet or extreme dry to negatively impact the global supply, especially from the Southern Hemisphere With its upcoming growing season.
This could be responsible for an unusually huge amount of risk premium in the current prices.
U.S. corn and soybean harvests have slipped behind the five-year average pace after a wet finish to September. Corn conditions fell below expectations and winter wheat planting progress matched the lowest estimate. However, cotton harvest is slightly ahead of avg at 23% done.
WSADE report Friday 12:00 CDT
Thanks for letting us know, cutworm!
Weather is not a player and there are some strong cross currents for the grains.
USDA report NOT shockingly because this is what USDA does so often was SHOCKINGLY bearish compared to market expectations!
Between now and January, it would also NOT be a shock to see them come out with a bullish report that takes back some of the bearish elements from this report. I'm NOT predicting that. I learned to never have a position during an always unpredictable USDA report almost 3 decades ago.............no matter the weather's impact.
It is possible they could be right THIS time. I'm merely commenting based on observations of them and their history regarding these particular reports with numerous previous comments that included examples (where they completely miss the estimates target to the right one time, then completely miss it to the left the next time-which suggests either blatant incompetence or else people maximizing their position to cause knee jerk, price surprises for personal profits).
·
U.S. corn yield comes in well above trade expectations while soybean yield lands slightly above.
·
USDA's October report delivered a U.S. corn yield surprise, coming in 3.5 bpa above the average trade guess. The most notable move was +11 bpa in Nebraska. Illinois is the only major state where yield went down.
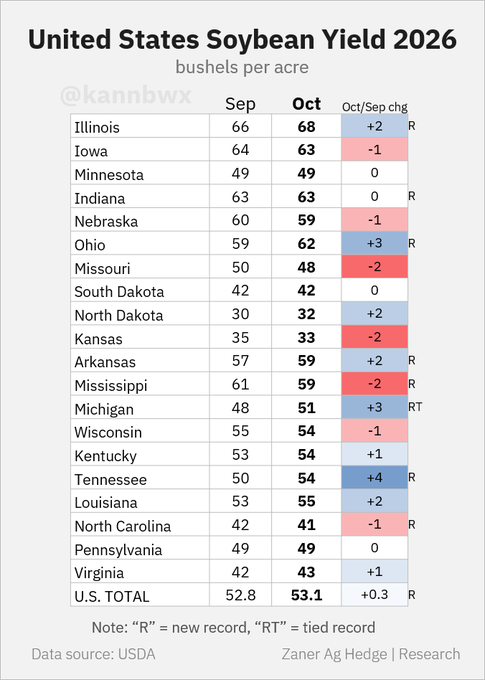
U.S. soybean yield increased slightly from last month's estimate as state-level movements were mixed. Top producer Illinois is seen reaching a record 68 bpa, and Ohio is set to reach the 60-bpa mark for the first time ever.
USDA adjusted Argentina's old-crop corn and soybean production, but no movement yet on the new-crop side. Brazilian estimates were left unchanged from last month, with USDA still expecting a record 186-mmt soybean harvest in 2026/27.
An unexpectedly large U.S. corn crop drove USDA's estimate of global corn ending stocks above all pre-report predictions. Top wheat exporter Russia's shipments were cut by 3 mmt to 40 mmt, down from 48 mmt last year. China's soybean demand assumptions were unch from Sept.
These were the temperatures for the last 30 days of finishing weather for the crops. Corn kernel fill and bean pod fill.
https://www.cpc.ncep.noaa.gov/products/tanal/temp_analyses.php

++++++++++++
This was the drought map released after that period
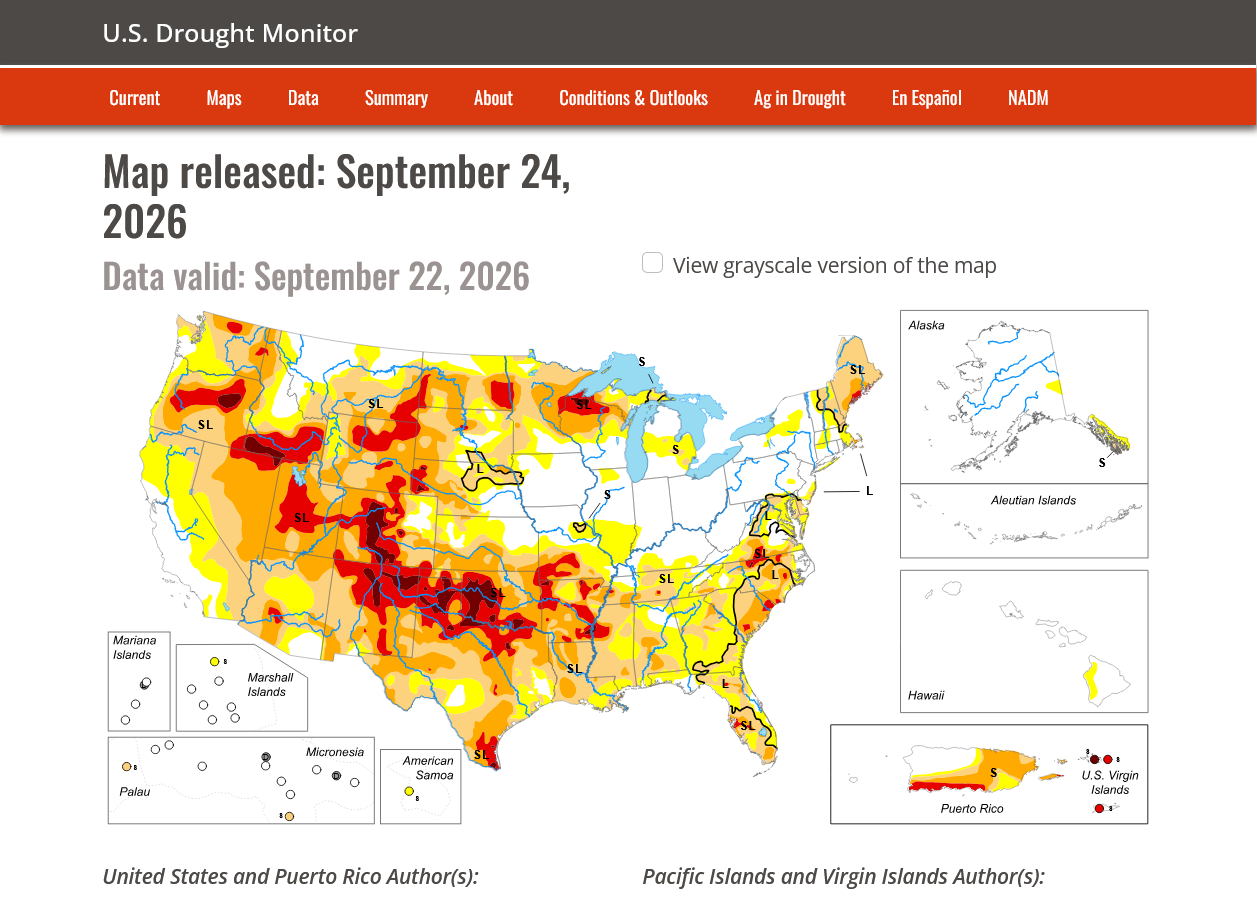
Please explain to me how a state like Arkansas saw it's soybean yield go UP +2 bushels/acre with these conditions??? Extreme drought and near record heat???
We had a Heat ridge in the SouthCentral US baking the crop with excessive rains around the periphery/to the north in the Midwest.
Rain makes grain...........however, 5 times normal rain with extreme, 1 in 100 year flooding WRECKS GRAIN!
JUST ASK CUTWORM!
The color bar below doesn't go nearly high enough to capture how extreme the rains were in IL/IN/OH. And the rains were not even spread out. They happened in huge, crop damaging events!!!!
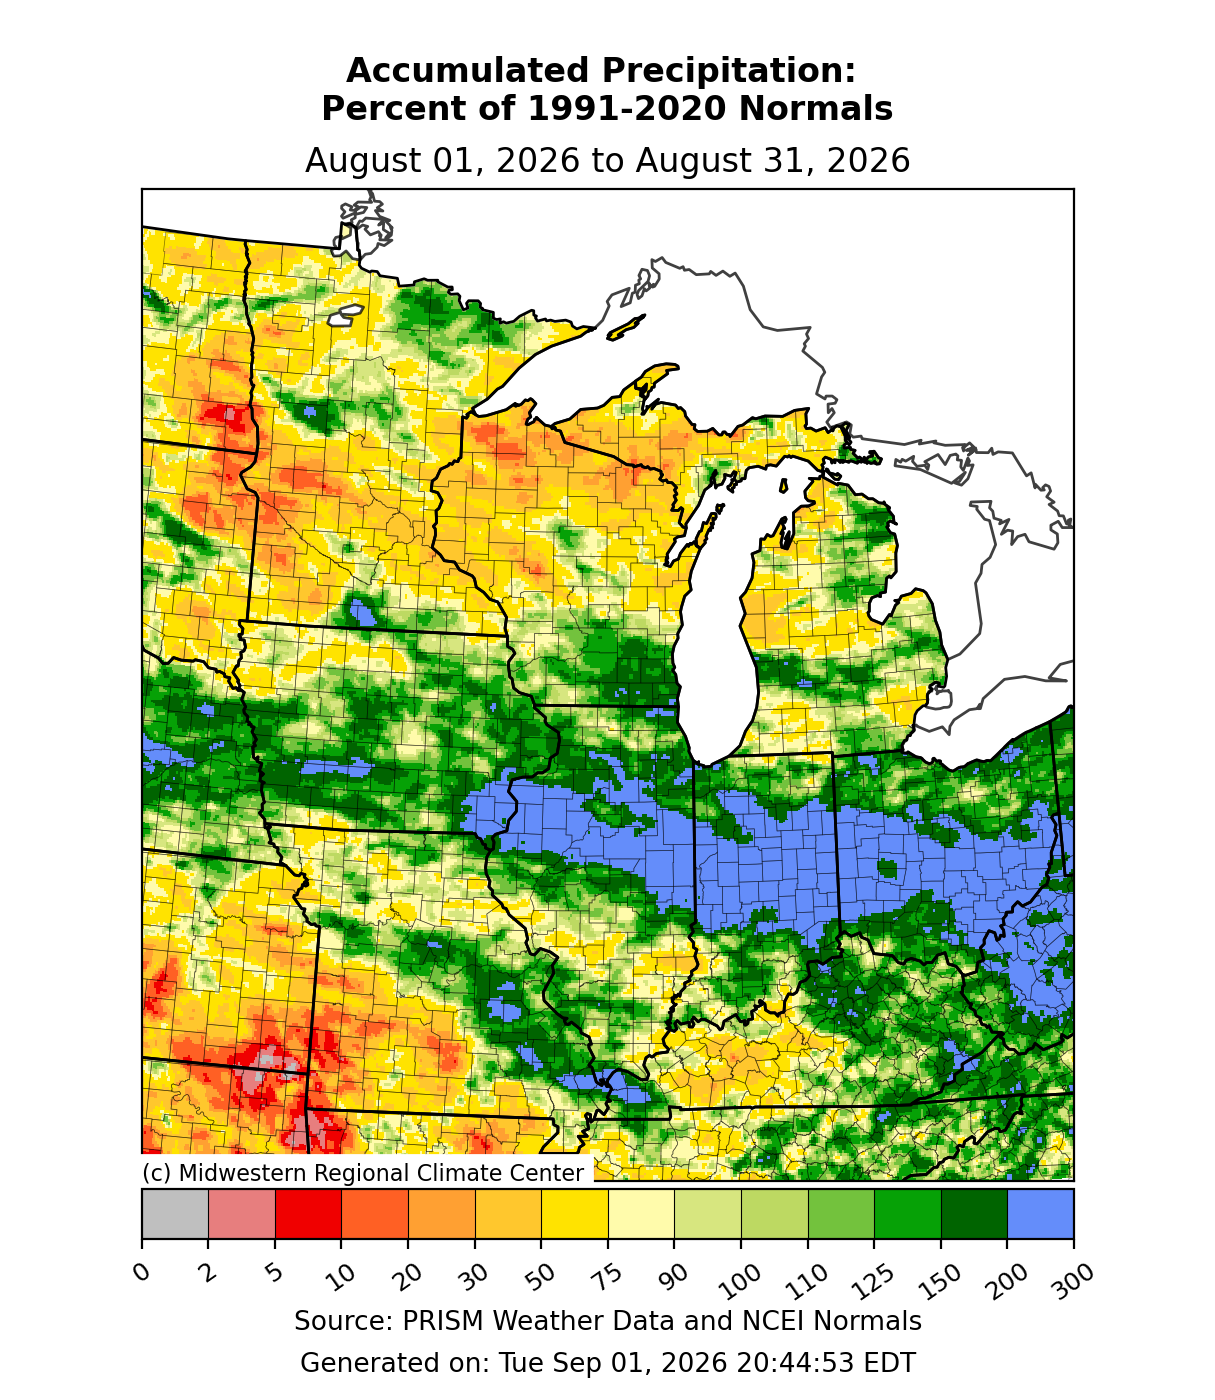
By metmike - Aug. 16, 2026, 8:34 p.m.
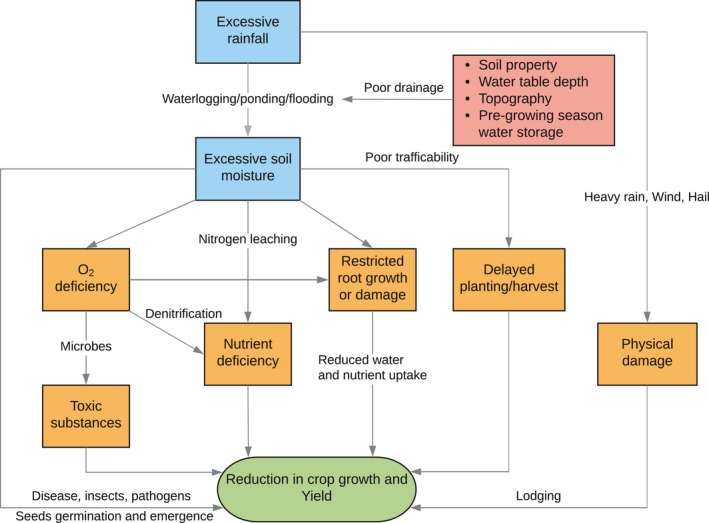
Excessive rainfall leads to maize yield loss of a comparable magnitude to extreme drought in the United States
https://pmc.ncbi.nlm.nih.gov/articles/PMC6850578/
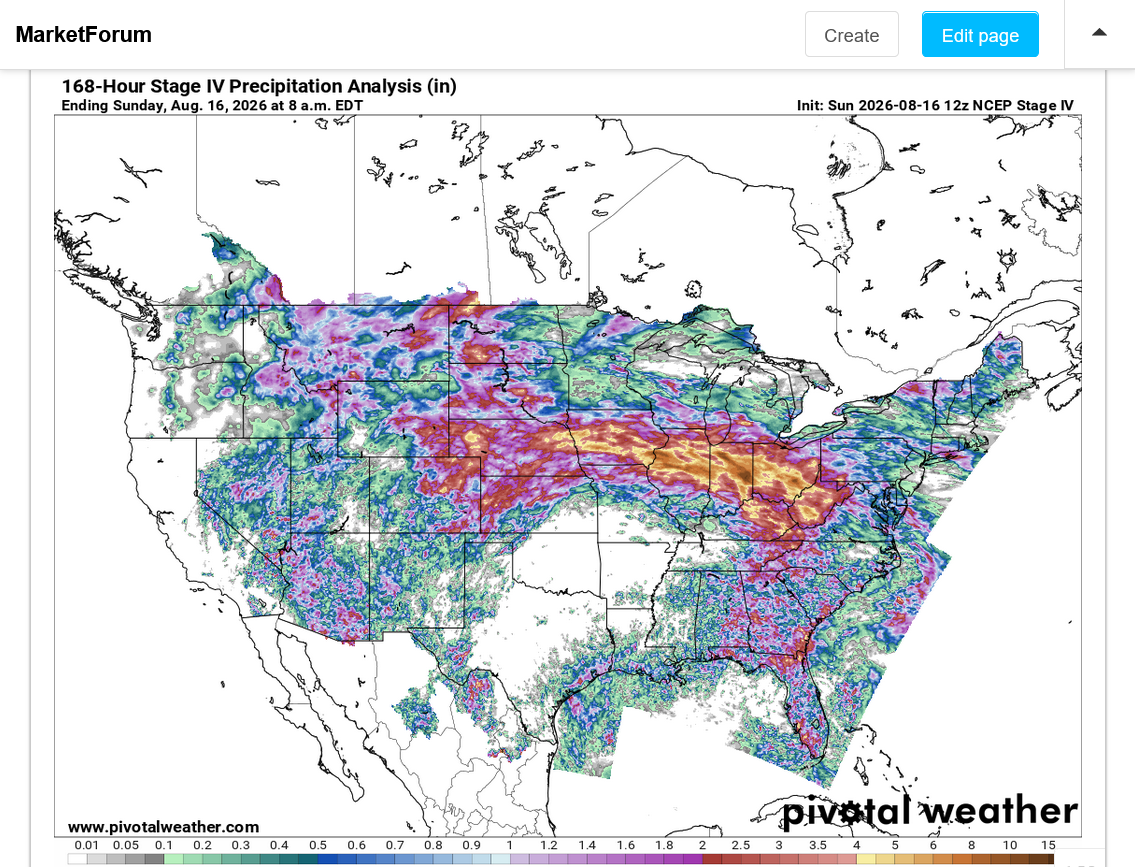
https://www.pivotalweather.com/maps.php?ds=stageiv&p=stageiv_qpe_168h_p&r=conus
1st image is 7 day totals thru Sunday Morning that captures most of the heavy rains.
2nd image is 7 days thru the latest image.
The corn market had it's strongest price move up in August in 50 years, partly because the weather was NOT ideal. The only way the USDA can justify these big increases is with near optimal weather (that did NOT happen) OR it grossly UNDER estimated the previous estimates.
++++++++++
OK, I just checked. It's the exact MO of the USDA that I described earlier. The August corn yield was LOWER than every estimate by every firm. I just showed you the finishing weather above. There is no justification for INCREASING yields, except to FIX THEIR GROSSLY TOO LOW AUGUST MISTAKE.
This is how they do it with BULLISH, then BEARISH shockers to make money with positions ahead of the reports.
There is no honest organization that operates this way.
Let's say the true value for something is 180 and that's what everybody, using the same conditions as you expects. An honest source will tell you it's close to 180, then next month is still close to 180 with some minor tweaks, then the month after that more tweaks but STAYING CLOSE TO THE BULLEYE as possible.
A dishonest source will go completely off the target of the market/expectations with an extreme number to the left, not even on the original target.
This causes the market to automatically SHIFT TO THE BRAND NEW TARGET on the left established by the authoritative source.
A dishonest source will then go completely off the NEW TARGET but to the RIGHT this time, closer to the OLD TARGET from 2 months earlier. This jacks over everybody in the market with the dishonest source, being the only ones knowing this will happen, having 2 huge opportunities to be positioned for it's 2 shocker reports each time that contradict the previous ones and take us back to where we were to start with.
Read more about this in August, before and after they gave us the bullish shocker:
By metmike - Aug. 11, 2026, 6:40 p.m.
++++++++++++=
Imagine that, people in the government with no oversight exploiting the market for self enrichment
How does a crop get MUCH bigger than all market expectations, with adverse weather and FALLING crop ratings???
The graphs below depict the seasonal drop that we usually see in the crop condition because it usually looks best in the vegetative state and often declines during and after pollination, much of that from less than perfect weather taking away yield potential. However, everybody knows this. A crop projection in August, for instance assumes AVERAGE weather and a continuation of the seasonal decline in crop ratings.
At the very least, the case can be made that 2026, in red followed a downward slope very close to the average this past Summer. Comparing this to the +2.7 bushel increase the USDA gave us in the corn market is a WTF moment for the market!
https://www.nass.usda.gov/Charts_and_Maps/Crop_Progress_&_Condition/2026/US_2026.pdf
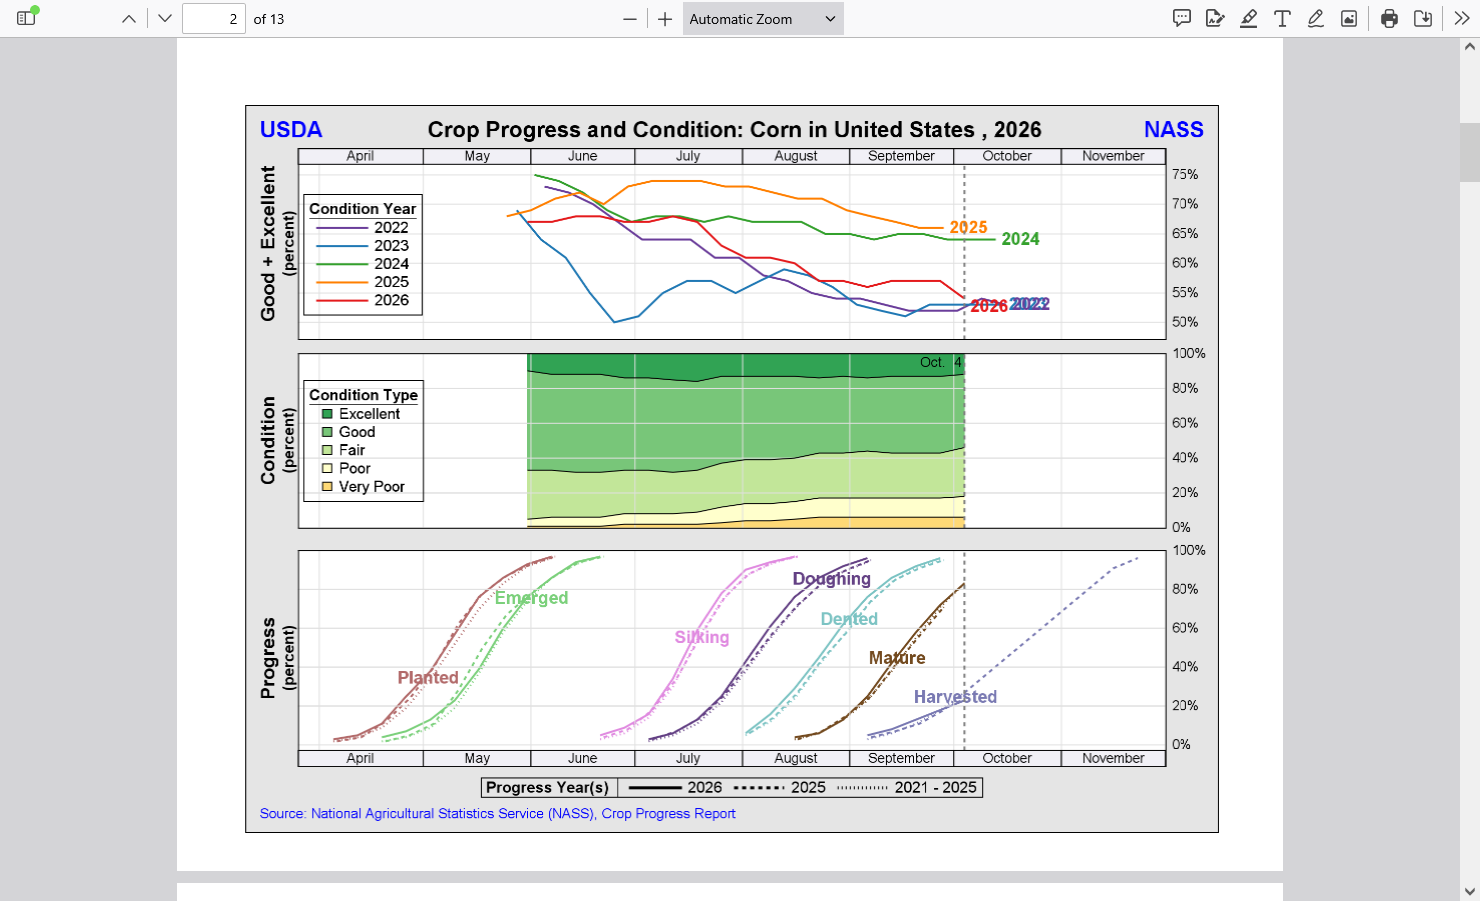
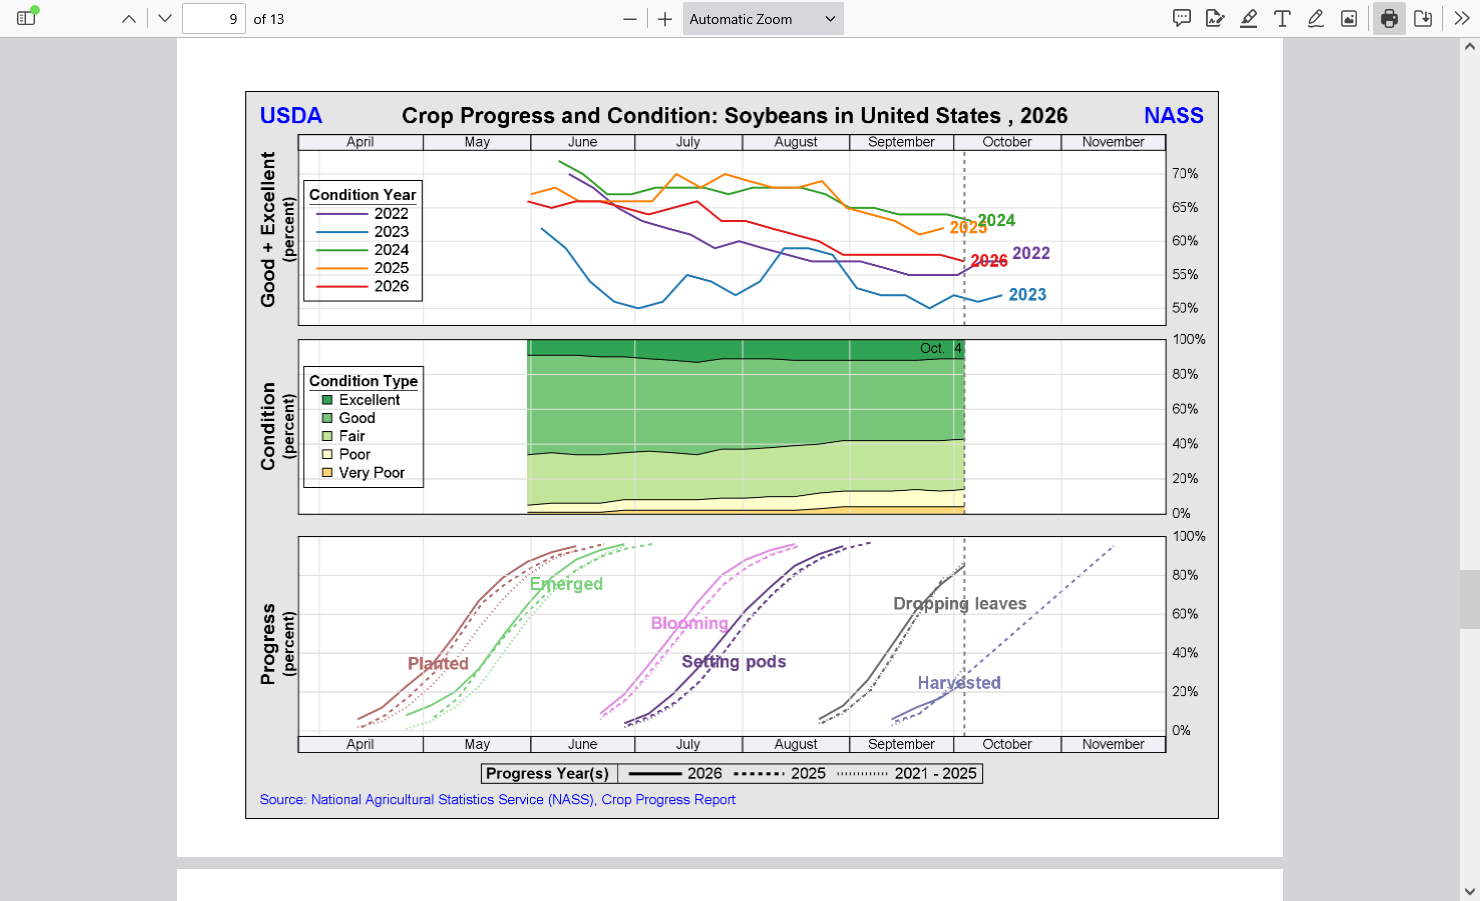
Keep in mind, especially for places like Arkansas this year for instance that crop ratings are based on the windshield view. How the crop looks on the outside. When you have HEAT FILL for corn and BEAN SIZE REDUCTION, pod FILL drought for beans, the plants often still look green and great on the outside.
While the corn kernels, hidden inside the husks are being deprived of the sustained filling time they need to become plump because the heat rapidly causes maturity before they can become plump.
And the soybean plants don't have the soil moisture the roots need to fill beans inside pods.
It's basic agronomy 101 science and every producer knows it without reading it in a book or online.
Here's the thing with the benefits of CO2 increasing. It does best with vegetative health. The more leaf area a plant has, the more sunshine it can capture and convert short wave radiation from the sun into chemical energy in the plant. It does help a plant to be more drought tolerant and conserve limited moisture from not opening their stomata as much to get the higher CO2 which reduces plant transpiration(water loss from roots).
But it can't stop a corn plant from maturing fast from heat thus reducing the time that plant spends filling the kernels. Corn matures based on Growing Degree Days.
Even with tons of rain, heat fill will reduce corn yields. Fortunately, this year the main corn growing areas did not have much heat fill until the very end. But they had record rains several times, the likes of which only happen rarely. Higher CO2 in this case provides NO PROTECTION. Plants that conserve moisture are no help during record flooding rain events.
We need rain badly here in southwest IN. The growing season is coming to an end but my asphalt drive has developed some big cracks from the bone dry ground shrinking under and around it. I want to repair these cracks before it gets too cold but not if they are still opening wider!
The good thing is that the October sun angle is getting pretty low so the ground isn't being baked like it would be with a Summer drought. Evaporation rates are lower but at the same time, these bone dry air masses are enhancing the drying without the intense heat/sun.
| Week 3-4 Outlooks | |
| Valid: 24 Oct 2026 to 06 Nov 2026 Updated: 09 Oct 2026 | |
| Temperature Probability | Precipitation Probability |
Beans reversed and closed higher for the day which was the market saying it doesn't believe the USDA. A market that won't go down and even closes a bit higher on bearish news is bullish.
Corn actually traded limit down at times shortly after the report, closing down sharply (-20c) but 10c off the lows.
The volume for just December corn, the front month was an incredible 532 thousand contracts.
For the beans, it was also incredible at 271 thousand contracts.
Weather is not a factor for price determination so I have no strong opinions. The US Dollar has been going up because of the Fed being forced to increase interest rates to deal with Trump-flation.
That hurts our exports. While extremely high diesel prices because of Donald Trump are clobbering farmers, the trucking industry and others.
Report reaction: U.S. corn yield - wow. The +2.7 bpa from Sept is the largest Sept-Oct increase since 2005. Nebraska's +11 bpa by itself raised national yield by 1.2 bpa and added 106 mbu of production. More carry-in + bigger crop was not the narrative bulls were hoping for.
CBOT December corn futures lost ~42 cents on Sept. 30 and Oct. 9 combined as USDA on both days revealed heavier U.S. supplies than expected. Friday's yield surprise pushed the contract below longer-term averages, with the market now bordering on oversold territory. #cmdtyView
Funds remained historically bullish CBOT corn ahead of Friday's USDA report despite the recent pullback. How much did they sell after the huge U.S. crop estimate? And what does the changing U.S. supply outlook mean for corn globally? I explored both in my Sunday newsletter.
Wheat is backing up in the Black Sea with exports disrupted by war. USDA sees combined Russia & Ukraine ending stocks at 25.2 mmt (926 mbu) in 2026/27, a post-Soviet era record and up 72% since July. That stockpile is larger than the ENTIRE annual U.S. wheat export program.
+++++++++++
No crop rating/condition report today because of the holiday!
Mike, bcb, I would like your take on joes weather-market opinion.
Thanks, cutworm!
Always great stuff at that site.
I agree with Joe and his experience of weather being over hyped so many times in the past and failing to live up to expectations.
However, this is sort of like ignoring a hurricane warning because of the numerous times you evacuated and your house in the hurricane zone didn't get destroyed, so you stop believing.
I didn't use tornado warnings because 99.99% of people in the warned area wont get hit by a tornado. With a hurricane, there's a great chance of a storm that big will hit and its only a matter of how bad it will be.
With this Super Duper El Nino being so huge, there's a great chance of extreme weather in several locations. It's just a matter of WHERE those locations will be. Joe identified the risk regions and the type of extreme weather potential which lines up to my previous posts in the El Nino thread.
Here's the thing. Movement in the atmosphere is not like traffic driving northbound on I-75. Where a car going 70 mph in Cincinnati is going to reach Toledo, OH in just under 3 hours, with no chance of it arriving in Cleveland, or Fort Wayne, IN. You will have a high accuracy in predicting this under normal traffic flow.
In the atmosphere, we can identify the biggest driving forces. In this case, the biggest driving force in history, so this would be like our vehicle going at 120 mph compared to a 70 mph average. And the atmosphere, though dominated by steering currents that are like highways in the sky for weather systems are different because of OTHER large scale features in different locations and their relationship/spacing to the El Nino. This impacts the exact atmospheric highways for the extreme weather anomalies caused by the El Nino.
There certainly WILL be extreme weather from this Super El Nino(near 100% of that if these anomalies play out) and the highest risk locations have been identified based on previous El Nino's and the average. But we know that the average includes years that were outliers that . were much different than the average AT ANY 1 LOCATION!
Much of that difference was caused by the atmospheric highway during the (Super) El Nino year to deflect to the left or right, like taking a car in Cincinnati and speeding it up from 70 mph to 120 mph but directing it to go northeast on I-71 instead of north on I-75. On that path, the car drives thru Columbus instead of Toledo, OH.
Teleconnections with other, unknown large scale features will determine what the path of El Nino driven storms and droughts will take. The risk for extremes is as high as it can be in a long range forecast. The locations are speculative based on a wide spread in potential locations/outcomes in the past. We are using the most likely locations based on the averages of the past.
2-17-26 ElNino, here we come-FAST!
51 responses |
https://www.marketforum.com/forum/topic/117969/
Re: Re: 8-12-26 El Nino update WOW!!!!!
By metmike - Aug. 13, 2026, 10:46 a.m.
On the results of the USDA report on Friday. Below is a huge reason for why that report can be so different than what crop ratings and the market expected. This is supposed to make them more accurate and scientific. If this is what they did the last 2 years, especially 2 years ago then IT'S BROKEN with opportunities to maximize corruption with less accountability than in the past and certainly with less consistency and MUCH LESS predictability!!!
AI Overview
Yes, the USDA uses its own physical test plots to forecast corn and soybean production. This process is officially known as the Objective Yield Survey (OYS), conducted by the National Agricultural Statistics Service (USDA NASS). [1, 2, 3, 4]Rather than relying entirely on farmer-reported expectations, the USDA sends trained field technicians (enumerators) directly into a randomly selected subset of real production fields across primary agricultural states to gather physical measurements. [1, 2]
How the USDA Test Plots Work
Why This Matters in Current ReportsThe OYS acts as an objective, scientific check against the separate Agricultural Yield Survey (which compiles subjective producer estimates). [1, 2]When the USDA releases unexpected numbers—such as the recent October 2026 WASDE report adjusting national corn yields upward to 181.2 bushels per acre and soybeans to 53.1 bushels per acre—the market relies heavily on these actual test plot indications to verify or critique those estimates. Simultaneously, the USDA is expanding into the USDA Data Modernization Plan, testing how to scale these traditional sample plots alongside 10-meter satellite imagery and machine learning.
+++++++++++++++++++++++++
I'll repeat this again because it's so relevant.
Re: Re: Re: Re: Grains 9-30-26
By metmike - Oct. 9, 2026, 1:59 p.m.
How does a crop get MUCH bigger than all market expectations, with adverse weather and FALLING crop ratings???
The graphs below depict the seasonal drop that we usually see in the crop condition because it usually looks best in the vegetative state and often declines during and after pollination, much of that from less than perfect weather taking away yield potential. However, everybody knows this. A crop projection in August, for instance assumes AVERAGE weather and a continuation of the seasonal decline in crop ratings.
At the very least, the case can be made that 2026, in red followed a downward slope very close to the average this past Summer. Comparing this to the +2.7 bushel increase the USDA gave us in the corn market is a WTF moment for the market!
https://www.nass.usda.gov/Charts_and_Maps/Crop_Progress_&_Condition/2026/US_2026.pdf

https://www.nass.usda.gov/Charts_and_Maps/Crop_Progress_&_Condition/2026/US_2026.pdf

Keep in mind, especially for places like Arkansas this year for instance that crop ratings are based on the windshield view. How the crop looks on the outside. When you have HEAT FILL for corn and BEAN SIZE REDUCTION, pod FILL drought for beans, the plants often still look green and great on the outside.
While the corn kernels, hidden inside the husks are being deprived of the sustained filling time they need to become plump because the heat rapidly causes maturity before they can become plump.
And the soybean plants don't have the soil moisture the roots need to fill beans inside pods.
It's basic agronomy 101 science and every producer knows it without reading it in a book or online.
Here's the thing with the benefits of CO2 increasing. It does best with vegetative health. The more leaf area a plant has, the more sunshine it can capture and convert short wave radiation from the sun into chemical energy in the plant. It does help a plant to be more drought tolerant and conserve limited moisture from not opening their stomata as much to get the higher CO2 which reduces plant transpiration(water loss from roots).
But it can't stop a corn plant from maturing fast from heat thus reducing the time that plant spends filling the kernels. Corn matures based on Growing Degree Days.
Even with tons of rain, heat fill will reduce corn yields. Fortunately, this year the main corn growing areas did not have much heat fill until the very end. But they had record rains several times, the likes of which only happen rarely. Higher CO2 in this case provides NO PROTECTION. Plants that conserve moisture are no help during record flooding rain events.
+++++++++++
And especially because this isn't the first time. Anybody reading our grain threads in 2024, 2 years ago will remember me screaming that yields had suffered greatly because of the flash drought that hit during finishing weather. cutworm reported the same thing where he was but it was WIDESPREAD enough to have a huge negative impact and WE KNEW IN EARLY SEPTEMBER! How does the USDA say the opposite...........UNTIL JANUARY OF THE NEXT YEAR, when they suddenly shock the market by telling us what 2 yahoo's in Indiana knew with certainty 4 months earlier???? It's virtually impossible to explain without assuming their was intent because the USDA must have access to thousands of times more information than we do.
What did we use?
1. The weather, agronomy 101 and critical thinking
2. Our backyards multiplied by 1,000
+++++++++++++++
Thanks to Matt with our latest weather this morning! Oct 13, 2026: Record Active Hurricane Season | Temperature Swing | Active Pattern Next Week
https://www.youtube.com/watch?v=QoX4gmD8PVE
U.S. corn harvest reached 33% complete as of Sunday, below expectations and behind the five-year average. The weekly advance was also slower than normal for the date. Soybean harvest jumped 21 points to 46%, among the largest advances for this week in recent years.
++++++++++++
Thanks for the weather today, Matt!
Oct 15, 2026: Santa Ana Wind Event Deep Dive | Weekend Freeze | Plains Rain
By cutworm - Oct. 13, 2026, 7:40 a.m.
Mike, bcb, I would like your take on joes weather-market opinion.
SUPER El Niño is Coming. Do Traders Care?
+++++++++++
cutworm,
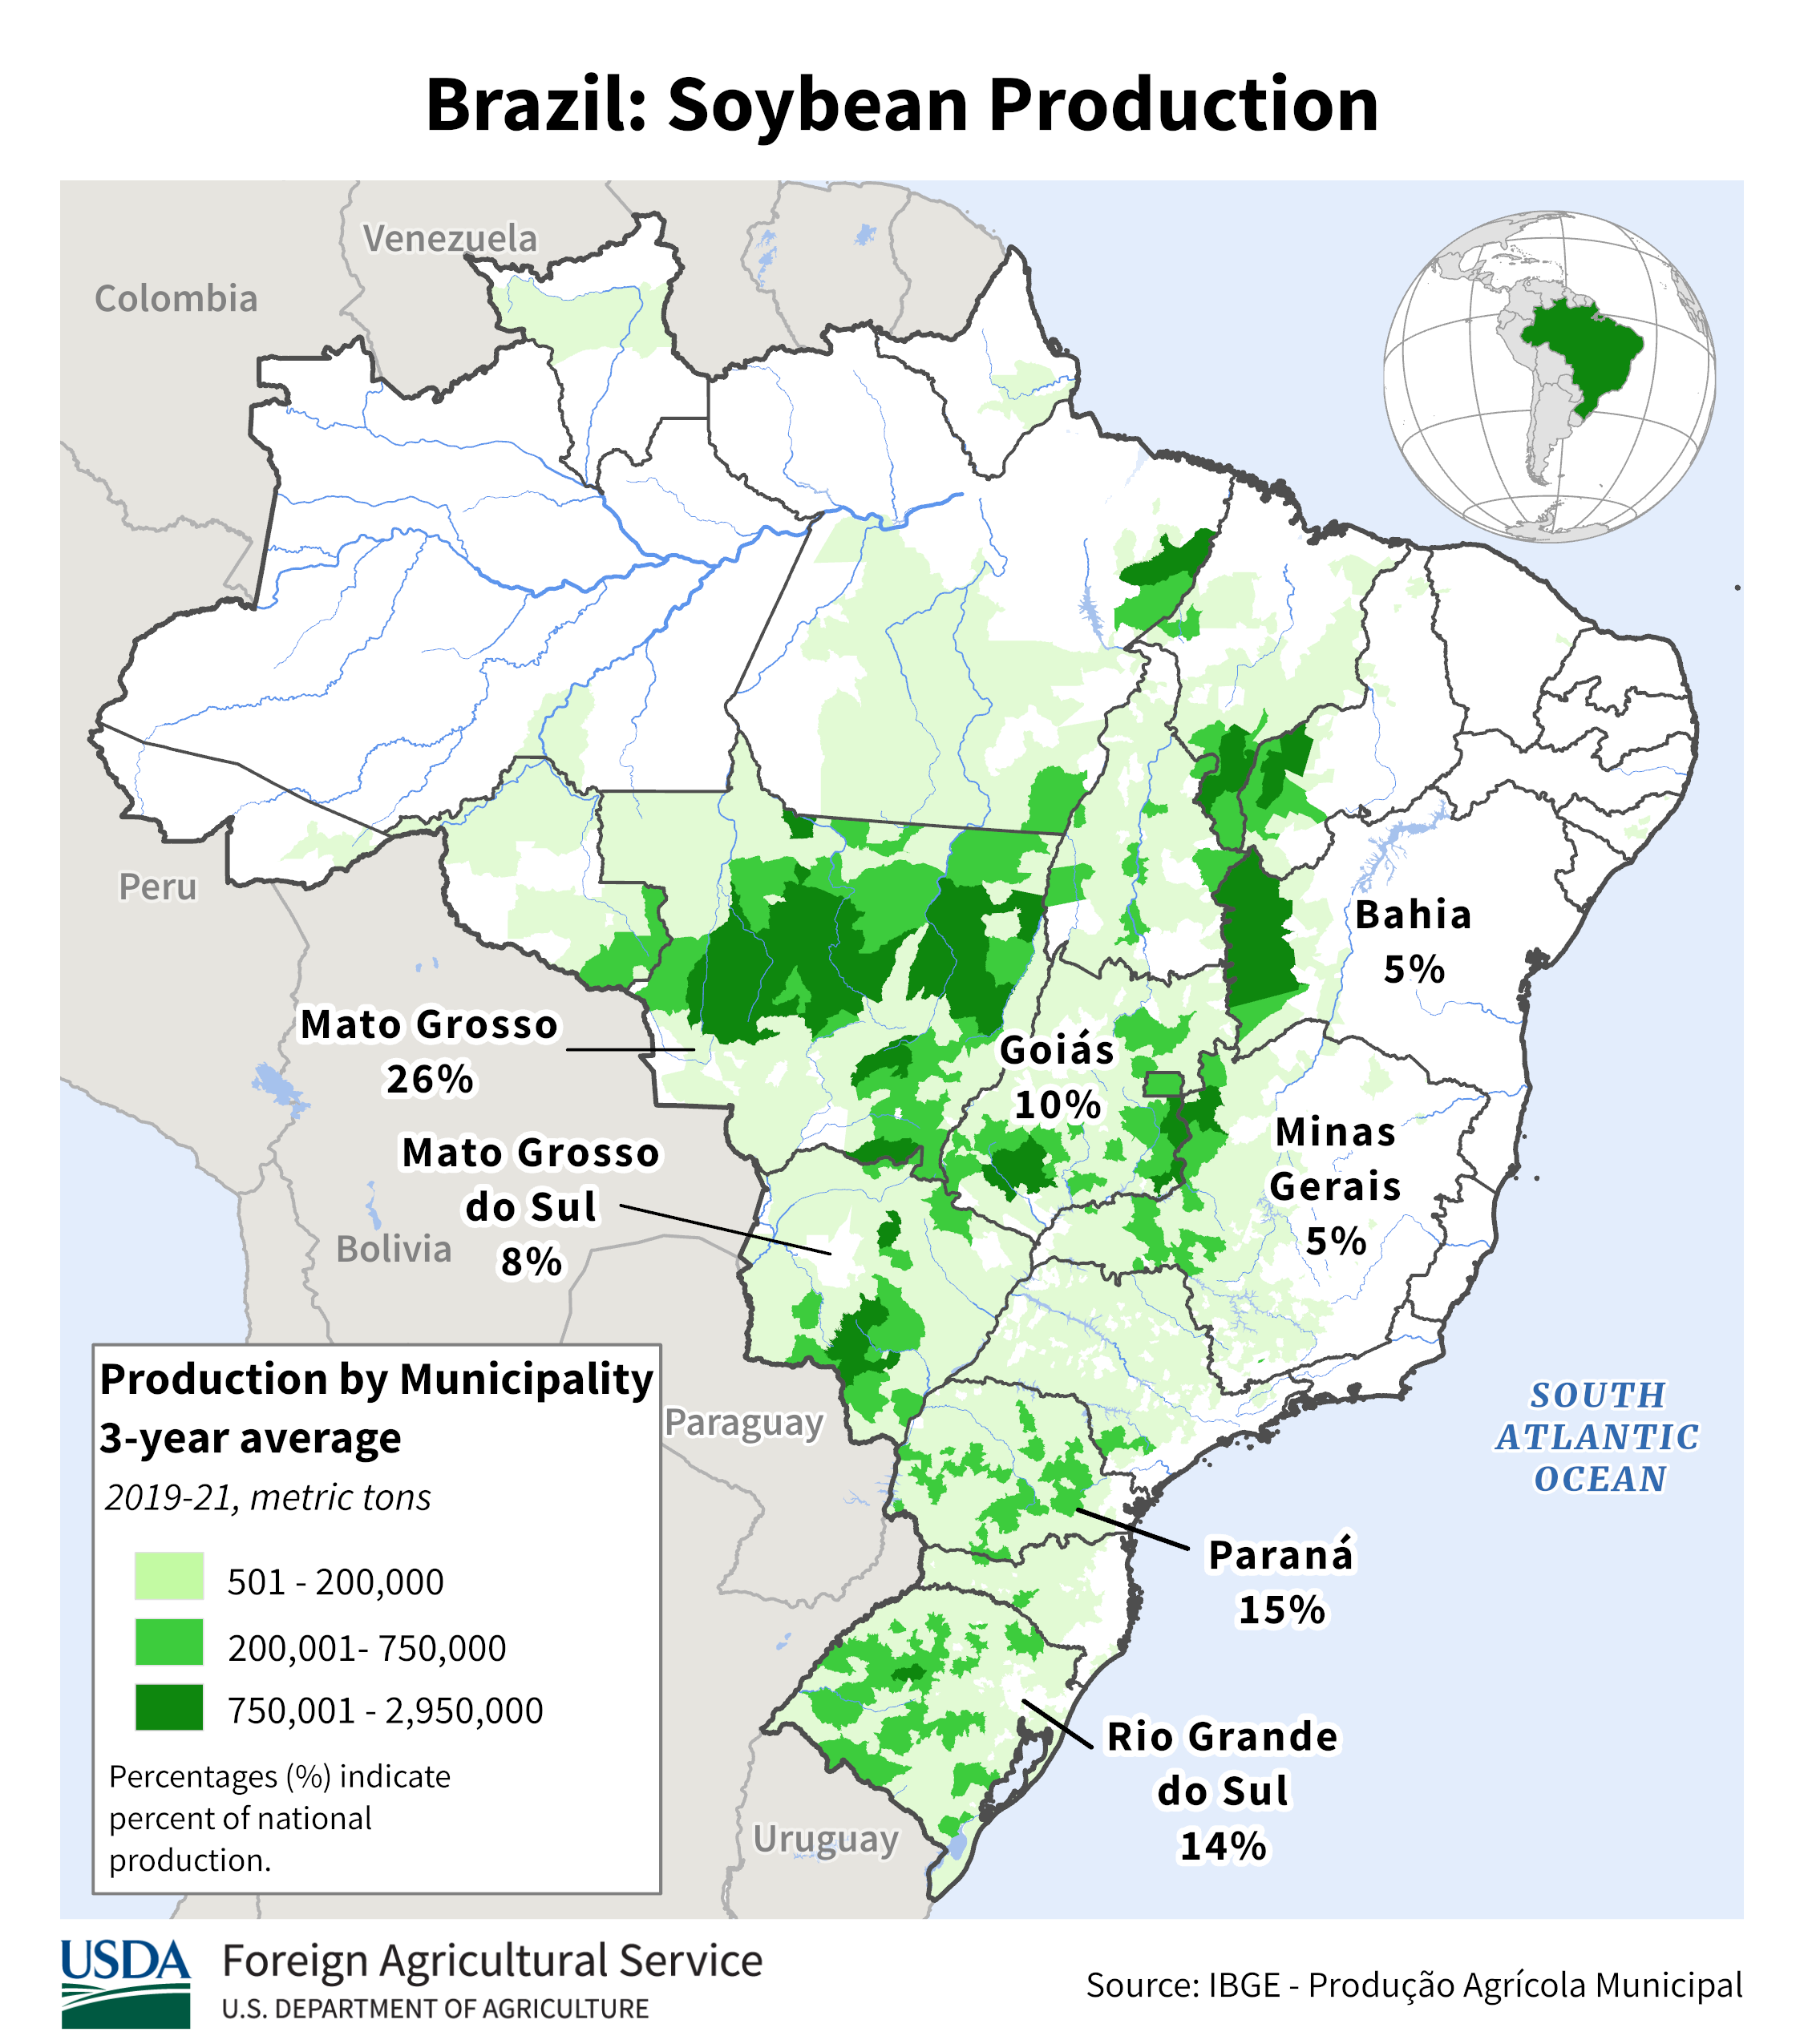
I already gave you my detailed explanation based on the principles of meteorology. Now we are having a REAL WORLD example of it below. Keep in mind that we still don't know the exact (massive) area of drought and potential excessive rains that this SUPER El Nino will cause. If it shifts north by 500 miles, Mato Grosso will be ok.
By metmike - Oct. 18, 2026, 2:46 p.m.
This is very interesting.
1. Here's the last 30 day period for rainfall anomalies from the 46 day outlook of the already updated European Ensemble model that is for most of November into the start of December. Potential for Matto Grosso in Central Brazil to dry out! Coffee ok but Bahia(north) may be dry.
2. The GEFS model only goes out 35 days. Here's the last 30 days of last evening's update. Whoa! This is what a SUPER El Nino will do. However, it's impossible to know the exact locations where it will happen. They could shift hundreds of miles north or south when deflected by other large scale weather features that the El Nino encounters as it moves away from the tropical Pacific.


Let's focus our attention on #1 soybean producer Mato Grosso
https://www.alamy.com/mato-grosso-red-highlighted-in-map-of-brazil-image363417132.html

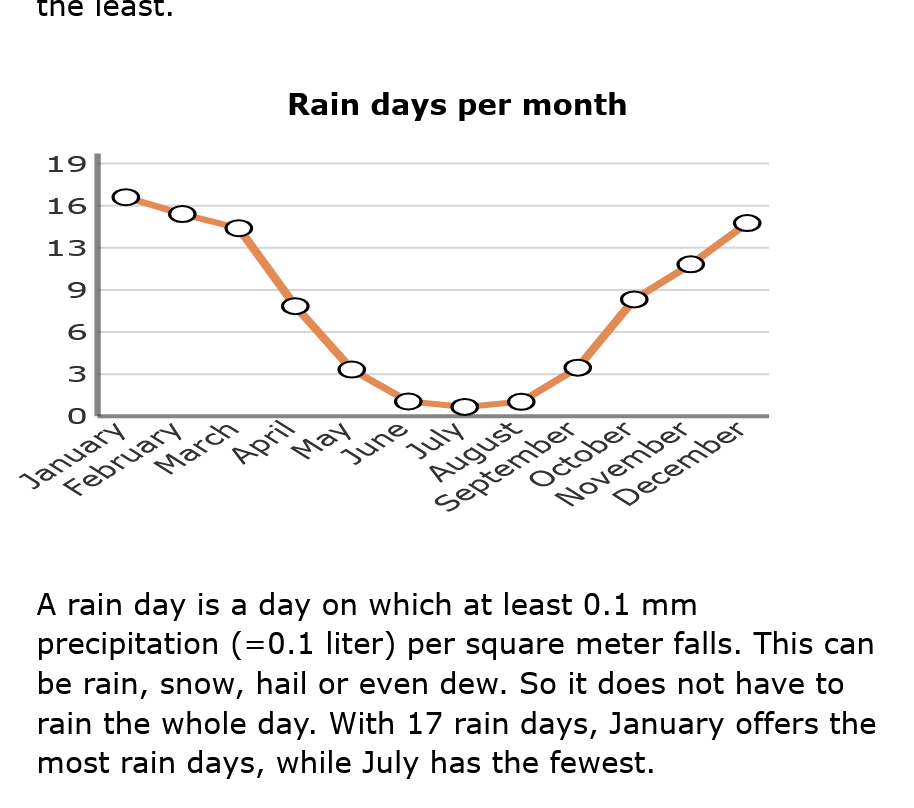
This city below is very close to the epicenter of soybean production: We should note that the rainy season/monsoon there is sometimes already starting here in October. However, things really get wet in November as the average 9+ inches of rain. Those heavy rains continue in D-J-F-M, then the dry season begins and lasts for 6 months.
The soils in Brazil can't hold moisture like our soils, so 9-12 inches/month is great not excessive.
Also, the latitude of Sinop is 11 degrees South. Compare that to Miami, Fl which is 26 degrees North. (Des Moines is around 41 degrees North).
This means that the intensity of the sun is BRUTAL all growing season. Great to use especially powerful solar radiation for photosynthesis, extremely bad in a drought that dries out and BAKES the soils which already struggle to hold moisture.
Sinop This city has a tropical climate. In Sinop, the quantity of rainfall during summers surpasses that of winters. The climate is classified as Aw according to Köppen and Geiger. The average annual temperature in Sinop is 25.4 °C | 77.6 °F. The annual rainfall is 1801 mm | 70.9 inch.

Click one of the graphs for more information.
+++++++++++I should add that this is NOT NEW NEWS! And there is over a month to go before planting gets underway in Mato Grosso. Plenty of time to change from the extremely bullish GEFS.
However, IF that solution is correct and that drought lasts into December, look for soybeans to easily make new highs.
++++++++++++
Midnight:
Unlike corn "harvest" lows recently that have been coming at the start of harvest and not been predictable, soybean harvest lows are usually sharp, V bottoms and in October:
Each year is different. This year, the funds loaded up to record longs, then the USDA gave us a bearish surprise.
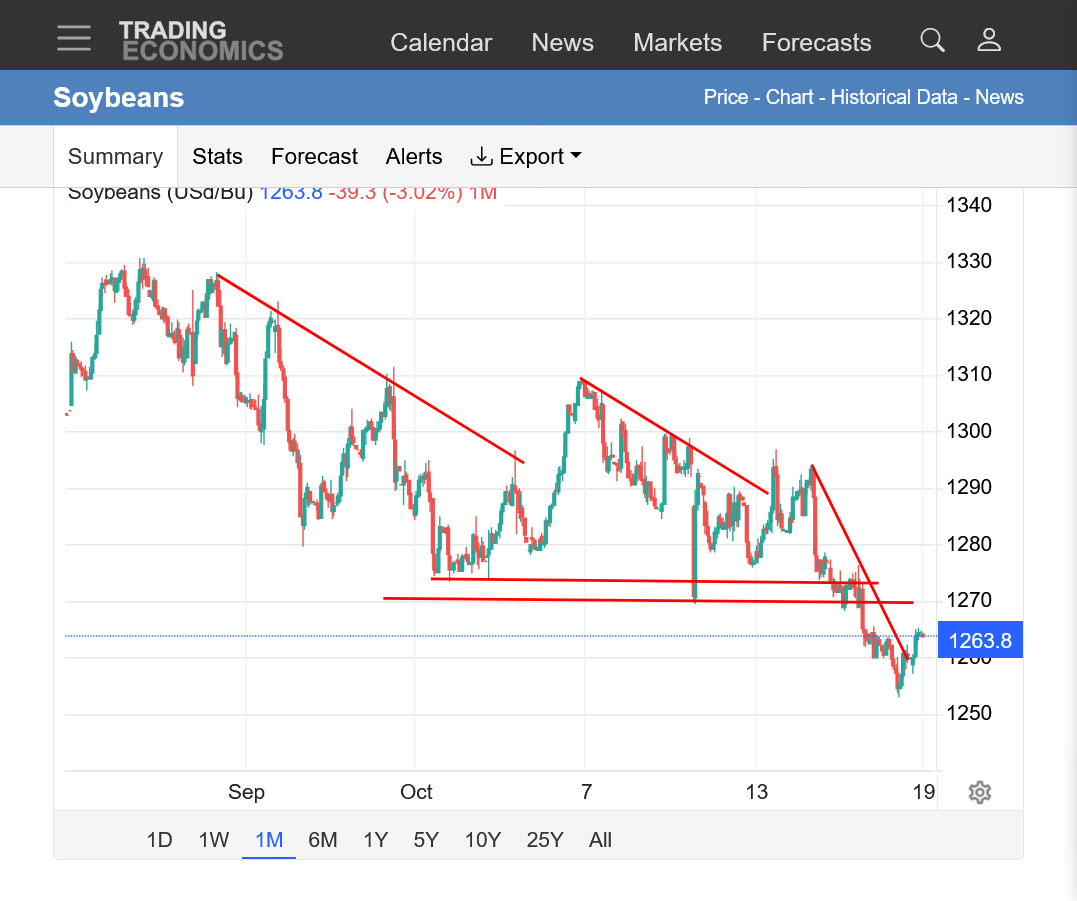
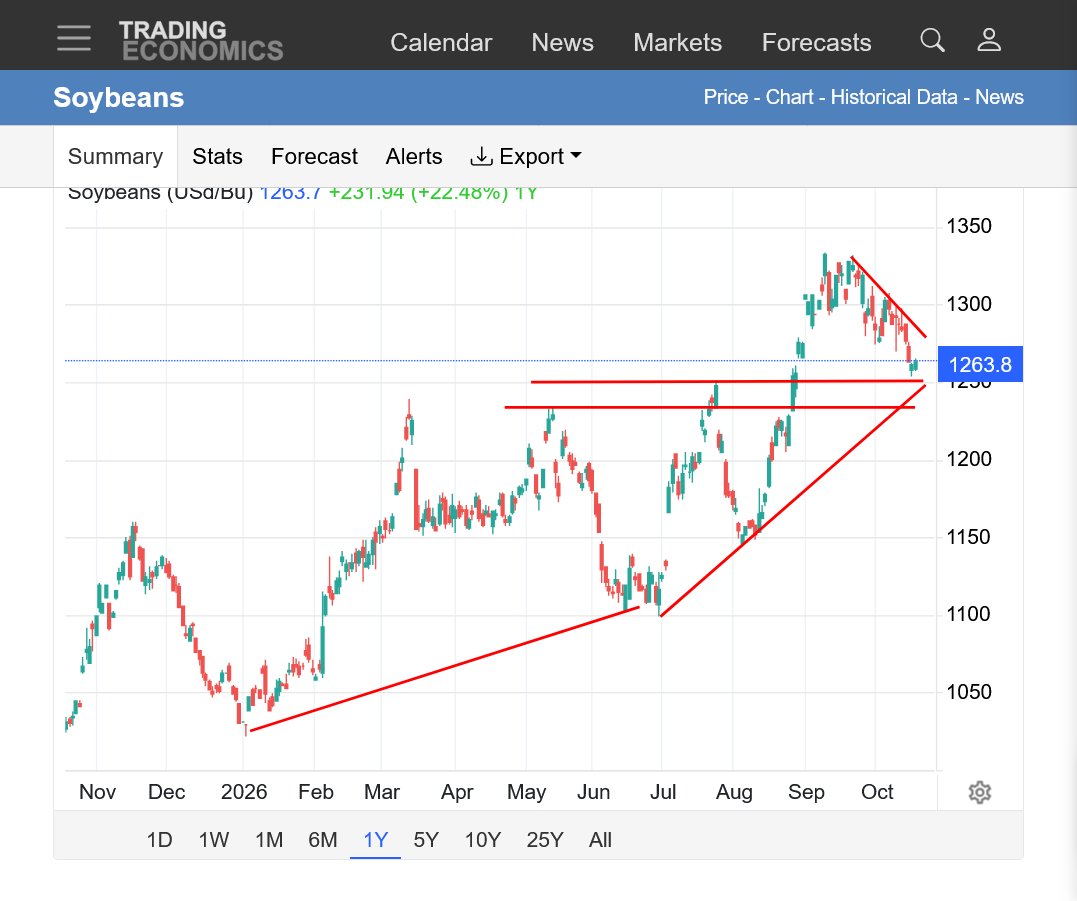
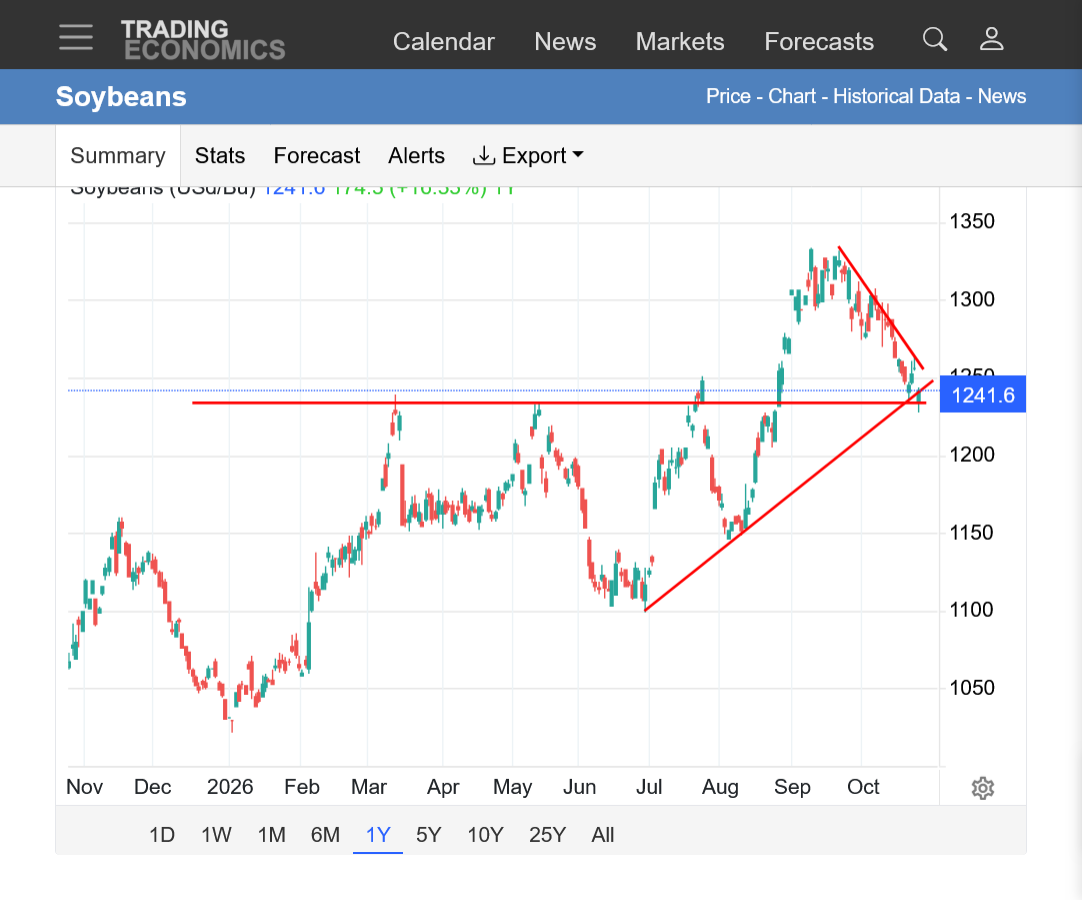
https://tradingeconomics.com/commodity/soybeans
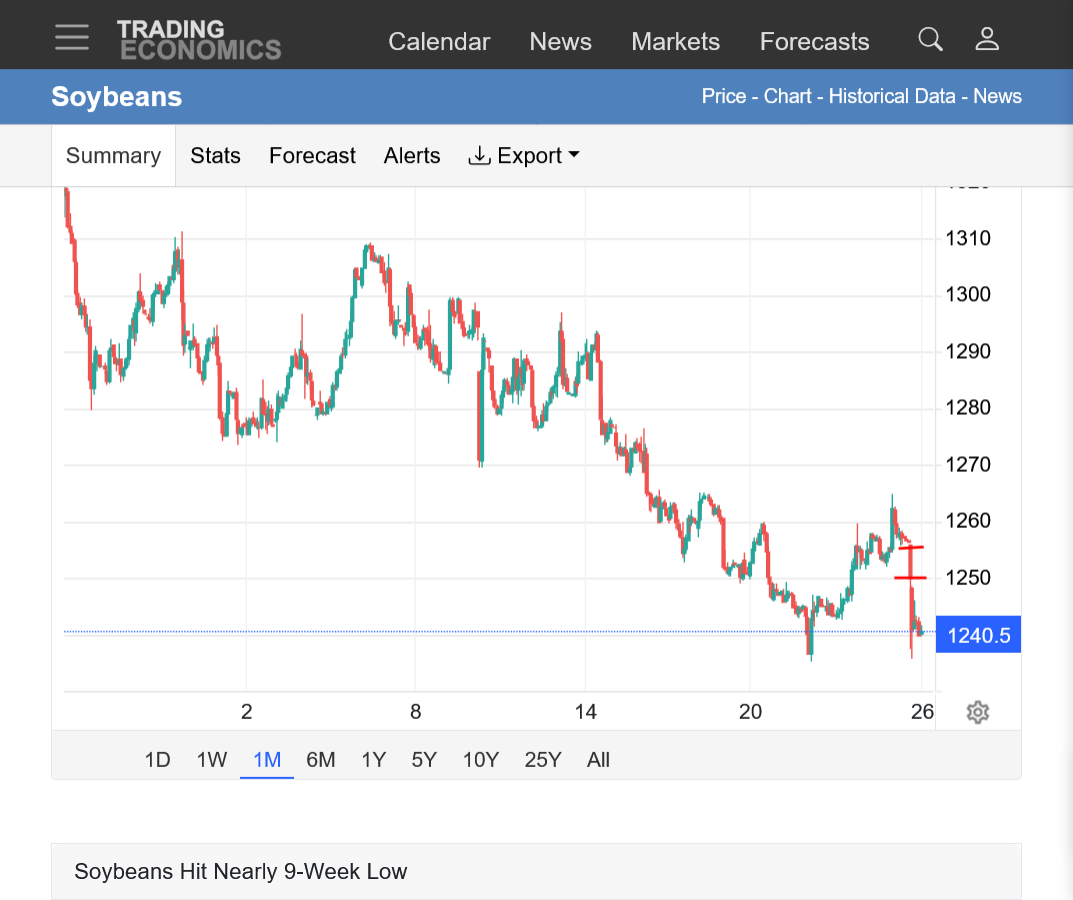
1. 1 month: 85c drop from mid-Sept.
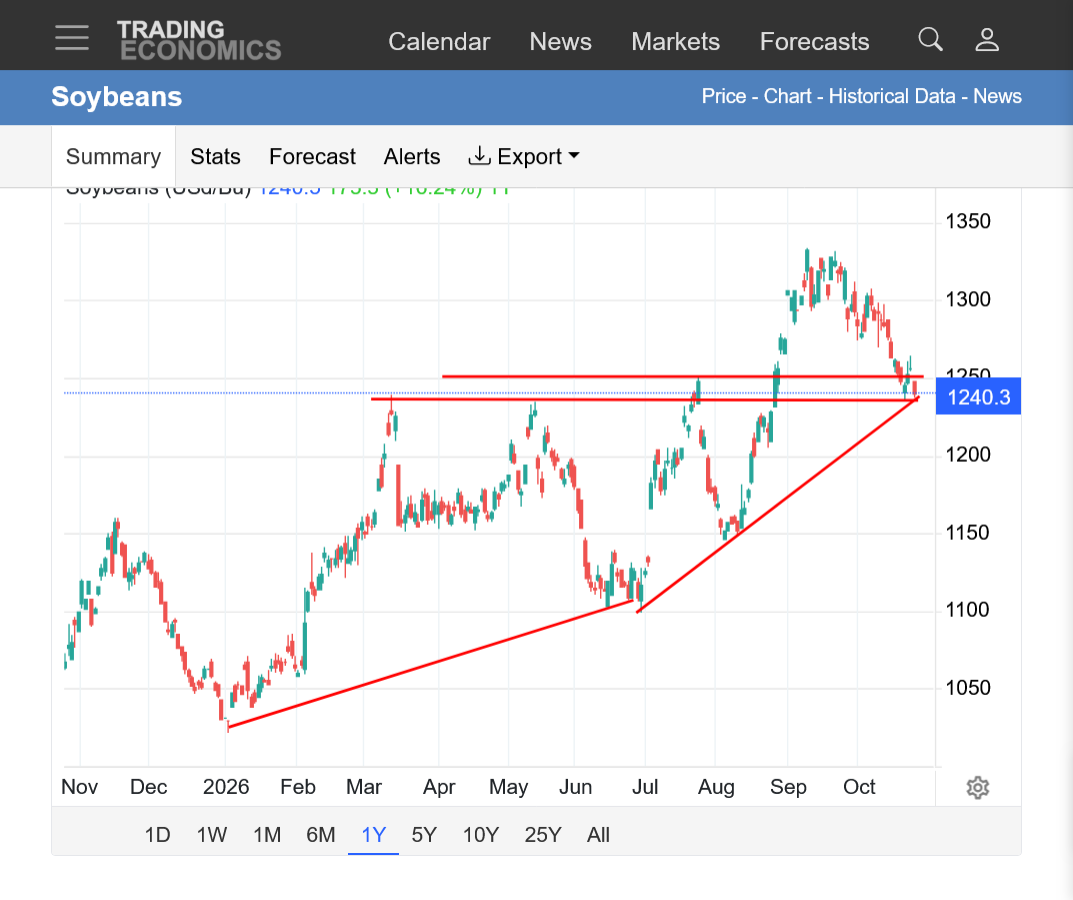
2. 1 year: Bull flag? With trendline support just below this as well as previous broken resistance from the triple top earlier this year.
+++++++++++++
https://equityclock.com/seasonality/
++++++++++++++++++++++++
https://www.tradingview.com/symbols/SOYBEAN/seasonals/
+++++++++++++
https://charts.equityclock.com/teucrium-soybean-fund-nysesoyb-seasonal-chart

+++++++++++++++
This was from 2025:
https://sentimentrader.com/blog/soybeans-have-a-clear-historical-tendency-during-harvest-season
++++++++++++++
+++++++++++
metmike: Again, each year is different. 1 question we can ask is when the market will care about dry weather forecasts for Mato Grosso?
This was this evenings GEFS update: Similar to the previous run, with the reds a bit farther south compared to last week. I think if the European model get's on board with this is could become bullish. Again this is the 30 day outlook going out thru November 22.

++++++++++
Not sure how reliable this is below:
AI Overview
Soybeans in Mato Grosso, Brazil are officially authorized to be planted from September 7 through January 7, with the main sowing period heavily concentrated across September, October, and November. [1, 2, 3]Key Planting Timeline (2026/27 Season)
Despite respectable weekly gains, the U.S. corn and soybean harvests remain behind average pace. Cotton, on the other hand, is being harvested slightly ahead of average pace. At 63% complete, winter wheat planting is the date's slowest on record in data back to 1981.
metmike: Harvest progress will catch up fast this week with no rain anywhere and an omega block dominating the country. Rains start returning to the Plains this weekend.
2nd nor’easter possible next week
By metmike - Oct. 19, 2026, 7:44 p.m.
Donald Trump is now using tax payer dollars to bribe farmers before the election by compensating them for some of the massive damage he's caused from his unprovoked, unjustified war in Iran(because Netanyahu convinced him that it would be a quick, easy victory using the most powerful military in the world and make him an historical legend in the Middle East). 8 months later, the Donald Trump global energy crisis continues to wreck the world.
Trump says USDA will provide $8 billion in support to help farmers offset diesel costs during harvest. The national average diesel price is $6.32 per gallon, up 74% from a year ago, after hitting an all-time high of $6.53 in September. Program details are still to come.
Thanks to Andrew for filling in on Wednesday morning!
Oct 21, 2026: Severe Storms, Tornadoes Target California and Arizona | November Pattern Change
Matt was in with our weather today:
+++++++++++++
·
China's forecast implies a 14% drop in soybean imports in 2026/27, even steeper than the decline during the 2018/19 trade war and African swine fever outbreak.
++++++++++++++
Beans have put in a solid, V bottom low formation(typical of harvest lows) and potential reversal higher the last 2 days!
https://tradingeconomics.com/commodity/soybeans
1. 1 year: Huge drop from the September highs. We held major support(previous broken resistance). We touched/tested the accelerating uptrend line drawn from the early Summer lows to the August lows. Was this just a natural reaction to the oversold conditions? Funds have been liquidating a huge position. What they do will likely move the market. If Mato Grosso in Brazil has a drought, beans will make new highs.
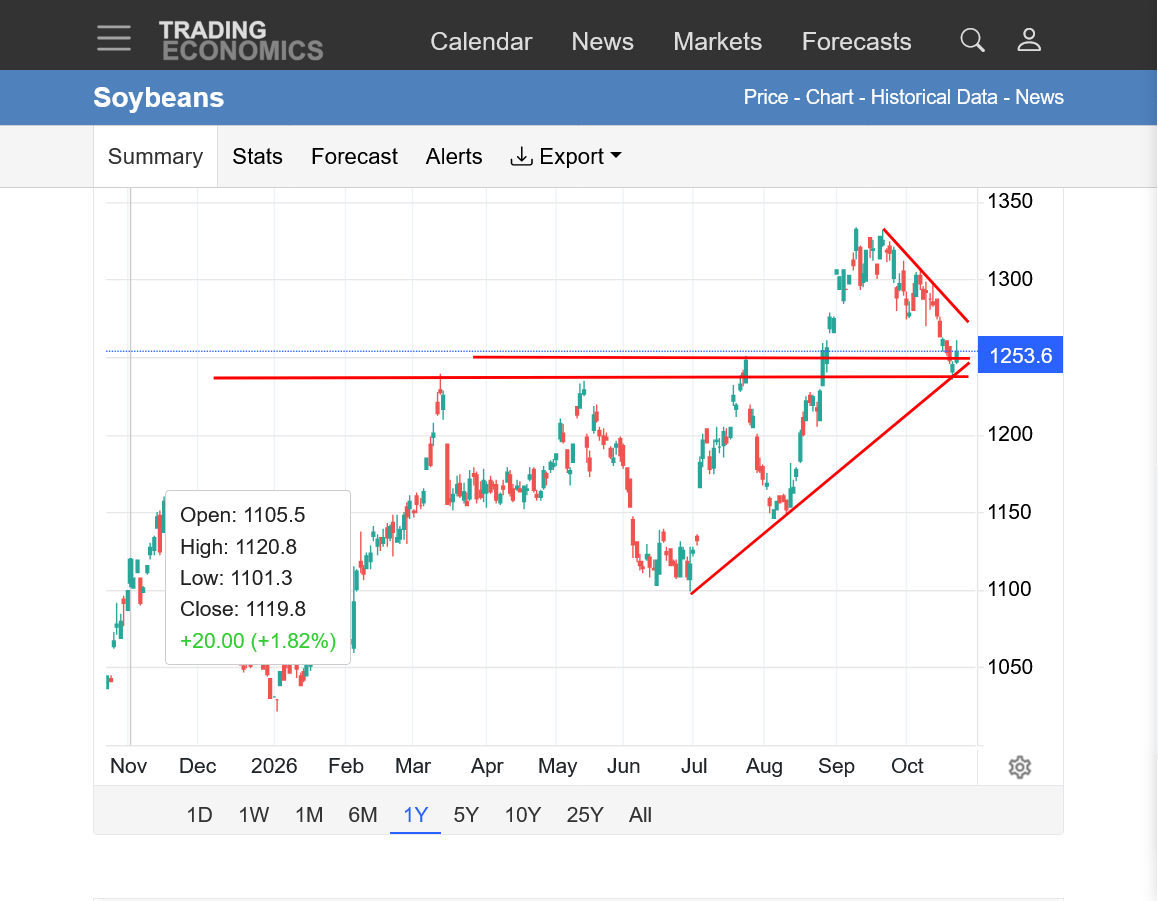
Front month November Soybeans are 20c off their lows. January volume will be overtaking the November volume next week. January is 15c above their lows.
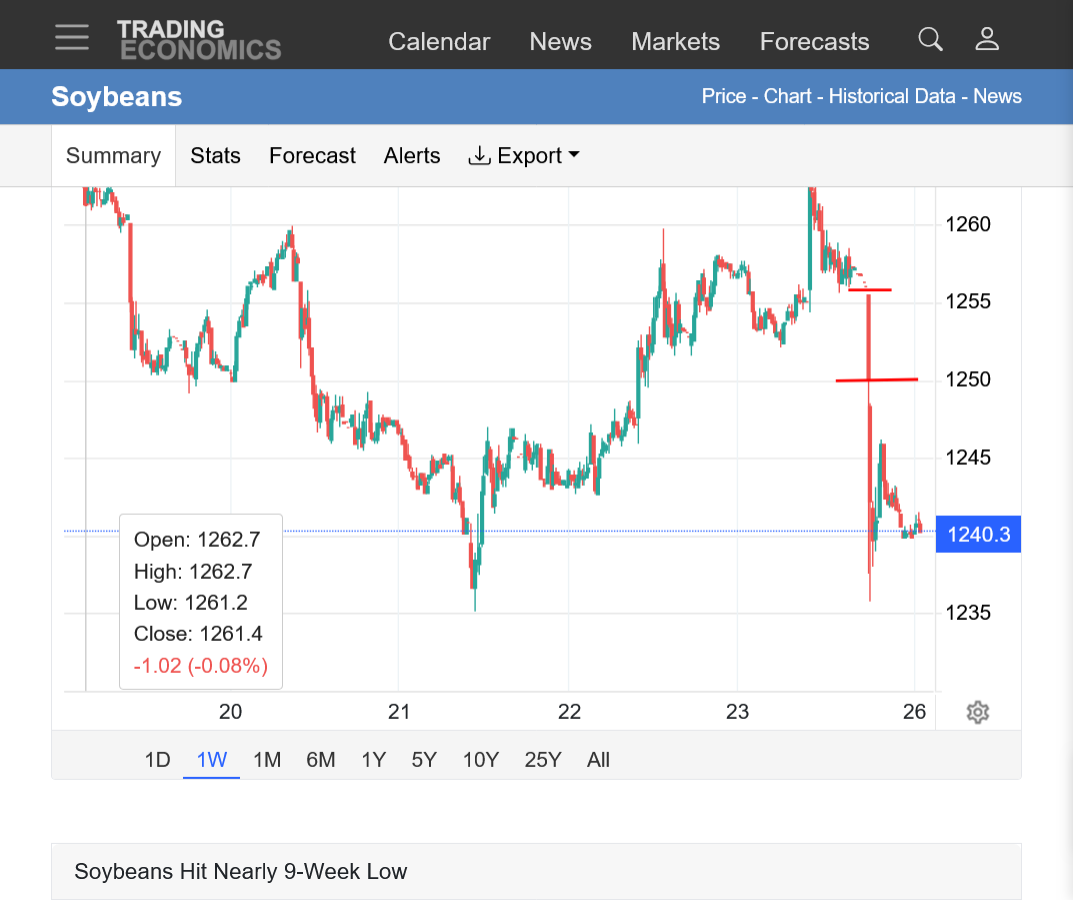
GAP LOWER TONIGHT! There must be some bearish news.
This negates the bottoming formation from last week.
https://tradingeconomics.com/commodity/soybeans
1. 1 week: With tonight's high and Friday's low/downside gap. Low tonight tested last week's low. Last week looks more like a bear flag now. Unless we hold right here.
2. 1 month: Gap lower shown with the price at major support that appears to be on the verge of giving way with the mega weakness of a gap lower. Last week looks like a potential bear flag now.
3. 1 year: Back down to major support, including at the accelerated up trend line since the start of July. Last week now looks like a potential bear flag.
Brazil election affecting markets
SHOCK Brazil Election Sends Soybeans Lower + USDA "Processing Error"
Thanks a ton, cutworm!
I had no idea that was a risk. Goes to show us what can happen in futures markets. I was looking at last week bullish chart formation(and guessing the spike harvest low was in) and thinking about getting long at some point from the potential drought in #1 producing Mato Grosso(if it looked more menacing).
Yes Brazil election/their currency the real has declined but still counting votes. Israeli elections tomorrow and US mid term next Tuesday.
https://tradingeconomics.com/commodity/soybeans
The gap lower was pretty ominous but beans managed to hold at a key support level. Barely.
https://tradingeconomics.com/commodity/soybeans
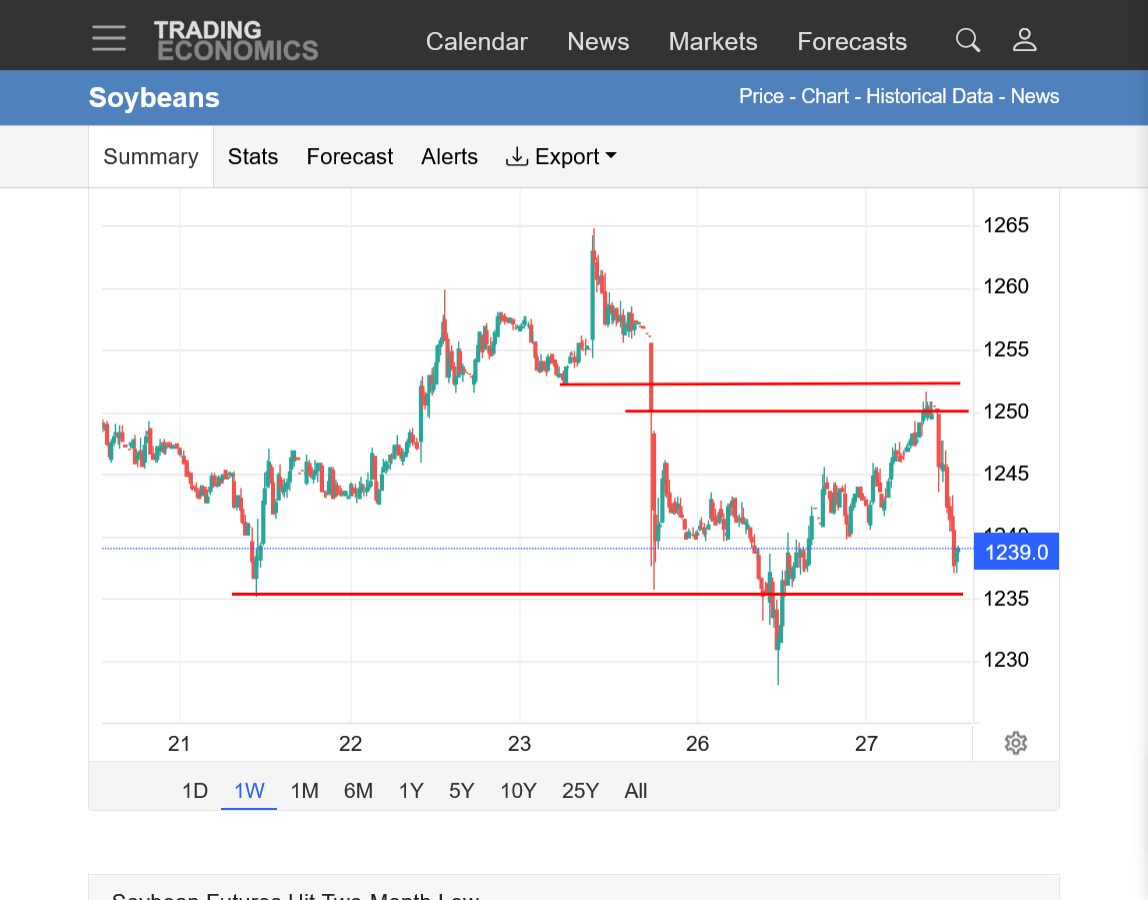
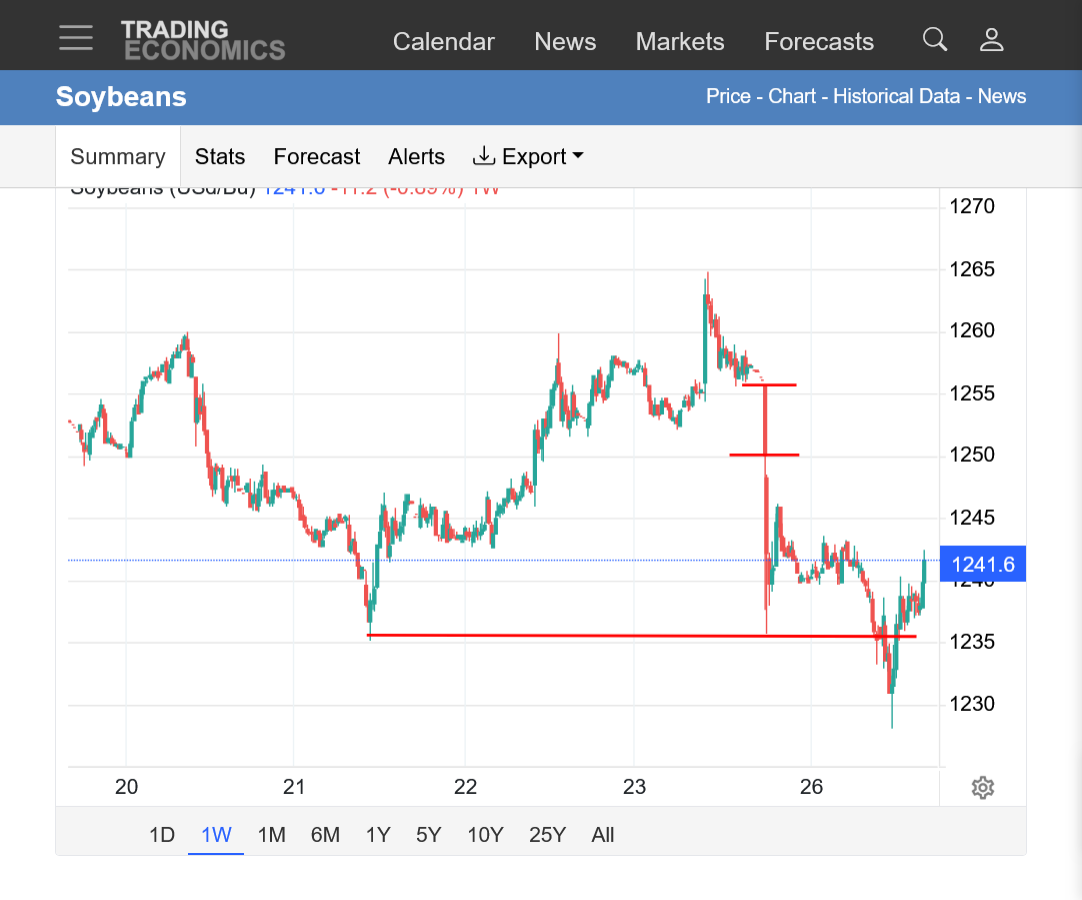
1. 1 week: Dropped below last weeks low but closed above it. Gap shown with Friday's lows and Sunday Night's open/high.
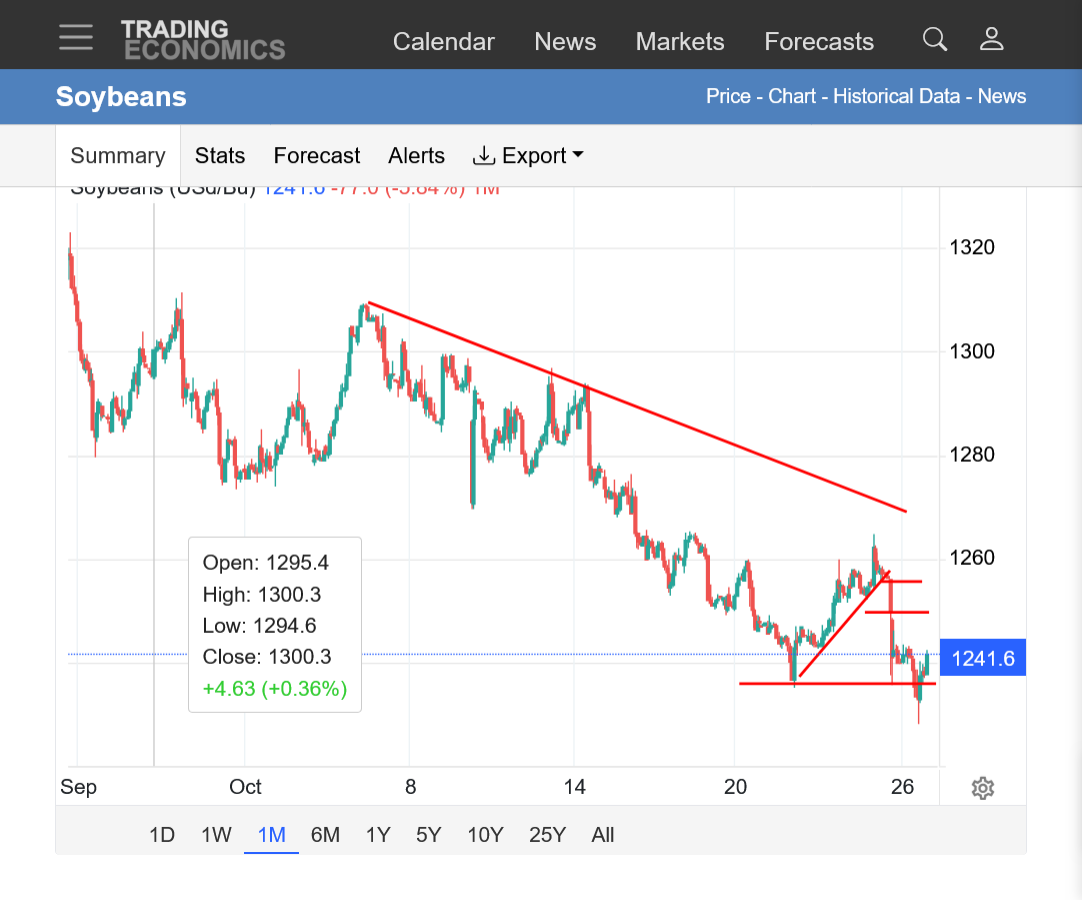
2. 1 month: Major STEEPENING down trend. Was last week another (BIG) bear flag? However, we closed ABOVE last week's low. The ability to hold that low is the last hope for the bulls on the price charts.
3. 1 year: Steep downtrend since the spike September high. Right at major support and major uptrend line.
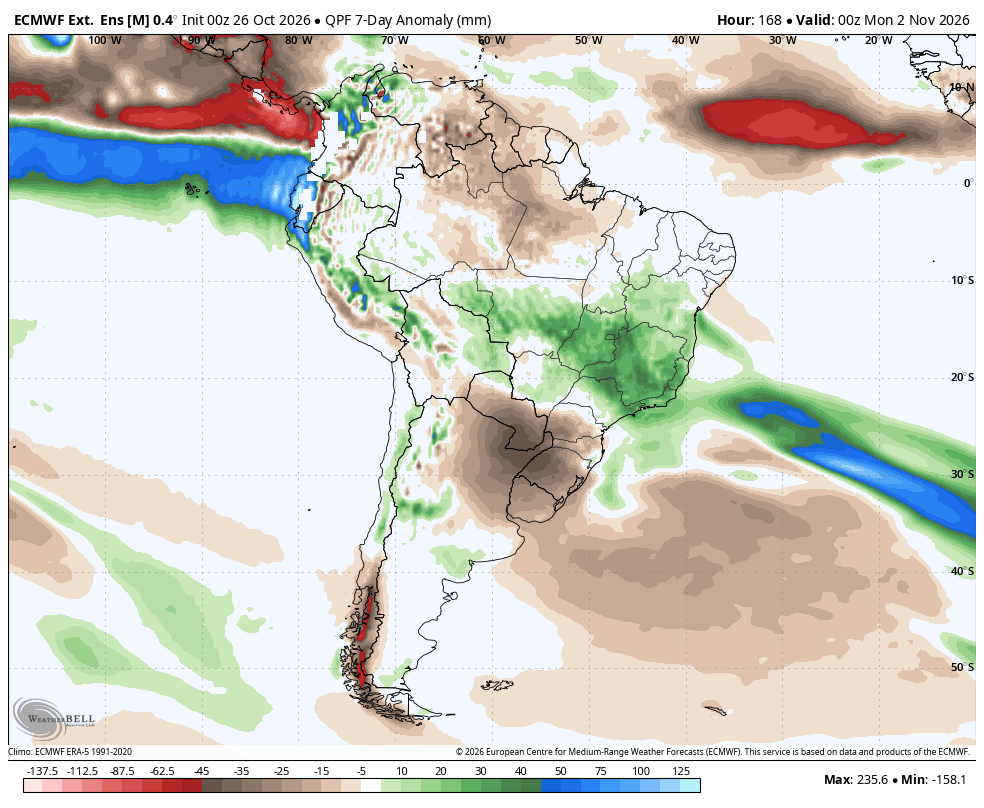
Not sure how much this played a role but Mato Gross will see some big rains the next week but this was there at the end of last week and it's NOT a pattern change taking us into the wet monsoon season because we go back to mostly dry.
These are the 1 week rain anomalies from the last 0z European Ensemble model. Big rains in Mato Grosso, HUGE rains in Mineas Gerais/coffee-land.
++++++++++++
Thanks for the Monday weather, Eric!
Oct 26, 2026: Snow! | Dry East Coast | Watching Nov 1-4 Closely for Large Storm System...
1 week chart below: After closing above last weeks lows on Monday, soybean bulls had some ammo to push prices up, all the way to closing the bottom of the very bearish downside/lower gap on Sunday Night.
However, the move ran out of steam BEFORE closing the gap with sellers take charge again when the price got into the gap. Now the price is approaching last week's low again. Down ~2c at 11am.
https://tradingeconomics.com/commodity/soybeans