KEY EVENTS TO WATCH FOR:
Tuesday, May 23, 2023
8:55 AM ET. Johnson Redbook Retail Sales Index
Ret Sales Mo-to-Date, Y/Y% (previous +1.5%)
Latest Wk, Y/Y% (previous +1.6%)
9:45 AM ET. May US Flash Manufacturing PMI
PMI, Mfg (previous 50.4)
9:45 AM ET. May US Flash Services PMI
PMI, Services (previous 53.7)
10:00 AM ET. May Richmond Fed Business Activity Survey
Mfg Idx (previous -10)
Shipments Idx (previous -7)
10:00 AM ET. April New Residential Sales
New Home Sales (previous 683K)
New Home Sales, M/M% (previous +9.6%)
New Home Sales Months Supply (previous 7.6)
1:00 PM ET. April Money Stock Measures
4:30 PM ET. API Weekly Statistical Bulletin
Crude Stocks, Net Chg (Bbls) (previous +3.7M)
Gasoline Stocks, Net Chg (Bbls) (previous -2.5M)
Distillate Stocks, Net Chg (Bbls) (previous -0.9M)
Wednesday, May 24, 2023
7:00 AM ET. MBA Weekly Mortgage Applications Survey
Composite Idx (previous 214.9)
Composite Idx, W/W% (previous -5.7%)
Purchase Idx-SA (previous 165.4)
Purchase Idx-SA, W/W% (previous -4.8%)
Refinance Idx (previous 468.2)
Refinance Idx, W/W% (previous -7.7%)
10:30 AM ET. EIA Weekly Petroleum Status Report
Crude Oil Stocks (Bbl) (previous 467.624M)
Crude Oil Stocks, Net Chg (Bbl) (previous +5.04M)
Gasoline Stocks (Bbl) (previous 218.33M)
Gasoline Stocks, Net Chg (Bbl) (previous -1.381M)
Distillate Stocks (Bbl) (previous 106.233M)
Distillate Stocks, Net Chg (Bbl) (previous +0.08M)
Refinery Usage (previous 92.0%)
Total Prod Supplied (Bbl/day) (previous 19.558M)
Total Prod Supplied, Net Chg (Bbl/day) (previous -0.606M)
2:00 PM ET. Federal Open Market Committee meeting minutes published
Thursday, May 25, 2023
8:30 AM ET. U.S. Weekly Export Sales
8:30 AM ET. Unemployment Insurance Weekly Claims Report - Initial Claims
Jobless Claims (previous 242K)
Jobless Claims, Net Chg (previous -22K)
Continuing Claims (previous 1799000)
Continuing Claims, Net Chg (previous -8K)
8:30 AM ET. 1st Quarter 2nd estimate GDP
Annual Rate, Q/Q% (previous +1.1%)
Chain-Weighted Price Idx, Q/Q% (previous +4.0%)
Corporate Profits, Q/Q%
PCE Price Idx, Q/Q% (previous +4.2%)
Purchase Price Idx, Q/Q%
Real Final Sales, Q/Q%
Core PCE Price Idx, Q/Q%
Consumer Spending, Q/Q% (previous +3.7%)
8:30 AM ET. 1st Quarter Preliminary Corporate Profits
8:30 AM ET. April Chicago Fed National Activity Index (CFNAI)
NAI (previous -0.19)
NAI, 3-mo Moving Avg (previous 0.01)
10:00 AM ET. April Pending Home Sales Index
Pending Home Sales (previous 78.9)
Pending Home Sales Idx, M/M% (previous -5.2%)
Pending Home Sales Idx , Y/Y% (previous -23.2%)
10:30 AM ET. EIA Weekly Natural Gas Storage Report
Working Gas In Storage (Cbf) (previous 2240B)
Working Gas In Storage, Net Chg (Cbf) (previous +99B)
11:00 AM ET. May Federal Reserve Bank of Kansas City Survey of Tenth District Manufacturing
Mfg Activity Idx (previous -21)
6-Mo Exp Prod Idx (previous 14)
Mfg Composite Idx (previous -10)
6-Mo Exp Composite Idx (previous 3)
4:30 PM ET. Federal Discount Window Borrowings
4:30 PM ET. Foreign Central Bank Holdings
Friday, May 26, 2023
8:30 AM ET. April Personal Income and Outlays
Personal Income, M/M% (previous +0.3%)
Consumer Spending, M/M% (previous +0%)
PCE Price Idx, M/M% (previous +0.1%)
PCE Price Idx, Y/Y% (previous +4.2%)
PCE Core Price Idx, M/M% (previous +0.3%)
PCE Core Price Idx, Y/Y% (previous +4.6%)
8:30 AM ET. April Advance Report on Durable Goods
Durable Goods-SA, M/M% (previous +3.2%)
Dur Goods, Ex-Defense, M/M% (previous +3.5%)
Dur Goods, Ex-Transport, M/M% (previous +0.3%)
Orders: Cap Gds, Non-Def, Ex-Air, M/M% (previous -0.4%)
Shipments: Cap Gds, Non-Def, Ex-Air, M/M% (previous -0.4%)
8:30 AM ET. April Advance Economic Indicators Report
10:00 AM ET. May University of Michigan Survey of Consumers - final
End-Mo Sentiment Idx (previous 63.5)
End-Mo Expectations Idx (previous 60.5)
12-Month Inflation Forecast (previous 4.6%)
5-Year Inflation Forecast (previous 3.0%)
End-Mo Current Idx (previous 68.2)
The STOCK INDEXES? http://quotes.ino.com/ex?changes/?c=indexes
The Dow closed lower on Tuesday as it extends the April-May trading range.Today's low-range close sets the stage for a steady to lower opening when Tuesday's day session begins trading. Stochastics and the RSI are neutral to bullish signaling that sideways to higher prices are possible near-term. Closes above the 20-day moving average crossing at 33,505.88 would signal that a short-term low has been posted. Closes below the May 4th low crossing at 32,937.50 would renew the decline off May's high while opening the door for additional weakness near-term. First resistance is the 20-day moving average crossing at 33,505.88. Second resistance is May's high crossing at 34,257.83. First support is the May 4th low crossing at 32,937.50. Second support is the 38% retracement level of the 2022 rally crossing at 32,399.25.
The June NASDAQ 100 closed higher on Monday as it extends the rally off January's low. The high-range close sets the stage for a steady to higher opening when Tuesday's day session begins trading. Stochastics and the RSI are overbought but remain neutral to bullish signaling sideways to higher prices are possible. If June extends this year's rally, the 75% retracement level of the 2022-decline crossing at 14,245.67 is the next upside target. Closes below the 20-day moving average crossing at 13,366.86 would signal that a short-term top has been posted. First resistance is last-Friday's high crossing at 13,960.25. Second resistance is the 75% retracement level of the 2022-decline crossing at 14,245.01. First support is the 20-day moving average crossing at 13,366.86. Second support is the 50-day moving average crossing at 13,108.95.
The June S&P 500 closed slightly higher on Monday. The mid-range close sets the stage for a steady to higher opening when Tuesday's day session begins trading. Stochastics and the RSI are overbought but remain neutral to bullish signaling that sideways to higher prices are possible near-term. If June extends the rally off March's low, the February 14th high crossing at 4223.00 is the next upside target. Closes below the 20-day moving average crossing at 4148.20 would confirm that a short-term top has been posted. First resistance is last-Friday's high crossing at 4227.25. Second resistance is the February 14th high crossing at 4223.00. First support is the 20-day moving average crossing at 4148.20. Second support is the 50-day moving average crossing at 4103.80.
INTEREST RATES? http://quotes.ino.com/ex?changes/?c=interest ""
June T-bonds closed down 13/32's at 126-24.
June T-bonds closed lower on Monday as it extends the decline off April's high. The low-range close sets the stage for a steady to lower opening when Tuesday's day session begins trading. Stochastics and the RSI are oversold but remain neutral to bearish signaling that sideways to lower prices are possible near-term. If June extends the decline off April's high, the 50% retracement level of the October-January rally crossing at 126-10 is the next upside target. Closes above the 50-day moving average crossing at 130-27 would confirm that a short-term low has been posted. First resistance is the May 11th high crossing at 132-08. Second resistance is the May 4thhigh crossing at 133-00. First support is today's low crossing at 126-20. Second support is the 50% retracement level of the October-January rally crossing at 126-10.
June T-notes closed down 40-pts. At 113.140.
June T-notes closed lower on Monday as it extends this month's decline. The low-range close sets the stage for a steady to lower opening when Tuesday's day session begins trading. Stochastics and the RSI are oversold but remain neutral to bearish signaling that sideways to lower prices are possible near-term. If June extends the decline off May's high, the 62% retracement level of the 2022-2023 rally crossing at 112.157 is the next downside target. Closes above the 20-day moving average crossing at 115.047 would signal that a short-term low has been posted. First resistance is the May 11th high crossing at 116.160. Second resistance is May's high crossing at 117.000. First support is the 50% retracement level of the 2022-2023 rally crossing at 113.116. Second support is the 62% retracement level of the 2022-2023 rally crossing at 112.157.
ENERGY MARKETS? http://quotes.ino.com/ex?changes/?c=energy ""
June crude oil closed higher on Monday as it extends the trading range of the past two-week's. The high-range close sets the stage for a steady to higher opening when Tuesday's day session begins. Stochastics and the RSI are neutral to bullish signaling that sideways to higher prices are possible near-term. Closes above the 50-day moving average crossing at $74.47 would confirm that a short-term low has been posted. If June resumes the decline off last-week's high, the March 24th low crossing at $67.02 is the next downside target. First resistance is the 50-day moving average crossing at $74.47. Second resistance is the April 23th high crossing at $79.18. First support is the March 24th low crossing at $67.02. Second support is the May 4thlow crossing at $63.64.
June heating oil closed slightly higher on Monday leaving last-Friday's key reversal down unconfirmed. The high-range close sets the stage for a steady to higher opening when Tuesday's day trading session begins. Stochastics and the RSI are overbought but are turning neutral to bearish signaling that sideways to lower prices are possible near-term. Closes below last-Monday's low crossing at $2.2812 would signal that a short-term top has been posted. If June extends this month's rally, the 50-day moving average crossing at $2.4773 is the next upside target. First resistance is the 50-day moving average crossing at $2.4773. Second resistance is April's high crossing at $2.7095. First support is last-Monday's low crossing at $2.2812. Second support is the May 4th low crossing at $2.1500.
June unleaded gas closed sharply higher on Monday as it extends this month's rally. The high-range close sets the stage for a steady to slightly higher opening when Tuesday's day session begins trading. Stochastics and the RSI are overbought but remain neutral to bullish signaling that sideways to higher prices are possible near-term. If June extends the rally off May's low, the 75% retracement level of the April-May decline crossing at 2.6834 is the next upside target. Closes below the 20-day moving average crossing at 2.4872 would signal that a short-term top has been posted. First resistance is the 75% retracement level of the April-May decline crossing at 2.6834. Second resistance is the 87% retracement level crossing at 2.7529. First support is the 20-day moving average crossing at 2.487. Second support is last-Monday's low crossing at 2.4017.
June Henry natural gas closed lower on Monday as it consolidated some of last-week's rally. The low-range close sets the stage for a steady to lower opening when Tuesday's day session begins trading. Stochastics and the RSI are overbought and are turning neutral to bearish hinting that a short-term top might be in or is near. If June renews the decline off March's high, monthly support crossing at 1.795 is the next downside target. If June extends this month's rally, the 25% retracement level of the 2022-2023 decline crossing at 2.877 is the next upside target. First resistance is last-Friday's high crossing at 2.685. Second resistance is the 25% retracement level of the 2022-2023 decline crossing at 2.877. First support is the May 12th low crossing at 2.147. Second support is the May 5th low crossing at 2.031.
CURRENCIES? http://quotes.ino.com/ex?changes/?c=currencies ""
The June Dollar closed slightly higher on Monday. The mid-range close sets the stage for a steady to higher opening when Tuesday's session begins trading. Stochastics and the RSI are overbought but remain neutral to bullish signaling that sideways to higher prices are possible near-term. If June extends the rally off May's low, the March 15th high crossing at 104.720 is the next upside target. Closes below the 20-day moving average crossing at 101.881 would signal that a short-term top has been posted. First resistance is the 25% retracement level of the September-February decline crossing at $103.586. Second resistance is the March 15th high crossing at 104.720. First support is the 20-day moving average crossing at 101.881. Second support is May's low crossing at 100.520.
The June Euro closed slightly higher on Monday as it consolidated some of this month's decline. The mid-range close sets the stage for a steady to higher opening when Tuesday's day session begins trading. Stochastics and the RSI are oversold but remain neutral to bearish signaling that sideways to lower prices is possible near-term. If June extends this month's decline, the 38% retracement level of the 2022-2023 rally crossing at $1.05914 is the next downside target. Closes above the 20-day moving average crossing at $1.09667 would signal that a short-term low has been posted. First resistance is the 10-day moving average crossing at $1.08898. Second resistance is the 50-day moving average crossing at 1.09370. First support is the 25% retracement level of the 2022-2023 rally crossing at $1.07774. Second support is the 38% retracement level of the 2022-2023 rally crossing at $1.05914.
The June British Pound posted an inside day with a lower close on Monday. The low-range close sets the stage for a steady to lower opening when Tuesday's day session begins trading. Stochastics and the RSI are oversold but remain neutral to bearish signaling sideways to lower prices are possible near-term. If June extends the decline off May's high, April's low crossing at 1.2293 is the next downside target. Closes above the 20-day moving average crossing at 1.2525 would signal that a short-term low has been posted. First resistance is the 20-day moving average crossing at 1.2525. Second resistance is May's high crossing at 1.2692. First support is the April 10th low crossing at 1.2364. Second support is April's low crossing at 1.2293.
The June Swiss Franc closed slightly higher on Monday as it consolidated some of the decline off May's high. The low-range close sets the stage for a steady to slightly higher opening when Tuesday's day session begins trading. Stochastics and the RSI are oversold but are turning neutral to bullish signaling that a low might be in or is near. Closes above the 20-day moving average crossing at 1.12405 would signal that a short-term low has been posted. If June extends this month's decline, the April 3rd low crossing at 1.09640 is the next downside target. First resistance is the 20-day moving average crossing at 1.12405. Second resistance is the May 4th high crossing at 1.13940. First support is the April 10th low crossing at 1.10495. Second support is the April 3rd low crossing at 1.09640.
The June Canadian Dollar closed unchanged on Monday. The low-range close sets the stage for a steady to slightly lower opening when Tuesday's day session begins trading. Stochastics and the RSI are neutral to bearish signaling that sideways to lower prices are possible near-term. Close below the 50-day moving average crossing at 73.97 would open the door for a possible test of April's low. If June renews the rally off April's low, May's high crossing at 75.18 is the next upside target. First resistance is the 10-day moving average crossing at 74.28. Second resistance is May's high crossing at 75.18. First support is the 50-day moving average crossing at 73.97. Second support is April's low crossing at 73.23.
The June Japanese Yen closed lower on Monday as it extends the decline off January's high. The low-range close sets the stage for a steady to lower opening when Tuesday’s day session begins trading. Stochastics and the RSI are oversold but remain neutral to bearish signaling that sideways to lower prices are possible near-term. If June extends the decline off March's high, the 75% retracement level of the October-January rally crossing at 0.071337 is the next downside target. Closes above the 20-day moving average crossing at 0.074099 would signal that a short-term low has been posted. First resistance is the 20-day moving average crossing at 0.074099. Second resistance is the 50-day moving average crossing at 0.075361. First support is the 75% retracement level of the October-January rally crossing at 0.071337. Second support is the 87% retracement level of the October-January rally crossing at 0.069908.
PRECIOUS METALS? http://quotes.ino.com/ex?changes/?c=metals ""
June gold posted an inside day with a lower close on Monday. The low-range close sets the stage for a steady to lower opening when Tuesday's day session begins trading. Stochastics and the RSI are oversold but remain neutral to bearish signaling that sideways to lower prices are possible near-term. If June extends this month's decline, the 38% retracement level of the 2022-2023 rally crossing at $1925.20. Closes above the 20-day moving average crossing at $2010.10 would signal that a short-term low has been posted. First resistance is the 20-day moving average crossing at $2011.10. Second resistance is May's high crossing at $2085.40. First support is the March 22nd low crossing at $1953.70. Second support is the 38% retracement level of the 2022-2023 rally crossing at $1925.20.
July silver posted an inside day with a lower close on Monday. The low-range close sets the stage for a steady to lower opening when Tuesday's day session begins trading. Stochastics and the RSI are oversold but remain neutral to bearish signaling that sideways to lower prices are possible near-term. If July extends this month's decline, the 50% retracement level of the March-May rally crossing at 23.289 is the next downside target. Closes above the 20-day moving average crossing at 24.941 would signal that a short-term low has been posted. First resistance is the 20-day moving average crossing at 24.941. Second resistance is May's high crossing at 26.435. First support is Thursday's low crossing at 23.485. Second support is the 50% retracement level of the March-May rally crossing at 23.289.
July copper closed lower on Monday as it extends last-week's trading range. The low-range close sets the stage for a steady to lower opening when Tuesday's day session begins trading. Stochastics and the RSI are oversold but remain neutral to bearish signaling that sideways to lower prices are possible near-term. If July extends the decline off April's high, the 62% retracement level of the 2022-2023 rally crossing at 3.6247 is the next downside target. Closes above the 20-day moving average crossing at 3.8134 would signal that a low has been posted. First resistance is the 20-day moving average crossing at 3.8134. Second resistance is the 50-day moving average crossing at 3.9443. First support is the 62% retracement level of the 2022-2023 rally crossing at 3.6247. Second support is the 75% retracement level of the 2022-2023 rally crossing at 3.4683.
GRAINS? http://quotes.ino.com/ex?changes/?c=grains "
July Corn closed up $0.16 1/2-cents at $5.71.
July corn closed sharply higher on Monday and consolidates some of this month's decline. The high-range close sets the stage for a steady to higher opening when Tuesday's night session begins trading. Stochastics and the RSI are oversold, diverging but appear to be turning neutral to bullish signaling that a low might be in or is near. Closes above the 20-day moving average crossing at $5.83 1/2 would signal that a short-term low has been posted. If July extends the decline off April's high, the November-2021 low crossing at $5.41 1/2 is the next downside target. First resistance is the 20-day moving average crossing at $5.83 1/2. Second resistance is the May 8th high crossing at $6.00. First support is last-Thursday's low crossing at $5.47. Second support is the November-2021 low crossing at $5.41 1/2.
July wheat closed up $0.01 3/4-cents at $6.06 1/4.
July wheat closed slightly higher on Monday as it extends last-week's decline. The mid-range close sets the stage for a steady to higher opening when Tuesday's day session begins trading. Stochastics and the RSI are oversold but remain neutral to bearish signaling signaling that sideways to lower prices are possible near-term. If July extends the decline off February's high, the March-2021 low crossing at $5.71 is the next downside target. Closes above the 50-day moving average crossing at $6.71 1/4 would signal that a short-term low has been posted while opening the door for additional short-covering gains. First resistance is the 20-day moving average crossing at $6.34 1/4. Second resistance is the 50-day moving average crossing at $6.71 1/4. First support is today's low crossing at $5.96 1/4. Second support is the March-2021 low crossing at $5.71.
July Kansas City Wheat closed up $0.01 1/2-cents at $8.25 3/4.
July Kansas City wheat closed slightly higher on Monday as it consolidates some of last-week's decline. The high-range close sets the stage for a steady to higher opening when Tuesday's day session begins trading. Stochastics and the RSI are neutral to bearish signaling that sideways to lower prices are possible near-term. Multiple closes below the 20-day moving average crossing at $8.25 would signal that a short-term top has been posted while opening the door for additional weakness near-term. Closes above the 10-day moving average crossing at $8.61 1/2 would signal that a short-term low has been posted.First resistance is the 10-day moving average crossing at $8.61 1/2. Second resistance is the 38% retracement level of the 2022-2023 decline crossing at $9.17 1/4. First support is the March 22nd low crossing at $7.80 3/4. Second support is March's low crossing at $7.63 3/4.
July Minneapolis wheat closed up $0.05 1/2-cents crossing at $8.09 1/2.
July Minneapolis wheat closed higher on Monday as it consolidates some of last-week's decline. The high-range close sets the stage for a steady to higher opening when Tuesday's day session begins trading. Stochastics and the RSI are neutral to bearish signaling that sideways to lower prices are possible near-term. If July extends last-week's decline, May's low crossing at $8.69 is the next downside target. Closes above the 50-day moving average crossing at $8.48 3/4 would signal that a short-term low has been posted. First resistance is the 20-day moving average crossing at $8.26 1/2. Second resistance is the 50-day moving average crossing at $8.48 3/4. First support is today's low crossing at $7.93. Second support is May's low crossing at $8.69.
SOYBEAN COMPLEX? http://quotes.ino.com/ex?changes/?c=grains "
July soybeans closed up $0.34-cents at $13.41 1/4.
July soybeans closed sharply higher on Monday as it consolidates some of this month's decline. The high-range close sets the stage for a steady to higher opening when Tuesday's day session begins trading. Stochastics and the RSI are oversold but remain neutral to bearish signaling that sideways to lower prices are possible near-term. If July extends this month's decline, the July-22nd -2022 low crossing at $12.99 is the next downside target. Closes above the 20-day moving average crossing at $13.94 3/4 would signal that a low has been posted. First resistance is the 10-day moving average crossing at $13.69 1/2. Second resistance is the 20-day moving average crossing at $13.94 3/4. First support is today's low crossing at $13.04 3/4. Second support is the July-22nd -2022 low crossing at $12.99.
July soybean meal closed up $3.10 at $412.20.
July soybean meal closed higher on Monday but not before posting a new low for the year. The mid-range close sets the stage for a steady to higher opening when Tuesday's day session begins trading. Stochastics and the RSI are oversold but remain neutral to bearish signaling that sideways to higher prices are possible near-term. If July extends the decline off March's high, the 50% retracement level of the 2020-2023 rally crossing at $388.80 is the next downside target. Closes above the 20-day moving average crossing at $425.40 would signal that a short-term low has been posted. First resistance is the 20-day moving average crossing at $425.40. Second resistance is the 50-day moving average crossing at $442.70. First support is today's low crossing at $407.50. Second support is the 50% retracement level of the 2020-2023 rally crossing at $388.80.
July soybean oil closed up 150-pts. at 48.77.
July soybean oil closed higher on Monday. The high-range close sets the stage for a steady to higher opening when Tuesday's day session begins trading. Stochastics and the RSI are oversold but are turning neutral to bullish signaling that sideways to higher prices are possible near-term. Closes abovethe 20-day moving average crossing at 50.82 would signal that a low has been posted. If July extends this month's decline, the 75% retracement level of the 2020-2022 rally crossing at 40.19 is the next downside target. First resistance is the 20-day moving average crossing at 50.82. second support is the 50-day moving average crossing at 53.43. First support is last-Wednesday's low crossing at 45.75. Second support is the 75% retracement level of the 2020-2022 rally crossing at 40.19.
LIVESTOCKhttp://quotes.ino.com/exchanges/?c=livestock
June hogs closed down $1.15 at $81.88.
June hogs closed lower on Monday as it posted a new low for the year. The low-range close sets the stage for a steady to lower opening when Tuesday's day session begins trading. Stochastics and the RSI are oversold but remain neutral to bearish signaling that sideways to lower prices are possible near-term. If June extends this year's decline, weekly support on the continuation chart crossing at $80.99 is the next downside target. Closes above the 50-day moving average crossing at $88.84 would signal that a short-term low has been posted. First resistance is the 20-day moving average crossing at $86.30 Second resistance is the 50-day moving average crossing at $88.84. First support is today's low crossing at $81.67. Second support is weekly support on the continuation chart crossing at $80.99.
June cattle closed down $0.68 at $165.05.
June cattle closed lower on Monday as it consolidates some of the rally off May's low. The mid-range close sets the stage for a steady to lower opening on Tuesday. Stochastics and the RSI are overbought but remain neutral to bullish signaling that sideways to higher prices are possible near-term. If June extends the rally off May's low, the January-2014 high on the monthly continuation chart crossing at $171.65 is the next upside target. Closes below last-Wednesday's low crossing at $162.93 would signal that a double top with April's high has been posted. First resistance is April's high crossing at $166.28. Second resistance is the January-2014 high on the monthly continuation chart crossing at $171.65. First support is the 20-day moving average crossing at $163.91. Second support is the 50-day moving average crossing at $161.95.
August Feeder cattle closed down $0.30 at $234.80.
August Feeder cattle closed slightly lower on Monday. The high-range close sets the stage for a steady to higher opening when Tuesday's day session begins trading. Stochastics and the RSI are overbought but remain neutral to bullish signaling that sideways to higher prices are possible near-term. If August extends the rally off May's low, the October-2014 high on the monthly continuation chart crossing at $245.20 is the next upside target. Closes below the 20-day moving average crossing at $228.73 would temper the near-term friendly outlook. First resistance is last-Friday's high crossing at $235.73. Second resistance is the October-2014 high on the monthly continuation chart crossing at $245.20. First support is the 20-day moving average crossing at $228.73. Second support is the 50-day moving average crossing at $223.80.
FOOD & FIBERhttp://quotes.ino.com/ex changes/?c=food
July coffee posted an inside day with a lower close on Monday as it extends the trading range of the past three-weeks. The low-range close sets the stage for a steady to lower opening on Tuesday. Stochastics and the RSI are neutral to bullish signaling sideways to higher prices are possible near-term. Closes above last-Friday's high crossing at $19.44 would confirm an upside breakout of the aforementioned trading range while opening the door for additional short covering gains. Closes below May's low crossing at $18.06 would renew the decline off April's high thereby opening the door for additional weakness near-term. First resistance is last-Friday's high crossing at $19.44. Second resistance is April's high crossing at $20.49. First support is May's low crossing at $18.06. Second support is the January-April uptrend line crossing near $17.96.
July cocoa closed lower on Monday as it consolidates some of this year's rally. The low-range close sets the stage for a steady to lower opening on Tuesday. Stochastics and the RSI are neutral to bullish signaling that sideways to higher prices are possible near-term. If July extends the rally off March's low, monthly resistance crossing at 32.15 is the next upside target. Closes below the 20-day moving average crossing at 29.64 would signal that a short-term top has been posted.
July sugar closed slightly higher on Monday as it extends the trading range of the past four-weeks. The high-range close sets the stage for a steady to slightly higher opening on Tuesday. Stochastics and the RSI are turning neutral to bullish signaling that sideways to higher prices are possible near-term. If July renews the rally off October's low, weekly resistance on the continuation chart crossing at 29.36 is the next upside target. Closes below the May 3rd low crossing at 24.88 would mark a downside breakout of the aforementioned trading range while opening the door for additional weakness near-term.
July cotton closed lower on Monday as it consolidates some of the rally off March's low. The low-range close sets the stage for a steady to lower opening on Tuesday. Stochastics and the RSI are overbought but are poised to turn neutral to bearish with additional weakness that would signal sideways to lower prices are possible near-term. Closes below the 50-day moving average crossing at 81.63 would signal that a short-term top has been posted. If July extends the rally off April's low, the January 26th high crossing at 89.59 is the next upside target.
Thanks tallpine!
No changes in the bullish weather for C and S and bearish weather for NG!
Last 12z European model run still much too dry for most of the Midwest. All the weather is here:
https://www.marketforum.com/forum/topic/83844/
BELOW:
1. Last 12z EE model for 5-22-23
2. Previous 0z run 5-22-23 + the one before that below 12z run 5-21-23 from previous posts:
https://www.marketforum.com/forum/topic/95370/#95371
By metmike - May 22, 2023, 10:49 a.m.
I'm still convinced the weather is bullish/too dry. The market took awhile to react strongly last night/early this morning. The last EE run was even drier overnight for most of the Cornbelt.
1. Latest European model 0z run 5-22-23
2. Previous one from yesterday afternoon 12z run 5-21-23
https://www.marketforum.com/forum/topic/95354/
By metmike - May 21, 2023, 8:12 p.m.
Thanks, tallpine!
To me, the weather looks too dry for C and S the next 2 weeks and is bullish. Especially the central and eastern Cornbelt.
W is still bearish because of big rain in the S.Plains.
EE last 12z run for total rains:
Re: Re: INO Morning Market Commentary
By metmike - May 22, 2023, 11:13 a.m.
https://www.marketforum.com/forum/topic/94944/#95303
Re: Re: Re: Re: Re: Re: Natural Gas 5-4-23
By metmike - May 21, 2023, 6:02 p.m.
I can't get too bulish ng here with the heat in the NorthCentral US(where not too many people live) and not the South or Southeast.
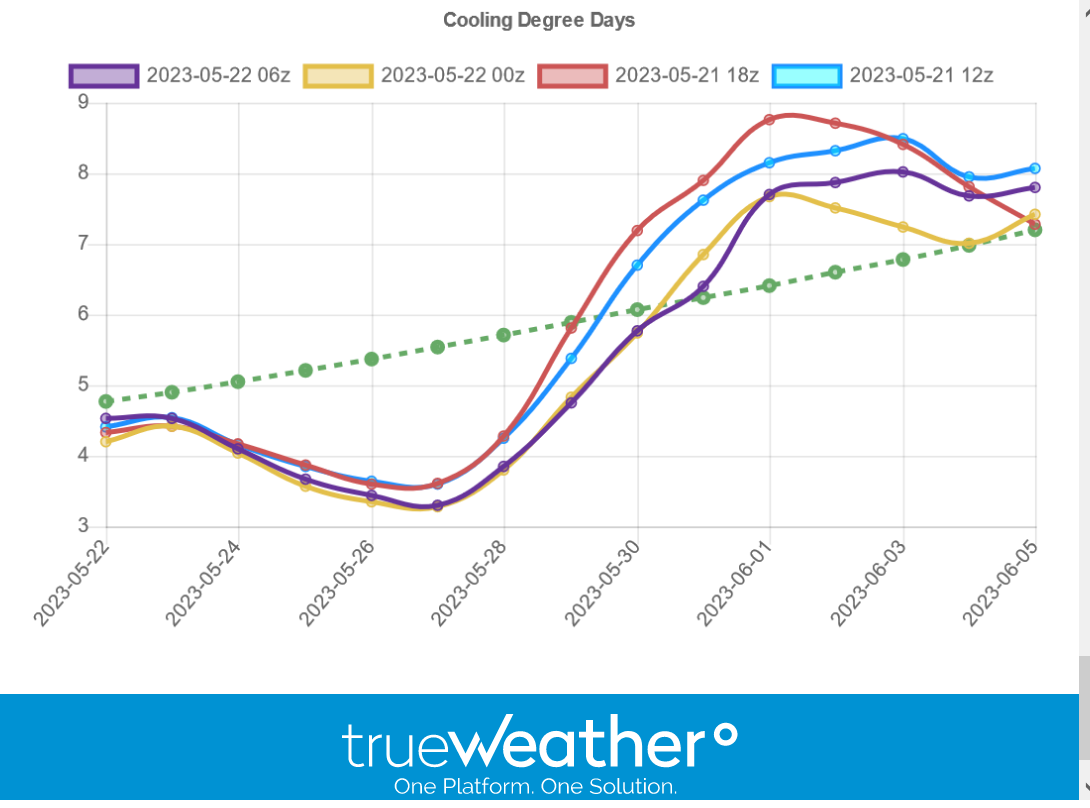
CDDs are actually less than they were on Friday.
Here's the CDDs from the EE. Last run in purple was +2 CDDs vs the previous run. However, the pattern is cooler than any day last week, including Friday. The total CDDs for the 2 week period are right at average(cool this week, offsetting warm week 2, then near the average at the end). Last week, the week 2 warmth was greater!
https://www.marketforum.com/forum/topic/94944/#95353
With forecasts stubbornly withholding impressive summer heat, natural gas futures failed to build on last week’s momentum in early trading Monday. The June Nymex contract was down 7.9 cents to $2.506/MMBtu at around 8:45 a.m. ET. Futures rallied last week on signs of weakening supply, with bullish sentiment helped along by a tighter-than-expected Energy Information…
+++++++++++++++++++++++++++++++++++++++
YEP!
Last 4 GEFS solutions below. Even less CDDs.
Extended weather.
https://www.cpc.ncep.noaa.gov/products/predictions/610day/ | |||||||||
| 6 to 10 day outlooks | |||||||||
| Click below for information about how to read 6-10 day outlook maps Temperature Precipitation | |||||||||
| Click below for archives of past outlooks (data & graphics), historical analogs to todays forecast, and other formats of the 6-10 day outlooks ArchivesAnalogsLines-Only FormatGIS Data | |||||||||
Temperature Probability | |||||||||
Precipitation Probability | |||||||||

