
es 500 
Thanks for the pretty colors, fayq!
Previous thread:
NASDAQ
28 responses |
Started by cutworm - July 17, 2026, 6:50 a.m.
https://tradingeconomics.com/us100:ind
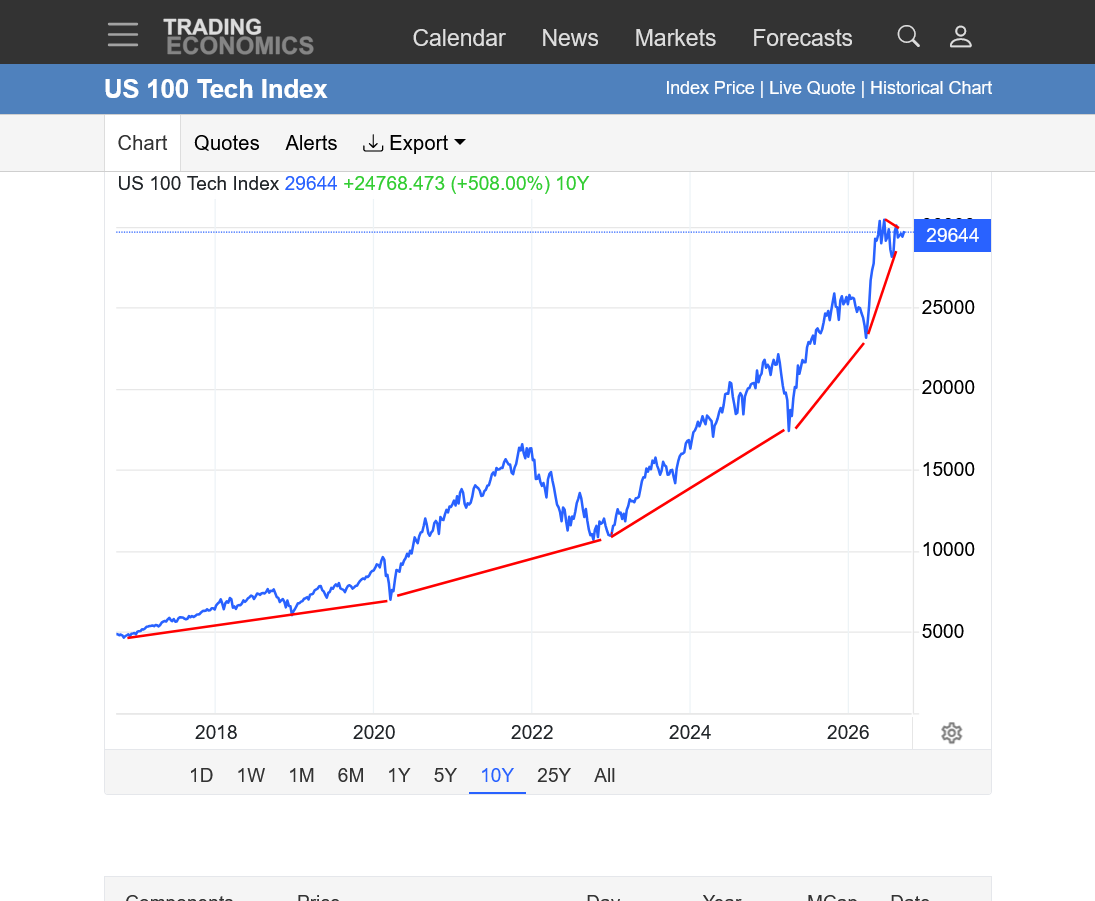
1. 10 years: Parabolic/exponential move with increasing/steepening slope higher(unsustainable but impossible to pick the buying exhaustion top). Drop since the historical top could just be another bull flag/correction or we just had THE top. Some of the bull market's steep uptrends have not been violated..........YET! But they will be because this is planet earth A person can draw a new line toany recent low and call that the new long term uptrend. Then claim that the recent drop in 2026 from the highs, was just a correction and the pattern is just a bull flag or a symmetrical triangle instead of a top because analyzing charts is often in the eye of the beholder and where they decide to put their lines! To verify that interpretation, we need NEW HIGHS. This is very possible but seems unlikely in the environment ahead of us.
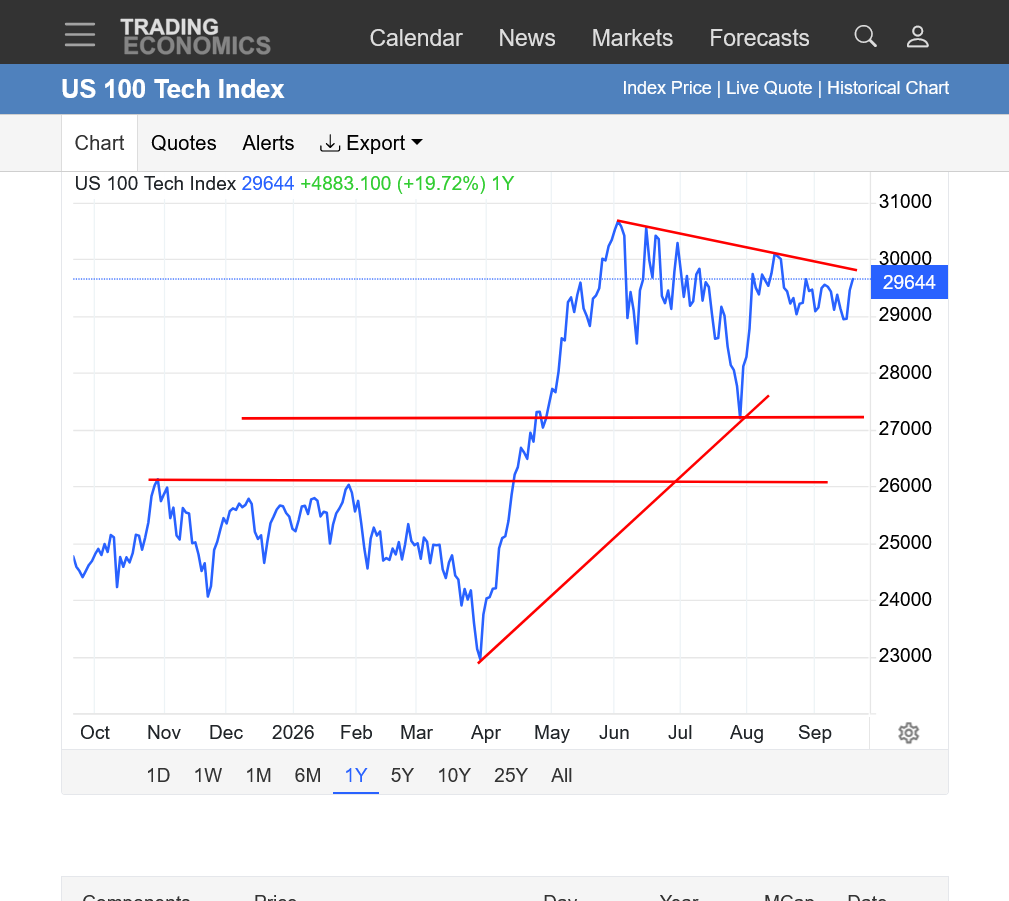
2. 1 year: Top in June, downtrend with lower highs since then. Spike lows in April, then the end of July. We are violating a short term uptrend drawn using those 2 points/lows. Still WAAAAY above previous/2025 highs. Is this a bull flag/symmetrical triangle or a top? Decisive new highs or trading below the April lows are needed to confirm.
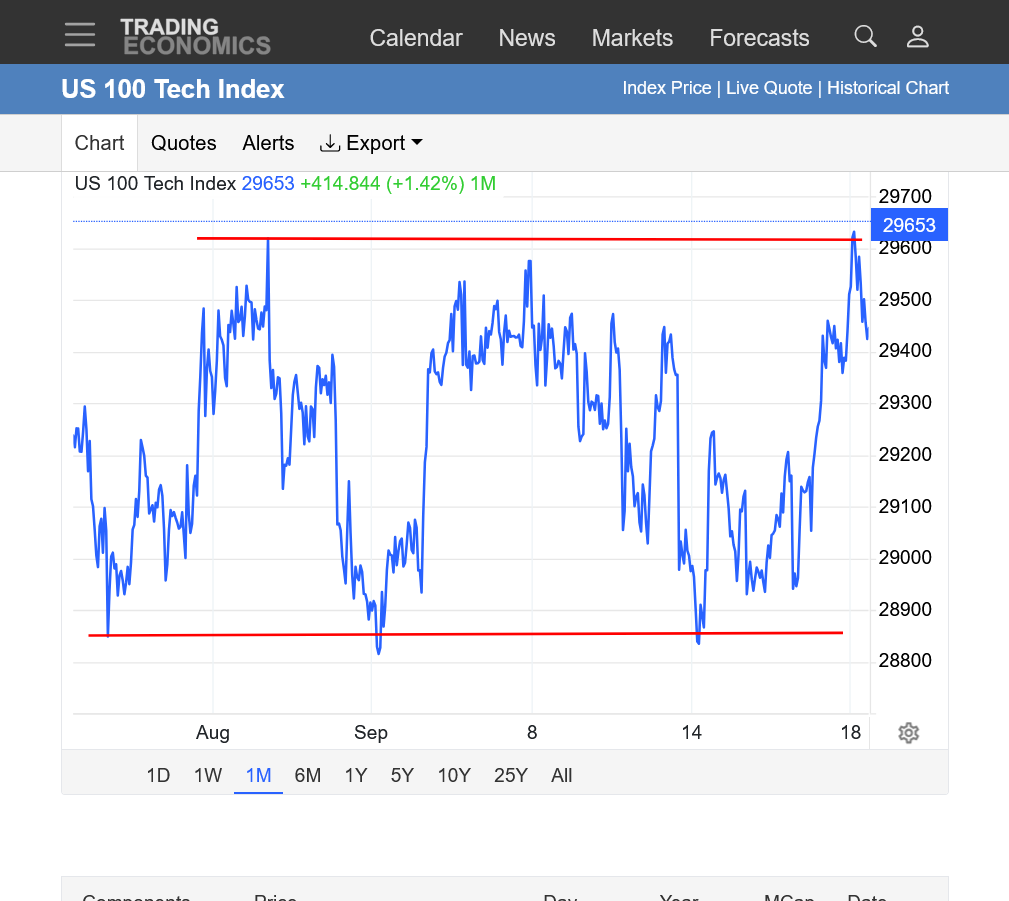
3. 1 month: Mostly sideways trading channel. Threatening to break out to the upside???
Again, traders can draw whatever lines they want to justify the pattern they want to see and the bottom line is that these lines TELL US THE PAST!. That can be very helpful to understanding what the market WAS trading and how it reacted but can't tell us THE FUTURE, which is what we trade.........the FUTURES, not the PASTures.
The NEWS, along with underlying fundamentals that are sustained determine the FUTURE.
Analyzing and using price charts is not a magical, mystery code that unlocks a secret to the future like a crystal ball. However, it's extremely helpful in identifying points of support/resistance in the past, trend lines, momentum and other algorithms which analyze market behavior.
The law of self fulfilling prophesies is especially powerful in the stock market where most of the money flows come from wealthy investors/traders that can push the stock market well beyond current valuations like in a Ponzi Scheme.
The majority of people reading this have long term investments in the stock market that they want to do well and are BIASED.
Stock brokers and advisers make a living on their bullish advice. They are the worst ones right now to get advice from.
++++++++++++
VERY bad time to invest in the stock market!!
47 responses |
Started by metmike - June 18, 2026, 2:56 p.m.
https://www.marketforum.com/forum/topic/120945/
++++++++++++++++
Previous thread:
Money flows are dumping in from rich people based on the principle of a "selffulfilling prophesy".
https://philonotes.com/2024/12/robert-k-mertons-theory-of-the-self-fulfilling-prophecy ...
Financial Markets
The self-fulfilling prophecy is also evident in financial markets, where investor behavior is influenced by expectations about economic trends. For instance, if investors believe that a company is on the brink of bankruptcy, they may sell off their shares, leading to a decline in the company’s stock price. This loss of investor confidence can create financial instability, fulfilling the initial expectation of failure.
Conversely, positive expectations about market performance can drive investment and growth, demonstrating how perceptions shape economic realities.
Implications of the Self-Fulfilling Prophecy
The self-fulfilling prophecy has far-reaching implications across various domains of social life, offering critical insights into the interplay between perception, behavior, and outcome.
+++++++++++++++
https://www.sciencedirect.com/science/article/pii/S2405918818301004
8080/>>!!??>>>8260 -- Back drop 7200--6820 and back up again 10K Early2027 or Cycles Prevails SO Libra sun or Nov Rain -- either OCT --Aug cycles --1987 --2008 -- and 2026 OCT can be 09OCT --2026--- Rough -- NOv --Floods --5th Horsemen --Finger Crossed
ES as I see it..
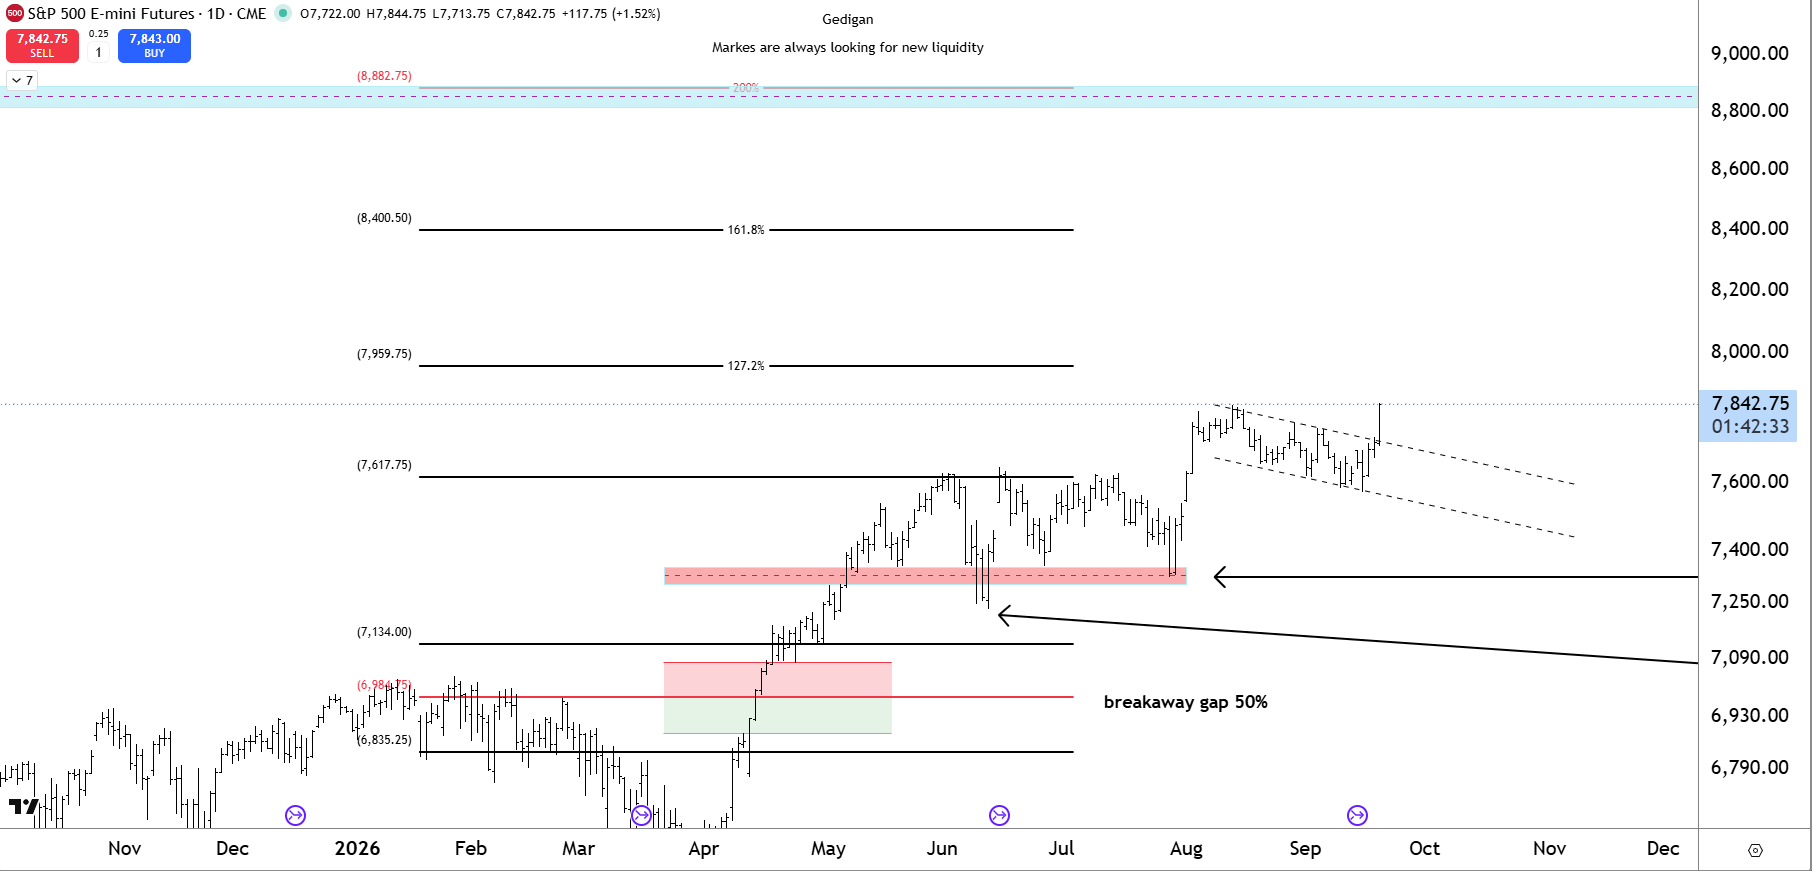
An update from last year's chart suggesting a move to 8822. First a daily and weekly chart below it.
After reaching fib ext. 127% we had a stop raid below Novembers low. The reaction gave us a measured move off the breakaway gap. Another stop raid then a move into a hinge we are moving out of today.
Trade what you see and understand!
Best of trades to everyone!
Daily
Weekly
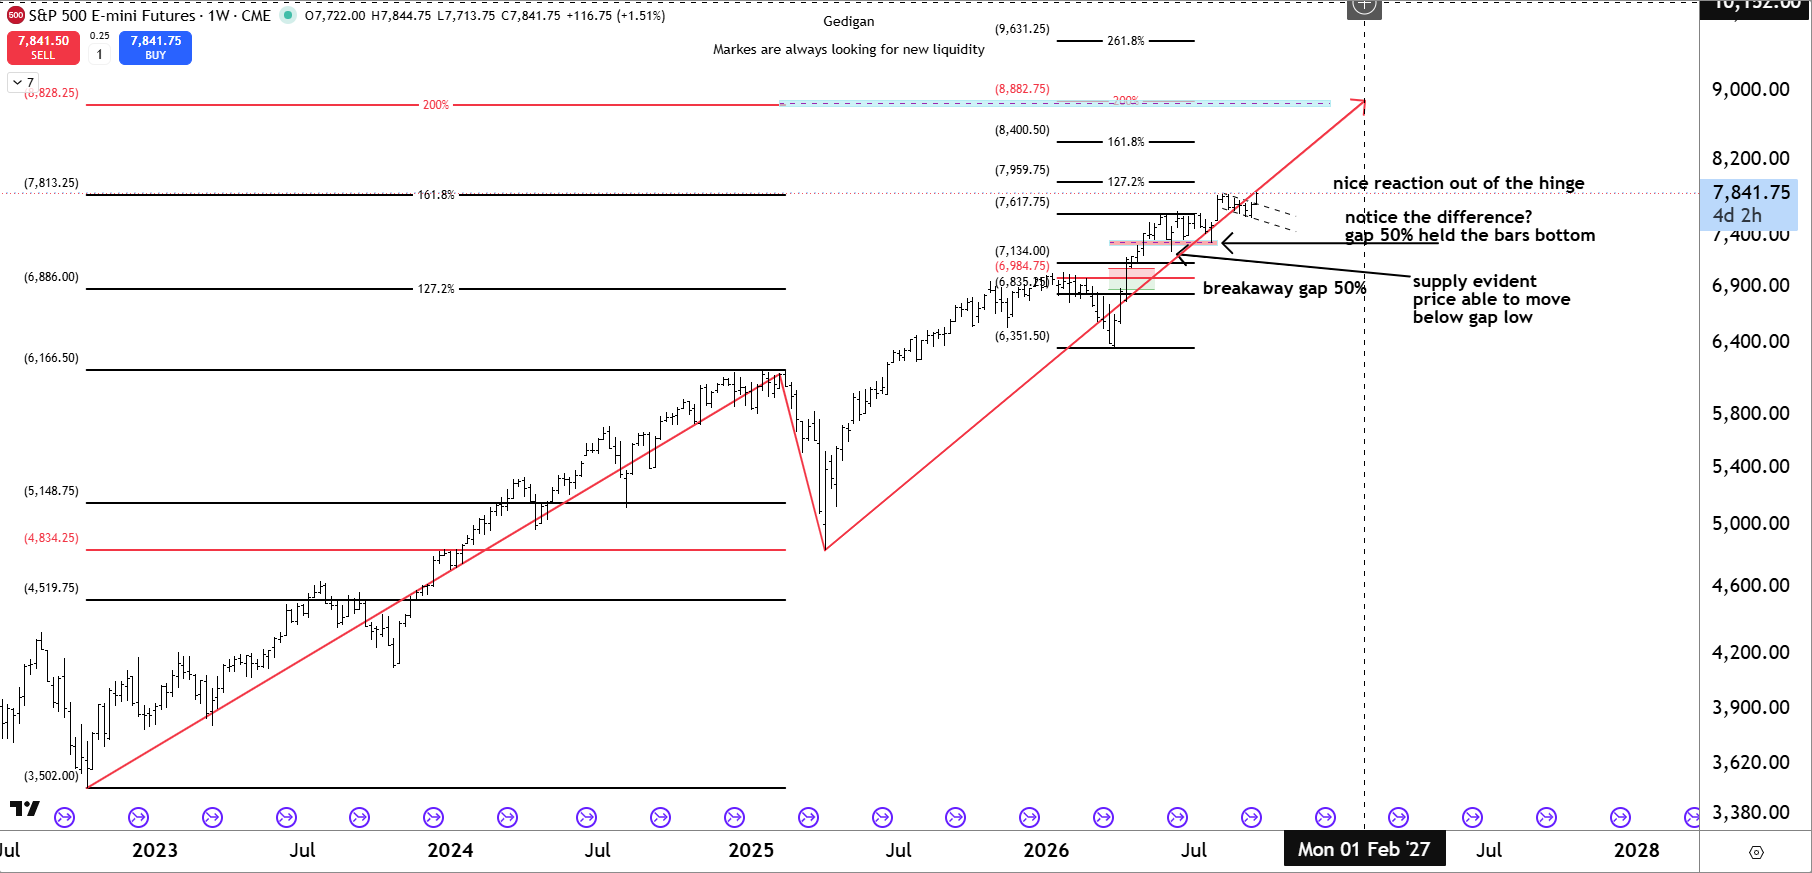
Very solid and crystal clear charts and analysis, gedigan!
Let us start with 1987 when Sp500 /dow place high in Aug followed by another high in OCt with Black Monday --2007 again another drop since 2007 in to 2009 low placed on Friday the 13 and 666 so from there all the way bull till date time and price sq is 6901 and mkt from 2004 high is roughly 8211 so see how it unfolds
Let us we are reaching the End of 3rd Quarter now OCt in to Nov there is hidden voice MAY may day--- keep finger crossed --!!
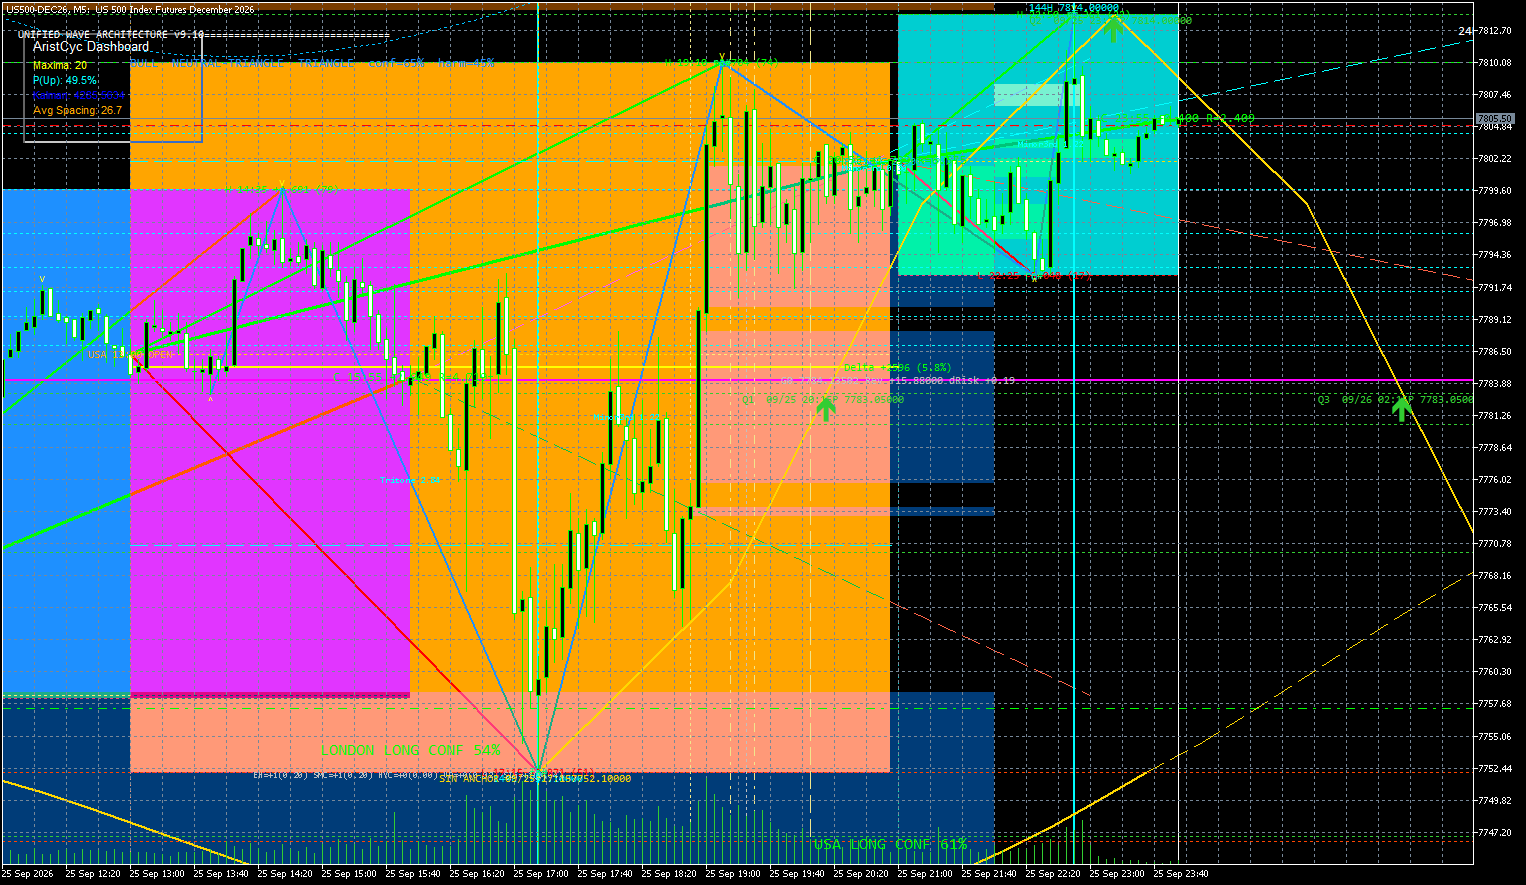
Thanks, fayq!
VERY bad time to invest in the stock market #2!
Started by metmike - Sept. 27, 2026, 9:18 a.m.
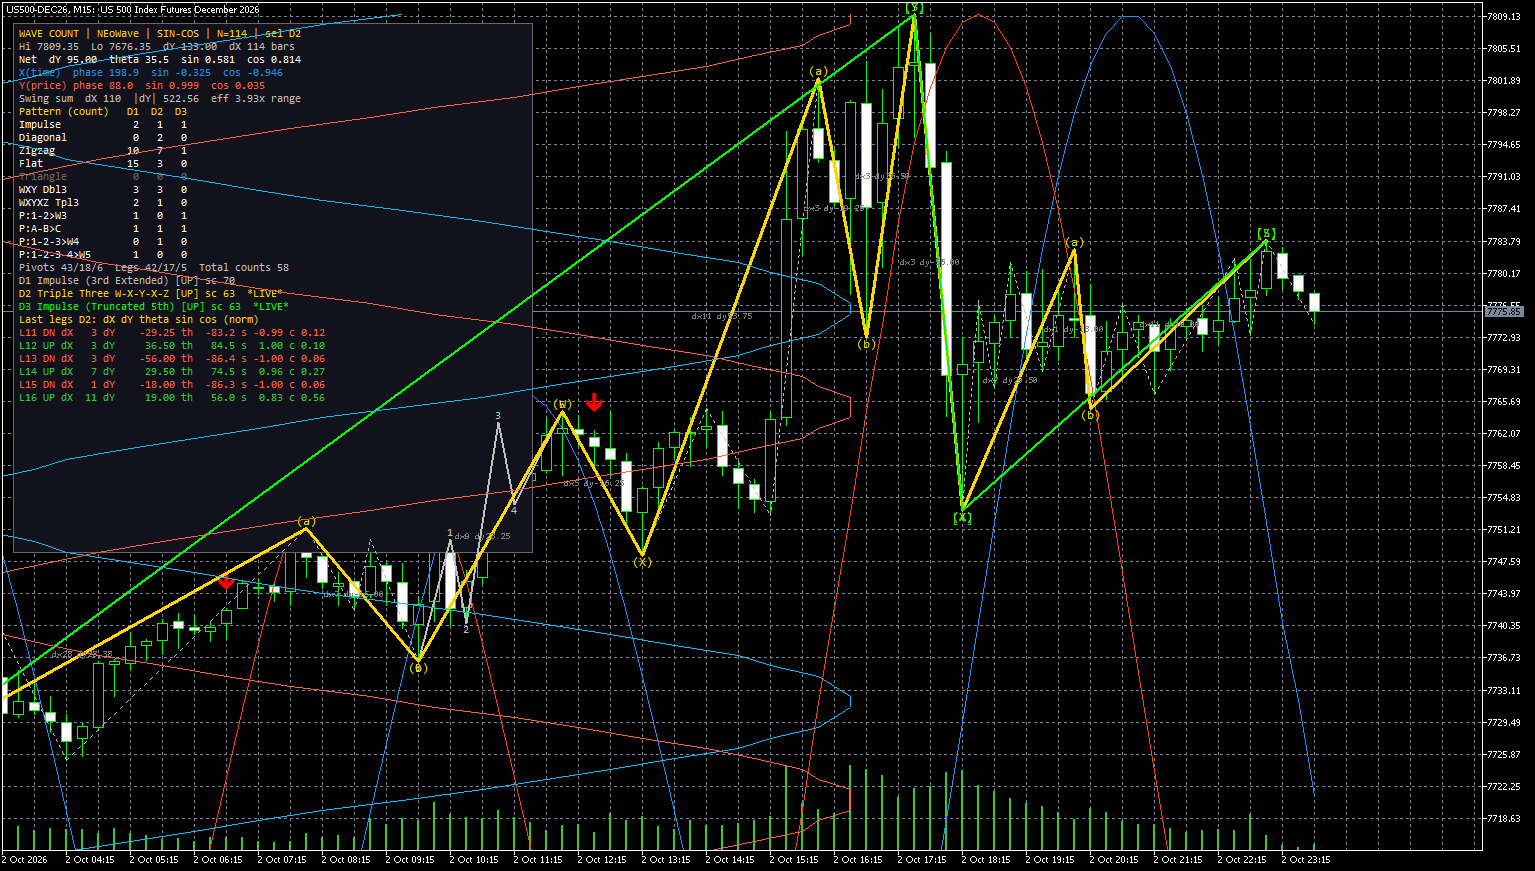
So count in and out == final leg possible for another shakeout and then back to mean Revision--!!
I'll just repeat this to the FUNDAMENTAL side of the stock market.
By joj - Oct. 3, 2026, 10:10 a.m.
+++++++++++
My bearish outlook is strongly correlated to a totally unprecedented, potentially, profound negative impact (Black Swan type event) of the impeachment and REMOVAL of a US president. The same one that has a top priority of causing the stock market to go higher.
So it's not just the risk of a correction lower that we always see in bull markets.
This is unprecedented risk. Not a for sure thing by any means but the risk is profound using the reality of authentic facts in our country and the stock market right now.
Another way to think of it. Who thinks that the impeachment and removal of Donald Trump(that I think is inevitable) will feature the stock market continuing to make new highs?
That is actually possible.
If it means removing tariffs and the end of the Iran war, it's possibly bullish for the stock market. However, I doubt the market will interpret it that way.
