https://release.nass.usda.gov/reports/prog3323.txt
As expected.
Corn -1%
Beans unch but the E-1% and VP+1% means a slight deterioration.
Cotton -3%, all of it going to VP +3% but still rated better than last year. #1 TX is 71% P/VP right now. OK is 65% P/VP. The other 13 states are having record/near record crop yields!
Next week, we should see conditions deteriorate several %.
Great discussion about live trading with tjc yesterday and this morning (who made some nice money being long):
https://www.marketforum.com/forum/topic/98404/
Discussion from last week:
https://www.marketforum.com/forum/topic/98218/
Today:
Beans filled their gap exactly to the tick at 1355.25(the high on Friday and low on Monday) then managed to finish at +7c, which was BELOW the open last night and towards the bottom of the range. Not a good daily technical bar at all. Closing near the top of the closed gap is the only thing that doesn't make it a gap and crap, buying exhaustion formation.
Corn closed the gap and closed almost 11c lower and close to the lows. Still above last weeks low but this was a clear failed attempt to rally with a legit gap and crap buying exhaustion signature.
As mentioned previously, weather is running out of steam having impact on prices because its so late in the growing season.
Extreme heat this week is the most bullish part of the forecast but the market has known this for OVER a week.
You can see how the heat is pushed back south later this week:
Highs for days 3-7:
https://www.wpc.ncep.noaa.gov/medr/medr_max.shtml


++++++++++++++++++++++++++++++++++++
Rains from the tropical system hitting TX could wrap around the backside of the dome in the Midwest and sneak into the C.Plains this weekend.
Day 1 below:
http://www.wpc.ncep.noaa.gov/qpf/fill_94qwbg.gif?1526306199054

Day 2 below:
http://www.wpc.ncep.noaa.gov/qpf/fill_98qwbg.gif?1528293750112

Day 3 below:
http://www.wpc.ncep.noaa.gov/qpf/fill_99qwbg.gif?1528293842764

Days 4-5 below:
http://www.wpc.ncep.noaa.gov/qpf/95ep48iwbg_fill.gif?1526306162

Days 6-7 below:
http://www.wpc.ncep.noaa.gov/qpf/97ep48iwbg_fill.gif?1526306162

7 Day Total precipitation below:
http://www.wpc.ncep.noaa.govcdx /qpf/p168i.gif?1530796126

Extended guidance still bullish but the calendar page has turned to September.
This will probably take a few bushels off yields, with beans still filling pods and some late HEAT Fill for corn. If this were June or July, C and S prices would be taking off like a rocket!
https://www.cpc.ncep.noaa.gov/products/predictions/610day/ | ||||||||
| 6 to 10 day outlooks | ||||||||
| Click below for information about how to read 6-10 day outlook maps Temperature Precipitation | ||||||||
| Click below for archives of past outlooks (data & graphics), historical analogs to todays forecast, and other formats of the 6-10 day outlooks ArchivesAnalogsLines-Only FormatGIS Data | ||||||||
Temperature Probability | ||||||||
Precipitation Probability | ||||||||
Here in southwest IN, we got a surprise 1.51 inches of wonderful rain in the backyard rain gauge early this morning!
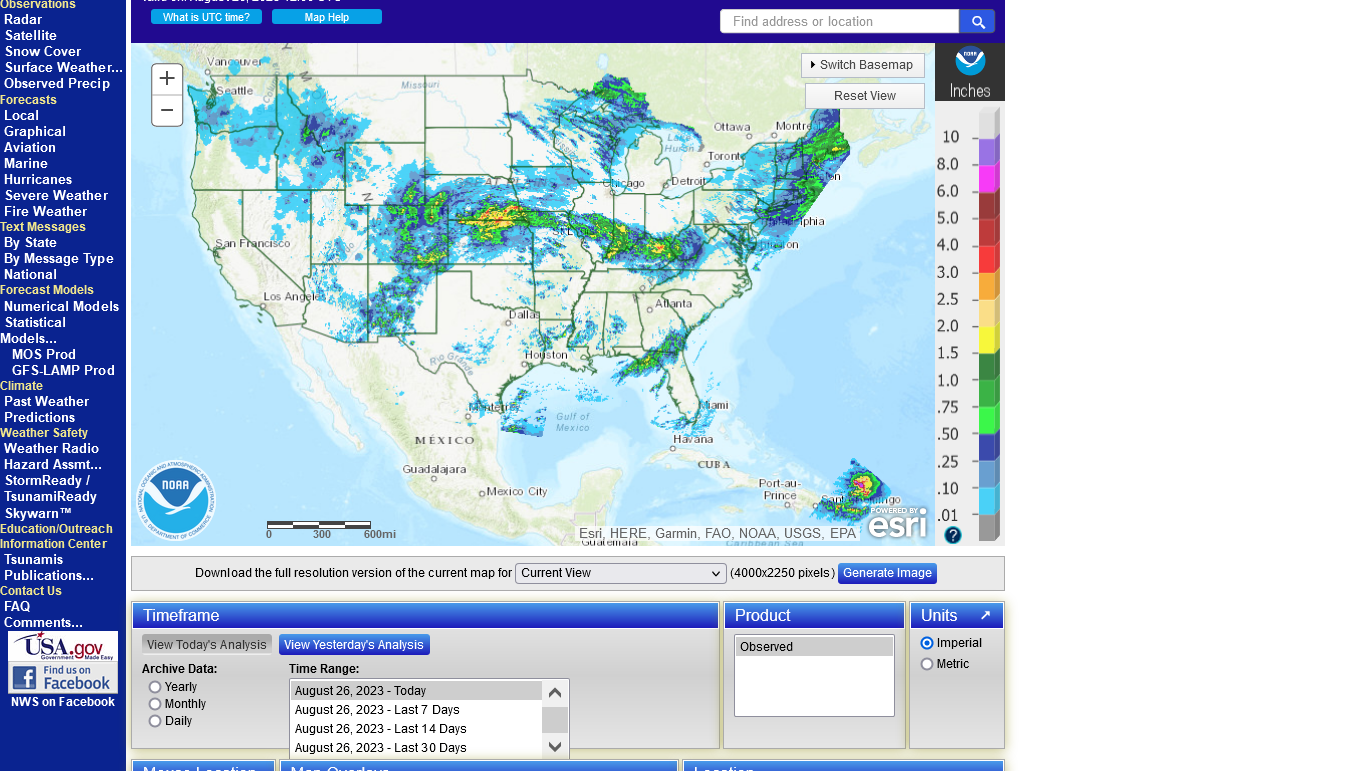
https://water.weather.gov/precip/
1. Last 24 hour rain totals
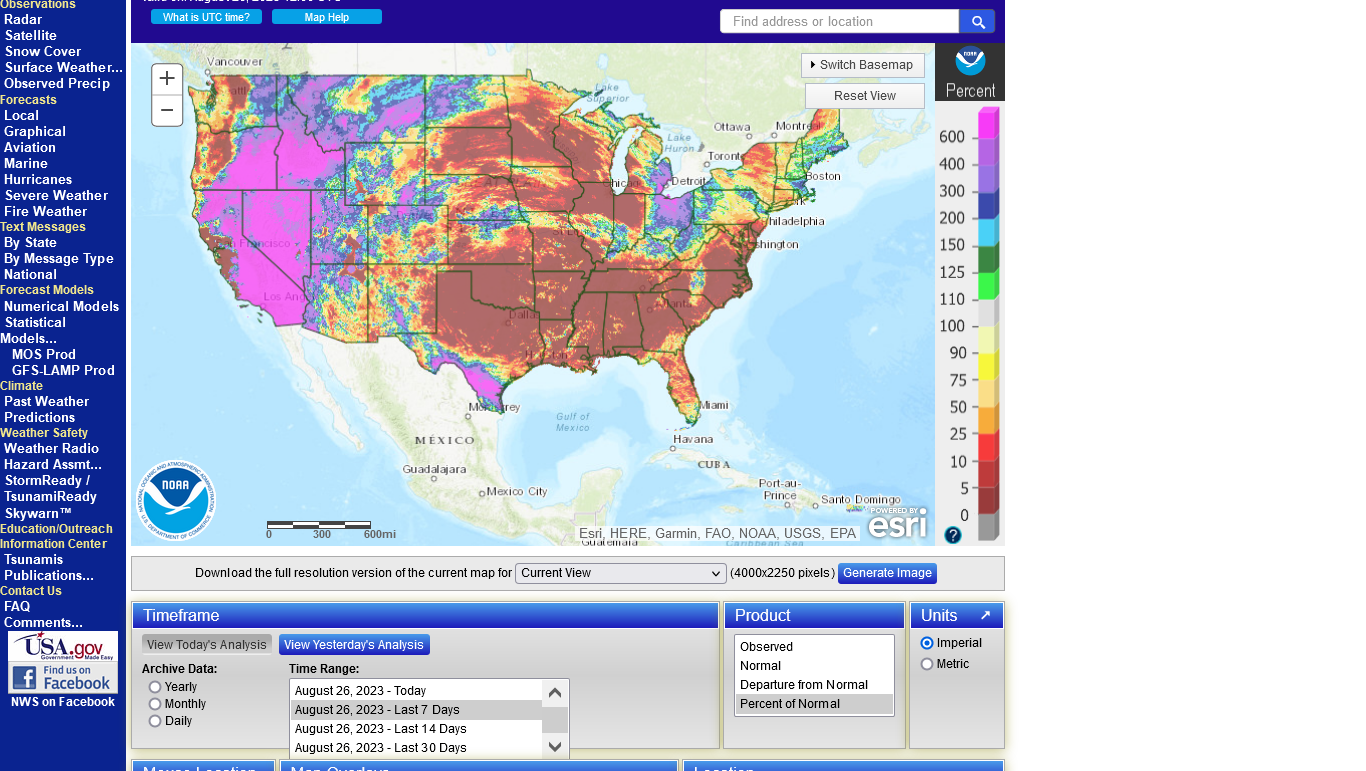
2. Last 7 day totals % of average
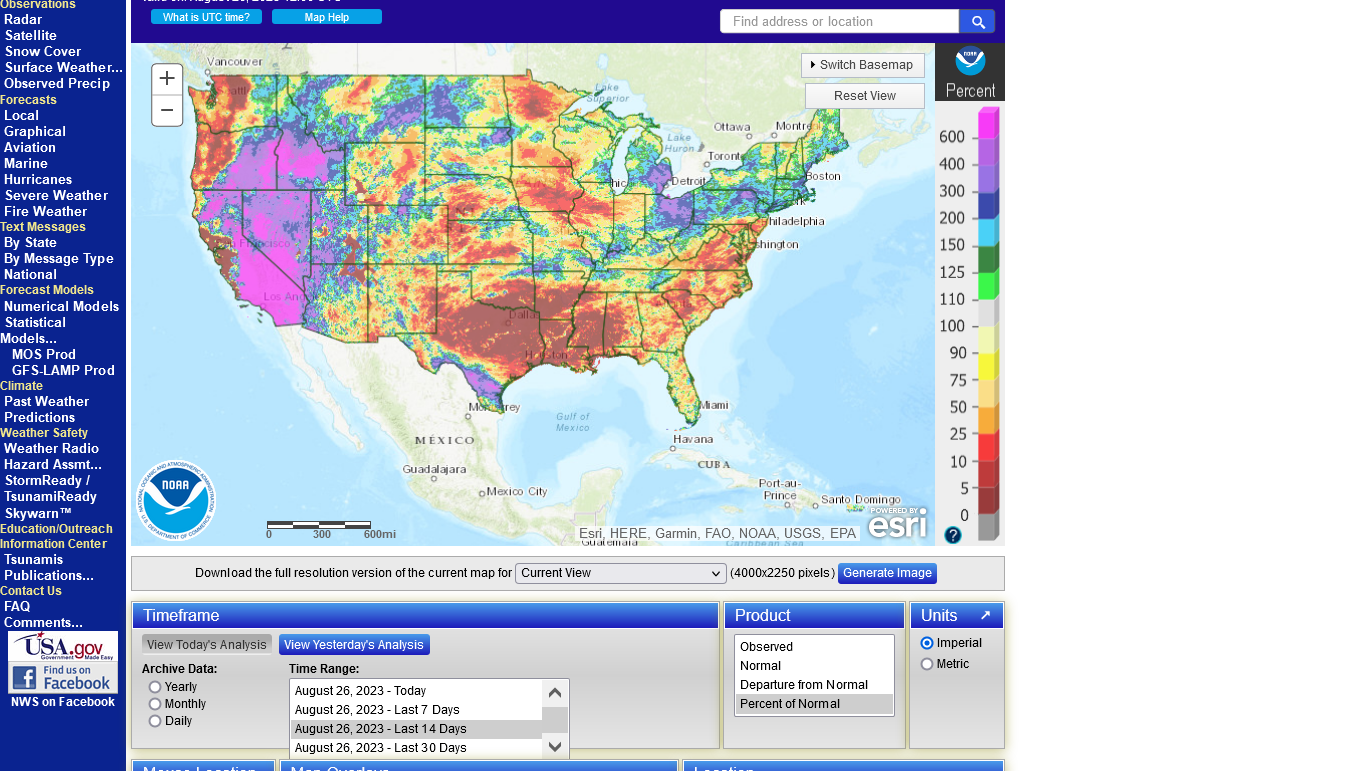
3. Last 14 days %
4. Last 30 days %
5. Last 60 day % of average
6. Last 90 days % average
Today below
7 days below
14 days below
30 days below

60 days below

90 days below

Temperatures
https://www.cpc.ncep.noaa.gov/products/tanal/temp_analyses.php
1. Last 7 days. Look at that heat! NOT GOOD for crops. especially in the WCB/Plains!
2. Previous 30 days BEFORE that brief heat wave-very favorable for crops Midwest! Burning up in TX!
3. Last 90 days BEFORE the brief heat-favorable Midwest-VERY HOT in TX-a bit below average in Phoenix, despite the VERY HOT July
Last week below

30 days before the heat wave below
Last 90 days-BEFORE the heat last week
That lack of rain last week with the heat means crop conditions WILL deteriorate on Monday.
It's so late in the season and there were good rains in early August so its tough to guess what the drop in G/E will be. There will be a wide range with the potential for a surprise.
The next 2 weeks feature no rain and temps heating back up.
That will take another bushel, maybe 2 off the bean yields.
Probably a couple bushels off the late planted corn.
Early planted corn will be ready to harvest pretty soon with ideal drying conditions in the field and very unlikely need for producers to have wet corn that needs drying later this year.
+++++++++
The biggest reason for the gap higher tonight is the BULLISH Pro Farmer final report released just after the market closed on Friday:
https://www.marketforum.com/forum/topic/98452/
If this were June or July with a forecast like this, we could have limit up tomorrow. It's too late for weather to have the biggest impact every day but its probably helping a bit here.
Another issue for future soybean conditions is SDS or Sudden Death Syndrome. It shows up about this time of the season and could knock down the ratings by a % or 2
Thanks much, cutworm!
SDS is a great topic to discuss.
I read around a dozen articles on it after you pointed this out and thought this was the best one and one of the most recent. I read several articles in the past too.
https://www.apsnet.org/edcenter/disandpath/fungalasco/pdlessons/Pages/SuddenDeath.aspx
"SDS is most severe when soybean is planted early into cool, wet soils, when heavy midsummer rains saturate the soil, and when SCN is present."
++++++++++++
This was a good article too:
Sudden death syndrome kills yields with little warning.
Published on April 5, 2023
SDS is caused by a soilborne pathogen, but other conditions can increase the risk of an SDS outbreak.
A wet spring and heavy rainfalls in August contributed to greater SDS pressure in 2022.
"A wet spring can help phase one — root rot," Mueller says. "Phase two is when that toxin moves, and you need heavy rainfalls for that to happen."
Planting early can also cause problems. Moderately cool, wet soils can boost fungal development."
++++++++++++
I selected those quotes to discuss the weather this growing season with respect to SDS. There are other factors besides weather but this year, we had dry Spring.....the opposite of what is favorable for SDS to spread in the root systems from the get go.
It was actually TOO dry in many locations. Many producers had to punch corn and bean planting depths as far down as possible to get to moisture since the top part of the soil profile was extremely dry.
The drought monitor map at the end of May illustrates the early ANTI SDS soil conditions very well.
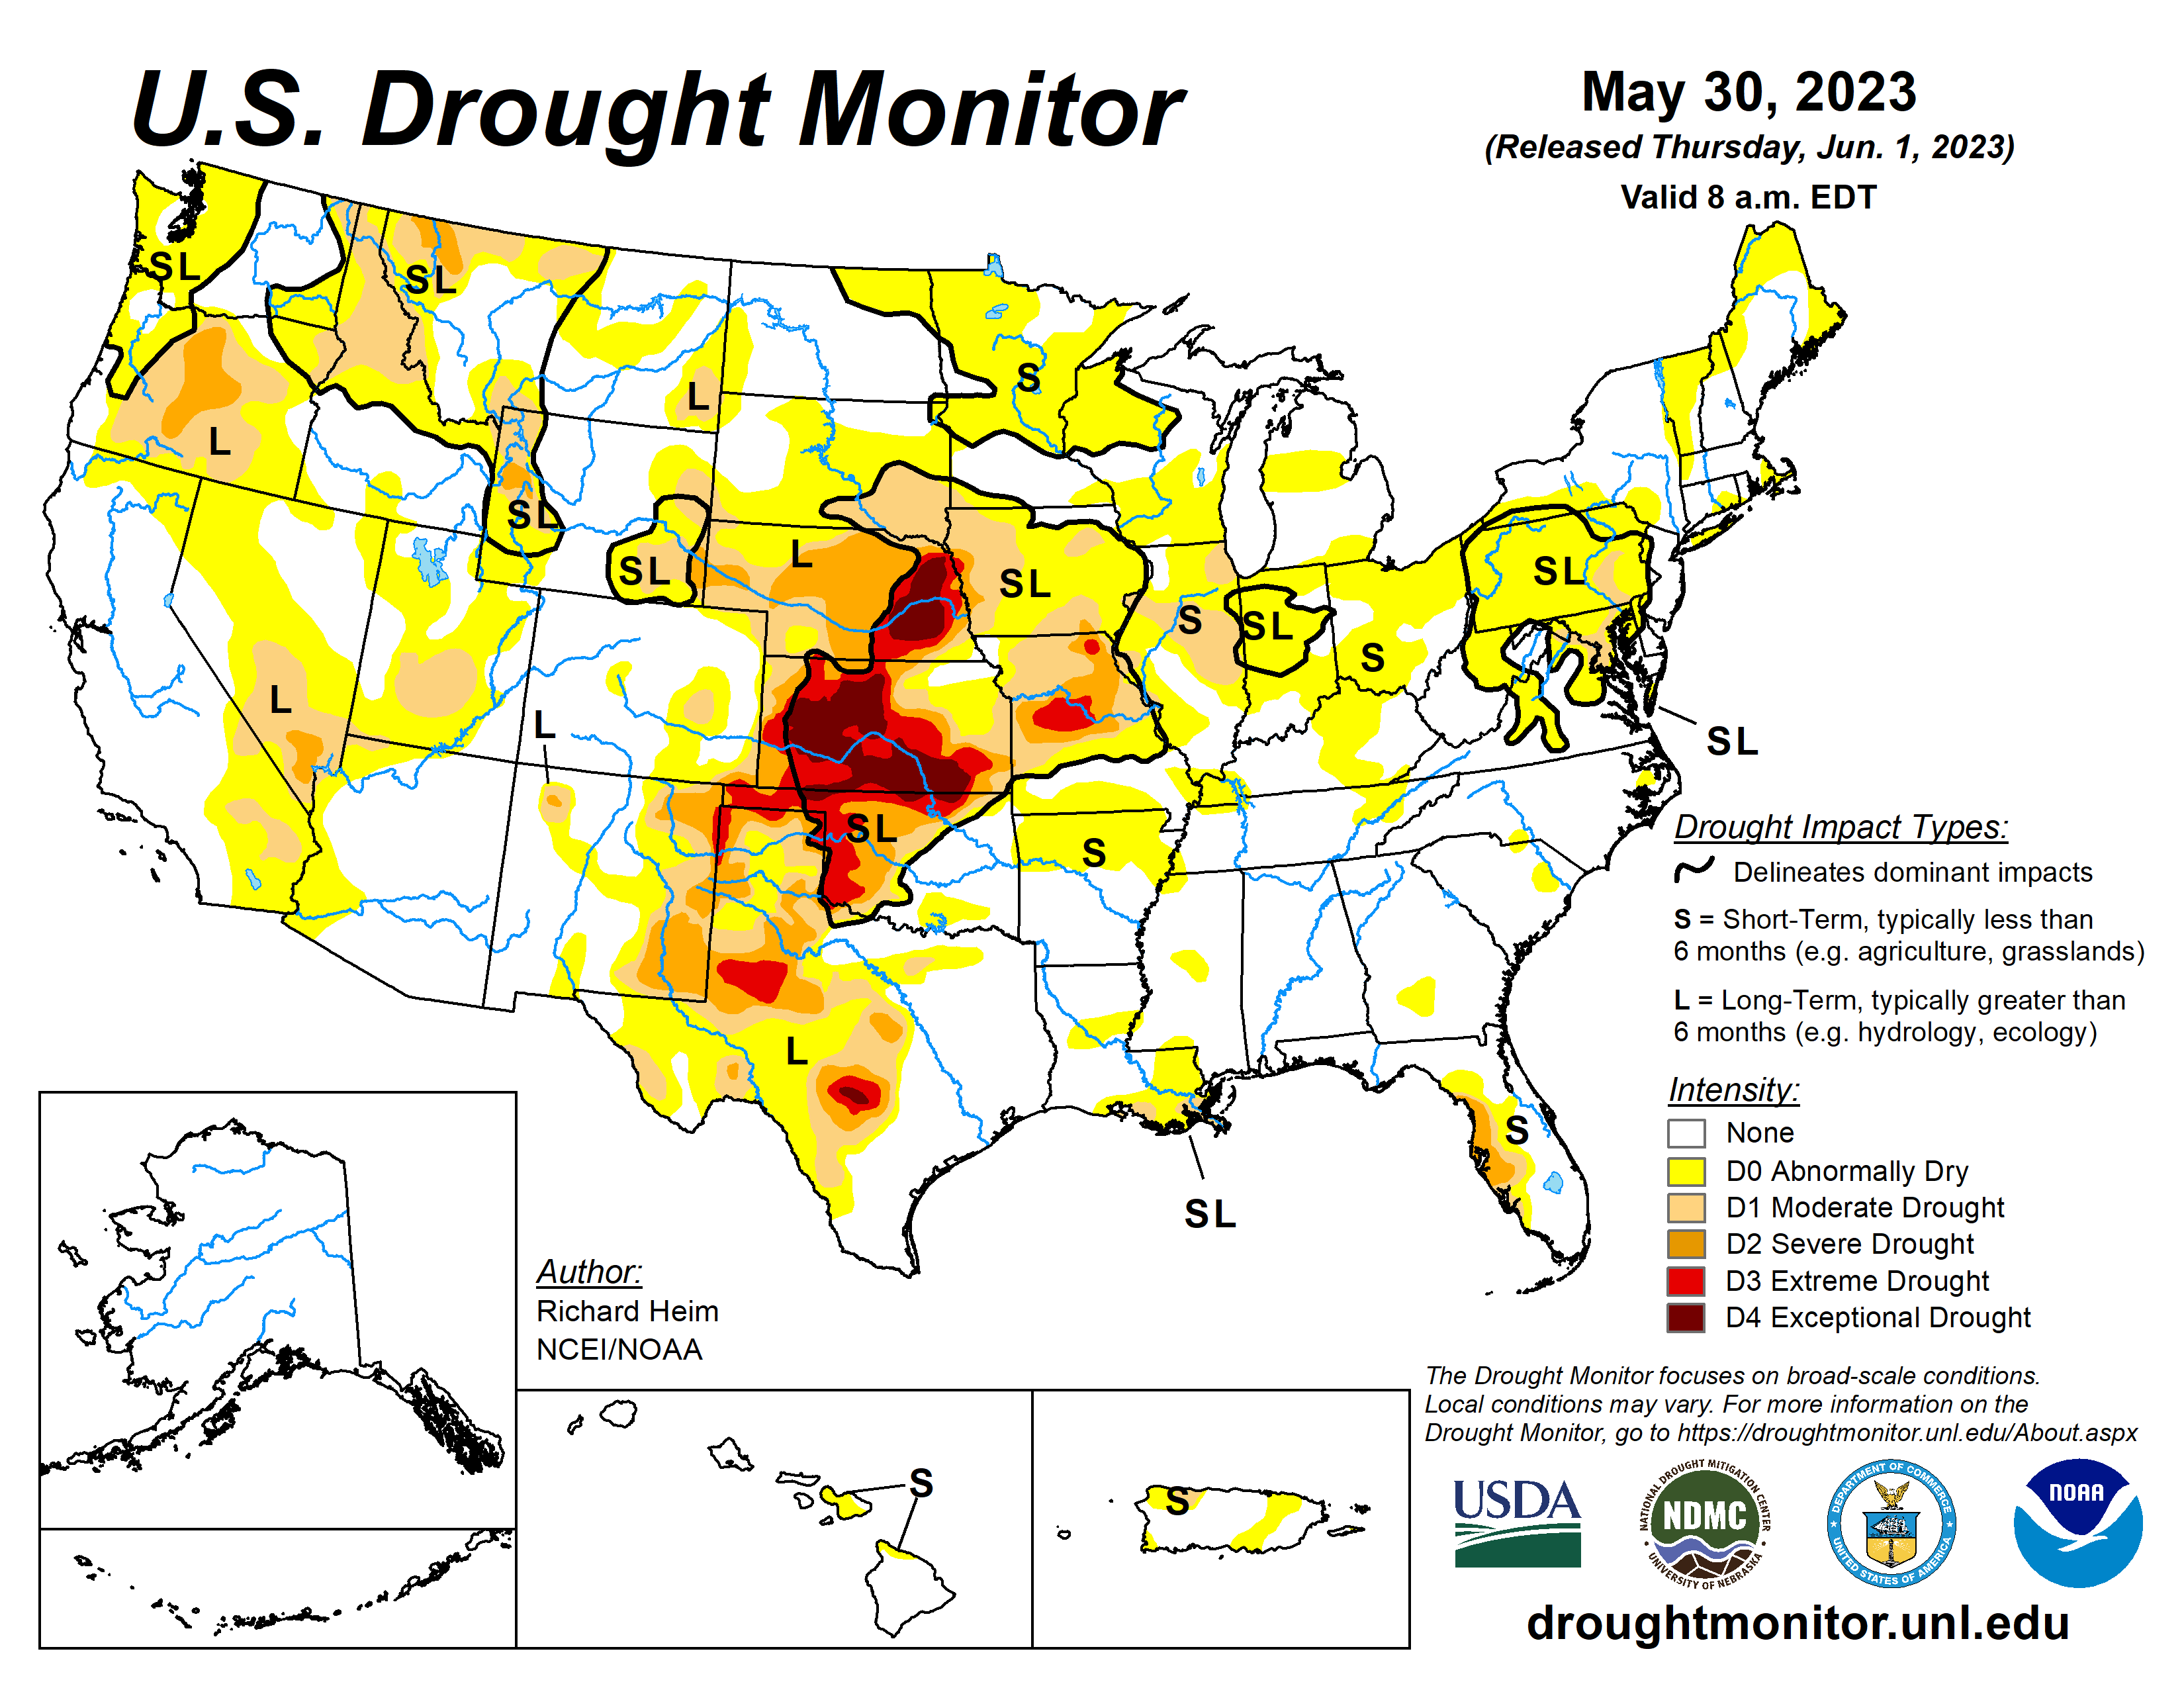
August 22, 2023. Last update below.
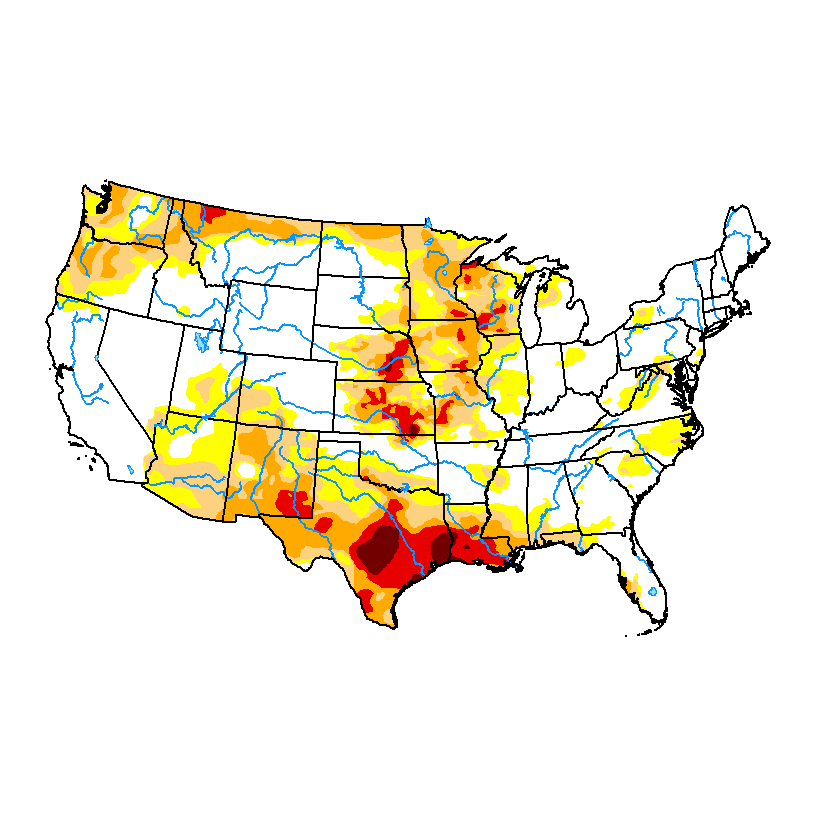
We had several periods of heavier rains that saved the 2023 crop but with extended dry periods (too dry) in between them and no long periods with saturated soils at any point that are most favorable for SDS later in the growing season.
SDS isn't all about weather but 2023 was a great weather year for minimizing the amount of damage from SDS for most of the Midwest.
Corn just barely closed the gap higher which puts in a gap and crap buying exhaustion formation on the price charts if we close below the gap. We're near the bottom of the gap at +2c now.
Beans are still holding the bottom part of the gap higher but are BELOW last nights open. They have much better fundamentals and are still being hurt the most by the upcoming hot/dry weather.........which is too late in the season to make a great deal of difference but is still bullish weather right now.
Weather this week:
https://www.marketforum.com/forum/topic/83844/
Not much rain in the forseeable future.
C and S survived the spike lower after funds sold the day open and are in a much more bullish posture again. Beans especially.
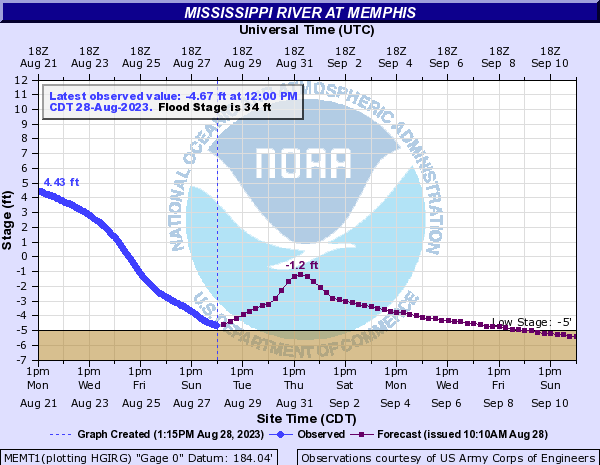
The continuing dry weather in September in the Mississippi River basin is going to present problems with low river levels coming up.
https://water.weather.gov/ahps2/hydrograph.php?gage=memt1&wfo=meg
+++++++++++++++++++
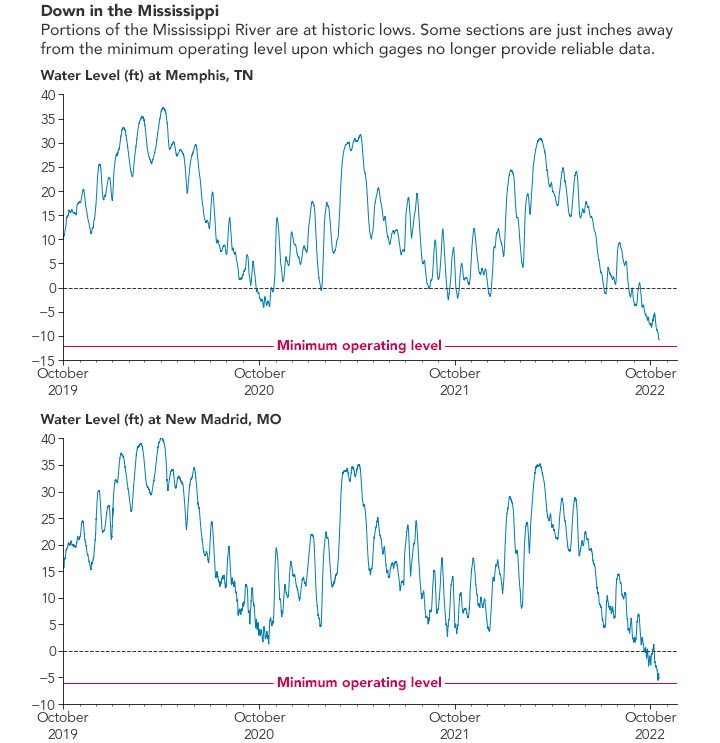
We remember how low the levels got last year:

