There were some very robust rains last week over large areas of the Cornbelt and South.
Typically in early August, the crop rating continues its slow decline headed towards harvest just from maturing and soil moisture drying up.
We've bucked that trend since late June and crop ratings have improved every week from very favorable weather which reversed a severe drought that was on the verge of taking major yields off the crop quickly that could NEVER be recovered.
Amazingly, we have a decent crop. We can also thank the additional 130 ppm of CO2 that is increasing plant growth 26% and gives crops better drought tolerance.
The stomata on the bottom of leaves don't need to open as wide to get CO2, which results in plants losing less moisture thru the stomata. It causes all plants to be more drought tolerant/water efficient and allowed the crops to hold on during the worst part of what had evolved into the start of a severe drought from very little rain in May/first half of June
It's likely that ratings could creep up another 1-2% counter seasonal tomorrow (more than that for beans). This is a bearish factor right now, along with all that rain giving the crops in those locations enough soil moisture to basically make the crop.
This was last week:
Crop conditions+more 8-7-23
https://www.marketforum.com/forum/topic/98014/
USDA August 11, 2023
11 responses |
Started by metmike - Aug. 9, 2023, 1:02 p.m.
https://www.marketforum.com/forum/topic/98070/
++++++++++++++++++
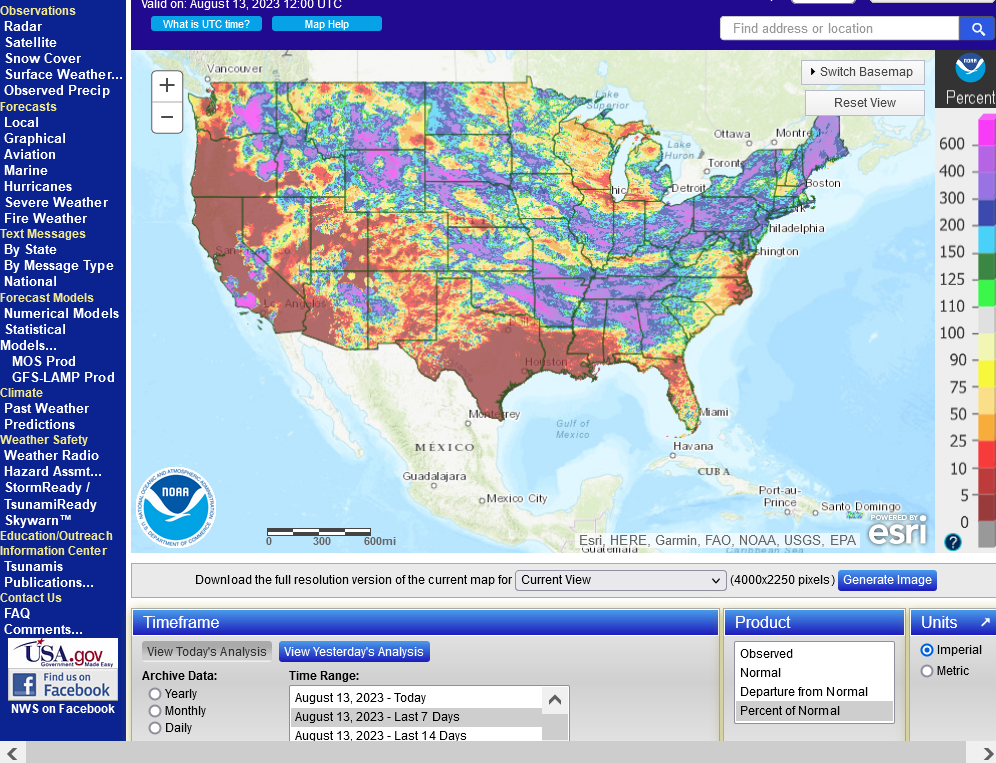
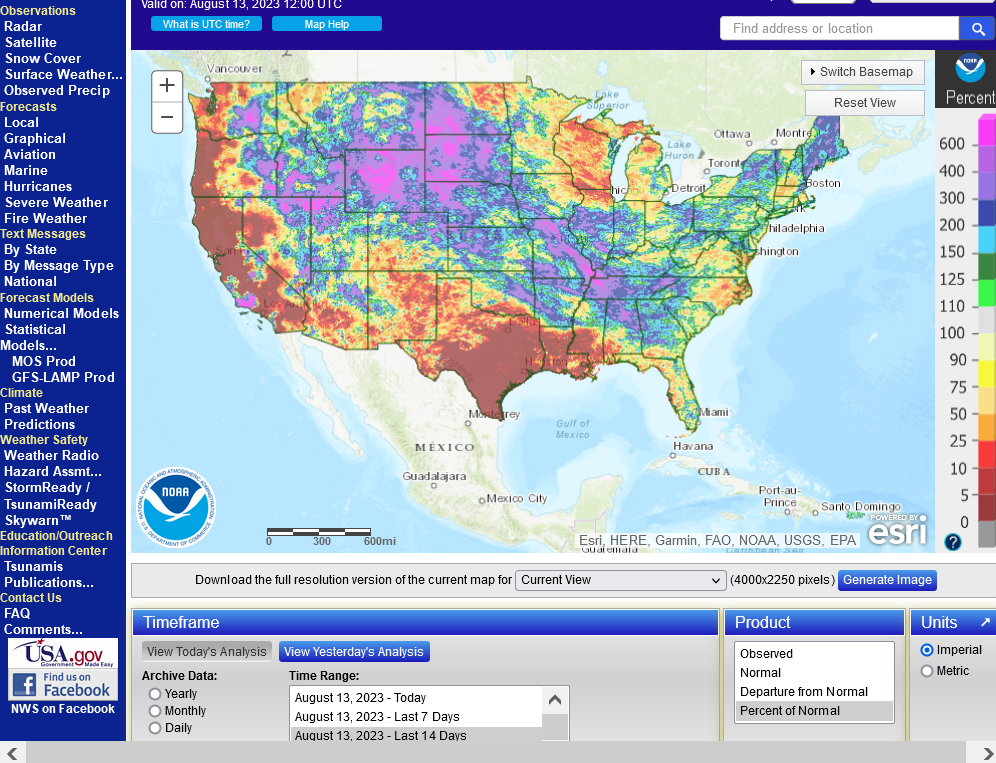
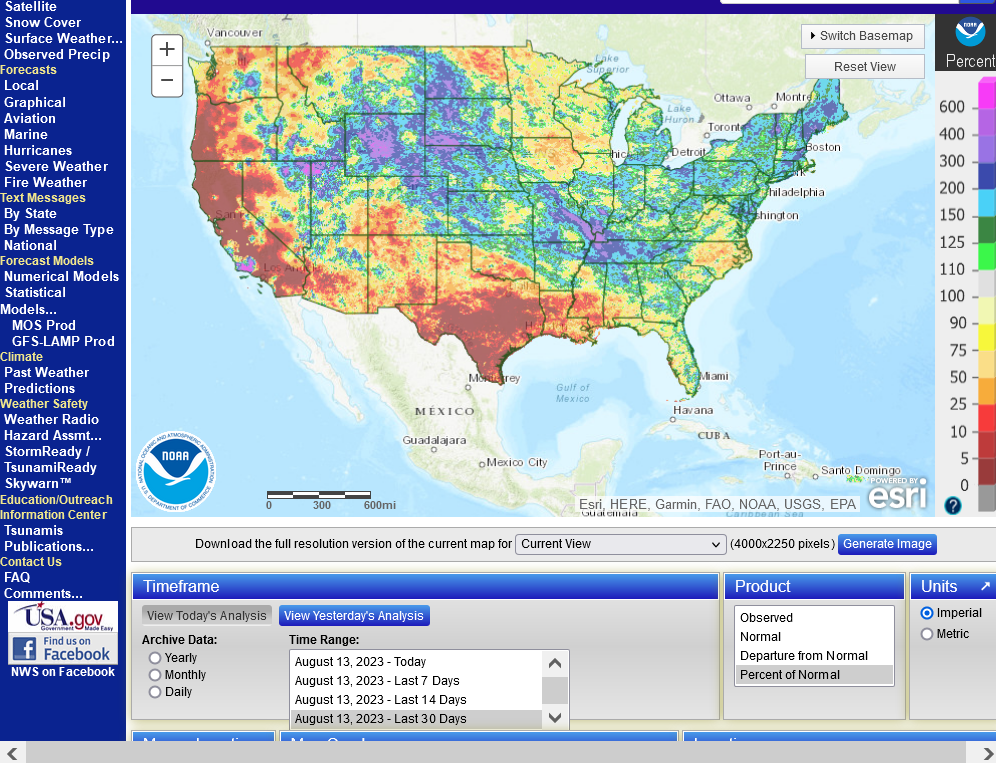
Rains last week, % of average:
1. Last 7 days
2. Last 14 days
3. Last 30 days
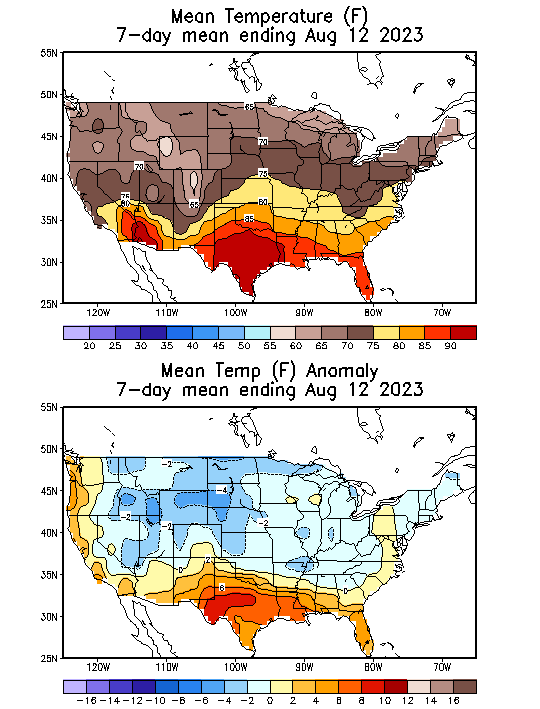
4. Temps last week-MILD and FAVORABLE(again) everywhere in the entire Midwest. The heat was intense in TX and extended to FL, where all the reporters went to tell us about how we have an unprecedented climate crisis.
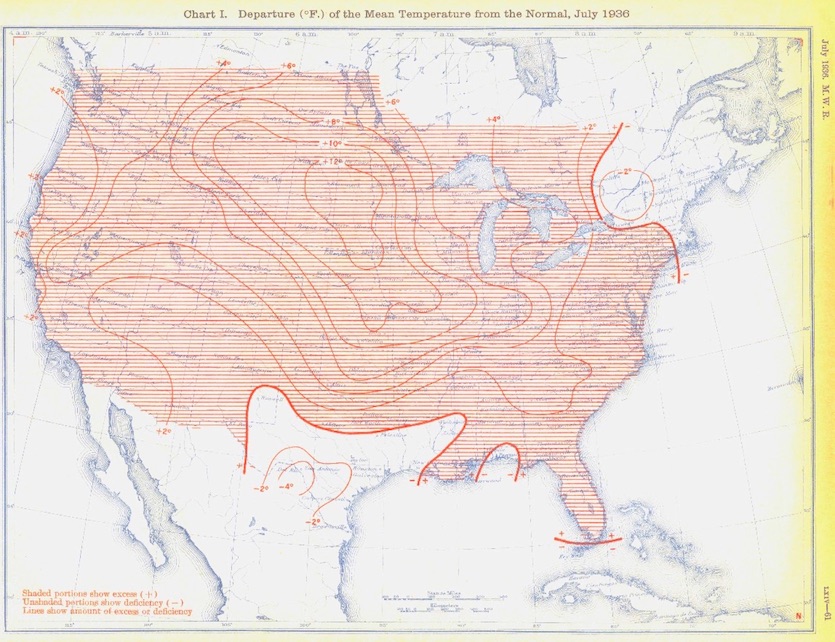
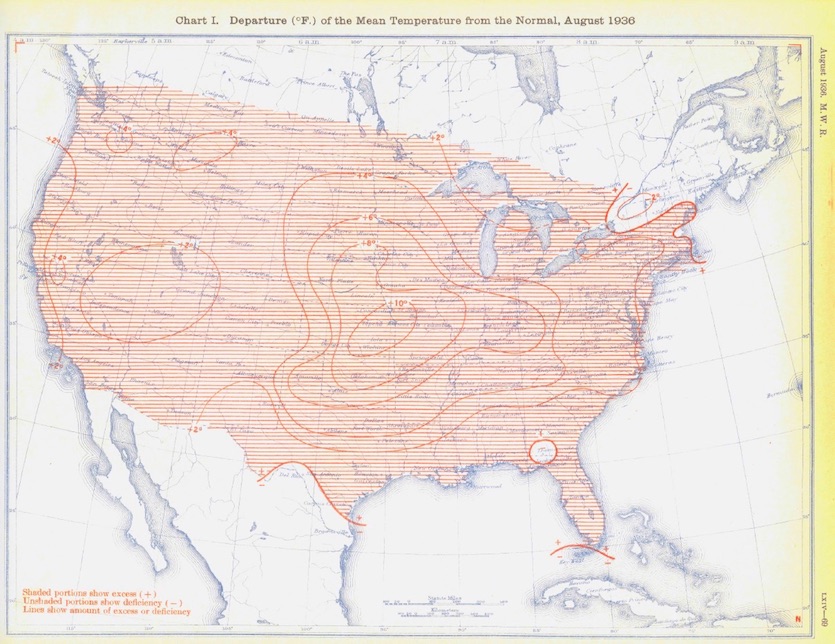
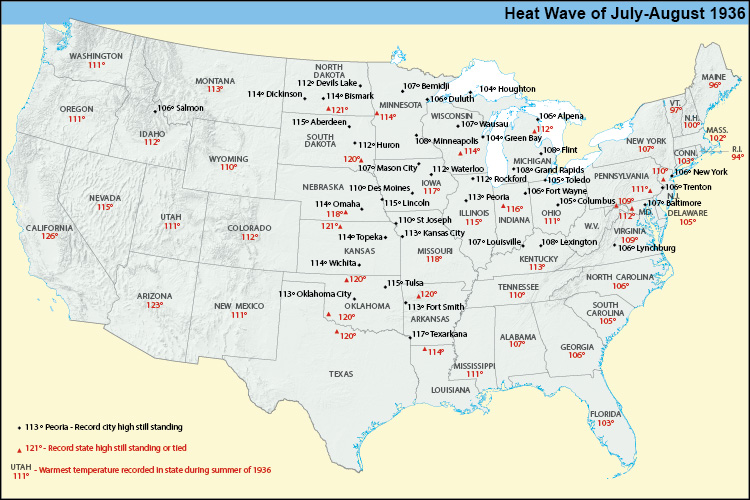
Long time producers in the Midwest and Plains with generations in farming surely had parents/grand parents with stories about the REAL climate crisis in our growing region.........the 1930's Dust Bowl.
July/August of 1936 were especially hot!
https://www.wunderground.com/cat6/North-Americas-Most-Intense-Heat-Wave-July-and-August-1936
From the EPA, which they hide on a back page, while showcasing graphs that start in 1960 on their opening page, using blatantly dishonest science.
https://www.epa.gov/climate-indicators/climate-change-indicators-heat-waves
Figure 3. U.S. Annual Heat Wave Index, 1895–2021
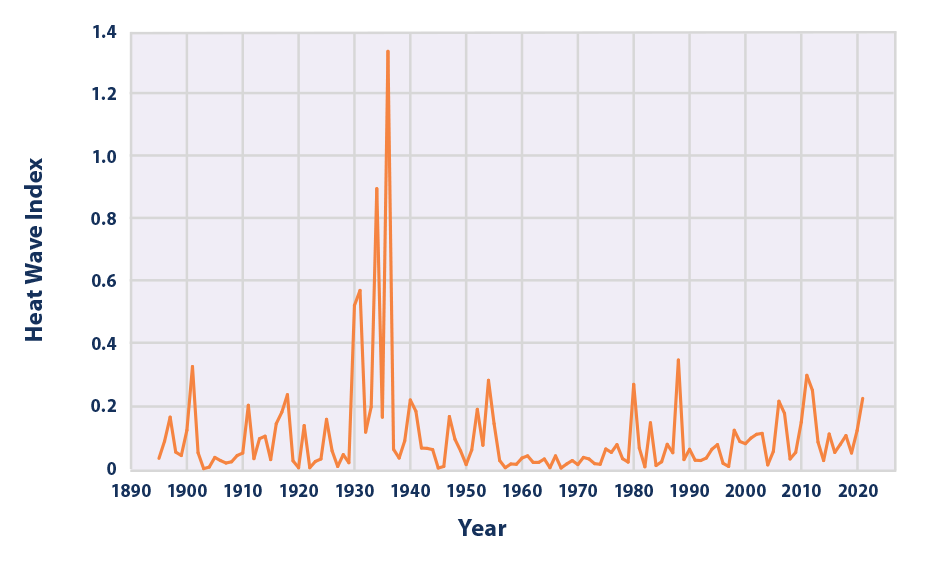
Can you imagine if we had these things happen today?
One reason that we don't is the climate change IS PROTECTING US!!!!
https://www.marketforum.com/forum/topic/97710/#97769
The Dust Bowl for almost an entire decade of the 1930's was the worse climate disaster in U.S. history BEFORE climate change. The current climate OPTIMUM is actually helping to protect us from another Dust Bowl.

++++++++++++++
Another thing for the world to be grateful for with global warming and the extra CO2. It makes this MUCH LESS likely:
Greatest climate crisis in history 1876-1878. 50 million died, 3% of the global population. Climate and the Global Famine of 1876–78 https://journals.ametsoc.org/view/journals/clim/31/23/jcli-d-18-0159.1.xml During the late nineteenth century, a series of famines affected vast parts of Asia, causing mortality on a scale that would be unthinkable today (Davis 2001). Of these, the so-called Global Famine lasting from 1876 to 1878 was the most severe and widespread in at least the past 150 years (Hasell and Roser 2018; Gráda 2009; Davis 2001). The Global Famine inflicted acute distress upon populations in diverse parts of South and East Asia, Brazil, and Africa, with total human fatalities likely exceeding 50 million. These famines were associated with prolonged droughts ... | Aug. 11, 2023, 11 a.m. metmike |
We are living in the age with the best weather/climate in 1,000 years, since the last time it was this warm(called an climate OPTIMUM. The beneficial CO2 levels are in fact the highest since humans have existed by a wide margin.......which is a huge reason for robust crops and food production to feed 8 billions mouths in the world.
Thank you, farmers for taking the risk that you do every year, along with hard work to provide us with our food(even if some of it is wasted on ethanol).
If this were June or July, the upcoming forecast(after some rain early this week) would be wildly BULLISH!
Look at this:
Extended weather.
https://www.cpc.ncep.noaa.gov/products/predictions/610day/ | |||||||||
| 6 to 10 day outlooks | |||||||||
| Click below for information about how to read 6-10 day outlook maps Temperature Precipitation | |||||||||
| Click below for archives of past outlooks (data & graphics), historical analogs to todays forecast, and other formats of the 6-10 day outlooks ArchivesAnalogsLines-Only FormatGIS Data | |||||||||
Temperature Probability | |||||||||
Precipitation Probability | |||||||||
So we have to ask.........why isn't that forecast extremely bullish?
Since I bought SX on the open (and closed it 4 minutes later), I'm bullish but will guess why the market thinks otherwise here.
I had an order to buy on the open at 1312 and heard the bell go off on the computer(that I was filled), excited when we spiked up seconds later, then looked at the fill.............only 1 contract got filled!!
I put a stop in shortly after that at 1313.5, with low confidence and assuming that if the market agreed with me, we would keep going higher. Stopped out 4 minutes later.
However, these seem to be the offsetting bearish factors.
1. All those rains last week and the last 2 weeks and in fact since late June has restored enough soil moisture so that much of the crop is made.
2. Crop ratings tomorrow are likely going to improve another 1-2% (more than that for beans) at a time of year when they typically decline slowly.
2. Very often, at this time of year its extremely tough to push higher when there is rain on the radar in alot of places, like we have this evening. In May, June and even in July its easier for a really bullish extended forecast to be more important because you can still kill the crop, so to speak and generate alot of speculative buying. Rains in August, however are helping to finish the crop off with weather rapidly fading as the most important factor. So week 2 in this case is late August. The worst that will happen is that we will shave a few bushels off the crop if the last couple of weeks will be hot/dry..........and that looks to be the case.
3. The USDA report was friendly, especially for the beans. We had a huge spike higher for both corn and beans BUT REVERSED as the trading session progressed to close lower with a key reversal lower type formation.
The forecast was just as bullish on Friday but the market couldn't use it, along with the friendly USDA report. Not a great sign. The USDA report, however was based on the current crop condition almost 2 weeks ago. It's better than that right now and we'll see it get bigger again in tomorrows crop condition report that features a higher rating.
So I think we have a temporary stand off early this evening between the crop still getting bigger/better thru tomorrow's(8-14-23) crop rating...........THEN, deteriorating from the upcoming hot/dry weather, which might start on the 8-21-23 report with a tiny drop and probably not impact the crop condition report until August 28th after a week of HOT and dry weather in many places(but not everywhere-this is NOT a dome of death over the entire belt-rains will fall in the Upper Midwest around the periphery of the heat ridge)
That's pretty dang late in the growing season but it WILL take a couple of bushels off the beans compared to where they are right now.
After this day 1 rain falls, there appears to be a better chance for the beans to go up, with no more big widespread rain events on the models.
Since its August 13th, weather is becoming less important so my analysis might be correct on the impact of the crop but speculative traders that buy on weather adversity are not as interested as they were earlier in the year.
Soilmoisture anomaly:
These maps sometimes take a day to catch up to incorporate the latest data(the bottom map is only updated once a week).
https://www.cpc.ncep.noaa.gov/products/Soilmst_Monitoring/US/Soilmst/Soilmst.shtml#
![]()

++++++++++++++++++++++++++++
Updated daily below:
https://mrcc.purdue.edu/cliwatch/watch.htm#curMonths

All the weather is here:
https://www.marketforum.com/forum/topic/83844/
Found a great new link/site that shows us how much precip fell(from 1 hr to 72 hours) for different periods to share with you.
https://www.iweathernet.com/total-rainfall-map-24-hours-to-72-hours
he latest 7 day precip forecasts are below.
Day 1 below:
http://www.wpc.ncep.noaa.gov/qpf/fill_94qwbg.gif?1526306199054

Day 2 below:
http://www.wpc.ncep.noaa.gov/qpf/fill_98qwbg.gif?1528293750112

Day 3 below:
http://www.wpc.ncep.noaa.gov/qpf/fill_99qwbg.gif?1528293842764

Days 4-5 below:
http://www.wpc.ncep.noaa.gov/qpf/95ep48iwbg_fill.gif?1526306162

Days 6-7 below:
http://www.wpc.ncep.noaa.gov/qpf/97ep48iwbg_fill.gif?1526306162

7 Day Total precipitation below:
http://www.wpc.ncep.noaa.govcdx /qpf/p168i.gif?1530796126

Cotton is getting hammered here. I will guess on that.
1. We couldn't close above the July high 88c on Friday. We spiked above it after the report but faded in the last hour+. Which was a price that we hit with absolutely MEGA bullish weather in TX and a very bullish USDA report. Friday had big gains but dropped below 88c towards the end of the trading session.
2. The dome of death in the south is weakening in the weather forecast. There still no rain and it will still be hot but not AS hot in TX later this month.
3. It's getting late in the year for hot/dry weather trading with cotton. Places that have had hot/dry all Summer and are poor/very poor will not be losing much more yield with more of the same. There's no category below VP. If the crop is 0 yield and dead it's still VP.
4. Cotton is a global market and I don't know what the fundamentals are globally. Maybe a horrible US crop isn't able to get us above 88c. If our competitors are selling cotton for 80c for instance(hypothetical) what will happen is that all the buyers will go there because there's no global demand for 88c cotton.
If we can't sell/export 88c cotton, no matter how small the crop is the price has to come down to export it.
Domestic demand/supply and prices is another thing. This is just an example of how the global market plays a role.
Beans are acting much better and how I thought they would earlier.
1318 +11c.
We've only traded for 2 hours. I will guess that beans will be higher than this by double digits later in the week but don't take that as a trade rec. Weather models could add rain and change that. Speaking of which:
This was the last 18z GEFS.
1. Upper levels in 2 weeks. Upper ridge in TX has really weakened. In fact, there's an upper level WEAKNESS and it extends across the Gulf States. The ridge extends into the Upper Midwest. Always tricky to forecast rains on the periphery in the Midwest.
2. Total rains-it's not completely dry but some of that rain is falling the next 24 hours. Pretty dry
3. European model rains-Upper Midwest is actually on the wet side
Beans took a bit more time than I thought initially but are +20c now.
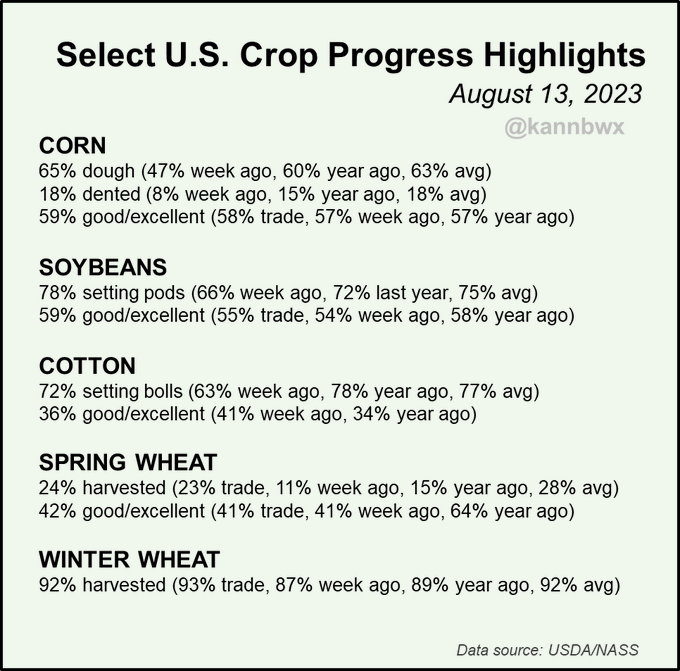
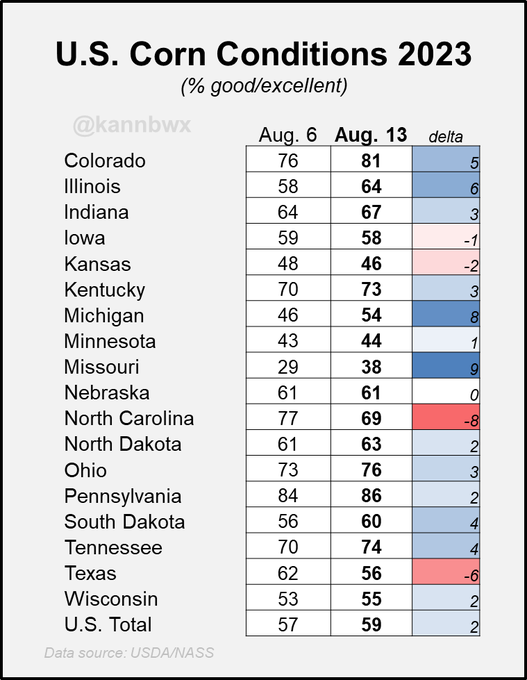
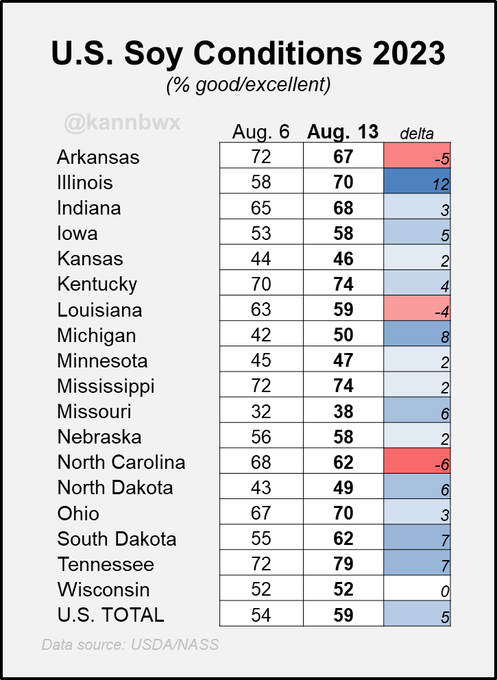
As expected, the crop ratings improved.
Corn +2%
Beans +5%........WOW! That's even greater than I thought.
Cotton -5% still +2% vs last year BUT the P/VP in 2023 is +8% vs 2022 so the crop is worse than last year. #1 TX is 66% P/VP this year!
Oats: Hasn't mattered for several weeks because oats have been mature 60% harvested
Spring Wheat: Same thing 24% harvested
Conditions for U.S. #corn & #soybeans - both 59% good/excellent - are now higher than in the same week a year ago. Soybean conditions surged five percentage points on the week.
Many improvements across the board for U.S. #corn conditions last week amid cooler weather with decent rain coverage. Notable increases in Illinois, Missouri and Michigan.
Many condition improvements for U.S. #soybeans this week, but none more notable than top producer Illinois, up 12 points. The five-point gain at the national level is super rare for any week, though the last time it happened in this week was in 1991.
My rain gauge picked up 1.7 inches of wonderful rain Sunday/early Monday.
We should be good thru the next 10 days but the intense heat in week 2, will dry things out by the end of the month.
Roots are very well developed for the crops this late in the growing season, so when surface moisture dries out late this month and the heat provides some stress, the roots will still have access to subsoil moisture.
Regardless, the crop report on August 28th will likely show some deterioration in crop conditions.
We probably won't lose the entire +5% that was just gained in the last week or the steady improvement the crop has seen since late June but a drop of 2-3% seems likely in 2 weeks with the current outlook.
1. Beans barely holding on, with still an outside chance of it being a bull flag after the Aug. 8 reversal up that had some follow thru last week.
https://futures.tradingcharts.com/chart/ZS/
%20Daily%20Commodity%20Futures%20Price%20Chart%20CBOT.png)
2. Corn is technical toast. Well below the lows of the year now. Amazing how the charts look so different between C and S right now. Lows were just above 4.81 and we closed around 4.74.
https://futures.tradingcharts.com/chart/ZC/
%20Daily%20Commodity%20Futures%20Price%20Chart%20CBOT.png)
By metmike - Aug. 15, 2023, 3:16 p.m.
Questions:
1. When was the last time that beans and corn had double digit losses during the growing season with a forecast like this below(though it's LATE in the growing season right now and TOO late to hurt the crop much)?
Answer: NEVER in my memory trading over 3 decades
2. When was the last time that the S crop condition went +5 G/E in key pod filling month, August?
Answer: NEVER and that's the entire reason for #1.
The market is confident that the crop is made here on August 15th!. I think that these next 2 weeks of weather will take a couple of bushels off where were are at this moment, HOWEVER, +5 in the crop condition yesterday added MORE THAN that.
7 Day Total precipitation below:
http://www.wpc.ncep.noaa.govcdx /qpf/p168i.gif?1530796126
Extended weather.
https://www.cpc.ncep.noaa.gov/products/predictions/610day/ | |||||||||
| 6 to 10 day outlooks | |||||||||
| Click below for information about how to read 6-10 day outlook maps Temperature Precipitation | |||||||||
| Click below for archives of past outlooks (data & graphics), historical analogs to todays forecast, and other formats of the 6-10 day outlooks ArchivesAnalogsLines-Only FormatGIS Data | |||||||||
| Temperature Probability | |||||||||
| Precipitation Probability | |||||||||
| |||||||||
See tallpines thread for updates. Beans are +10c at the moment and held support with a potentially constructive technical situation still at play.
Re: Re: INO Morning Market Commentary
By metmike - Aug. 15, 2023, 1:46 p.m.
The market has chosen the downside today because of the +5 condition rating, in addition, Crude is -$2 which is likely adding pressure.
-16c at the moment for beans
Corn is making new lows for the week and the move but beans are still holding the lows for this week and well above the recent low. They have the more positive technical picture, even with the sharp losses today.
That's my positive spin on what still looks pretty bad.
If the weather forecast this bullish(but late) can't inspire speculative buying today, exactly at what point will it?
Answer:
1. I don't know when that point will be well enough to use it to pick the right, low risk spot to buy
2. It can't
3. Picking a point of strong support would be the "take a chance" option..........but then, it might be more gambling based on "wanting" to be long
Update: Choosing option #3 would have made some money this evening.
++++++++++++++++++
Added: Very often, that's what trading is all about..... "taking a chance" when you see enough factors that favor the market moving in 1 direction. There will rarely be a perfect trade.
By the time that all the factors line up totally to one side, everybody else knows it and the price has already reacted.
It takes awhile to evolve and the market will often move in that direction as it evolves because of others that were willing to "take a chance" when those factors were not a given.
The market dials in NEW things that it didn't know the day before when it comes to news, weather, crop conditions and things like that. A person that trades on those items needs to take chances based on them knowing those things BEFORE the market does and having the position in place for WHEN the market reacts as it finds out or fully embraces the significance of those items.

