KEY EVENTS TO WATCH FOR:
Wednesday, August 16, 2023
7:00 AM ET. MBA Weekly Mortgage Applications Survey
Composite Idx (previous 194.5)
Composite Idx, W/W% (previous -3.1%)
Purchase Idx-SA (previous 149.9)
Purchase Idx-SA, W/W% (previous -2.7%)
Refinance Idx (previous 416.1)
Refinance Idx, W/W% (previous -4.0%)
8:30 AM ET. July New Residential Construction - Housing Starts and Building Permits
Total Starts (expected 1.45M; previous 1.434M)
Housing Starts, M/M% (expected +1.1%; previous -8%)
Building Permits (expected 1.48M; previous 1.440M)
Building Permits, M/M% (expected +2.8%; previous -3.7%)
9:15 AM ET. July Industrial Production & Capacity Utilization
Industrial Production, M/M% (expected +0.3%; previous -0.5%)
Capacity Utilization % (expected 79.1%; previous 78.9%)
Capacity Utilization, Net Chg (Pts) (previous -0.5)
10:30 AM ET. EIA Weekly Petroleum Status Report
Crude Oil Stocks (Bbl) (previous 445.622M)
Crude Oil Stocks, Net Chg (Bbl) (previous +5.851M)
Gasoline Stocks (Bbl) (previous 216.42M)
Gasoline Stocks, Net Chg (Bbl) (previous -2.661M)
Distillate Stocks (Bbl) (previous 115.447M)
Distillate Stocks, Net Chg (Bbl) (previous -1.706M)
Refinery Usage (previous 93.8%)
Total Prod Supplied (Bbl/day) (previous 20.727M)
Total Prod Supplied, Net Chg (Bbl/day) (previous +0.704M)
2:00 PM ET. Federal Open Market Committee meeting minutes published
Thursday, August 17, 2023
8:30 AM ET. August Philadelphia Fed Business Outlook Survey
Business Activity (expected -10; previous -13.5)
Prices Paid (previous 9.5)
Employment (previous -1.0)
New Orders (previous -15.9)
Prices Received (previous 23.0)
Delivery Times (previous -12.9)
Inventories (previous -1.0)
Shipments (previous -12.5)
8:30 AM ET. Unemployment Insurance Weekly Claims Report - Initial Claims
Jobless Claims (expected 240K: previous 248K)
Jobless Claims, Net Chg (previous +21K)
Continuing Claims (previous 1684000)
Continuing Claims, Net Chg (previous -8K)
8:30 AM ET. U.S. Weekly Export Sales
10:00 AM ET. 2nd Quarter Quarterly Retail E-Commerce Sales
10:00 AM ET. July Leading Indicators
Leading Index, M/M% (expected -0.4%; previous -0.7%)
Leading Index
Coincident Index, M/M% (previous +110.0%)
Lagging Index, M/M% (previous +118.4%)
10:30 AM ET. EIA Weekly Natural Gas Storage Report
Working Gas In Storage (Cbf) (previous 3030B)
Working Gas In Storage, Net Chg (Cbf) (previous +29B)
2:00 PM ET. SEC Closed Meeting
4:30 PM ET. Federal Discount Window Borrowings
4:30 PM ET. Foreign Central Bank Holdings
Friday, August 18, 2023
10:00 AM ET. 2nd Quarter Advance Quarterly Services
10:00 AM ET. July State Employment and Unemployment
The STOCK INDEXES? http://quotes.ino.com/ex?changes/?c=indexes
The STOCK INDEXES: The September NASDAQ 100 was higher overnight and sets the stage a higher opening when the day session begins trading. Stochastics and the RSI are oversold but remain neutral to bearish signaling that sideways to lower prices are possible near-term. If September extends the decline off July's high, the 25% retracement level of the 2022-2023 rally crossing at 14,789.53 is the next downside target. Closes above the 20-day moving average crossing at 15,457.70 would temper the near-term bearish outlook. First resistance is the 50-day moving average crossing at 15,321.73. Second resistance is the 20-day moving average crossing at 15,457.70. First support is the 25% retracement level of the 2022-2023 rally crossing at 14,789.53. Second support is the June 8th low crossing at 14,425.00.
The September S&P 500 was steady to slightly higher overnight and sets the stage for a slightly higher opening when the day session begins trading. Stochastics and the RSI are oversold but remain neutral to bearish signaling that sideways to lower prices are possible near-term. If September extends the decline off July's high, July's low crossing at 4411.25 is the next downside target. Closes above the 20-day moving average crossing at 4538.65 would temper the bearish outlook. First resistance is the 20-day moving average crossing at 4538.65. Second resistance is July's high crossing at 4634.50. First support is July's low crossing at 4411.25. Second support is the June 26th low crossing at 4368.50.
INTEREST RATES http://quotes.ino.com/ex changes/?c=interest"
INTEREST RATES: September T-bonds were higher overnight as it consolidates some of the decline off last-Thursday's high. Overnight trading sets the stage for a higher opening when the day session begins trading. Stochastics and the RSI are oversold, diverging but remain neutral to bearish signaling that sideways to lower prices are possible near-term. If September extends the decline off July's high, the October-2022 low on the weekly continuation chart crossing at 117-19 is the next downside target.Closes above the 20-day moving average crossing at 123-01 would signal that a low has been posted. First resistance is the 20-day moving average crossing at 123-01. Second resistance is the 50-day moving average crossing at 125-08. First support is Tuesday's low crossing at 119-14. Second support is the October-2022 low on the weekly continuation chart crossing at 117-19.
September T-notes were higher overnight and sets the stage for a higher opening when the day session begins trading. Stochastics and the RSI are oversold, diverging and are turning neutral to bullish signaling that sideways to higher prices are possible near-term. Closes above the 50-day moving average crossing at 112.005 would signal that a short-term low has been posted. If September extends the decline off July's high, the October-2022 low crossing at 108.265 is the next downside target. First resistance is the 10-day moving average crossing at 110.198. Second resistance is the 20-day moving average crossing at 111.029. First support is Tuesday's low crossing at 109.115. Second support is the October-2022 low on the weekly continuation chart crossing at 108.265.
ENERGY MARKETS? http://quotes.ino.com/ex?changes/?c=energy ""
ENERGIES:Octobercrude oil was lower in late-overnight trading as it extends the decline off last-Thursday's high. Overnight trading sets the stage for a steady to lower opening when the day session begins trading. Stochastics and the RSI are bearish signaling that sideways to lower prices are possible near-term. Closes below the 20-day moving average crossing at $80.39 would signal that a short-term top has been posted. If October extends the rally off the June 28th low, the 75% retracement level of the 2022-2023 decline crossing at $87.70 is the next upside target. First resistance is last-Thursday's high crossing at $84.16. Second resistance is the 75% retracement level of the 2022-2023 decline crossing at $87.70. First support is the 20-day moving average crossing at $80.39. Second support is the August 3rd low crossing at $78.33.
October heating oil was steady to slightly higher overnight and sets the stage for a slightly higher opening when the day session begins trading. Stochastics and the RSI are bearish signaling that sideways to lower prices are possible near-term. Closes below the 20-day moving average crossing at 2.9518 would signal that a short-term top has been posted. If October renews the rally off May's low, the June-2022 crossing at 3.2100 is the next upside target. First resistance is last-Thursday's high crossing at 3.1928. Second resistance is the June-2022 high crossing at 3.2100. First support is the 20-day moving average crossing at 2.9518. Second support is last-Tuesday's low crossing at 2.9174.
October unleaded gas was slightly lower overnight and sets the stage for a slightly lower opening when the day session begins trading. Stochastics and the RSI are bearish signaling that sideways to lower prices are possible near-term. Closes below the 20-day moving average crossing at 2.5882 would signal that a short-term top has been posted while opening the door for a test of the August 3rd low crossing at 2.4847. If October renews the rally off the June 23rd low, the October-2022 high on the weekly continuation chart crossing at 3.0221 is the next upside target. First resistance is last-Friday's high crossing at $2.7209. Second resistance is the October-2022 high on the weekly continuation chartcrossing at $3.0221. First support is the 20-day moving average crossing at $2.5882. Second support is August 3rd low crossing at $2.4847.
October natural gas was slightly lower overnight as it extends the decline off last-Wednesday's high. Overnight trading sets the stage for a slightly lower opening when the day session begins trading. Stochastics and the RSI are neutral to bearish signaling that sideways to lower prices are possible near-term. Closes below the 50-day moving average crossing at 2.733 would signal that a short-term top has been posted. If September resumes the rally off August's low, the 25% retracement level of the 2022-2023 decline crossing at 3.193 is the next upside target. First resistance is last-Wednesday's high crossing at 3.018. Second resistance is the 25% retracement level of the 2022-2023 decline crossing at 3.301. First support is the 50-day moving average crossing at 2.733. Second support is August's low crossing at 2.570.
CURRENCIEShttp://quotes.ino.com/ex changes/?c=currencies"
CURRENCIES:The September Dollar was steady to slightly lower overnight as it consolidates some of the rally off July's low. Overnight weakness sets the stage for a slightly lower opening when the day session begins trading later this morning. Stochastics and the RSI are overbought but remain neutral to bullish signaling that sideways to higher prices are possible near-term. If September extends the rally off July's low, May's high crossing at $104.205 is the next upside target. Closes below last-Thursday's low crossing at $101.600 would signal that a short-term top has been posted. First resistance is July's high crossing at $103.275. Second resistance is May's high crossing at $104.205. First support is last-Thursday's low crossing at $101.600. Second support is the July 27th low crossing at $100.320.
The September Euro was slightly higher overnight as it consolidates some of the decline off last-Thursday's high. Overnight trading sets the stage for a slightly higher opening when the day session begins trading. Stochastics and the RSI are oversold but remain neutral to bearish signaling that sideways to lower prices are possible near-term. If September extends the decline off July's high, July's low crossing at 1.08715 is the next downside target. Closes above the 20-day moving average crossing at $1.10213 would signal that a short-term low has been posted. First resistance is last-Thursday's high crossing at $1.10850. Second resistance is the July 27th high crossing at $1.11770. First support is July's low crossing at 1.08715. Second support is May's low crossing at 1.07025.
The September British Pound was slightly higher overnight and sets the stage for a slightly higher opening when the day session begins trading. Stochastics and the RSI are diverging and are turning bullish signaling that sideways to higher prices near-term. Closes above last-Thursday's high crossing at 1.2822 would confirm that a short-term low has been posted. If September renews the decline off July's high, the 50% retracement level of the March-July rally crossing at 1.2508 is the next downside target. First resistance last-Thursday's high crossing at 1.2822. Second resistance is the July 27th high crossing at 1.2999. First support is the 38% retracement level of the March-July rally crossing at 1.2658. Second support is the 50% retracement level of the March-July rally crossing at 1.2508.
The September Swiss Franc was steady to slightly lower overnight as it extends the trading range of the past three-weeks. Overnight trading sets the stage for a slightly lower opening when the day session begins trading. Stochastics and the RSI are oversold but remain neutral to bearish signaling that sideways to lower prices are possible near-term. Closes below Monday's low crossing at 1.13700 would open the door for a possible test of the June 30th low crossing at 1.11790. Closes above the 20-day moving average crossing at 1.15156 would signal that a short-term low has been posted. First resistance is the 20-day moving average crossing at 1.15156. Second resistance is the July 18th high crossing at 1.17650. First support is Monday's low crossing at 1.13700. Second support is the June 30th low crossing at 1.11790.
The September Canadian Dollar was steady to slightly lower overnight and sets the stage for a slightly lower opening when the day session begins trading. Stochastics and the RSI are oversold but remain neutral to bearish signaling that sideways to lower prices are possible near-term. If September extends the decline off July's high, the 62% retracement level of the March-July rally crossing at $74.01 is the next downside target. Closes above the 20-day moving average crossing at $75.11 would signal that a short-term low has been posted. First resistance is the 10-day moving average crossing at $74.52. Second resistance is the 20-day moving average crossing at $75.11. First support is the 62% retracement level of the March-July rally crossing at $74.01. Second support is the 75% retracement level of the March-July rally crossing at crossing at $73.49.
The September Japanese Yen was steady to slightly lower overnight as it extends this year's decline. Overnight trading sets the stage for a slightly lower opening when the day session begins trading. Stochastics and the RSI are oversold and remain neutral to bearish signaling that sideways to lower prices are possible near-term. If September extends the decline off the July 14th high, the October-2022 low on the weekly continuation chart crossing at 0.066235 is the next downside target. Closes above the 20-day moving average crossing at 0.070577 would signal that a short-term low has been posted. First resistance is the 10-day moving average crossing at 0.069838. Second resistance is the 20-day moving average crossing at 0.070577. First support is Tuesday's low crossing at 0.068920. Second support is the October-2022 low on the weekly continuation chart crossing at 0.066235.
PRECIOUS METALS http://quotes.ino.com/ex changes/?c=metals"
Precious Metals: December gold was slightly higher overnight as it consolidates some of the decline off May's high. Overnight strength sets the stage for a slightly higher opening when the day session begins trading later this morning. Stochastics and the RSI are oversold but remain neutral to bearish signaling that sideways to lower prices are possible near-term. If October extends the decline off July's high, the 50% retracement level of the 2022-2023 rally crossing at $1919.90 is the next downside target. Closes above the 50-day moving average crossing at $1983.30 would confirm that a short-term low has been posted. First resistance is the 10-day moving average crossing at $1953.70. Second resistance is the 20-day moving average crossing at $1975.70. First support is Tuesday's low crossing at $1927.50. Second support is the 50% retracement level of the 2022-2023 rally crossing at $1919.90.
September silver was steady to slightly higher overnight as it consolidates some of the decline off July's high. Overnight trading sets the stage for a slightly higher opening when the day session begins trading later this morning. Stochastics and the RSI are oversold but remain neutral to bearish signaling that sideways to lower prices are possible near-term. If September extends the decline off July's high, the 62% retracement level of the 2022-2023 rally crossing at $21.452 is the next downside target. Closes above the 20-day moving average crossing at $23.805 would signal that a short-term low has been posted. First resistance is the 10-day moving average crossing at $22.987. Second resistance is the 50-day moving average crossing at $23.805. First support is the 50% retracement level of the 2022-2023 rally crossing at $22.450. Second support is the 62% retracement level of the 2022-2023 rally crossing at $21.452.
September copper was slightly lower overnight as it extends the decline off August's high. Overnight trading sets the stage for a slightly lower opening when the day session begins trading. Stochastics and the RSI are oversold but remain neutral to bearish signaling that sideways to lower prices are possible near-term. If September extends this month's decline, May's low crossing at 3.5650 is the next downside target. Closes below the 20-day moving average crossing at 3.8291 would signal that a short-term low has been posted. First resistance is the 20-day moving average crossing at 3.8291. Second resistance is the August 4th high crossing at 3.9280. First support is the overnight low crossing at 3.6455. Second support is May's low crossing at 3.5650.
GRAINS http://quotes.ino.com/ex changes/?c=grains
Grains: December corn was higher overnight as it consolidates some of the decline off July's high. The corn market is now trading at its lowest level since December-2020 as the US is racing towards harvest. Overnight trading sets the stage for a higher opening when the day sessions begins trading. Stochastics and the RSI are oversold but remain bearish signaling that sideways to lower prices are possible near-term. If December extends the decline off July's high, the 62% retracement level of the 2020-2022 rally crossing at $4.50 3/4 is the next downside target. Closes above the 20-day moving average crossing at $5.13 would signal that a short-term low has been posted. First resistance is the 20-day moving average crossing at $5.13. Second resistance is the 50-day moving average crossing at $5.28 3/4. First support is the overnight low crossing at $4.73 1/2. Second support is the 62% retracement level of the 2020-2022 rally crossing at $4.50 3/4.
December wheat was higher overnight as it consolidates some of the decline off July's high. Overnight trading sets the stage for a higher opening when the day session begins trading. Stochastics and the RSI are oversold but remain neutral to bearish signaling that sideways to lower prices are possible near-term. If December extends the decline off July's high, May's low crossing at $6.08 1/4 is the next downside target. Closes above the 20-day moving average crossing at $6.90 3/4 would signal that a short-term low has been posted. First resistance is the 10-day moving average crossing at $6.55 3/4. Second resistance is the 20-day moving average crossing at $6.90 3/4. First support is the overnight low crossing at $6.17 1/4. Second support is May's low crossing at $6.08 1/4.
December Kansas City wheat was slightly higher overnight and sets the stage for a slightly higher opening when the day session begins trading later this morning. Stochastics and the RSI are oversold but remain neutral to bearish signaling that sideways to lower prices are possible near-term. If December extends the decline off July's high, May's low crossing at $7.36 is the next downside target. Closes above last-Tuesday's high crossing at $7.89 1/4 would signal that a short-term low has been posted. First resistance is last-Tuesday's high crossing at $7.89 1/4. Second resistance is the 50-day moving average crossing at $8.20 1/2. First support is the overnight low crossing at $7.40 1/2. Second support is May's low crossing at $7.36.
December Minneapolis wheat was higher overnight as it consolidates some of the decline off July's low. Overnight trading sets the stage for a higher opening when the day session begins trading. Stochastics and the RSI are oversold but remain neutral to bearish signaling that sideways to lower prices are possible near-term. If December extends the decline off July's high, the May 31st low crossing at $7.85 3/4 is the next downside target. Closes above the 20-day moving average crossing at $8.66 1/4 would signal that a low has been posted. First resistance is the 10-day moving average crossing at $8.30. Second resistance is the 50-day moving average crossing at $8.57 3/4. First support is the June 8th low crossing at $7.98 1/4. Second support is the May 31st low crossing at $7.85 3/4.
SOYBEAN COMPLEX? http://quotes.ino.com/ex?changes/?c=grains "
November soybeans was higher overnight and sets the stage for a higher opening when the day session begins trading later this morning. Stochastics and the RSI are turning neutral to bullish signaling that sideways to higher prices are possible near-term. Closes above the 20-day moving average crossing at $13.49 1/2 would signal that a low has been posted. If November renews the decline off July's high, the 62% retracement level of the May-July rally crossing at $12.46 3/4 is the next downside target. First resistance is the 20-day moving average crossing at $13.49 1/2. Second resistance is the July 31st gap crossing at $13.79. First support is the 50% retracement level of the May-July rally crossing at $12.82 3/4. Second support is the June 28th low crossing at $12.56 3/4.
December soybean meal was slightly higher overnight as it consolidates some of Tuesday's sharp decline, which marked a downside breakout of three-week old trading range.. Overnight trading sets the stage for a steady to slightly higher opening when the day session begins trading. Stochastics and the RSI are oversold but remain neutral to bearish signaling that sideways to lower prices are possible near-term. If December extends the decline off July's high, the June 29th low crossing at $374.60 is the next downside target. Closes above the 20-day moving average crossing at $399.10 would temper the bearish outlook. First resistance is the 50-day moving average crossing at $394.70. Second resistance is the 20-day moving average crossing at $399.10. First support is the June 29th low crossing at $374.60. Second support is the May 31st low crossing at $361.80.
December soybean oil was higher in overnight trading as it extends the rally off last-Tuesday's low. Overnight trading sets the stage for a higher opening when the day session begins trading. Stochastics and the RSI are bullish signaling that sideways to higher prices are possible near-term. If December extends the aforementioned rally, July's high crossing at 65.58 is the next upside target. Closes below the 50-day moving average crossing at 58.63 would signal that a short-term top has been posted. First resistance is the overnight high crossing at 62.84. Second resistance is July's high crossing at 65.58. First support is the 50-day moving average crossing at 58.63. Second support is the August 8th low crossing at 57.86.
Thanks, tallpine!
Beans help support with yesterdays sell off and still have a contructive technical look on the charts with this being a potential bull flag.
Depends on what the funds decide to do today but the weather is still bullish.
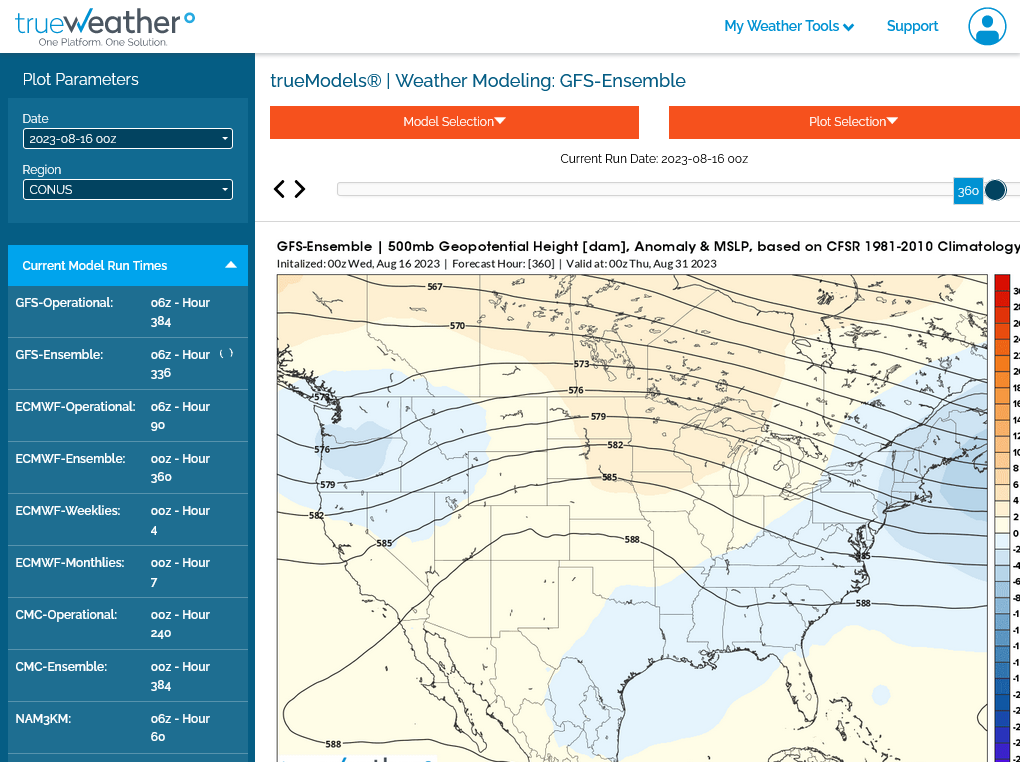
Last 6z GEFS, just out.
1. Extension of ridging across the Midwest
2. Not much rain
All the weather:
https://www.marketforum.com/forum/topic/83844/
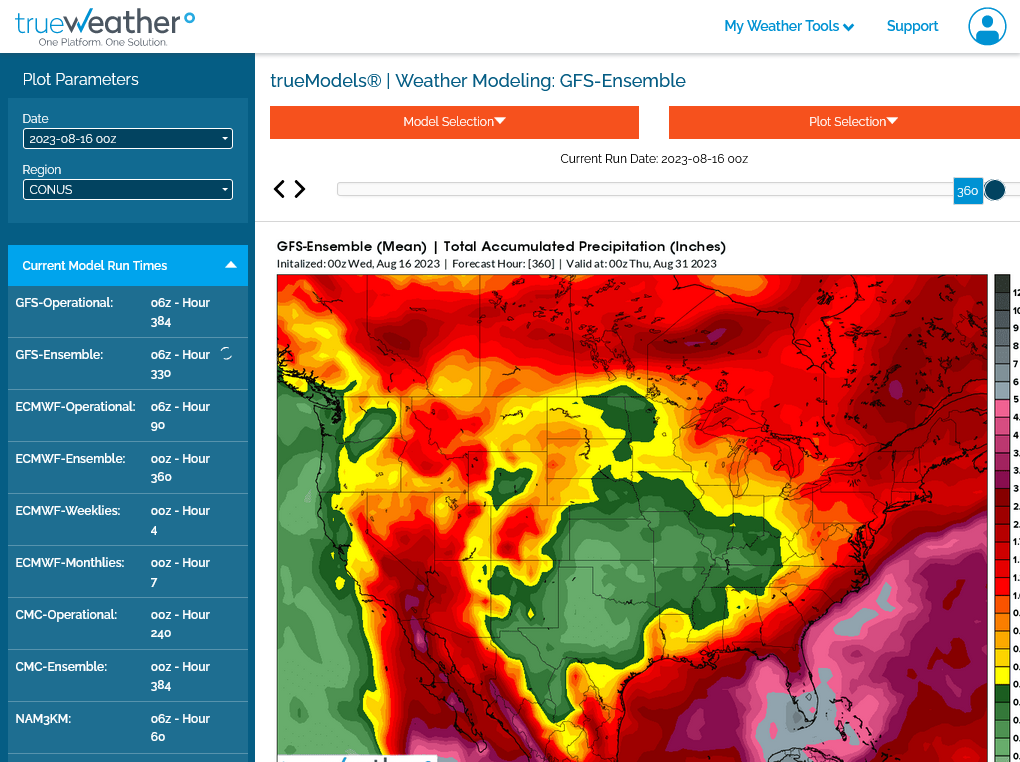
Somr Rains in the Great Lakes area below but dry everywhere else in the Cornbelt the next week.
7 Day Total precipitation below:
http://www.wpc.ncep.noaa.govcdx /qpf/p168i.gif?1530796126

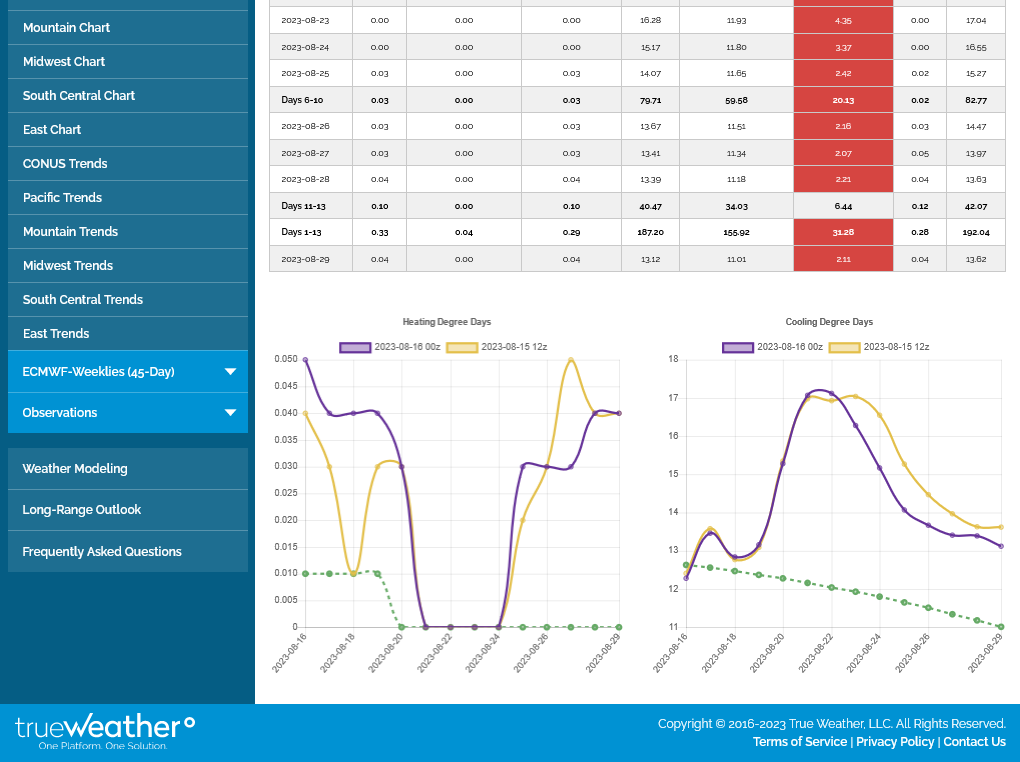
0z European model a whopping -5 CDDs overnight! All in week 2. Bearish! Bottom/right purple line.
Beans reversing all of yesterdays losses.
Here's the just out 12z Canadian model.
The bullish pattern weakens near the end of the month, which could turn back wetter.
This is the start of September below. We don't usually get much weather trading in C and S during September, unless there's an early freeze threat, which has been reduced from global warming.
384h GZ 500 forecast valid on Sep 01, 2023 12 UTC


Forecasts for the control (GEM 0) and the 20 ensemble members (global model not available)