Last week's crop conditions:
https://www.marketforum.com/forum/topic/98882/
++++++++++++
Early harvest weather for corn and beans is good this week.
Zero chance for an early freeze in September.
Freeze dates in the Midwest
Started by metmike - Aug. 22, 2023, 9:26 p.m.
https://www.marketforum.com/forum/topic/98473/
++++++++++++++++
The pattern change coming up next week will help the Winter Wheat crop to become better established before going dormant late Nov/early Dec.
This should also help to provide some runoff to the Mississippi River basin that helps the river to rebound from extremely low levels, which will be good for barge traffic(to transport grains south to the Gulf Coastal ports).
All the weather here:

https://water.weather.gov/ahps2/hydrograph.php?gage=memt1&wfo=meg
Weather Forecast Office Memphis, TN
Lower Mississippi River Forecast Center
| Hydrograph | River at a Glance | Download |
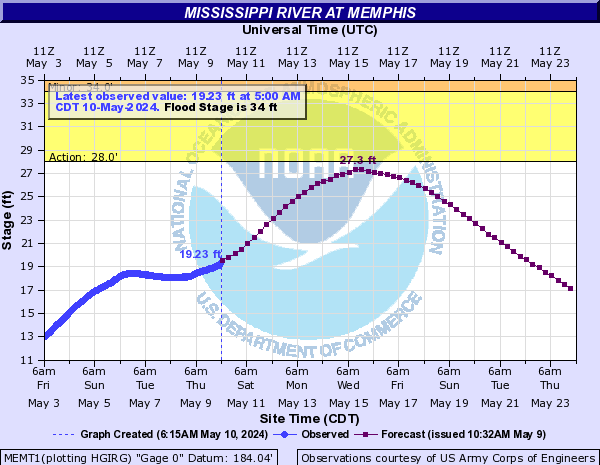 +++++++++++++++++++++ We remember how low the levels got last year: Mississippi River record-low water levels ease some, but long-term forecast is dryhttps://yaleclimateconnections.org/2022/10/mississippi-river-record-low-water-levels-ease-some-but-long-term-forecast-is-dry/ |
The latest 7 day precip forecasts are below.
Day 1 below:
http://www.wpc.ncep.noaa.gov/qpf/fill_94qwbg.gif?1526306199054

Day 2 below:
http://www.wpc.ncep.noaa.gov/qpf/fill_98qwbg.gif?1528293750112

Day 3 below:
http://www.wpc.ncep.noaa.gov/qpf/fill_99qwbg.gif?1528293842764

Days 4-5 below:
http://www.wpc.ncep.noaa.gov/qpf/95ep48iwbg_fill.gif?1526306162

Days 6-7 below:
http://www.wpc.ncep.noaa.gov/qpf/97ep48iwbg_fill.gif?1526306162

7 Day Total precipitation below:
http://www.wpc.ncep.noaa.govcdx /qpf/p168i.gif?1530796126

Extended weather.
https://www.cpc.ncep.noaa.gov/products/predictions/610day/ | ||||||||
| 6 to 10 day outlooks | ||||||||
| Click below for information about how to read 6-10 day outlook maps Temperature Precipitation | ||||||||
| Click below for archives of past outlooks (data & graphics), historical analogs to todays forecast, and other formats of the 6-10 day outlooks ArchivesAnalogsLines-Only FormatGIS Data | ||||||||
Temperature Probability | ||||||||
Precipitation Probability | ||||||||
Soilmoisture anomaly:
These maps sometimes take a day to catch up to incorporate the latest data(the bottom map is only updated once a week).
https://www.cpc.ncep.noaa.gov/products/Soilmst_Monitoring/US/Soilmst/Soilmst.shtml#
![]()


++++++++++++++++++++++++++++
Updated daily below:
https://mrcc.purdue.edu/cliwatch/watch.htm#curMonths

DROUGHT MONITOR
https://droughtmonitor.unl.edu/
Last week, September 12, 2023 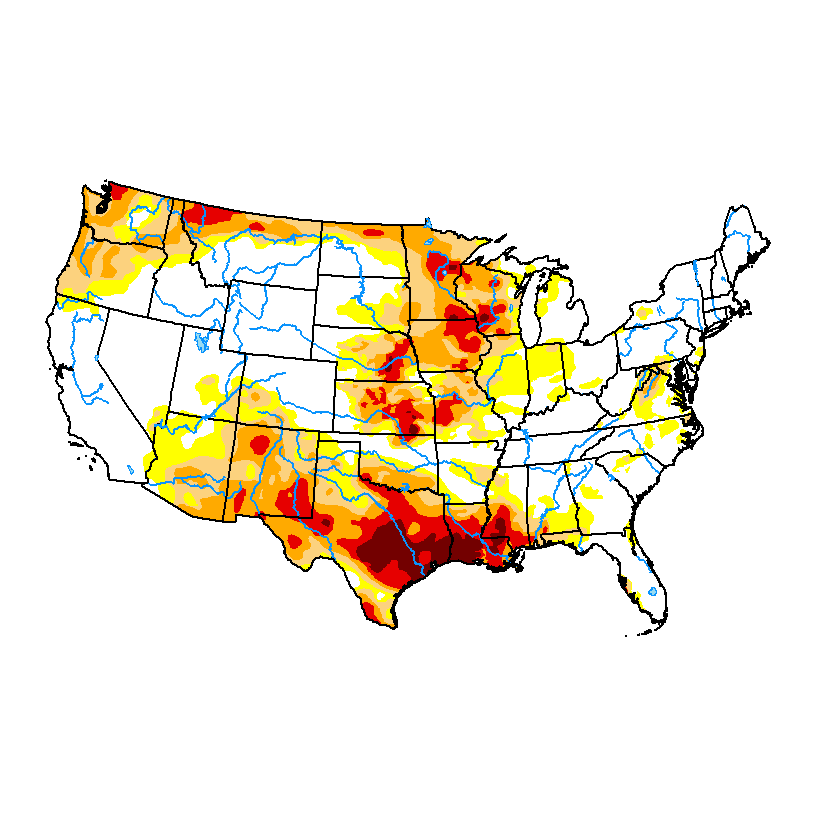
DROUGHT MONITOR NOVEMBER 1, 2022
The severe drought in the Southwest to N. Plains was wiped out this year from the El Nino.
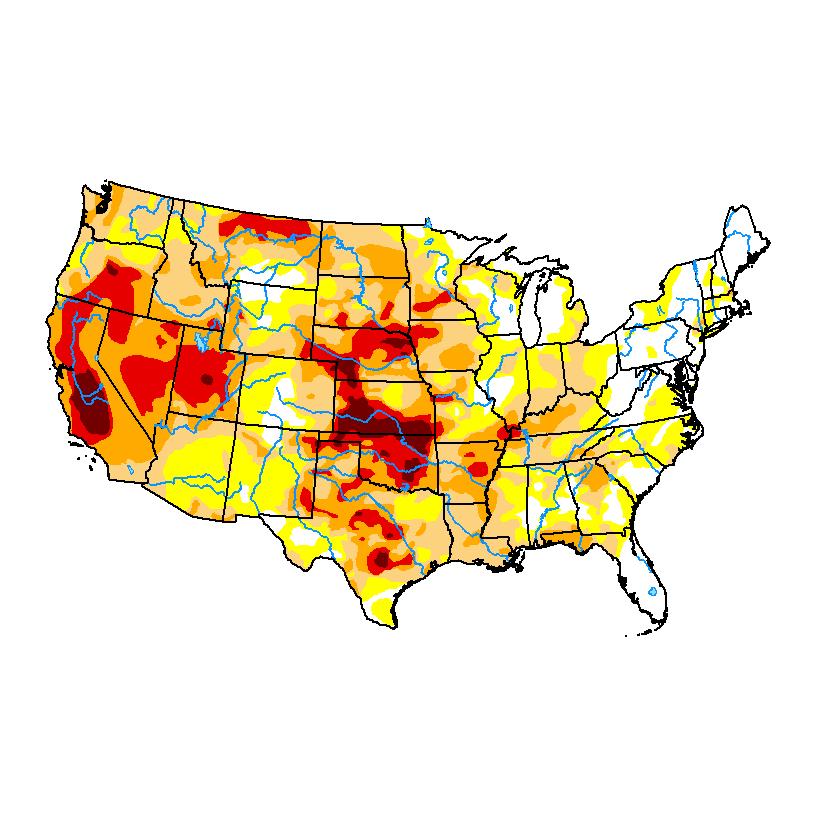
Drought monitor previous years: You can see the natural La Niña, (cold water-in the tropical Pacific)causing the drought! Starting in 2020, then worsening for 2+ years!
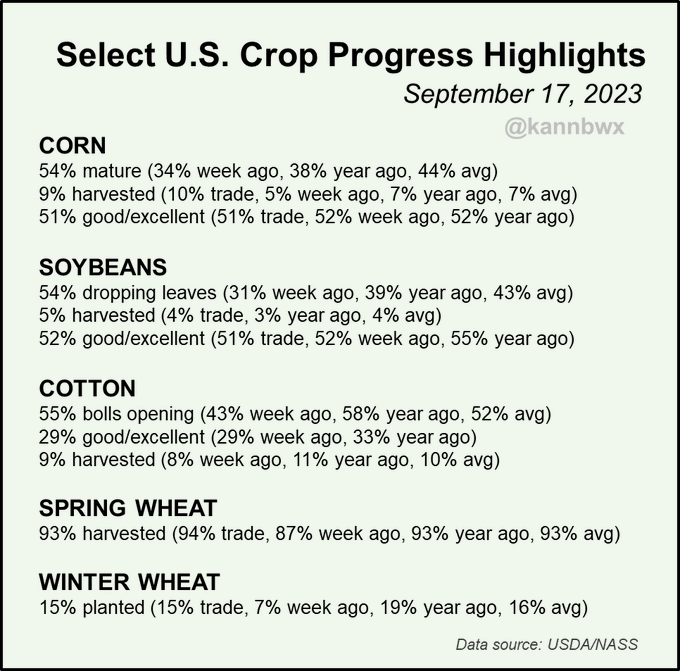
Here's the complete USDA report. Nothing significant.
https://release.nass.usda.gov/reports/prog3723.txt
U.S. #corn and #soybeans are maturing faster than normal, though harvest is still in the early stages. Spring #wheat harvest is nearly wrapped up and winter wheat is 15% planted.
https://www.marketforum.com/forum/topic/99082/
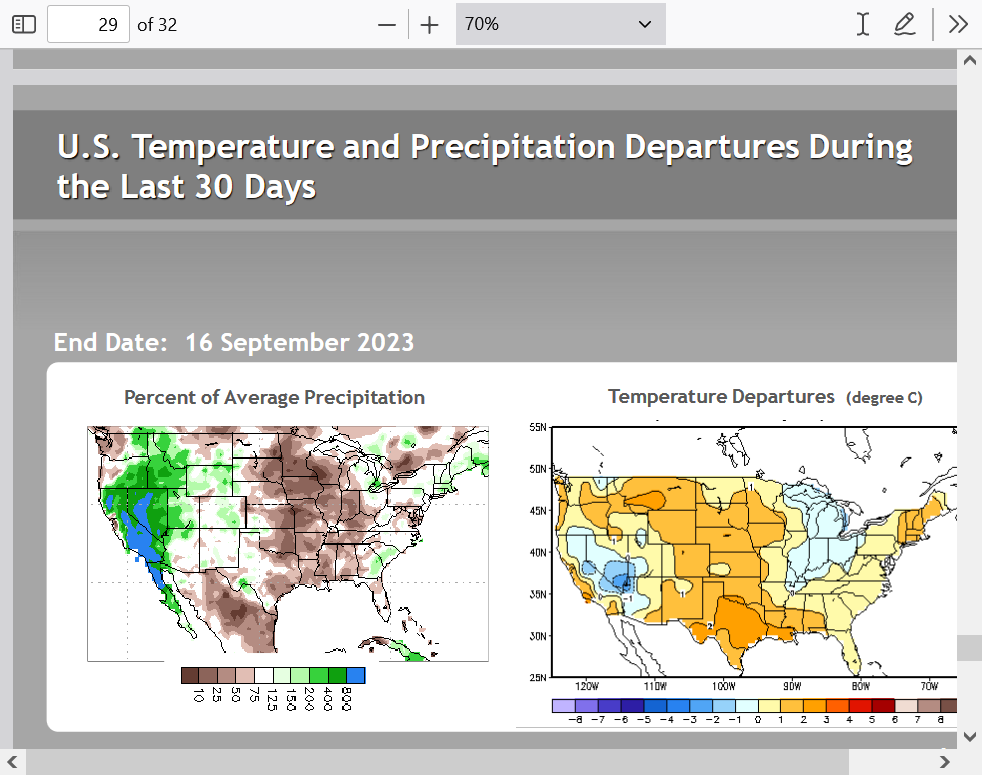
I included this last graphic from the NOAA El Nino discussion to show how dry it's been in the Midwest the past month.
Here in Southwest IN, our last rain was 29 days ago at 1.5 inches and was sort of a lucky fluke. Missing that one would have meant 6 weeks since the last rain!


