KEY EVENTS TO WATCH FOR:
Tuesday, July 18, 2023
8:30 AM ET. June Advance Monthly Sales for Retail & Food Services
Overall Sales-SA, M/M% (expected +0.5%; previous +0.3%)
Sales, Ex-Auto, M/M% (expected +0.3%; previous +0.1%)
Sales, Ex-Auto & Gas, M/M% (previous +0.4%)
8:55 AM ET. Johnson Redbook Retail Sales Index
Ret Sales Mo-to-Date, Y/Y% (previous -0.4%)
Latest Wk, Y/Y% (previous -0.4%)
9:15 AM ET. June Industrial Production & Capacity Utilization
Industrial Production, M/M% (expected +0.0%; previous -0.2%)
Capacity Utilization % (expected 79.5%; previous 79.6%)
Capacity Utilization, Net Chg (Pts.) (previous -0.2)
10:00 AM ET. July NAHB Housing Market Index
Housing Mkt Idx (expected 56; previous 55)
10:00 AM ET. May Manufacturing & Trade: Inventories & Sales
Total Inventories (expected +0.2%; previous +0.2%)
4:00 PM ET. May Treasury International Capital Data
4:30 PM ET. API Weekly Statistical Bulletin
Crude Stocks, Net Chg (Bbls) (previous +3.0M)
Gasoline Stocks, Net Chg (Bbls) (previous +1.0M)
Distillate Stocks, Net Chg (Bbls) (previous +2.9M)
Wednesday, July 19, 2023
7:00 AM ET. MBA Weekly Mortgage Applications Survey
Composite Idx (previous 208.4)
Composite Idx, W/W% (previous +0.9%)
Purchase Idx-SA (previous 165.3)
Purchase Idx-SA, W/W% (previous +1.8%)
Refinance Idx (previous 416)
Refinance Idx, W/W% (previous -1.3%)
8:30 AM ET. June New Residential Construction - Housing Starts and Building Permits
Total Starts (expected 1.48M; previous 1.631M)
Housing Starts, M/M% (expected -9.3%; previous +21.7%)
Building Permits (expected 1.48M; previous 1.491M)
Building Permits, M/M% (expected -0.7%; previous +5.2%)
10:30 AM ET. EIA Weekly Petroleum Status Report
Crude Oil Stocks (Bbl) (previous 458.128M)
Crude Oil Stocks, Net Chg (Bbl) (previous +5.946M)
Gasoline Stocks (Bbl) (previous 219.452M)
Gasoline Stocks, Net Chg (Bbl) (previous -0.004M)
Distillate Stocks (Bbl) (previous 118.181M)
Distillate Stocks, Net Chg (Bbl) (previous +4.815M)
Refinery Usage (previous 93.7%)
Total Prod Supplied (Bbl/day) (previous 18.701M)
Total Prod Supplied, Net Chg (Bbl/day) (previous -2.534M)
The STOCK INDEXES? http://quotes.ino.com/ex?changes/?c=indexes
The Dow closed higher on Monday as it extends the rally off last-Monday's low. The high-range close sets the stage for a steady to higher opening when Tuesday's day session begins trading. Stochastics and the RSI are overbought but remain neutral to bullish signaling that sideways to higher prices are possible near-term. If the Dow extends the rally off last-Monday's low, the December-2022 high crossing at 34,712.28 is the next upside target. Closes below the 20-day moving average crossing at 34,119.85 would signal that a short-term top has been posted. First resistance is June's high crossing at 34,588.68. Second resistance is the December-2022 high crossing at 34,712.28. First support is the 20-day moving average crossing at 34,119.85. Second support is the 50-day moving average crossing at 33,724.39.
The September NASDAQ 100 closed higher on Monday as it extends this year's rally. The high-range close sets the stage for a steady to higher opening when Tuesday's night session begins trading. Stochastics and the RSI are overbought but remain neutral to bullish signaling sideways to higher prices are possible. If September extends this year's rally, the 87% retracement level of the 2021-2022-decline on the weekly continuation chart crossing at 15,957.86 is the next upside target. Closes below last-Monday's low crossing at 15,063.25 would signal that a short-term top has been posted. First resistance is today's high crossing at 15,882.75. Second resistance is the 87% retracement level of the 2020-2022-decline on the weekly continuation chart crossing at 15,957.86. First support is last-Monday's low crossing at 15,063.25. Second support is the June 26th low crossing at 14,853.50.
The September S&P 500 closed higher on Monday as it extends this year's rally. The high-range close sets the stage for a steady to higher opening when Tuesday's night session begins trading. Stochastics and the RSI are overbought but remain neutral to bullish signaling that sideways to higher prices are possible near-term. If September extends the rally off March's low, the 87% retracement level of the 2022 decline on the weekly chart crossing at 4639.07 is the next upside target. Closes below last-Monday's low crossing at 4411.25 would signal that a short-term top has been posted. First resistance is today's high crossing at 4565.75. Second resistance is the 87% retracement level of the 2022 decline on the weekly chart crossing at 4639.07. First support is last-Monday's low crossing at 4411.25. Second support is the June 26th low crossing at 4368.50.
INTEREST RATES? http://quotes.ino.com/ex?changes/?c=interest ""
September T-bonds closed up 2/32's at 126-12.
September T-bonds closed slightly higher on Friday. The mid-range close sets the stage for a steady to higher opening when Tuesday's day session begins trading. Stochastics and the RSI remain neutral to bullish signaling that sideways to higher prices are possible near-term. If September extends the rally off last-Monday's low, the 50-day moving average crossing at 127-19 is the next upside target. If September renews the decline off April's high, the March 22nd low on the weekly continuation chart crossing at 122-22 is the next downside target. First resistance is the 50-day moving average crossing at 127-19. Second resistance is the June 26th high crossing at 128-22. First support is the 10-day moving average crossing at 125-12. Second support is last-Monday's low crossing at 122-30.
September T-notes closed up 20-pts. at 112.200.
September T-notes closed slightly higher on Monday. The mid-range close sets the stage for a steady to higher opening when Tuesday's day session begins trading. Stochastics and the RSI are neutral to bullish signaling that sideways to higher prices are possible near-term. If September extends the rally off the July 6th low, the 50-day moving average crossing at 113.229 would signal that a short-term low has been posted. Closes below the 10-day moving average crossing at 111.241 would signal that a short-term top has been posted. First resistance is the 50-day moving average crossing at 113.229. Second resistance is June's high crossing at 115.000. First support is the 10-day moving average crossing at 111.241. Second support is July's low crossing at 110.050.
ENERGY MARKETS? http://quotes.ino.com/ex?changes/?c=energy ""
August crude oil closed lower due to profit taking on Monday as it consolidates some of the rally off the June 28th low. The low-range close sets the stage for a steady to lower opening when Tuesday's day session begins. Stochastics and the RSI are overbought and are turning neutral to bearish signaling that sideways to lower prices are possible near-term. If August extends the aforementioned rally, the 75% retracement level of the April-May decline crossing at $77.85 is the next upside target. Closes below the 20-day moving average crossing at $71.94 would signal that a short-term top has been posted. First resistance is last-Thursday's high crossing at $77.33. Second resistance is the the 75% retracement level of the April-May decline crossing at $77.85. First support is the 20-day moving average crossing at $71.94. Second support is the June 12thlow crossing at $66.96.
September heating oil closed lower on Monday as it consolidates some of this month's rally. The low-range close sets the stage for a steady to lower opening when Tuesday's day trading session begins. Stochastics and the RSI are overbought but are neutral to bullish signaling that sideways to higher prices are possible near-term. If September extends the rally off May's low, April's high crossing at 2.6618 is the next upside target. Closes below the 20-day moving average crossing at 2.4750 would signal that a short-term top has been posted. First resistance is April's high crossing at 2.6618. Second resistance is the 50% retracement level of the 2022-2023 decline crossing at 2.7273. First support is the 20-day moving average crossing at 2.4750. Second support the 50-day moving average crossing at 2.4046.
September unleaded gas closed lower on Monday as it consolidated some of the rally off May's low. The low-range close sets the stage for a steady to lower opening when Tuesday's day session begins trading. Stochastics and the RSI are overbought but remain neutral to bullish signaling that sideways to higher prices are possible near-term. If September extends the rally off the June 23rd low, April's high crossing at 2.6388 is the next upside target. Closes below the 20-day moving average crossing at 2.4704 would confirm that a short-term top has been posted. First resistance is last-Thursday's high crossing at 2.6211. Second resistance is April's high crossing at 2.6388. First support is the 10-day moving average crossing at 2.5208. Second support is the 20-day moving average crossing at 2.4705.
September Henry natural gas closed lower on Monday and below the 50-day moving average crossing at 2.553 opening the door for a possible test of June's low crossing at 2.249. The low-range close sets the stage for a steady to lower opening when Tuesday's day session begins trading. Stochastics and the RSI are oversold but remain neutral to bearish signaling that sideways to lower prices are possible near-term.If September resumes the rally off June's low, the 25% retracement level of the 2022-2023 decline crossing at 3.193 is the next upside target.First resistance is the June high crossing at 2.911. Second resistance is the 25% retracement level of the 2022-2023 decline crossing at 3.193. First support is today's low crossing at 2.477. Second support is the June 1st low crossing at 2.249.
CURRENCIES? http://quotes.ino.com/ex?changes/?c=currencies ""
The September Dollar closed lower on Monday. The low-range close sets the stage for a steady to lower opening when Tuesday's session begins trading. Stochastics and the RSI are oversold but remain neutral to bearish signaling that sideways to lower prices are possible near-term. If September extends the decline off July's high, weekly support on the weekly continuation chart crossing at 97.73 is the next downside target. Closes above the 20-day moving average crossing at 101.798 would signal that a short-term low has been posted. First resistance is the 10-day moving average crossing at 101.236. Second resistance is the 20-day moving average crossing at 101.798. First support is last-Friday's low crossing at 99.260. Second support is weekly support on the continuation chart crossing at 97.73.
The September Euro closed slightly higher on Monday as it extends the rally off May's low. The high-range close sets the stage for a steady to higher opening when Tuesday's day session begins trading. Stochastics and the RSI are overbought bur remain neutral to bullish signaling that sideways to higher prices are possible near-term. If September extends the rally off July's low, the March 30th high crossing at 1.15190 is the next upside target. Closes below the 20-day moving average crossing at $1.10285 would signal that a short-term top has been posted. First resistance is today's high crossing at $1.12390. Second resistance is the March 30th high crossing at 1.15190. First support is the 10-day moving average crossing at 1.10828. Second support is the 20-day moving average crossing at $1.10285.
The September British Pound closed slightly lower on Monday as it consolidated some of this month's rally. The mid-range close sets the stage for a steady to lower opening when Tuesday's day session begins trading. Stochastics and the RSI are overbought but remain neutral to bullish signaling sideways to higher prices are possible near-term. If September extends the rally off May's low, the 75% retracement level of the 2022-2023 decline crossing at 1.3253 is the next upside target. Closes below the 20-day moving average crossing at 1.2820 would signal that a short-term top has been posted. First resistance is last-Friday's high crossing at 1.3146. Second resistance is the 75% retracement level of the 2022-2023 decline crossing at 1.3253. First support is the 10-day moving average crossing at 1.2909. Second support is the 20-day moving average crossing at 1.2820.
The September Swiss Franc closed slightly higher on Monday. The mid-range close sets the stage for a steady to higher opening when Tuesday's day session begins trading. Stochastics and the RSI are overbought but remain neutral to bullish signaling that sideways to higher prices are possible near-term. If September extends the rally off May's low, the January 2019 high crossing at 1.18680 is the next upside target. Closes below the 20-day moving average crossing at 1.13613 would signal that a short-term top has been posted. First resistance is last-Friday's high crossing at 1.17535. Second resistance is the January 2019 high crossing at 1.18680. First support is the 10-day moving average crossing at 1.14593. Second support is the 20-day moving average crossing at 1.13613.
The September Canadian Dollar closed higher on Monday. The high-range close sets the stage for a steady to higher opening when Tuesday's day session begins trading. Stochastics and the RSI are diverging and are turning neutral to bearish signaling that sideways to lower prices are possible near-term. Closes below the 10-day moving average crossing at 75.62 would signal that a short-term top has been posted. If September extends the rally off the January 7th low, the September 12th 2022 high crossing at 77.11 is the next upside target. First resistance is the 38% retracement level of the 2021-2022 decline crossing at 76.28. Second resistance is the September 12th high crossing at 77.11. First support is the 10-day moving average crossing at 75.62. Second support is the 50-day moving average crossing at 75.01.
The September Japanese Yen closed slightly higher on Monday. The mid-range close sets the stage for a steady to slightly higher opening when Tuesday’s day session begins trading. Stochastics and the RSI are overbought but remain neutral to bullish signaling that sideways to higher prices are possible near-term. If September extends the rally off June's low, the 38% retracement level of the January-June decline crossing at 0.074017 is the next upside target. Closes below the 20-day moving average crossing at 0.071179 would signal that a short-term top has been posted. First resistance is last-Friday's high crossing at 0.073585. Second resistance is the 38% retracement level of the January-June decline crossing at 0.074017 is the next upside target. First support is the 20-day moving average crossing at 0.071179. Second support is June's low crossing at 0.069755.
PRECIOUS METALS? http://quotes.ino.com/ex?changes/?c=metals ""
August gold closed lower on Monday as it consolidated some of the rally off June's low. The high-range close sets the stage for a steady to higher opening when Tuesday's day session begins trading. Stochastics and the RSI are overbought but remain neutral to bullish signaling that sideways to higher prices are possible near-term. If August extends the rally off June's low, the 50-day moving average crossing at $1974.60 is the next upside target. Closes below the 20-day moving average crossing at $1938.30 is the next downside target. First resistance is the 50-day moving average crossing at $1974.60. Second resistance is June's high crossing at $2000.70. First support is June's low crossing at $1911.40. Second support is the 50% retracement level of the 2022-2023 rally crossing at $1892.30.
September silver closed slightly lower on Monday as it consolidated some of the rally off June's low. The mid-range close sets the stage for a steady to lower opening when Tuesday's day session begins trading. Stochastics and the RSI are overbought but remain neutral to bullish signaling that sideways to higher prices are possible near-term. If July extends the rally off June's low, the 75% retracement level of the April-June decline crossing at 25.561 is the next upside target. Closes below the 20-day moving average crossing at 23.496 would signal that a short-term top has been posted. First resistance is last-Friday's high crossing at 25.255. Second resistance is the 75% retracement level of the April-June decline crossing at 25.561. First support is the 50-day moving average crossing at 24.027. Second support is the 20-day moving average crossing at 23.496.
September copper closed sharply lower on Monday as it consolidated some of the rally off the June 29th low. The low-range close sets the stage for a steady to lower opening when Tuesday's day session begins trading. Stochastics and the RSI are overbought but are turning neutral to bearish signaling that sideways to lower prices are possible near-term. Closes below the 50-day moving average crossing at 3.7874 would signal that a short-term top has been posted. If September renews this month's rally, June's high crossing at 3.9640 is the next upside target. First resistance is June's high crossing at 3.9640. Second resistance is May's high crossing at 4.0100. First support is the 50-day moving average crossing at 3.7874. Second support is June's low crossing at 3.6600.
GRAINS? http://quotes.ino.com/ex?changes/?c=grains "
December Corn closed down $0.07 3/4-cents at $5.06.
December corn closed lower on Monday as it consolidated some of the rally off last-Thursday's low. The low-range close sets the stage for a steady to lower opening when Tuesday's night session begins trading. Stochastics and the RSI are oversold but are turning neutral to bullish signaling that sideways to higher prices are possible near-term. Closes above the 50-day moving average crossing at $5.30 1/4 would signal that a short-term low has been posted. If December renews the decline off June's high, the September 2022 low crossing at $4.62 1/2 is the next downside target. First resistance is the 50-day moving average crossing at $5.30 1/4. Second resistance is the 20-day moving average crossing at $5.36 1/2. First support is last-Thursday's low crossing at $4.81. Second support is the September 2022 low crossing at $4.62 1/2.
September wheat closed down $0.07 3/4-cents at $6.53 3/4.
September wheat closed lower on Monday as it consolidated some of the rally off last-Thursday's low. The low-range close sets the stage for a steady to lower opening when Tuesday's day session begins trading. Stochastics and the RSI are oversold but are turning neutral to bullish signaling that sideways to higher prices are possible near-term. Closes above the 20-day moving average crossing at $6.80 would signal that a short-term low has been posted. If September renews the decline off June's high, May's low crossing at $5.87 3/4 is the next downside target. First resistance is the 20-day moving average crossing at $6.80. Second resistance is June's high crossing at $7.70 1/4. First support is last-Thursday's low crossing at $6.22. Second support is May's low crossing at $5.87 3/4.
September Kansas City Wheat closed down $0.13 3/4-cents at $8.15 1/4.
September Kansas City wheat closed lower on Monday. The low-range close sets the stage for a steady to lower opening when Tuesday's day session begins trading. Stochastics and the RSI are turning neutral to bullish signaling that sideways to higher prices are possible near-term. If September extends the rally off last-Wednesday's low, the July 6th high crossing at $8.55 3/4 is the next upside target. If September renews the decline off June's high, the July 3rd low crossing at $7.87 1/4 is the next downside target. First resistance is the July 6th high crossing at $8.55 3/4. Second resistance is June's high crossing at $8.89 1/2. First support is the July 3rd low crossing at $7.87 1/4. Second support is the June 14th low crossing at $7.76 3/4.
September Minneapolis wheat closed down $0.06-cents crossing at $8.78 1/4.
September Minneapolis wheat closed lower on Monday as it consolidated some of the rally off July's low. The low-range close sets the stage for a steady to lower opening when Tuesday's day session begins trading. Stochastics and the RSI are neutral to bullish signaling that sideways to higher prices are possible near-term. If September extends the rally off July's low, April's high crossing at $9.10 1/2 is the next upside target. Closes below the 50-day moving average crossing at $8.36 would temper the near-term friendly outlook. First resistance is today's high crossing at $8.69 1/4. Second resistance is April's high crossing at $9.10 1/2. First support is the 20-day moving average crossing at $8.54 1/2. Second support is the 50-day moving average crossing at $8.36.
SOYBEAN COMPLEX? http://quotes.ino.com/ex?changes/?c=grains "
November soybeans closed up $0.07 1/4-cents at $13.78.
November soybeans closed slightly higher on Friday. The low-range close sets the stage for a steady to lower opening when Tuesday's day session begins trading. Stochastics and the RSI are neutral to bullish signaling that sideways to higher prices are possible near-term. If November renews the rally off the June 28th low, the 87% retracement level of the 2022-2023 decline crossing at $14.07 1/2 is the next upside target. Closes below the 20-day moving average crossing at $13.35 3/4 would signal that a short-term top has been posted. First resistance is the July 3rd high crossing at $13.91 3/4. Second resistance is the 87% retracement level of the 2022-2023 decline crossing at $14.07 1/2. First support is the 20-day moving average crossing at $13.35 3/4. Second support is the 50-day moving average crossing at $12.60.
December soybean meal closed up $8.40 at $409.40.
December soybean meal closed higher on Monday. The high-range close sets the stage for a steady to higher opening when Tuesday's day session begins trading. Stochastics and the RSI are neutral to bullish signaling that sideways to higher prices are possible near-term. If December extends today's rally, July's high crossing at $415.20 is the next upside target. Closes below the 50-day moving average crossing at $386.90 would signal that a short-term top has been posted. First resistance is July's high crossing at $415.20. Second resistance is the 75% retracement level of the March-May decline crossing at $418.80. First support is the July 7th low crossing at $384.70. Second support is the June 29th low crossing at $374.60.
December soybean oil closed down 42-pts. at 60.34.
December soybean oil closed lower on Monday as it extends the trading range of the past two-weeks.The low-range close sets the stage for a steady to lower opening when Tuesday's day session begins trading. Stochastics and the RSI are neutral signaling that sideways trading is possible near-term. If December resumes the rally off May's low, January's high crossing at 61.68 is the next upside target. Closes below the 20-day moving average crossing at 58.12 would signal that a short-term top has been posted. First resistance is the 62% retracement level of the 2022-2023 decline crossing at 61.75. Second resistance is the 75% retracement level of the 2022-2023 decline crossing at 65.45. First support is the 20-day moving average crossing at 58.12. Second support is the June 29th low crossing at 54.67.
LIVESTOCKhttp://quotes.ino.com/exchanges/?c=livestock
August hogs closed down $1.35 at $94.85.
August hogs closed lower on Monday as it extends the trading range of the past eight-days. The low-range close sets the stage for a steady to lower opening when Tuesday's day session begins trading. Stochastics and the RSI are neutral to bearish signaling that sideways to lower prices are possible near-term. Closes below the 20-day moving average crossing at $93.61 would signal that a short-term top has been posted. If August renews the rally off May's low, the 87% retracement level of the 2022-2023 decline crossing at $104.40 is the next upside target. First resistance is the 75% retracement level of the 2022-2023 decline crossing at $100.14. Second resistance is the 87% retracement level of the 2022-2023 decline crossing at $104.40. First support is the 20-day moving average crossing at $93.61. Second support is the 50-day moving average crossing at $87.85.
August cattle closed down $0.05 at $180.13.
August cattle closed slightly lower on Monday but not before posting a new high for the year. The low-range close sets the stage for a steady to lower opening on Tuesday. Stochastics and the RSI are turning neutral to bullish signaling that sideways to higher prices are possible near-term. If August extends this year's rally into uncharted territory, upside targets will be hard to project. Closes below the 20-day moving average crossing at $174.76 would temper the near-term friendly outlook. First resistance is today's high crossing at $181.60. Second resistance is unknown. First support is the 20-day moving average crossing at $174.76. Second support is the 50-day moving average crossing at $169.84.
August Feeder cattle closed up $2.35 at $249.00.
August Feeder cattle closed higher on Monday. The high-range close sets the stage for a steady to higher opening when Tuesday's day session begins trading. Stochastics and the RSI are turning neutral to bullish signaling that sideways to higher prices are possible near-term. If August extends the rally off June's low into uncharted territory, upside targets will be hard to project. Closes below the 20-day moving average crossing at $241.14 would signal that a short-term top has been posted. First resistance is last-Wednesday's high crossing at $251.30. Second resistance is unknown. First support is the 20-day moving average crossing at $241.14. Second support is the June 27th gap crossing at $235.25.
FOOD & FIBERhttp://quotes.ino.com/ex changes/?c=food
September coffee closed lower on Monday as it extends the decline off April's high. The low-range close sets the stage for a steady to lower opening on Tuesday. Stochastics and the RSI are oversold but remain neutral to bearish signaling sideways to lower prices are possible near-term. If September extends the decline off June's high, the 87% retracement level of the January-April rally crossing at $15.20 is the next downside target. Closes above the 20-day moving average crossing at $16.34 would signal that a short-term low has been posted. First resistance is the 20-day moving average crossing at $16.34. Second resistance is the 50-day moving average crossing at $17.48. First support is today's low crossing at $15.51. Second support is the 87% retracement level of the January-April rally crossing at $15.20.
September cocoa closed slightly higher on Monday and the high-range close sets the stage for a steady to higher opening on Tuesday. Stochastics and the RSI are neutral signaling that sideways trading is possible near-term. If September extends last- week's decline, the 50-day moving average crossing at 31.48 is the next downside target. If September renews the rally off March's low, monthly resistance crossing at 34.29 is the next upside target.
October sugar closed lower on Monday as it consolidates some of the rally off June's low. The low-range close sets the stage for a steady to lower opening on Tuesday. Stochastics and the RSI are neutral to bullish signaling that sideways to higher prices are possible near-term. If October extends the rally off June's low, the 50-day moving average crossing at 24.71 is the next upside target. Closes below the 10-day moving average crossing at 23.66 would signal that a short-term top has been posted.
December cotton closed higher on Monday. The high-range close sets the stage for a steady to higher opening on Tuesday. Stochastics and the RSI are turning neutral to bullish signaling sideways to higher prices are possible near-term. If December extends the rally off June's low, May's high crossing at 84.30 is the next upside target. Closes below the 20-day moving average crossing at 80.13 would signal that a short-term top has been posted.
Thanks much tallpine!
The weather continues bullish. Even a bit more bullish with latest guidance. More in a minute:
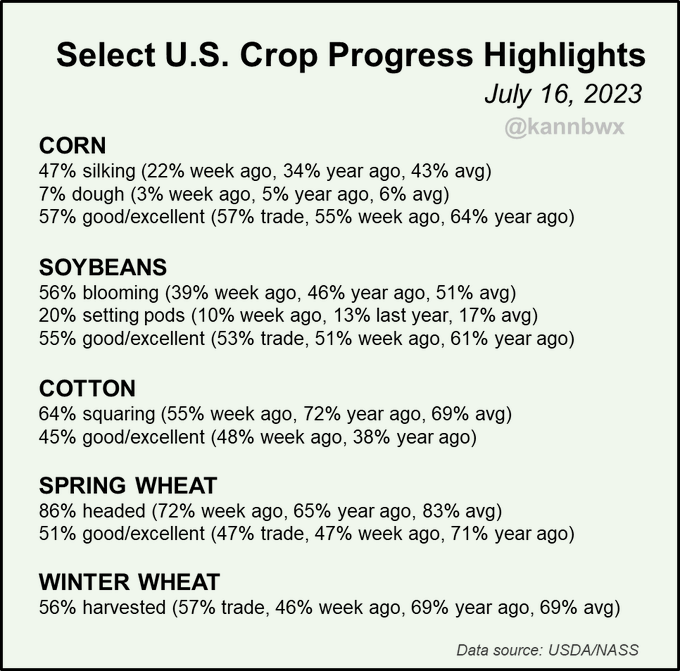
The crop report was especially bearish for beans and Spring Wheat!
Probably a lower open tonight for them.
https://www.marketforum.com/forum/topic/97324/#97357
By metmike - July 17, 2023, 5:11 p.m.
+2% for corn=expected
+4% for beans 2% expected
+4% HRS 0% expected
-3% cotton ? expected
Keep in mind that seasonally, the crop ratings are usually slowly declining in mid July, so this is unusual but that's what happens when an extremely moisture starved crop, suddenly gets big rains at this time of year.
This is bearish to prices news, but the weather is turning MORE bullish!
++++++++++++++++
U.S. #corn conditions increase as expected, but #soybeans rose more than expected. Spring #wheat conditions rose against expectations for steady. Winter wheat harvest is well behind normal pace.
metmike: if you remember, beans did not got up as much as expected last week(+1% vs +2% expected), so their condition improvement expectation was really just delayed to some extent.
7-10-23 report:
https://www.marketforum.com/forum/topic/97032/
Not much rain in the 7 day rain forecast for around half of the Cornbelt.
https://www.marketforum.com/forum/topic/83844/#83848
The latest 7 day precip forecasts are below.
Day 1 below:
http://www.wpc.ncep.noaa.gov/qpf/fill_94qwbg.gif?1526306199054

Day 2 below:
http://www.wpc.ncep.noaa.gov/qpf/fill_98qwbg.gif?1528293750112

Day 3 below:
http://www.wpc.ncep.noaa.gov/qpf/fill_99qwbg.gif?1528293842764

Days 4-5 below:
http://www.wpc.ncep.noaa.gov/qpf/95ep48iwbg_fill.gif?1526306162

Days 6-7 below:
http://www.wpc.ncep.noaa.gov/qpf/97ep48iwbg_fill.gif?1526306162

7 Day Total precipitation below:
http://www.wpc.ncep.noaa.govcdx /qpf/p168i.gif?1530796126

Not much rain for much of the Western Cornbelt in the week 2 forecasts.....with the dryness creeping east and a bit of heat, mainly northwest half:
https://www.marketforum.com/forum/topic/83844/#83852
Extended weather.
https://www.cpc.ncep.noaa.gov/products/predictions/610day/ | |||||||||
| 6 to 10 day outlooks | |||||||||
| Click below for information about how to read 6-10 day outlook maps Temperature Precipitation | |||||||||
| Click below for archives of past outlooks (data & graphics), historical analogs to todays forecast, and other formats of the 6-10 day outlooks ArchivesAnalogsLines-Only FormatGIS Data | |||||||||
Temperature Probability | |||||||||
Precipitation Probability | |||||||||
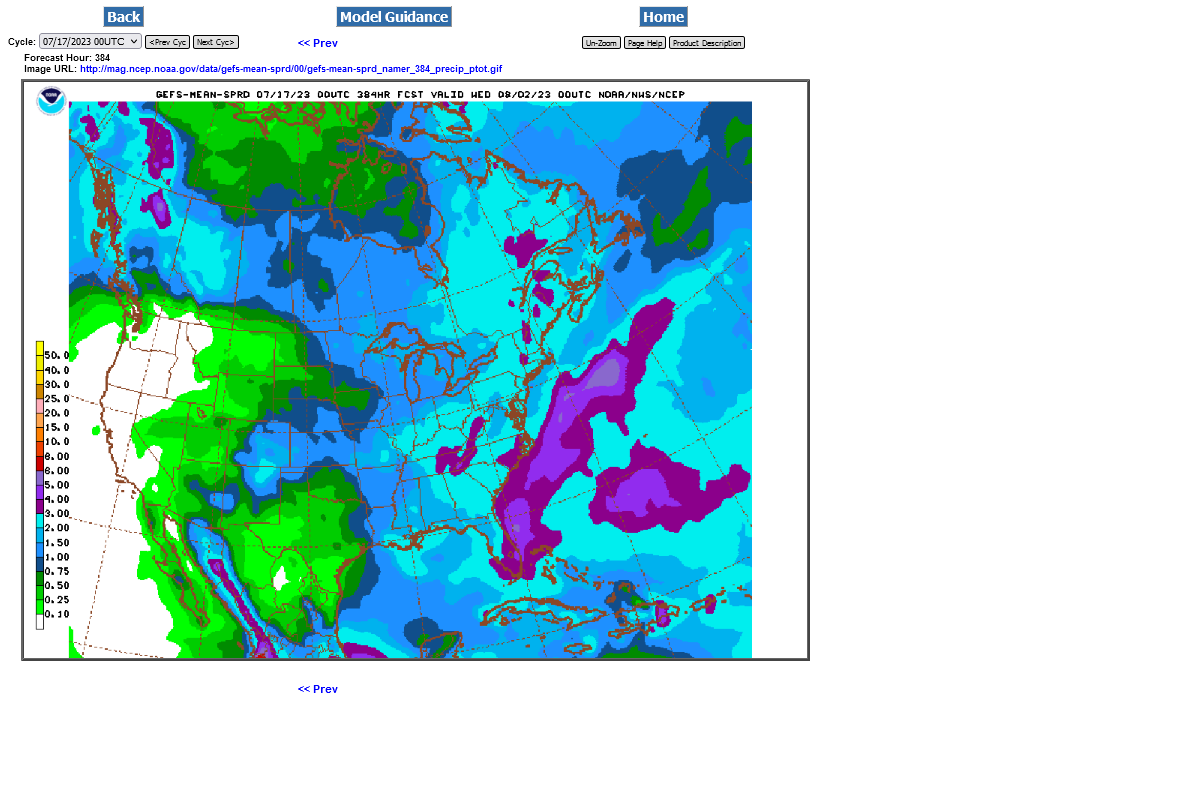
Last 3 runs of the GEFS.
1. Oz was pretty dry
2. 6z added some rains in the WCB/Upper Midwest.
3. Back to drier for the last 12z GEFS
4. Still have northwest flow but the trough shifted slightly east on this 12z run


The European Ensemble continues to be ever drier:
Less than .50 for close to half of the Midwest the next 2 weeks.


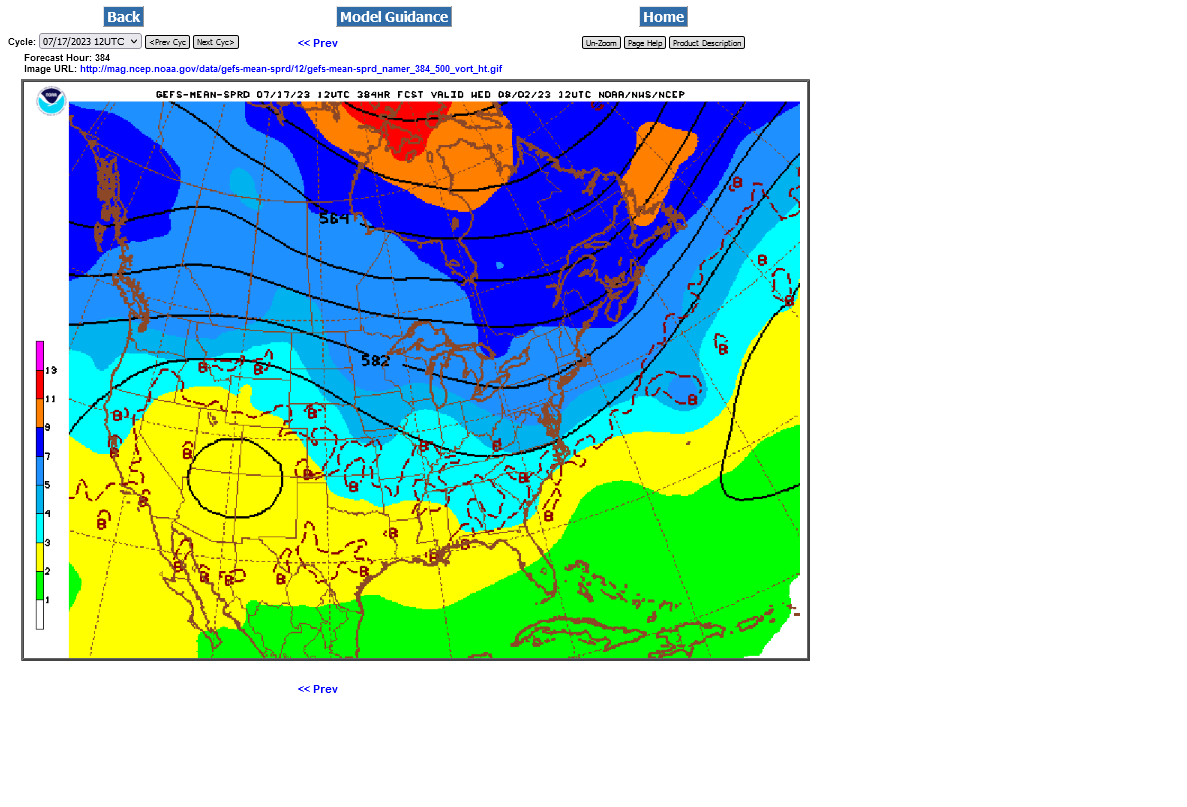
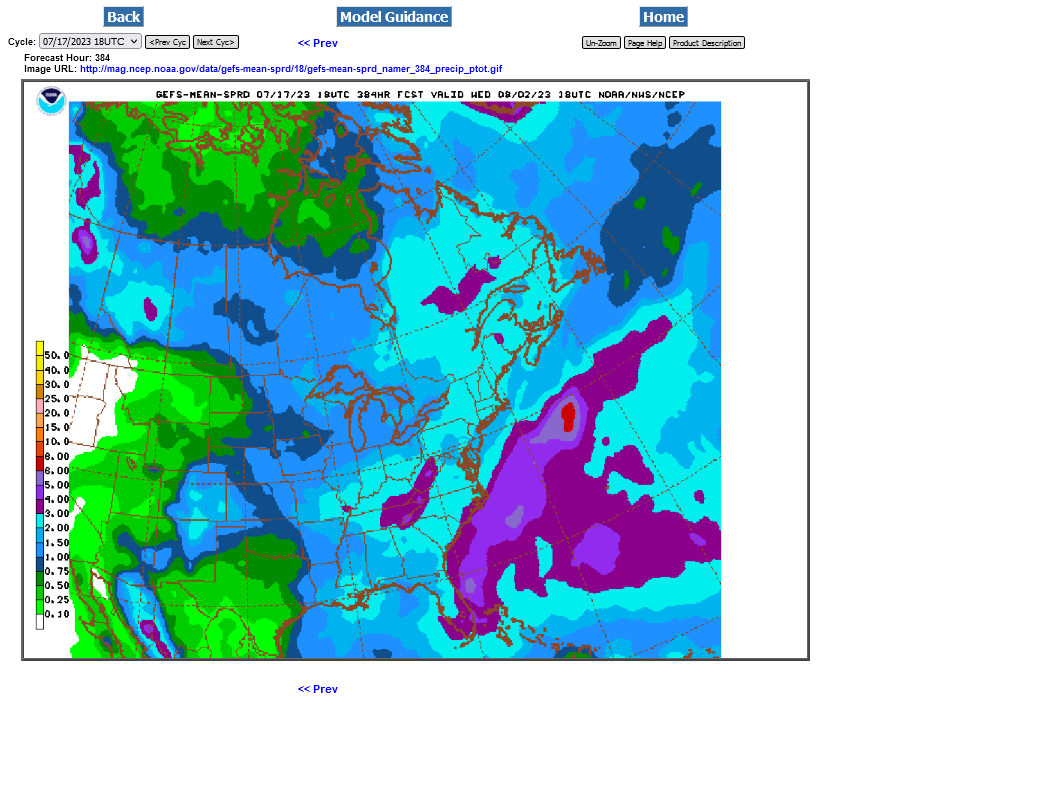
The 18z GEFS was a bit more bullish:
1. 500 mb pattern
2. 384 hour rains


