KEY EVENTS TO WATCH FOR:
Friday, July 14, 2023
8:30 AM ET. June Import & Export Price Indexes
Import Prices (expected -0.1%; previous -0.6%)
Non-Petroleum Prices (previous -0.2%)
Petroleum Prices (previous -5.9%)
July University of Michigan Survey of Consumers - preliminary
Mid-Mo Sentiment (expected 65.5; previous 63.9)
Mid-Mo Expectations (previous 61.3)
Mid-Mo Current Idx (previous 68.0)
Monday, July 17, 2023
8:30 AM ET. July Empire State Manufacturing Survey
Mfg Idx (previous 6.6)
Employment Idx (previous -3.6)
New Orders Idx (previous 3.1)
Prices Received (previous 9.0)
The STOCK INDEXES? http://quotes.ino.com/ex?changes/?c=indexes
The STOCK INDEXES: The September NASDAQ 100 was steady to slightly lower overnight as it consolidates some of this week's rally. The stage is set for a steady to lower opening when the day session begins trading. Stochastics and the RSI are overbought but remain neutral to bullish signaling that sideways to higher prices are possible near-term. If September extends this year's rally, the 87% retracement level of the 2021-2022-decline on the weekly continuation chart crossing at 15,957.86 is the next upside target. Closes below Monday's low crossing at 15,063.25 would signal that a short-term top has been posted. First resistance is Thursday's high crossing at 15,741.25. Second resistance is the 87% retracement level of the 2021-2022-decline on the weekly continuation chart crossing at 15,957.86. First support is Monday's low crossing at 15,063.25. Second support is the June 26th low crossing at 14,853.50. Third support is the June 6th low crossing at 14,420.00.
The September S&P 500 was steady to slightly higher overnight as it extends this week's rally to new highs for the year. Overnight trading sets the stage for a slightly higher opening when the day session begins trading. Stochastics and the RSI are overbought but remain neutral to bullish signaling that sideways to higher prices are possible near-term. If June extends the rally off March's low, the 87% retracement level of the 2022 decline crossing at 4639.07 is the next upside target. Closes below Monday's low crossing at 4411.25 would signal that a short-term top has been posted. First resistance is Thursday's high crossing at 4551.50. Second resistance is the 87% retracement level of the 2022 decline crossing at 4639.07. First support is Monday's low crossing at 4411.25. Second support is the June 26th low crossing at 4368.50. Third support is the 50-day moving average crossing at 4322.97.
INTEREST RATES http://quotes.ino.com/ex changes/?c=interest"
INTEREST RATES: September T-bonds was lower overnight as it consolidates some of this week's rally. Overnight trading sets the stage for a lower opening when the day session begins trading. Stochastics and the RSI remain neutral to bullish signaling that sideways to higher prices are possible near-term. If September extends this week's rally, the 50-day moving average crossing at 127-23 is the next upside target. Closes below the 10-day moving average crossing at 125-14 would temper the near-term friendly outlook. First resistance is the 50-day moving average crossing at 127-23. Second resistance is the 50% retracement level of the April-July decline crossing at 128-21. First support is the 10-day moving average crossing at 125-14. Second support is Monday's low crossing at 122-30.
September T-notes were lower overnight as it consolidates some of the rally off last-Thursday's low. Overnight trading sets the stage for a lower opening when the day session begins trading. Stochastics and the RSI are neutral to bullish signaling that sideways to higher prices are possible near-term. If September extends this week's rally, the 50-day moving average crossing at 113.257 is the next upside target. Closes below the 10-day moving average crossing at 111.238 would signal that a short-term top has likely been posted. First resistance is the 50-day moving average crossing at 113.257. Second resistance is June's high crossing at 115.000. First support is the 10-day moving average crossing at 111.238. Second support is last-Thursday's low crossing at 110.050. Third support is the October-2022 low on the weekly continuation chart crossing at 108.265.
ENERGY MARKETS? http://quotes.ino.com/ex?changes/?c=energy ""
ENERGIES:Augustcrude oil was steady to slightly lower overnight as it consolidates some of the rally off the June 28th low. Overnight trading sets the stage for a steady to lower opening when the day session begins trading. Stochastics and the RSI are overbought but remain neutral to bullish signaling that sideways to higher prices are possible near-term. If August extends the rally off the June 28th low, the 75% retracement level of the April-May decline crossing at $77.85 is the next upside target. Closes below the 20-day moving average crossing at $71.84 would signal that a short-term top has been posted. First resistance is Thursday's high crossing at $77.33. Second resistance is the 75% retracement level of the April-May decline crossing at $77.85. First support is the 10-day moving average crossing at 73.51. Second support is the 20-day moving average crossing at $71.84.
September heating oil was steady to slightly higher overnight and set sets the stage for a slightly higher opening when the day session begins trading. Stochastics and the RSI are overbought but remain neutral to bullish signaling that sideways to higher prices are possible near-term. If September extends the rally off May's low, April's high crossing at 2.6618 is the next upside target. Closes below the 20-day moving average crossing at 2.4707 would signal that a short-term top has been posted. First resistance is April's high crossing at 2.6618. Second resistance is the 50% retracement level of the 2022-2023 decline crossing at 2.7273. First support is the 10-day moving average crossing at 2.5237. Second support is the 20-day moving average crossing at 2.4707.
September unleaded gas was steady to slightly higher overnight as it extends the rally off May's low. Overnight trading sets the stage for a slightly higher opening when the day session begins trading. Stochastics and the RSI are overbought but remain neutral to bullish signaling that sideways to higher prices are possible near-term. If September extends the rally off May's low, April's high crossing at $2.6388 is the next upside target. Closes below the 20-day moving average crossing at 2.4663 would signal that a short-term top has been posted. First resistance is Thursday's high crossing at $2.6211. Second resistance is April's high crossing at $2.6388. First support is the 10-day moving average crossing at $2.5133. Second support is the 20-day moving average crossing at $2.4663.
September natural gas was steady to slightly higher overnight and sets the stage for a slightly higher opening when the day session begins trading. Stochastics and the RSI are oversold but remain neutral to bearish signaling that sideways to lower prices are possible near-term. Closes below the 50-day moving average crossing at 2.552 would signal that a short-term low has been posted while opening the door for additional weakness near-term. If September renews the rally off June's low, the 25% retracement level of the 2022-2023 decline crossing at 3.193 is the next upside target. First resistance is the June 26th high crossing at 2.911. Second resistance is the 25% retracement level of the 2022-2023 decline crossing at 3.193. First support is the 50-day moving average crossing at 2.552. Second support is the June 1st low crossing at 2.249.
CURRENCIEShttp://quotes.ino.com/ex changes/?c=currencies"
CURRENCIES:The September Dollar was steady to slightly higher overnight. Overnight trading sets the stage for a steady to slightly higher opening when the day session begins trading later this morning. Stochastics and the RSI are oversold but remain neutral to bearish signaling that sideways to lower prices are possible near-term. If September extends the decline off last-Thursday's high, the March 30th low on the weekly continuation chart crossing at $97.730 is the next downside target. Closes above the 50-day moving average crossing at $102.410 would signal that a short-term low has been posted. First resistance is the 50-day moving average crossing at $102.410. Second resistance is July's high crossing at $103.275. First support is the overnight low crossing at $99.260. Second support is the March 30th -2022 low on the weekly continuation chart crossing at $97.730.
The September Euro was slightly higher overnight and sets the stage for a slightly higher opening when the day session begins trading. Stochastics and the RSI are overbought but remain neutral to bullish signaling that sideways to higher prices are possible near-term. If September extends the rally off May's low, the March 30th -2022 crossing at $1.15190 is the next upside target. Closes below the 20-day moving average crossing at 1.10148 would signal that a short-term top has been posted while opening the door for additional weakness near-term. First resistance is the overnight high crossing at $1.12805. Second resistance is the 20-day moving average crossing at 1.10148. First support is the 20-day moving average crossing at 1.10148. Second support is the 50-day moving average crossing at 1.09401.
The September British Pound was steady to slightly lower overnight as it consolidates some of the rally off March's low. Overnight trading and sets the stage for a slightly lower opening when the day session begins trading. Stochastics and the RSI are overbought but remain neutral to bullish signaling that sideways to higher prices near-term. If September extends the rally off May's low, the 75% retracement level of the 2022-2023 decline crossing at 1.3253 is the next upside target. Closes below the 20-day moving average crossing at 1.2807 would signal that a short-term top has been posted. First resistance is the overnight high crossing at 1.3146. Second resistance is the 75% retracement level of the 2022-2023 decline crossing at 1.3253. First support is the 20-day moving average crossing at 1.2807. Second support is the 50-day moving average crossing at 1.2634.
The September Swiss Franc was steady to slightly higher overnight as it extends the rally off May's low. Overnight trading sets the stage for a steady to slightly higher opening when the day session begins trading. Stochastics and the RSI are overbought but remain neutral to bullish signaling that sideways to higher prices are possible near-term. If September extends the rally off May's low, the January 2019 high crossing at 1.18680 is the next upside target. Closes below the 20-day moving average crossing at 1.13447 would signal that a short-term top has been posted. First resistance is the overnight high crossing at 1.17535. Second resistance is the January 2019 high crossing at 1.18680. First support is the 10-day moving average crossing at 1.14193. Second support is the 20-day moving average crossing at 1.13447.
The September Canadian Dollar was lower overnight and sets the stage for a lower opening when the day session begins trading. Stochastics and the RSI are overbought but remain neutral to bullish signaling that sideways to higher prices are possible near-term. If September extends the rally off last-Friday's low, the September-12th -2022 high crossing at $77.11 is the next upside target. Closes below the 10-day moving average crossing at $75.55 would signal that a short-term top has been posted. First resistance is the 38% retracement level of the 2022-2023 decline crossing at $76.28. Second resistance is the September-12th -2022 high crossing at $77.11. First support is the 20-day moving average crossing at $75.77. Second support is the 10-day moving average crossing at $75.64.
The September Japanese Yen was lower overnight as it consolidates some of the rally off May's low. Overnight trading sets the stage for a lower opening when the day session begins trading. Stochastics and the RSI are overbought but remain neutral to bullish signaling that sideways to higher prices are possible near-term. If September extends the rally off May's low, the 38% retracement level of the January-July decline crossing at 0.074017 is the next upside target. Closes below the 20-day moving average crossing at 0.071164 would signal that a short-term top has been posted. First resistance is the overnight high crossing at 0.073585. Second resistance is the 38% retracement level of the January-June decline crossing at 0.074017. First support is the 20-day moving average crossing at 0.071164. Second support is July's low crossing at 0.069755.
PRECIOUS METALS http://quotes.ino.com/ex changes/?c=metals"
Precious Metals: Augustgold was steady to slightly lower overnight and sets the stage for a slightly lower opening when the day session begins trading later this morning. Stochastics and the RSI are overbought but remain neutral to bullish signaling that sideways to higher prices are possible near-term. If August extends the rally off June's low, the 50-day moving average crossing at $1976.50 is the next upside target. Closes below the 20-day moving average crossing at $1938.80 would signal that a short-term top has been posted. First resistance is the 50-day moving average crossing at $1976.50. Second resistance is June's high crossing at $2000.70. First support is the 50% retracement level of the September-May rally crossing at $1892.30. Second support is the 62% retracement level of the September-May rally crossing at $1842.60.
September silver was steady to slightly higher overnight and sets the stage for a slightly higher opening when the day session begins trading later this morning. Stochastics and the RSI are overbought but remain neutral to bullish signaling that sideways to higher prices are possible near-term. If July extends the rally off June's low, the 75% retracement level of the May-June decline crossing at $25.561 is the next upside target. Closes below the 20-day moving average crossing at $23.443 would signal that a short-term top has been posted. First resistance is the 62% retracement level of the May-June decline crossing at $24.992. Second resistance is the 75% retracement level of the May-June decline crossing at 25.561. First support is the 50-day moving average crossing at $24.041. Second support is the 20-day moving average crossing at $23.443.
September copper was steady to slightly lower overnight and sets the stage for a slightly lower opening when the day session begins trading. Stochastics and the RSI are neutral to bullish signaling that sideways to higher prices are possible near-term. If September extends the rally off the June 29th low, June's high crossing at 3.9640 is the next upside target. Closes below the 50-day moving average crossing at 3.7876 would signal that a short-term top has been posted. First resistance June's high crossing at 3.9640. Second resistance is May's high crossing at 4.0100. First support is the June 29th low crossing at 3.6830. Second support is May's low crossing at 3.5650.
GRAINS http://quotes.ino.com/ex changes/?c=grains
Grains: December corn was higher overnight as it extends the rally off Thursday's low. Overnight trading sets the stage for a higher opening when the day sessions begins trading. Stochastics and the RSI are oversold but remain bearish signaling that sideways to lower prices are possible near-term. If December extends the decline off the June 21st high, the September 2022 low crossing at $4.62 1/2 is the next downside target. Closes above above the July 7th high crossing at $5.09 1/2 would open the door for a possible test of the 50-day moving average crossing at $5.30 3/4. First resistance is the 50-day moving average crossing at $5.30 3/4. Second resistance is the 20-day moving average crossing at $5.40. First support is Thursday's low crossing at $4.81. Second support is the September 2022 low crossing at $4.62 1/2.
September wheat was higher overnight as it consolidates some of Wednesday's decline. Overnight trading sets the stage for a higher opening when the day session begins trading. Stochastics and the RSI are oversold but remain neutral to bearish signaling that sideways to lower prices are possible near-term. If September extends the decline off June's high, May's low crossing at $5.87 3/4 is the next downside target. Closes above the 20-day moving average crossing at $6.80 3/4 would signal that a short-term low has been posted. First resistance is the 20-day moving average crossing at $6.80 3/4. Second resistance is June's high crossing at $7.70 1/4. First support is Thursday's low crossing at $6.22. Second support is May's low crossing at $5.87 3/4.
September Kansas City wheat was higher overnight and working as it consolidates some of Wednesday's loss. Overnight trading sets the stage for a higher opening when the day session begins trading later this morning. Stochastics and the RSI are turning neutral to bullish signaling that sideways to higher prices are possible near-term. Closes above the 20-day moving average crossing at $8.28 1/4 would signal that a short-term low has been posted. If September extends the decline off last-Thursday's high, July's low crossing at $7.87 1/4 is the next downside target. First resistance is last-Thursday's high crossing at $8.55 3/4. Second resistance is June's high crossing at $8.89 1/2. First support is July's low crossing at $7.87 1/4. Second support is the June 14th low crossing at $7.76 3/4.
September Minneapolis wheat was higher overnight as it extends the rally off July's low. Overnight trading sets the stage for a higher opening when the day session begins trading. Stochastics and the RSI are neutral to bullish signaling that sideways to higher prices are possible near-term. If September extends the rally off July's low, June's high crossing at $8.94 1/2 is the next upside target. Closes below the 50-day moving average crossing at $8.34 1/2 would temper the near-term friendly outlook. First resistance is June's high crossing at $8.94 1/2. Second resistance is April's high crossing at $9.10 1/2. First support is the 50-day moving average crossing at $8.34 1/2. Second support is July's low crossing at $8.07 1/4.
SOYBEAN COMPLEX? http://quotes.ino.com/ex?changes/?c=grains "
November soybeans were higher overnight and sets the stage for a higher opening when the day session begins trading later this morning. Stochastics and the RSI are neutral to bullish signaling that sideways to higher prices are possible near-term. If November renews the rally off May's low, the 87% retracement level of the 2022-2023 decline crossing at $14.07 1/2 is the next upside target. Closes below the 20-day moving average crossing at $13.32 1/4 would signal that a short-term top has been posted. First resistance is the 87% retracement level of the 2022-2023 decline crossing at $14.07 1/2. Second resistance is the December 2022 high crossing at $14.27 3/4. First support is the 20-day moving average crossing at $13.32 1/4. Second support is the 50-day moving average crossing at $12.58 1/4.
December soybean meal was higher overnight and sets the stage for a higher opening when the day session begins trading. Stochastics and the RSI are neutral to bullish signaling that sideways to higher prices are possible near-term. If December renews the rally off the June 29th low, the 75% retracement level of the March-May decline crossing at $418.80 is the next upside target. Closes below the 50-day moving average crossing at $386.70 would confirm that a short-term top has been posted. First resistance is July's high crossing at $4.15 1/4. Second resistance is the 75% retracement level of the March-May decline crossing at $418.80. First support is the July 7th low crossing at $3.84 3/4. Second support is the June 29th low crossing at $374.60.
December soybean oil was higher overnight as it extends the trading range of the past two-weeks. Overnight strength sets the stage for a higher opening when the day session begins trading. Stochastics and the RSI are neutral to bullish signaling that sideways to higher prices are possible near-term. If December renews the rally off May's low, the 75% retracement level of the 2022-2023 decline crossing at 65.45 is the next upside target. Closes below the 20-day moving average crossing at 57.98 would signal that a short-term top has been posted. First resistance is the 62% retracement level of the 2022-2023 decline crossing at 61.75. Second resistance is the 75% retracement level of the 2022-2023 decline crossing at 65.45. First support is the 20-day moving average crossing at 57.98. Second support is the June 29th low crossing at 54.67.
Thanks tallpine!
see the last tallpine thread for the scoup on where we are right now.
more when I return to my office later.
This is the thread with all the weather updates from late yesterday to overnight
https://www.marketforum.com/forum/topic/97195/#97197
Adding to that:
Here's the last European model that comes out last and not completely until 3am CDT.
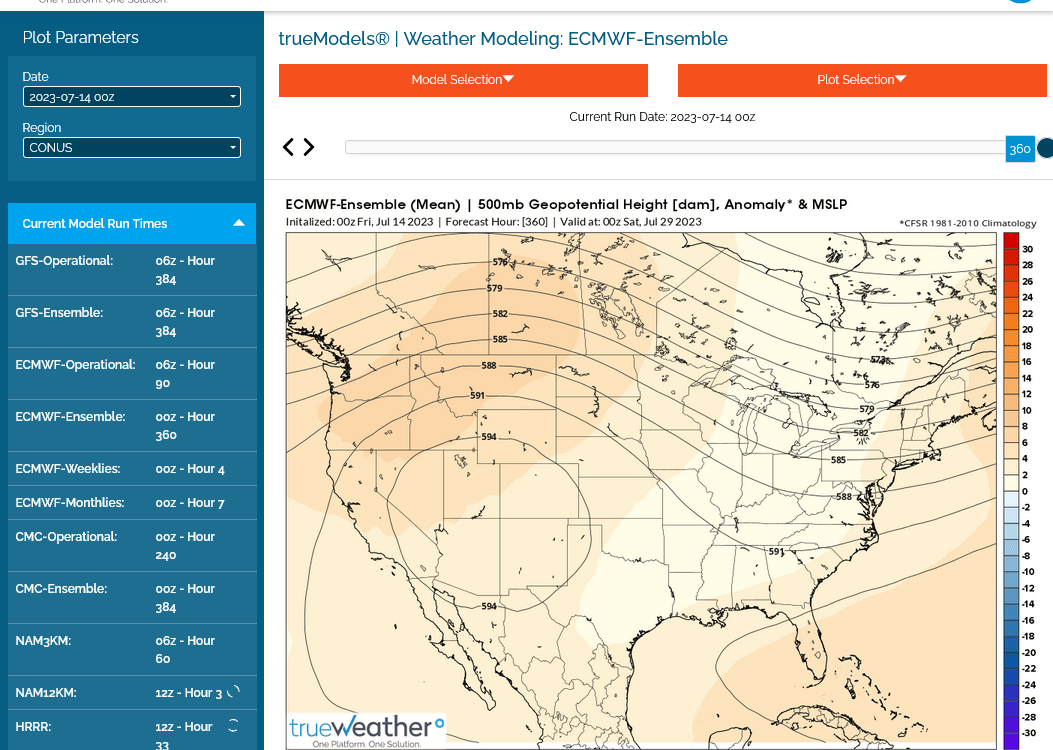
1. Upper level pattern
2. Total rains. Real skinny in the Northwest half of belt. BULLISH if it verifies.
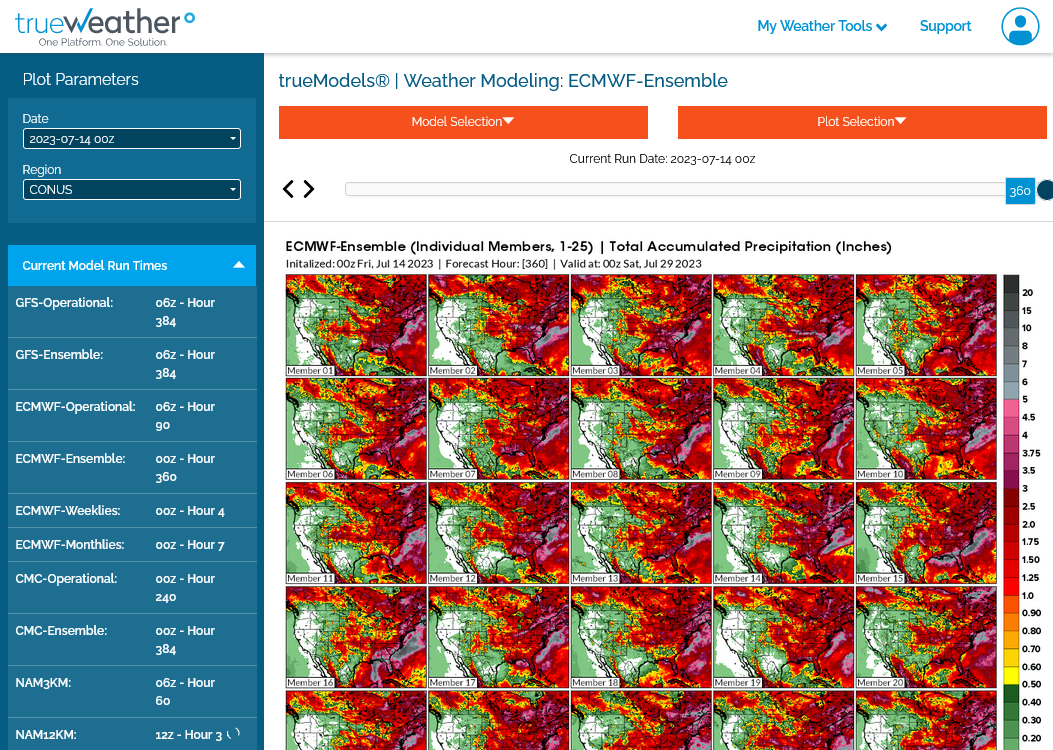
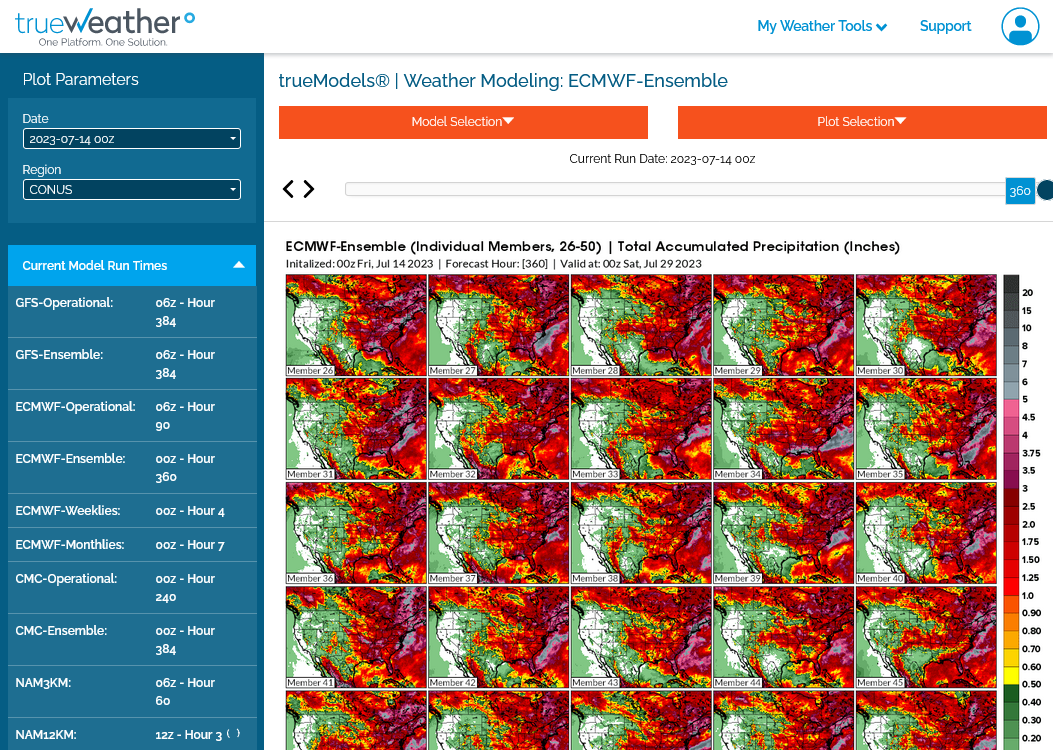
3. 50 separate ensemble members/solutions that make up the ensemble average. We take all 50 of them and average them together to get the first 2 maps.
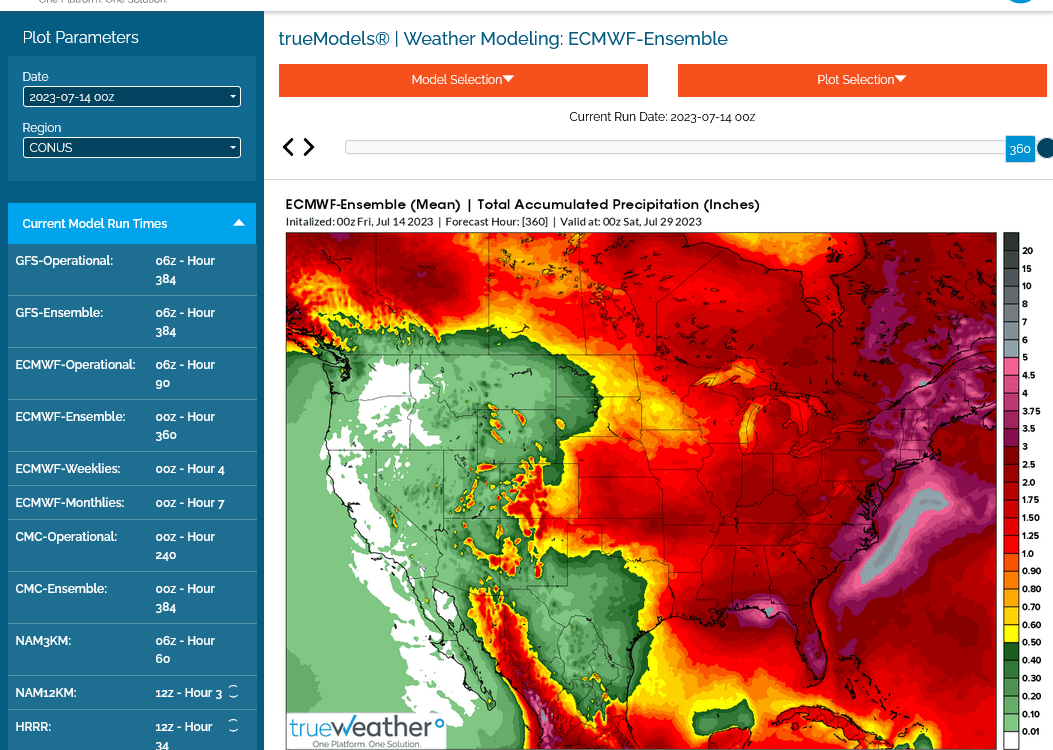
Updated 7 day rain totals: Basically everywhere north and west of Chicago is short changed, including the key state of IA.
The SCB and ECB looks great.
Here's the key............shift that line between the haves and have nots farther northwest and the weather turns BEARISH. Shift it farther southeast and it become MORE BULLISH.
https://www.marketforum.com/forum/topic/83844/#83848
Weather map now.
In 24 hours and
In 48 hours.
https://www.wpc.ncep.noaa.gov/#

+++++++++++++++++++++++++++++++++++++++++++++++++
Surface Weather maps for days 3-7 below:
https://www.wpc.ncep.noaa.gov/medr/medr.shtml

+++++++++++++++++++++++++++++++++++++++++++
The latest 7 day precip forecasts are below.
Day 1 below:
http://www.wpc.ncep.noaa.gov/qpf/fill_94qwbg.gif?1526306199054

Day 2 below:
http://www.wpc.ncep.noaa.gov/qpf/fill_98qwbg.gif?1528293750112

Day 3 below:
http://www.wpc.ncep.noaa.gov/qpf/fill_99qwbg.gif?1528293842764

Days 4-5 below:
http://www.wpc.ncep.noaa.gov/qpf/95ep48iwbg_fill.gif?1526306162

Days 6-7 below:
http://www.wpc.ncep.noaa.gov/qpf/97ep48iwbg_fill.gif?1526306162

7 Day Total precipitation below:
http://www.wpc.ncep.noaa.govcdx /qpf/p168i.gif?1530796126

What do I think?
I'm not smart enough to know what the models will show on Sunday afternoon which is the only thing that will matter then.
As I've been saying all week. Northwest flow like we have coming up is really tricky.
A small shift west or east in the major features and the outcome can completely change for several states..........that get wetter if it retrogrades west or drier if it shifts east with the dome closer, which adds additional heat.
The Canadian model has enough bearish solutions to cause me to not get too bullish from looking at the more bullish European model, which has a better track record and the market likes the most because of that.
Seasonals at this time of year are solidy negative as each day that passes is 1 day closer to making the crop and not killing the crop, which usually erodes risk premium and speculators lose their enthusiasm for being long after the first half of the growing season because the potential for hitting a bullish home run diminishes as the crop matures.
But a weather pattern like this on the EE is a potential threat ahead of the weekend.
It's possible that might be enough to generate buying. Honestly, I really don't know.
Yesterdays powerful move higher was greater than I expected, so maybe that dialed in the extra risk already?
Only half the crop is threatened and not with extreme temps, which usually accompany legit threats in most years/July.
It's clearly not all 1 sided and those are just some of my thoughts, which is surely missing things.
Like the weakening dollar that cutworm brought up. A lower dollar is BULLISH most commodities.
Another item is crude prices.
Where CL goes in big moves, speculators like to take the same positions that day in the grains and other markets.
CL up yesterday and down today for instance is following that theme with grains struggling to follow thru today.
What do you grain traders and producers think?
The Canadian model is always the first to update at 0z and now 12z.
This model is free at the link below.
Look at the individual ensembles. The slight majority are bearish. HOWEVER, a significant minority are very bullish. This is one of those cases, where the average at the top does not reflect what most of the solutions show.
The average/mean takes a bunch of extremes and divides them by the total number in the group to come up with something in the middle which very few in the sample think will happen.
It would be like the average of 1,2, 9, 10 for instance. 22/4 = 5.5. None of the 4 numbers are close to the average of 5.5.
When this happens, we have 2 camps, both with extremes and a higher likelihood that one extreme is more likely than the other but in this case, the bearish camp has just a couple more members than the bullish one. Enough to make the average look slightly bearish.
However, what we have is elevated uncertainty and potential to be REALLY wrong, if 1 camp has the right idea and you go with the other one.
Often, meteorologists will just go with the average and worst case scenario is they will be half wrong.
Sometimes, really good meteorologists can see solid pattern recognition indicators to back one extreme side and go entirely with that one.
I made a ton of money doing that in the early days trading.
But my biggest losses were doing that with positions over a weekend.
This is not one of those times for me (-:
https://weather.gc.ca/ensemble/index_e.html
https://weather.gc.ca/ensemble/charts_e.html?Hour=384&Day=0&RunTime=12&Type=gz
384h GZ 500 forecast valid on Jul 30, 2023 12 UTC


Another factor right now are these crazy ocean temperatures.
Not just really warm in many spots but the very chilly waters off the West Coast causing a strongly -PDO which usually happens in La Nina's NOT El Nino's.
https://www.marketforum.com/forum/topic/97149/