KEY EVENTS TO WATCH FOR:
Friday, July 14, 2023
8:30 AM ET. June Import & Export Price Indexes
Import Prices (expected -0.1%; previous -0.6%)
Non-Petroleum Prices (previous -0.2%)
Petroleum Prices (previous -5.9%)
July University of Michigan Survey of Consumers - preliminary
Mid-Mo Sentiment (expected 65.5; previous 63.9)
Mid-Mo Expectations (previous 61.3)
Mid-Mo Current Idx (previous 68.0)
Monday, July 17, 2023
8:30 AM ET. July Empire State Manufacturing Survey
Mfg Idx (previous 6.6)
Employment Idx (previous -3.6)
New Orders Idx (previous 3.1)
Prices Received (previous 9.0)
The STOCK INDEXES? http://quotes.ino.com/ex?changes/?c=indexes
The Dow posted an inside day with a higher close on Thursday as it extends the rally off Monday's low. The low-range close sets the stage for a steady to slightly higher opening when Friday's day session begins trading. Stochastics and the RSI are neutral to bullish signaling that sideways to higher prices are possible near-term. If the Dow renews the rally off the June 26th low, the December-2022 high crossing at 34,712.28 is the next upside target. Closes below the 20-day moving average crossing at 34,085.40 would signal that a short-term top has been posted. First resistance is June's high crossing at 34,588.68. Second resistance is the December-2022 high crossing at 34,712.28. First support is the 20-day moving average crossing at 34,085.40. Second support is the 50-day moving average crossing at 33,684.90.
The September NASDAQ 100 closed sharply higher for the third day in a row on Thursday. The high-range close sets the stage for a steady to higher opening when Friday's night session begins trading. Stochastics and the RSI are neutral to bullish signaling sideways to higher prices are possible. If September extends this year's rally, the 87% retracement level of the 2021-2022-decline on the weekly continuation chart crossing at 15,957.86 is the next upside target. Closes below Monday's low crossing at 15,063.25 would signal that a short-term top has been posted. First resistance is today's high crossing at 15,699.50. Second resistance is the 87% retracement level of the 2020-2022-decline on the weekly continuation chart crossing at 15,957.86. First support is Monday's low crossing at 15,063.25. Second support is the June 26th low crossing at 14,853.50.
The September S&P 500 closed higher on Thursday as it posted a new high for the year. The high-range close sets the stage for a steady to higher opening when Friday's night session begins trading. Stochastics and the RSI are neutral to bullish signaling that sideways to higher prices are possible near-term. If September extends the rally off March's low, the 87% retracement level of the 2022 decline on the weekly chart crossing at 4639.07 is the next upside target. Closes below Monday's low crossing at 4411.25 would signal that a short-term top has been posted. First resistance is the 75% retracement level of the 2022 decline on the weekly chart crossing at 4505.40. Second resistance is the 87% retracement level of the 2022 decline on the weekly chart crossing at 4639.07. First support is Monday's low crossing at 4411.25. Second support is the June 26th low crossing at 4368.50.
INTEREST RATES? http://quotes.ino.com/ex?changes/?c=interest ""
September T-bonds closed up 1-03/32's at 126-28.
September T-bonds closed sharply higher on Thursday as it extends the rally off Monday's low. The high-range close sets the stage for a steady to higher opening when Friday's day session begins trading. Stochastics and the RSI are neutral to bullish signaling that sideways to higher prices are possible near-term. If September extends the rally off Monday's low, the 50-day moving average crossing at 127-26 is the next upside target. If September renews the decline off April's high, the March 22nd low on the weekly continuation chart crossing at 122-22 is the next downside target. First resistance is the 50-day moving average crossing at 127-26. Second resistance is the June 26th high crossing at 128-22. First support is Monday's low crossing at 122-30. Second support is the March 22nd low on the weekly continuation chart crossing at 122-22.
September T-notes closed up 240-pts. at 113.005.
September T-notes closed sharply higher on Thursday as it extends the rally off last-Thursday's low. The high-range close sets the stage for a steady to higher opening when Friday's day session begins trading. Stochastics and the RSI are neutral to bullish signaling that sideways to higher prices are possible near-term. If September extends the rally off last-Thursday's low, the 50-day moving average crossing at 113.279 would signal that a short-term low has been posted. If September renews the decline off May's high, the October 21st low on the weekly continuation chart crossing at 108.265 is the next downside target. First resistance is the 50-day moving average crossing at 113.279. Second resistance is June's high crossing at 115.000. First support is last-Thursday's low crossing at 110.050. Second support is the October 21st low on the weekly continuation chart crossing at 108.265.
ENERGY MARKETS? http://quotes.ino.com/ex?changes/?c=energy ""
August crude oil closed higher on Thursday as it extends the rally off the June 28th low crossing at $67.05. The high-range close sets the stage for a steady to higher opening when Friday's day session begins. Stochastics and the RSI are overbought but remain neutral to bullish signaling that sideways to higher prices are possible near-term. If August extends the aforementioned rally, the 75% retracement level of the April-May decline crossing at $77.85 is the next upside target. Closes below the 20-day moving average crossing at $71.44 would signal that a short-term top has been posted. First resistance is today's high crossing at $77.29. Second resistance is the the 75% retracement level of the April-May decline crossing at $77.85. First support is the 20-day moving average crossing at $71.44. Second support is the June 12thlow crossing at $66.96.
September heating oil closed higher on Thursday as it extends the rally off May's low. The high-range close sets the stage for a steady to higher opening when Friday's day trading session begins. Stochastics and the RSI are overbought but are neutral to bullish signaling that sideways to higher prices are possible near-term. If September extends the rally off May's low, April's high crossing at 2.6618 is the next upside target. Closes below the 20-day moving average crossing at 2.4572 would signal that a short-term top has been posted. First resistance is April's high crossing at 2.6618. Second resistance is the 50% retracement level of the 2022-2023 decline crossing at 2.7273. First support is the 20-day moving average crossing at 2.4572. Second support the 50-day moving average crossing at 2.3930.
September unleaded gas closed sharply higher on Thursday as it extends the rally off May's low. The high-range close sets the stage for a steady to higher opening when Friday's day session begins trading. Stochastics and the RSI are overbought but remain neutral to bullish signaling that sideways to higher prices are possible near-term. If September extends the rally off the June 23rd low, April's high crossing at 2.6388 is the next upside target. Closes below the 20-day moving average crossing at 2.4544 would confirm that a short-term top has been posted. First resistance is today's high crossing at 2.6211. Second resistance is April's high crossing at 2.6388. First support is the 10-day moving average crossing at 2.4943. Second support is the 20-day moving average crossing at 2.4544.
September Henry natural gas closed lower on Thursday. The low-range close sets the stage for a steady to lower opening when Friday's day session begins trading. Stochastics and the RSI are turning neutral to bearish signaling that sideways to lower prices are possible near-term. Today's close below the 50-day moving average crossing at 2.551 open the door for a possible test of June's low crossing at 2.249. If September resumes the rally off June's low, the 25% retracement level of the 2022-2023 decline crossing at 3.193 is the next upside target.First resistance is the June high crossing at 2.911. Second resistance is the 25% retracement level of the 2022-2023 decline crossing at 3.193. First support is the 50-day moving average crossing at 2.551. Second support is the June 1st low crossing at 2.249.
CURRENCIES? http://quotes.ino.com/ex?changes/?c=currencies ""
The September Dollar closed sharply lower for the sixth day in a row on Thursday as it extended the decline off last-Thursday's high. The low-range close sets the stage for a steady to lower opening when Friday's session begins trading. Stochastics and the RSI are oversold but remain neutral to bearish signaling that sideways to lower prices are possible near-term. If September extends the decline off last-Thursday's high, weekly support on the weekly continuation chart crossing at 97.73 is the next downside target. Closes above the 50-day moving average crossing at 102.434 would signal that a short-term low has been posted. First resistance is the 50-day moving average crossing at 102.434. Second resistance is last-Thursday's high crossing at 103.275. First support is today's low crossing at 99.425. Second support is weekly support on the continuation chart crossing at 97.73.
The September Euro closed sharply higher on Thursday as it extended the rally off May's low. The high-range close sets the stage for a steady to higher opening when Friday's day session begins trading. Stochastics and the RSI are overbought bur remain neutral to bullish signaling that sideways to higher prices are possible near-term. If September extends the rally off last-Thursday's low, the March 30th high crossing at 1.15190 is the next upside target. Closes below the 50-day moving average crossing at $1.09364 would signal that a short-term top has been posted. First resistance is today's high crossing at $1.12630. Second resistance is the March 30th high crossing at 1.15190. First support is the 20-day moving average crossing at 1.09960. Second support is the 50-day moving average crossing at $1.09364.
The September British Pound closed sharply higher on Thursday as it extends this year's rally. The high-range close sets the stage for a steady to higher opening when Friday's day session begins trading. Stochastics and the RSI are overbought but remain neutral to bullish signaling sideways to higher prices are possible near-term. If September extends the rally off May's low, the 75% retracement level of the 2022-2023 decline crossing at 1.3253 is the next upside target. Closes below the 20-day moving average crossing at 1.2785 would signal that a short-term top has been posted. First resistance is today's high crossing at 1.3145. Second resistance is the 75% retracement level of the 2022-2023 decline crossing at 1.3253. First support is the 20-day moving average crossing at 1.2785. Second support is the 50-day moving average crossing at 1.2621.
The September Swiss Franc closed higher for the sixth day in a row on Thursday as it extends the rally off May's low The high-range close sets the stage for a steady to higher opening when Friday's day session begins trading. Stochastics and the RSI are overbought but remain neutral to bullish signaling that sideways to higher prices are possible near-term. If September extends the rally off May's low, the January 2021 high crossing at 1.17430 is the next upside target. Closes below the 50-day moving average crossing at 1.12815 would signal that a short-term top has been posted. First resistance is today's high crossing at 1.17320. Second resistance is the January 2021 high crossing at 1.17430. First support is the 50-day moving average crossing at 1.12815. Second support is the June 30th low crossing at 1.11790.
The September Canadian Dollar closed higher on Thursday as it extends the rally off last-Friday's low. The high-range close sets the stage for a steady to higher opening when Friday's day session begins trading. Stochastics and the RSI are neutral to bullish signaling that sideways to higher prices are possible near-term. If September extends this week's rally, the September 12th 2022 high crossing at 77.11 is the next upside target. Closes below the 10-day moving average crossing at 75.57 would signal that a short-term top has been posted. First resistance is the 38% retracement level of the 2021-2022 decline crossing at 76.28. Second resistance is the September 12th high crossing at 77.11. First support is the 50-day moving average crossing at 74.92. Second support is last-Friday's low crossing at 74.78.
The September Japanese Yen closed slightly higher for the sixth-day in a row on Thursday as it extends the rally off June's low. The high-range close sets the stage for a steady to higher opening when Friday’s day session begins trading. Stochastics and the RSI are overbought but remain bullish signaling that sideways to higher prices are possible near-term. If September extends the rally off June's low, the 38% retracement level of the January-June decline crossing at 0.074017 is the next upside target. Closes below the 10-day moving average crossing at 0.071086 would signal that a short-term top has been posted. First resistance is June's high crossing at 0.073430. Second resistance is the 38% retracement level of the January-June decline crossing at 0.074017 is the next upside target. First support is the 20-day moving average crossing at 0.071149. Second support is the 10-day moving average crossing at 0.071086.
PRECIOUS METALS? http://quotes.ino.com/ex?changes/?c=metals ""
August gold closed slightly higher on Thursday as it extends the rally off June's low. The high-range close sets the stage for a steady to higher opening when Friday's day session begins trading. Stochastics and the RSI are overbought but remain neutral to bullish signaling that sideways to higher prices are possible near-term. If August extends the rally off June's low, the 50-day moving average crossing at $1978.10 is the next upside target. If August resumes the decline off May's high, the 50% retracement level of the 2022-2023 rally crossing at $1892.30. First resistance is the 50-day moving average crossing at $1978.10. Second resistance is June's high crossing at $2000.70. First support is June's low crossing at $1911.40. Second support is the 50% retracement level of the 2022-2023 rally crossing at $1892.30.
September silver closed sharply higher for the second day in a row on Thursday as it extends the rally off June's low. The high-range close sets the stage for a steady to higher opening when Friday's day session begins trading. Stochastics and the RSI are overbought but remain neutral to bullish signaling that sideways to higher prices are possible near-term. If July extends the rally off June's low, the 75% retracement level of the April-June decline crossing at 25.561 is the next upside target. Closes below the 20-day moving average crossing at 23.414 would signal that a short-term top has been posted. First resistance is today's high crossing at 25.080. Second resistance is the 75% retracement level of the April-June decline crossing at 25.561. First support is the 50-day moving average crossing at 24.059. Second support is the 20-day moving average crossing at 23.414.
September copper closed sharply higher on Thursday as it extends the rally off the June 29th low. The high-range close sets the stage for a steady to higher opening when Friday's day session begins trading. Stochastics and the RSI are neutral to bullish signaling that sideways to higher prices are possible near-term. If September extends today's rally, June's high crossing at 3.9640 is the next upside target. Closes below the 50-day moving average crossing at 3.7897 would signal that a short-term top has been posted. First resistance is June's high crossing at 3.9640. Second resistance is May's high crossing at 4.0100. First support is June's low crossing at 3.6600. Second support is May's low crossing at 3.5650.
GRAINS? http://quotes.ino.com/ex?changes/?c=grains "
December Corn closed up $0.16 3/4-cents at $5.00 1/2.
December corn closed sharply higher on Thursday as follow through selling failed to materialize, which triggered a round of short covering today. The high-range close sets the stage for a steady to higher opening when Friday's night session begins trading. Stochastics and the RSI are oversold but remain bearish signaling that sideways to lower prices are possible near-term. If December extends the decline off June's high, the September 2022 low crossing at $4.62 1/2 is the next downside target. Closes above the 50-day moving average crossing at $5.31 would signal that a short-term low has been posted. First resistance is the 50-day moving average crossing at $5.31. Second resistance is the 20-day moving average crossing at $5.41 3/4. First support is today's low crossing at $4.81. Second support is the September 2022 low crossing at $4.62 1/2.
September wheat closed up $0.07-cents at $6.39 3/4.
September wheat closed higher on Thursday as it consolidated some of the decline off June's high. The high-range close sets the stage for a steady to higher opening when Friday's day session begins trading. Stochastics and the RSI are oversold but remain neutral to bearish signaling that sideways to lower prices are possible near-term. If September extends the decline off June's high, May's low crossing at $5.87 3/4 is the next downside target. Closes above the 20-day moving average crossing at $6.80 would signal that a short-term low has been posted. First resistance is the 20-day moving average crossing at $6.80. Second resistance is June's high crossing at $7.70 1/4. First support is today's low crossing at $6.22. Second support is May's low crossing at $5.87 3/4.
September Kansas City Wheat closed up $0.03-cents at $8.06.
September Kansas City wheat posted an inside day with a higher close on Thursday as it consolidated some of this week's decline. The high-range close sets the stage for a steady to higher opening when Friday's day session begins trading. Stochastics and the RSI are neutral to bearish signaling that sideways to lower prices are possible near-term. If September renews the decline off June's high, the July 3rd low crossing at $7.87 1/4 is the next downside target. Closes above Wednesday's high crossing at $8.27 3/4 would temper the near-term bearish outlook. First resistance is last-Thursday's high crossing at $8.55 3/4. Second resistance is June's high crossing at $8.89 1/2. First support is the July 3rd low crossing at $7.87 1/4. Second support is the June 14th low crossing at $7.76 3/4.
September Minneapolis wheat closed up $0.08 1/4-cents crossing at $8.61 3/4.
September Minneapolis wheat posted an inside day with a higher close on Thursday. The mid-range close sets the stage for a steady to higher opening when Friday's day session begins trading. Stochastics and the RSI are neutral to bullish signaling that sideways to higher prices are possible near-term. If September extends the rally off July's low, June's high crossing at $8.94 1/2 is the next upside target. Closes below the 50-day moving average crossing at $8.32 1/2 would temper the near-term friendly outlook. First resistance is Wednesday's high crossing at $8.71 1/2. Second resistance is June's high crossing at $8.94 1/2. First support is the 50-day moving average crossing at $8.32 1/2. Second support is July's low crossing at $8.07 1/4.
SOYBEAN COMPLEX? http://quotes.ino.com/ex?changes/?c=grains "
November soybeans closed up $0.42-cents at $13.69 3/4.
November soybeans posted an inside day with a sharply higher close on Thursday. The high-range close sets the stage for a steady to higher opening when Friday's day session begins trading. Stochastics and the RSI are turning neutral to bullish signaling that sideways to higher prices are possible near-term. If November renews the rally off the June 28th low, the 87% retracement level of the 2022-2023 decline crossing at $14.07 1/2 is the next upside target. Closes below the 20-day moving average crossing at $13.25 would signal that a short-term top has been posted. First resistance is last-Monday's high crossing at $13.91 3/4. Second resistance is the 87% retracement level of the 2022-2023 decline crossing at $14.07 1/2. First support is the 20-day moving average crossing at $13.25. Second support is the 50-day moving average crossing at $12.55 3/4.
December soybean meal closed up $9.50 at $399.90.
December soybean meal closed sharply higher on Thursday erasing all of Wednesday's losses. The high-range close sets the stage for a steady to higher opening when Friday's day session begins trading. Stochastics and the RSI are neutral to bullish signaling that sideways to higher prices are possible near-term. Closes above last-Monday's high crossing at $415.20 are needed to renew the rally off June's low. If December renews the decline off June's high, the June 29th low crossing at $374.60 is the next downside target. First resistance is the 75% retracement level of the March-May decline crossing at $418.80. Second resistance is June's high crossing at $438.90. First support is the June 29th low crossing at $374.60. Second support is the June 8th low crossing at $362.40.
December soybean oil closed up 191-pts. at 61.27.
December soybean oil closed sharply higher on Thursday as it extends the trading range of the past two-weeks.The high-range close sets the stage for a steady to higher opening when Friday's day session begins trading. Stochastics and the RSI are neutral to bullish signaling that sideways to higher prices are possible near-term. If December resumes the rally off May's low, January's high crossing at 61.68 is the next upside target. Closes below the 20-day moving average crossing at 57.57 would signal that a short-term top has been posted. First resistance is the 62% retracement level of the 2022-2023 decline crossing at 61.75. Second resistance is the 75% retracement level of the 2022-2023 decline crossing at 65.45. First support is the 20-day moving average crossing at 57.57. Second support is the 50-day moving average crossing at 52.57.
LIVESTOCKhttp://quotes.ino.com/exchanges/?c=livestock
August hogs closed up $1.03 at $96.38.
August hogs closed higher on Thursday. The high-range close sets the stage for a steady to higher opening when Friday's day session begins trading. Stochastics and the RSI are neutral to bullish signaling that sideways to higher prices are possible near-term. If August renews the rally off May's low, the 87% retracement level of the 2022-2023 decline crossing at $104.40 is the next upside target. Closes below the 20-day moving average crossing at $93.05 would signal that a short-term top has been posted. First resistance is the 75% retracement level of the 2022-2023 decline crossing at $100.14. Second resistance is the 87% retracement level of the 2022-2023 decline crossing at $104.40. First support is the 20-day moving average crossing at $93.05. Second support is the 50-day moving average crossing at $87.69.
August cattle closed up $0.10 at $176.98.
August cattle closed slightly higher on Thursday. The high-range close sets the stage for a steady to higher opening on Friday. Stochastics and the RSI are turning neutral to bearish signaling that a short-term top might be in or is near. Closes below the 20-day moving average crossing at $173.70 would temper the near-term friendly outlook. If August extends this year's rally into uncharted territory, upside targets will be hard to project. First resistance is Wednesday's high crossing at $181.18. Second resistance is unknown. First support is the 20-day moving average crossing at $173.85. Second support is the June 21st low crossing at $168.10.
August Feeder cattle closed down $1.20 at $245.38.
August Feeder cattle closed lower on Wednesday. The mid-range close sets the stage for a steady to lower opening when Friday's day session begins trading. Stochastics and the RSI are overbought, diverging and are turning neutral to bearish signaling that sideways to higher prices are possible near-term. Closes below the 20-day moving average crossing at $239.87 would signal that a short-term top has been posted. If August extends the rally off June's low into uncharted territory, upside targets will be hard to project. First resistance is Wednesday's high crossing at $251.30. Second resistance is unknown. First support is the 20-day moving average crossing at $239.87. Second support is the June 27th gap crossing at $235.25.
FOOD & FIBERhttp://quotes.ino.com/ex changes/?c=food
September coffee closed slightly higher on Thursday. The mid-range close sets the stage for a steady to higher opening on Friday. Stochastics and the RSI are oversold but remain neutral to bearish signaling sideways to lower prices are possible near-term. If September extends the decline off June's high, the 87% retracement level of the January-April rally crossing at $15.20 is the next downside target. Closes above the 20-day moving average crossing at $16.57 would signal that a short-term low has been posted. First resistance is the 20-day moving average crossing at $16.57. Second resistance is the 50-day moving average crossing at $17.59. First support is the 75% retracement level of the January-April rally crossing at $15.88. Second support is the 87% retracement level of the January-April rally crossing at $15.20.
September cocoa closed sharply lower on Thursday and below the 20-day moving average crossing at 32.84 signaling that a short-term top has been posted. The low-range close sets the stage for a steady to lower opening on Friday. Stochastics and the RSI are neutral to bearish signaling that sideways to lower prices are possible near-term. If September extends this week's decline, the 50-day moving average crossing at 31.29 is the next downside target. If September renews the rally off March's low, monthly resistance crossing at 34.29 is the next upside target.
October sugar closed slightly higher on Thursday as it extends the rally off June's low. The mid-range close sets the stage for a steady to higher opening on Friday. Stochastics and the RSI are neutral to bullish signaling that sideways to higher prices are possible near-term. Closes above the 20-day moving average crossing at 24.04 would signal that a short-term low has been posted. If October renews the decline off June's high, the 50% retracement level of the October-April rally crossing at 21.34 is the next downside target.
December cotton closed slightly higher on Thursday. The mid-range close sets the stage for a steady to higher opening on Friday. Stochastics and the RSI are turning neutral signaling sideways to higher prices are possible near-term. If December extends the rally off June's low, May's high crossing at 84.30 is the next upside target. Closes below Monday's low crossing at 78.97 would signal that a short-term top has been posted.
Thanks, tallpine!
An already dry-ish forecast for the northwestern 1/2 of the Cornbelt (Upper Midwest/N.Plains/WCB) got even drier overnight and turned the market very bullish..........even without intense heat or a dome of death.
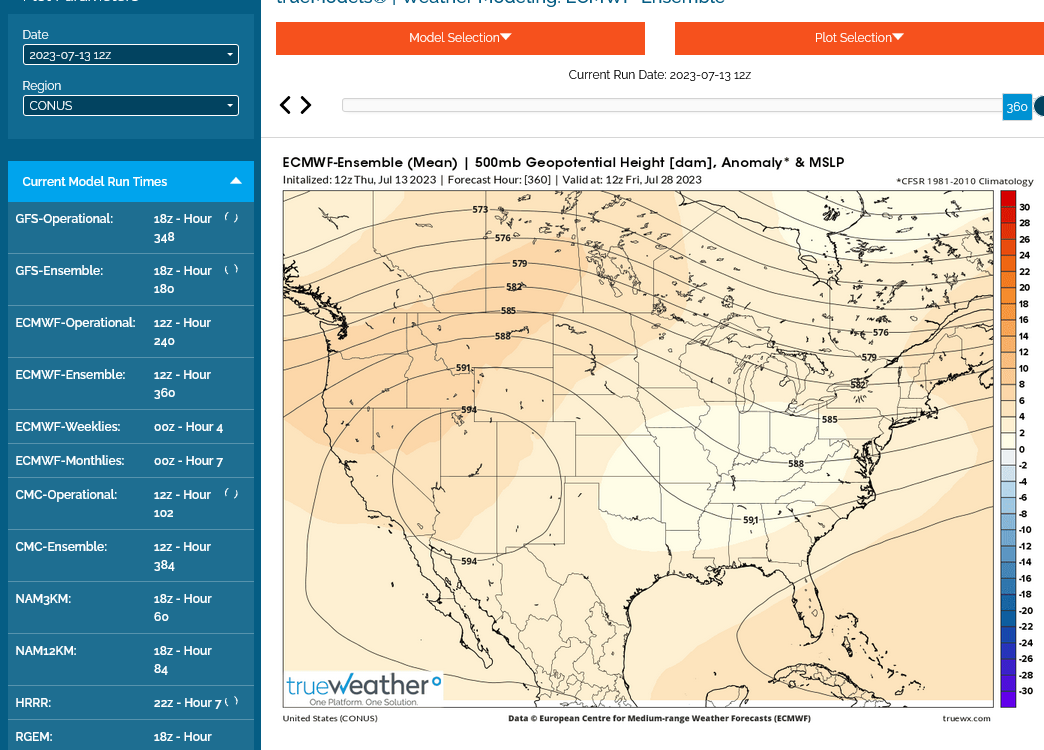
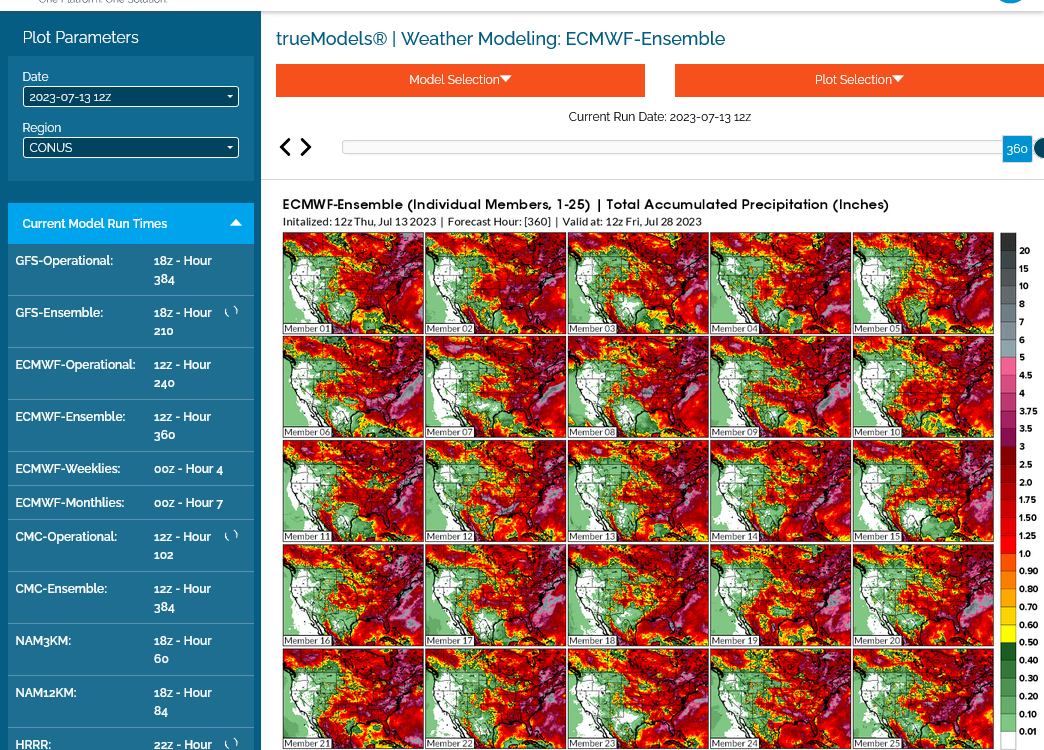
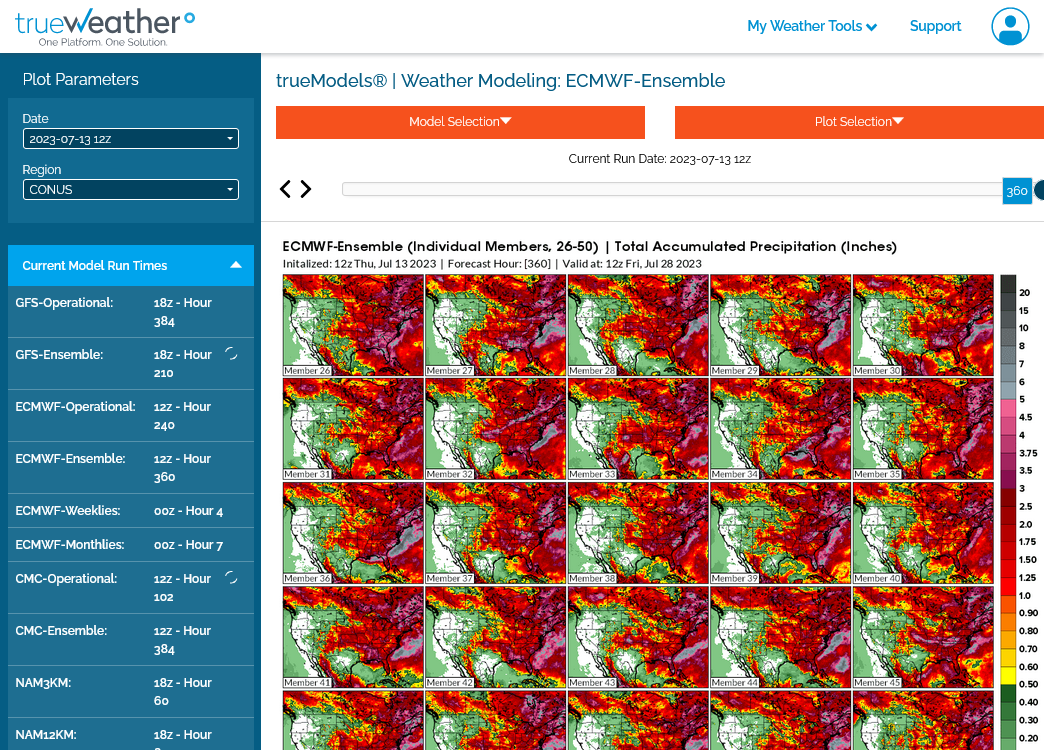
1. Last 12z European model ensemble for 360 hours. Dome in the southwest with northwest flow in the Midwest. Some heat in the N.Plains. Sometimes that can lead to active rain events in the Cornbelt. However, the dynamics this time don't look favorable.
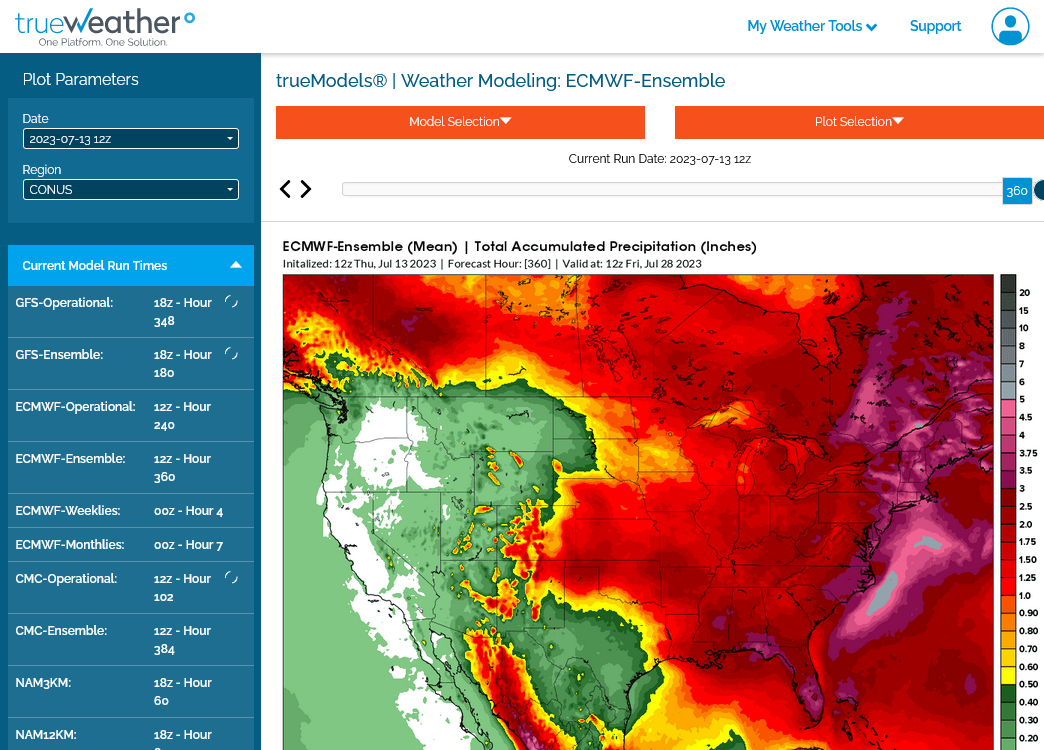
2. 12z EE(European) 360 hour rains.
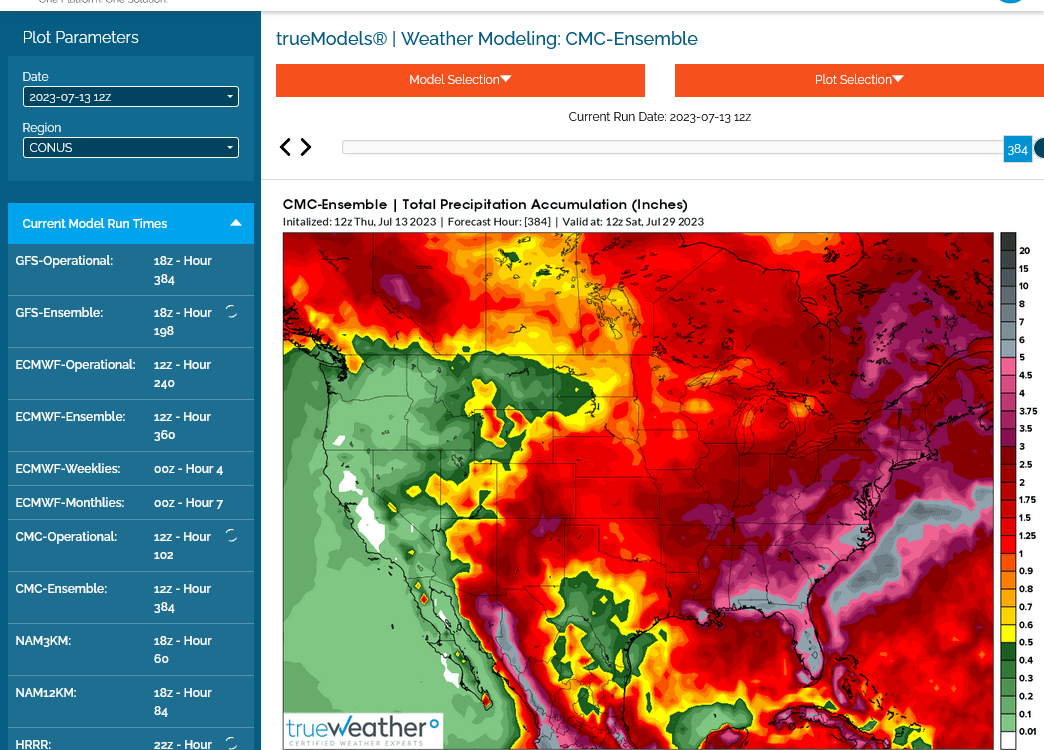
3. 12z CMC(Canadian) model for 360 hour rain.
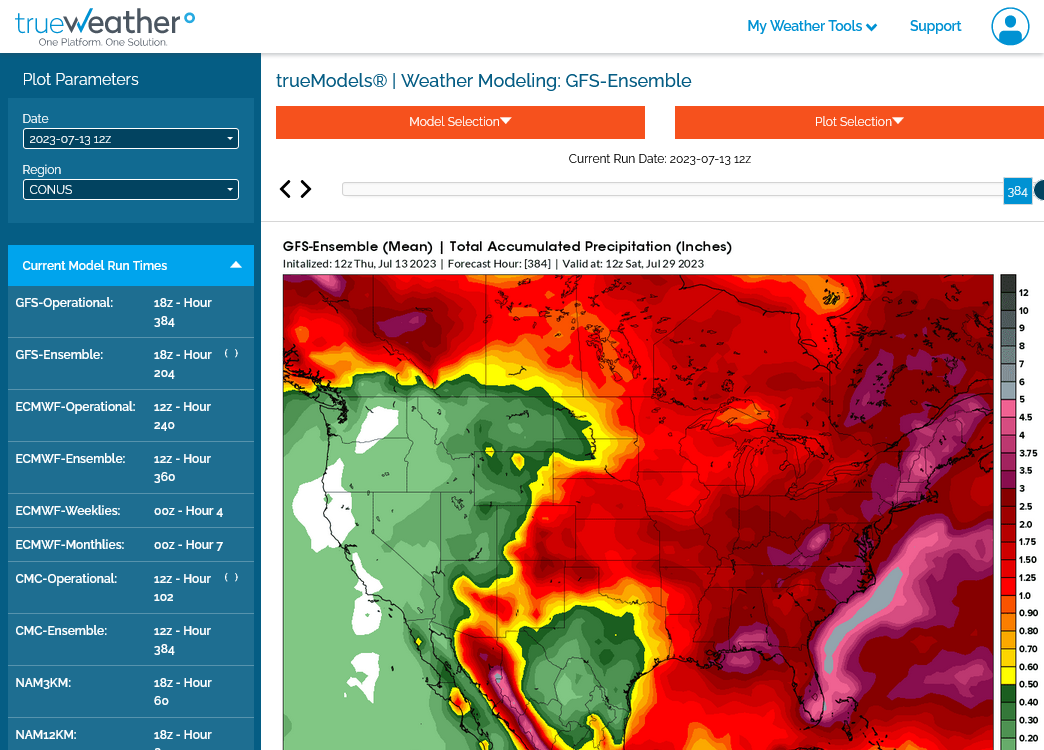
4. 12 GEFS(United States) model for 360 hour rain.
5. 50 Individual EE solutions.
Weather map now.
In 24 hours and
In 48 hours.
https://www.wpc.ncep.noaa.gov/#

+++++++++++++++++++++++++++++++++++++++++++++++++
Surface Weather maps for days 3-7 below:
https://www.wpc.ncep.noaa.gov/medr/medr.shtml

+++++++++++++++++++++++++++++++++++++++++++
The latest 7 day precip forecasts are below.
Day 1 below:
http://www.wpc.ncep.noaa.gov/qpf/fill_94qwbg.gif?1526306199054

Day 2 below:
http://www.wpc.ncep.noaa.gov/qpf/fill_98qwbg.gif?1528293750112

Day 3 below:
http://www.wpc.ncep.noaa.gov/qpf/fill_99qwbg.gif?1528293842764

Days 4-5 below:
http://www.wpc.ncep.noaa.gov/qpf/95ep48iwbg_fill.gif?1526306162

Days 6-7 below:
http://www.wpc.ncep.noaa.gov/qpf/97ep48iwbg_fill.gif?1526306162

7 Day Total precipitation below:
http://www.wpc.ncep.noaa.govcdx /qpf/p168i.gif?1530796126

Extended weather.
https://www.cpc.ncep.noaa.gov/products/predictions/610day/ | |||||||||
| 6 to 10 day outlooks | |||||||||
| Click below for information about how to read 6-10 day outlook maps Temperature Precipitation | |||||||||
| Click below for archives of past outlooks (data & graphics), historical analogs to todays forecast, and other formats of the 6-10 day outlooks ArchivesAnalogsLines-Only FormatGIS Data | |||||||||
Temperature Probability | |||||||||
Precipitation Probability | |||||||||
All the weather is here:
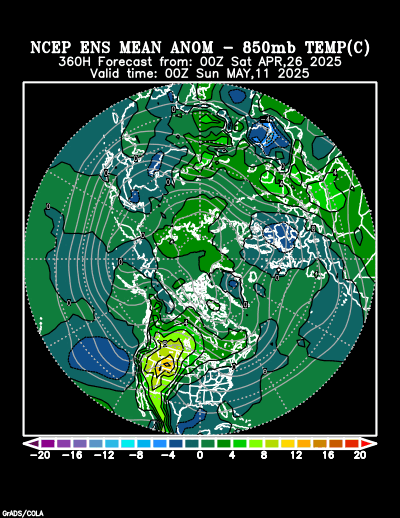
I noted this anomaly map too overnight. This suggests the potential for the dome and heat to shift into the Midwest at the end of the 2 week period, replacing the trough.
Keep in mind that northwest flow is really tricky. An amplification or the trough backing up can turn things much wetter...........or if it goes the other way, then the potential mentioned above is realized and we have dry with HEAT.
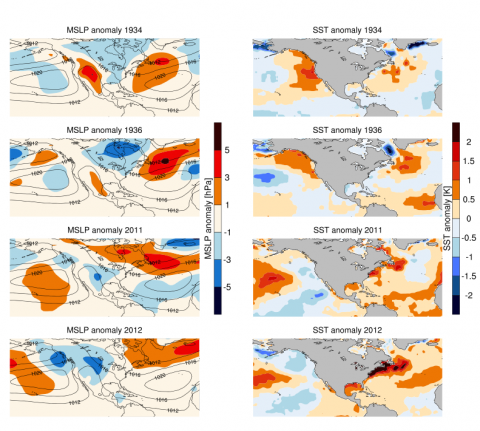
The El Nino analog is for good rains in the growing season but we have an extremely odd temp configuration in the Pacific right now with this El Nino......having COLD water off the West Coast which is usually a La Nina type feature that increases hot/dry risks.
Also, the very warm Atlantic Ocean. Some scientists think the warm W.Atlantic temps caused the Dust Bowl and also droughts in other years.
Sea surface temperatures
Started by metmike - July 12, 2023, 4:43 p.m.
https://www.marketforum.com/forum/topic/97149/
https://earthsky.org/earth/warm-oceans-triggered-us-dust-bowl/
GFS ensemble mean anomalies at 2 weeks.
https://www.psl.noaa.gov/map/images/ens/z500anom_nh_alltimes.html 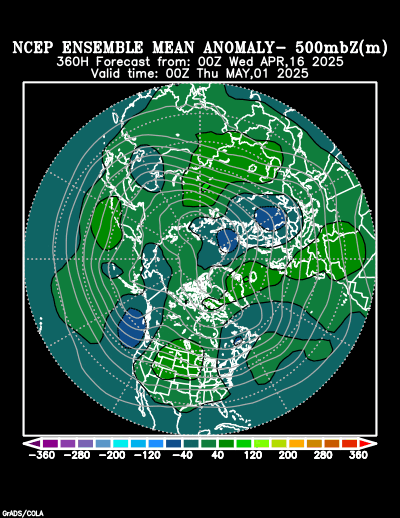
2 week 850 temp for ensemble mean anomaly
https://www.psl.noaa.gov/map/images/ens/t850anom_nh_alltimes.html
Since I love to take advantage of our site being able to show graphics, here's the entire page from this link:
https://www.marketforum.com/forum/topic/97149/#97201
Many scientists think that the warm waters in the Atlantic are what caused the Dust Bowl and other droughts in the US.
https://earthsky.org/earth/warm-oceans-triggered-us-dust-bowl/

NASA EXPLAINS THE DUST BOWL DROUGHT
https://www.nasa.gov/centers/goddard/news/topstory/2004/0319dustbowl.html

+++++++++++++
https://www.marketforum.com/forum/topic/56668/#56673
https://www.marketforum.com/forum/topic/67004/

+++++++++++++++
https://www.marketforum.com/forum/topic/87422/#87425

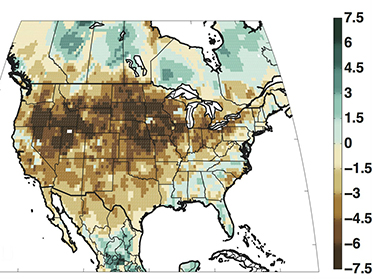
Speaking of heat, almost half of the all time hottest temperatures for each individual state were set in the 1930's AND STILL STAND in 2023.
https://en.wikipedia.org/wiki/U.S._state_and_territory_temperature_extremes
Since this graph above was made, in the last 20 years (since 2000) the following states have made their all time record highs: CO, SD, SC, OR and WA.
++++++++++++++++++++++++++++++
The 18z GEFS coming out, so far thru 300 hours has added a bit of rain, maybe 1/2 inch in many places that are the driest but its one solution.
When its completely out in 30+ minutes, I'll post it.
The next solution could be drier again, what matters is what ALL the solutions show overnight.
This one will be completely forgotten on Friday morning.
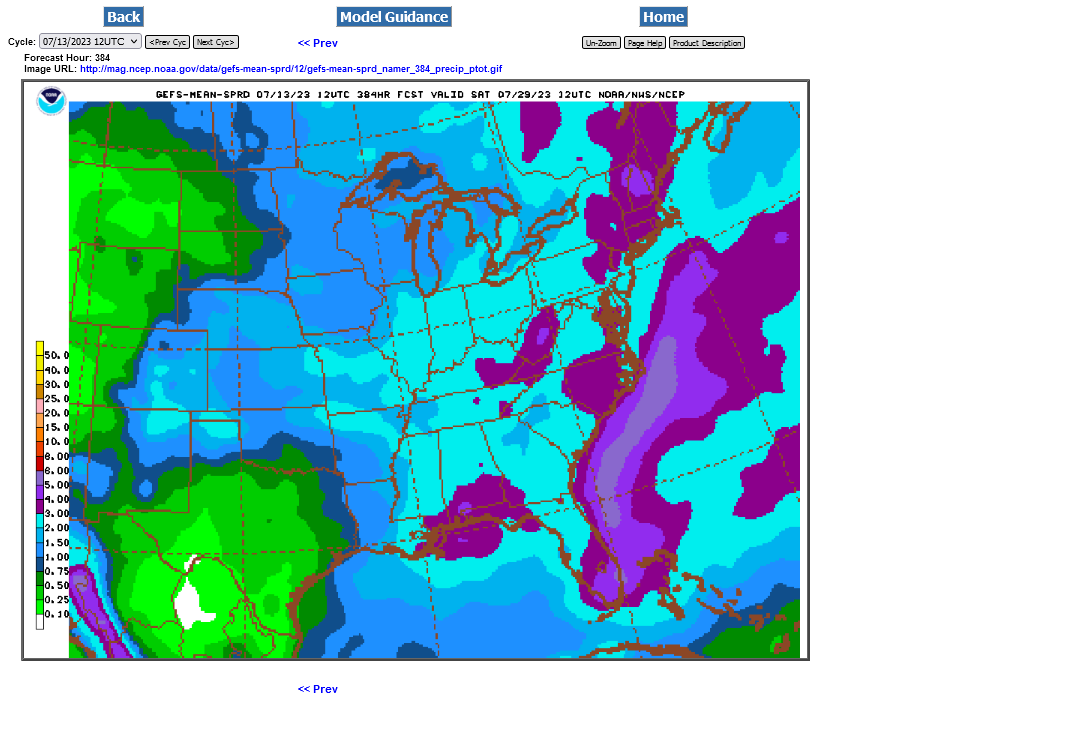
OK, the previous maps were from a paid service. They have a wonderful service but I don't like their color bars for precip using so much yellow and red.
These maps are from the GEFS/American model thats free here. I zoomed way in. We can see an increase of around .5 inches in many places. It might be hard to tell but if you just look at the outer edge of the light blue, which is the 2"+ color, you can see it expanding to cover up much of MI, the rest of IL, the rest of MO and the eastern 1/2 of KS compared to the previous run.
Still not enough rain for the northwest 1/2 of the Cornbelt but it's clearly wetter.
I will guess that this is at least part of the reason that corn is -2c and beans -4c.
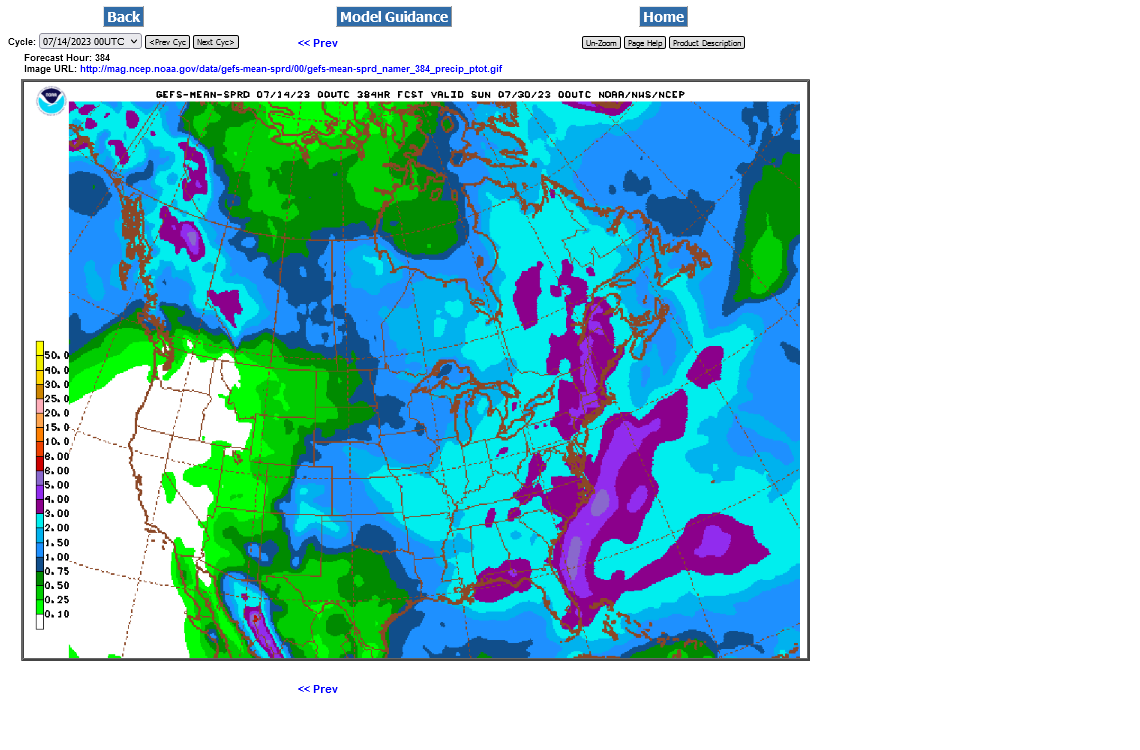
https://mag.ncep.noaa.gov/Image.php
1. Previous 12z run total rains out to 384 hours.
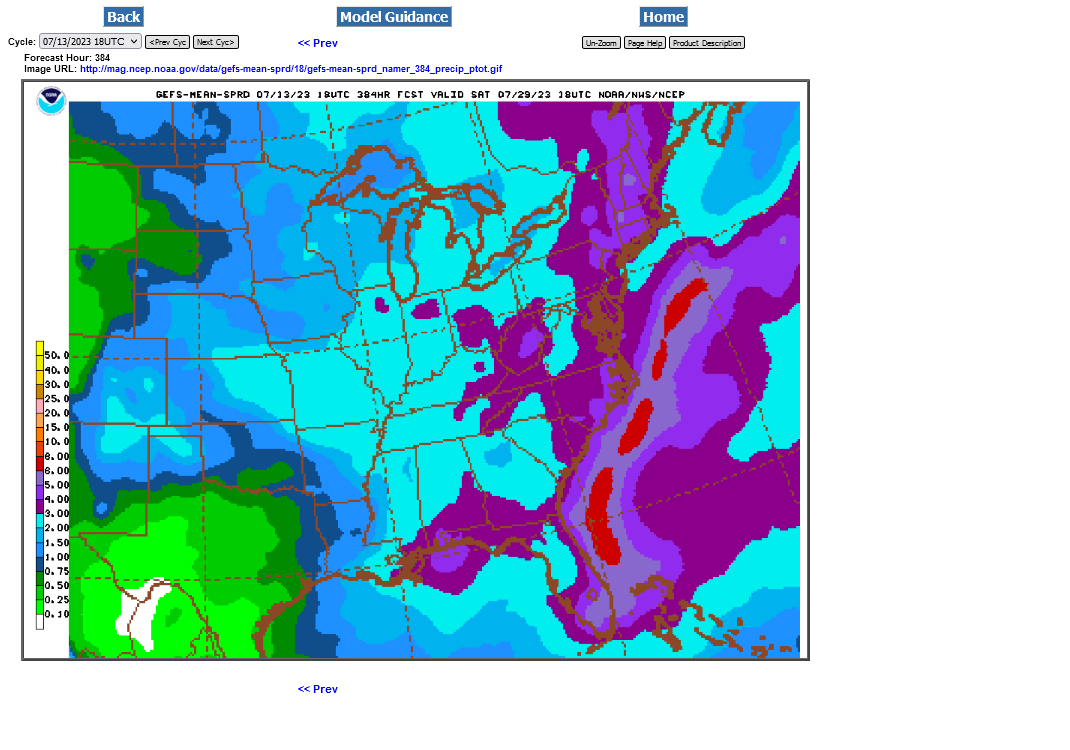
2. Latest 18z run total rains out to 384 hours.
This was the just out Canadian model ensembles with each member.
More than half the members are bearish.
The market doesn't usually put alot of weight on this model.
384h GZ 500 forecast valid on Jul 29, 2023 00 UTC


The European model was MUCH drier than all the other models. After it came out, the grains completely turned around after being under some selling pressure.
pill show later this morning back in my office
The European model was MUCH drier than all the other models. After it came out, the grains completely turned around after being under some selling pressure.
pill show later this morning back in my office

