This discussion focuses mainly on WINDS.
There still will be some additional reports on Ian's highest winds from surface observations but the number that are in so far, represent a wide geographic sample over the entire path from the west coast to the east coast.
Reporting/analysis on Irma was finalized several years ago.
I thought that it would be interesting to compare wind reports from the 2 I hurricanes. Irma in September 2017 and Ian, 5 years later in September 2022.
Irma was a massive hurricane and much bigger size-wise compared to Ian, so the winds would have taken longer to slow down from friction and Irma also maintained part of it's circulation over the warm ocean than what happened to Ian, which lost peak strength extremely fast. I contend that this was rapidly happening even before Ian was making landfall, since half of the circulation was already over land and accurate, land based anemometers show us readings that are in a different ball park for Ian compared to Irma from landfall to numerous hours afterwards.
Track of Ian, a strong cat. 4 at landfall, just 2 days ago with 150 mph SUSTAINED winds(7 mph from cat. 5-the highest/strongest category) at that time according to sources.
https://en.wikipedia.org/wiki/Hurricane_Ian

Track of Irma. A weak cat. 3 at landfall (on Florida's peninsula-after making brief landfall on the Keys) with sustained winds of 115 mph. This is 35 mph LESS than Ian's stated strength at landfall and almost 2 categories weaker.
https://en.wikipedia.org/wiki/Meteorological_history_of_Hurricane_Irma

As a result, Ian has been classified/listed as the 4th strongest Florida hurricane in history at landfall with Irma being down lower at 10th on the list.
On this list below, the 130 mph wind speed occurred at Cudjoe Key. Irma's Florida peninsula, top sustained wind speed was 115 mph.
https://en.wikipedia.org/wiki/List_of_Florida_hurricanes
upon striking land. | |||||
|---|---|---|---|---|---|
| Source: HURDAT,[5] Hurricane Research Division,[10] NHC[14] | |||||
| mph | km/h | ||||
| Rank | Hurricane | Season | Wind speed | ||
| Strongest landfallingtropical cyclones in the U.S. state of Florida | |||||
| 1 | "Labor Day" | 1935 | 185 | 295 | |
| 2 | Andrew | 1992 | 165 | 270 | |
| 3 | Michael | 2018 | 160 | 260 | |
| 4 | "Florida Keys" | 1919 | 150 | 240 | |
| Charley | 2004 | ||||
| Ian | 2022 | ||||
| 7 | "Miami" | 1926 | 145 | 230 | |
| "Okeechobee" | 1928 | ||||
| Donna | 1960 | ||||
| 10 | "Homestead" | 1945 | 130 | 215 | |
| "Fort Lauderdale" | 1947 | ||||
| "Florida" | 1948 | ||||
| "Florida" | 1949 | ||||
| King | 1950 | ||||
| Irma | 2017 | ||||
https://www.nhc.noaa.gov/aboutsshws.php
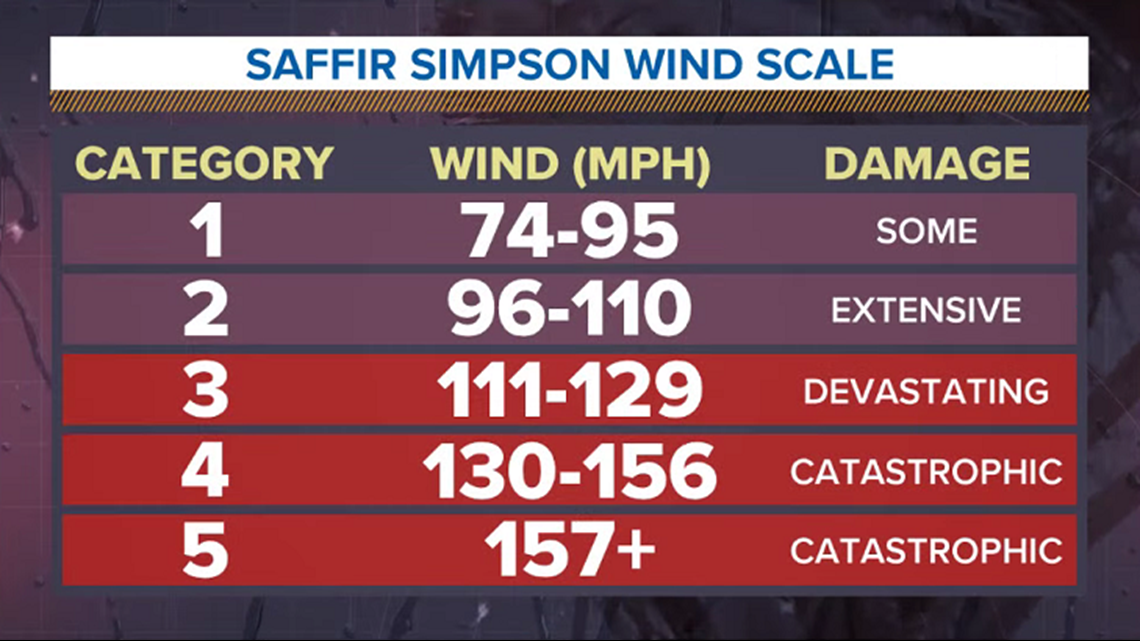
So we have Ian, the 150 mph hurricane at landfall and Irma the 115 mph hurricane at landfall.
+++++++++++++++++++++++++++++++++++++++
Wind damage goes up exponentially with wind speed. Let's see how much more damage that a 150 mph wind will do compared to a 115 mph wind:
https://www.weather.gov/jetstream/tc_potential
| Category | Wind Speed | Damage Potential Multiplier | ||
|---|---|---|---|---|
| mph | km/h | knots | ||
| 1 | 75 | 121 | 65 | 1x |
| 80 | 129 | 70 | 1.6x | |
| 85 | 137 | 74 | 2.9x | |
| 90 | 145 | 78 | 4.3x | |
| 95 | 153 | 83 | 6.6x | |
| 2 | 100 | 161 | 87 | 10x |
| 105 | 169 | 91 | 15x | |
| 110 | 177 | 96 | 21x | |
| 3 | 115 | 185 | 100 | 30x |
| 120 | 193 | 104 | 43x | |
| 125 | 201 | 109 | 60x | |
| 4 | 130 | 209 | 113 | 82x |
| 135 | 217 | 117 | 110x | |
| 140 | 225 | 122 | 147x | |
| 145 | 233 | 126 | 195x | |
| 150 | 241 | 130 | 256x | |
| 155 | 249 | 135 | 333x | |
| 5 | 160 | 257 | 139 | 429x |
| 165 | 266 | 143 | 549x | |
| 170 | 274 | 148 | 697x | |
| 175 | 281 | 152 | 879x | |
| 180 | 290 | 156 | 1101x | |
| 185 | 298 | 161 | 1371x | |
| 190 | 306 | 165 | 1696x | |
When asked to rate potential damage from a category one hurricane to a category two or three storm most people's results are often linear in increasing damage.
However, since the potential damage increase from category to category is logarithmic then small increases in wind strength can dramatically increase damage.
When the cost from hurricane related damages are normalized (normalization takes into account inflation, changes in population, and changes in wealth to arrive at a common level for comparison) the result shows an eighth-power increase1 in damages from category to category.
What this means is the potential damage from a hurricane is 28 power. For example, a doubling of the wind speed from 75 mph (121 km/h) to 150 mph (241 km/h) is not a doubling or quadrupling of potential damage but a 256 times increase (2 x 2 x 2 x 2 x 2 x 2 x 2 x 2=256).
This is evident in that over 85% of all damages from hurricanes come from category three, four, and five storms, yet these storms make up only 24% of all landfalling storms2.
This table shows the rate of increase for various wind speeds in a hurricane as compared to a minimal 75 mph (121 km/h) category one hurricane. These values indicate the multiple increase in damage potential ABOVE damage that occurs with a 75 mph hurricane.
Remember, damage WILL occur with a 75 mph (121 km/h) hurricane. The multiplier values are the potential damage increases above what could occur with a 75 mph (121 km/h) storm. Note the rapid increase in potential damage just within each category. A 95 mph hurricane can produce nearly seven times the damage as a 75 mph (121 km/h) hurricane.
The increase in damage from a 150 mph wind(256Xmultiplier) compared to a 115 mph wind(30X multiplier) is over 8X greater.
Update to include new Ian data from WxFollower from this source:
Underlined descriptions below are those that have been edited to dial in the new data, which included 5 more reports of wind gusts of 100+ for instance.
https://www.wkbn.com/weather/ians-highest-wind-gusts-tornadoes-in-florida/amp/
+++++++++++++
This is the main source for Irma data:
https://www.weather.gov/mfl/hurricaneirma
Here's one of the sources for Ian data. This data had been accumulated thru the first 12 hours after landfall and would have captured all the peak winds of the entire event that occurred during that time frame(which were all the strongest winds).
https://www.marketforum.com/forum/topic/89131/#89323
I also looked at all the hourly weather history from individual NWS sites from here:
We don't have a great deal of sustained wind velocity data yet for Ian but we do have very extensive highest wind gust data from 7 dozen reporting sites in the path of Ian(that includes many hundreds of hourly reports). This gives us a wonderful look at wind gusts exactly at the locations where we want to know them. The updated data below includes wind gusts along the northeast coast of Florida that were absent in the initial analysis.
Here's what I found with wind gusts. Remember, Ian is stated to be 150 mph at landfall and the NHC maintained that maximum sustained winds were still 115 mph, 3 hours after landfall and were still sustained at 90 mph, 6 hours after landfall. NO WAY!
Number of locations with that wind speed
Wind speed of GUSTS(sustained winds much lower) Irma Ian
140+ mph 1 1
130+ mph 2 2
120+ mph 4 3
110+ 6 4
100+ 11 12
90+ 25 17
80+ 52 31
74+ hurricane strength gusts NOT sustained for 1 minute 80 57
Interpretation:
1. Despite Ian being called the 4th strongest hurricane(at landfall) and Irma shown to be the 10th strongest, the data shows that Irma was the stronger hurricane. The difference between the 2 has shrunk, thanks to Larry's update. It also includes wind gusts on the Northeast Coast of Florida that were not there in the first analysis shortly after Ian had hit.
2. Irma did traverse a bigger area across the state which is responsible for some of this. Also, Irma was MUCH larger/wider and still had part of its circulation over water as it tracked across the entire state from south to north. However, Ian had almost no sustained, minimal hurricane(cat. 1) winds except for a few locations right along the coast for a very brief time, when it was supposed to have near 150 mph winds.
3. Irma had the same or more reports of extremely high winds at every velocity(except 1 less report at 100+ mph).
4. Keep in mind that SUSTAINED winds were much less than these wind GUSTS. When the NHC was stating SUSTAINED winds were 115 mph, 3+ hours after landfall, highest wind GUSTS at the surface were 91/89 mph...by their own reporting!!!
5. In the past, there has also been a disparity between higher sustained winds reported by the NHC and those measured on the ground by the NWS and other anemometers. Much of this is of the NHC using wind measuring techniques/instruments that work over the data sparse oceans, then trying to be consistent in using the same technique over land at the expense of not giving enough weighting to land based anemometers. Tropical cyclone wind speeds today are measured by aircraft reconnaissance, a task carried out by the 53rd Weather Reconnaissance Squadron and NOAA Hurricane Hunters. Dropsondes, parachute borne sensors dropped from the plane, obtain meteorological information. This is done at flight-level, which is approximately 850 mb (~5,000 ft.) in altitude. To estimate the 10-meter one-minute Vₘₐₓ, there is a 10% reduction to account for surface friction. However, with Ian this disparity was MUCH greater than any other time in the past. This thread, demonstrates that difference exactly comparing reliable data sources for both hurricanes. Irma's surface wind observations were at least 30 mph closer to the NHC wind statements during most of the event. Sustained surface winds with Ian were 30-50+ mph LESS than what the NHC claimed for 6 hours after landfall.
6. This is not intended to bash the National Hurricane Center. They can never be thanked or appreciated enough for what they do. The NHC has saved many thousands of lives. Without them, operational meteorologists like myself would not be nearly as effective in disseminating the profoundly critical and informative tropical weather information to the public in timely fashion. On a personal note, I flew into Hurricane Gloria with a team of their meteorologists in a hurricane hunter in September 1985. They are awesome!
https://www.marketforum.com/forum/topic/89131/#89306
https://www.marketforum.com/forum/topic/89131/#89321
7. The main reason to reveal the truth about Hurricane Ian's real strength is because the media and others are trying to maximize another opportunity to exaggerate winds of Hurricane Ian. For the last 2 days, the narratives have been about Ian being the 4th strongest hurricane in Florida history and it was caused by climate change.
8. There was also an extremely heavy rain event that everyone is calling a 1 in 1,000 year rain event. I addressed that yesterday. https://www.marketforum.com/forum/topic/89333/
9. There was also an extremely powerful storm surge.......one of the biggest ever. The combination of the storm surge and heavy rains caused compound flooding which resulted in most of the deaths. Not the winds.
https://www.marketforum.com/forum/topic/89399/
We should have compassion for those in the path and provide as much assistance as possible.
10. Considering how bad these conditions are in truth, there is no need to exaggerate or embellish on the facts defining that truth to make them appear to be even worse.
11. Almost all the catastrophic damage and most of the deaths from Ian occurred along the southwest coast from the STORM SURGE, not the winds.
12. Thank you WxFollower for the additional weather gust information!
13. Additional statement from NHC at 8pm, when they state that Ian was still a cat. 3 with 115 mph sustained winds but strangely site the highest wind GUSTs of 91 mph and 89 mph and a sustained surface wind of 54 mph. This completely contradicts their cat. 3 hurricane statement and confirms my case above that Ian was NOT nearly as strong as their discussions claimed.
DISCUSSION AND OUTLOOK ---------------------- At 800 PM EDT (0000 UTC), the eye of Hurricane Ian was located near latitude 27.2 North, longitude 81.7 West. Ian is moving toward the north-northeast near 8 mph (13 km/h). On the forecast track, the center of Ian is expected to move across central Florida tonight and Thursday morning and emerge over the western Atlantic by late Thursday. Ian is forecast to turn northward on Friday and approach the northeastern Florida, Georgia and South Carolina coasts. Maximum sustained winds have decreased to near 115 mph (185 km/h) with higher gusts. Ian is a category 3 hurricane on the Saffir-Simpson Hurricane Wind Scale. Further weakening is expected for the next day or so, but Ian could be near hurricane strength when it moves over the Florida East coast tomorrow, and when it approaches the northeastern Florida, Georgia and South Carolina coasts on Friday. Hurricane-force winds extend outward up to 50 miles (85 km) from the center and tropical-storm-force winds extend outward up to 175 miles (280 km). A University of Florida Coastal Monitoring Program wind tower near Punta Gorda recently reported sustained winds of 54 mph (87 km/h) with a gust to 91 mph (146 km/h). A private weather station in Joshua recently measured a wind gust to 89 mph (143 km/h). The estimated minimum central pressure is 960 mb (28.35 inches).
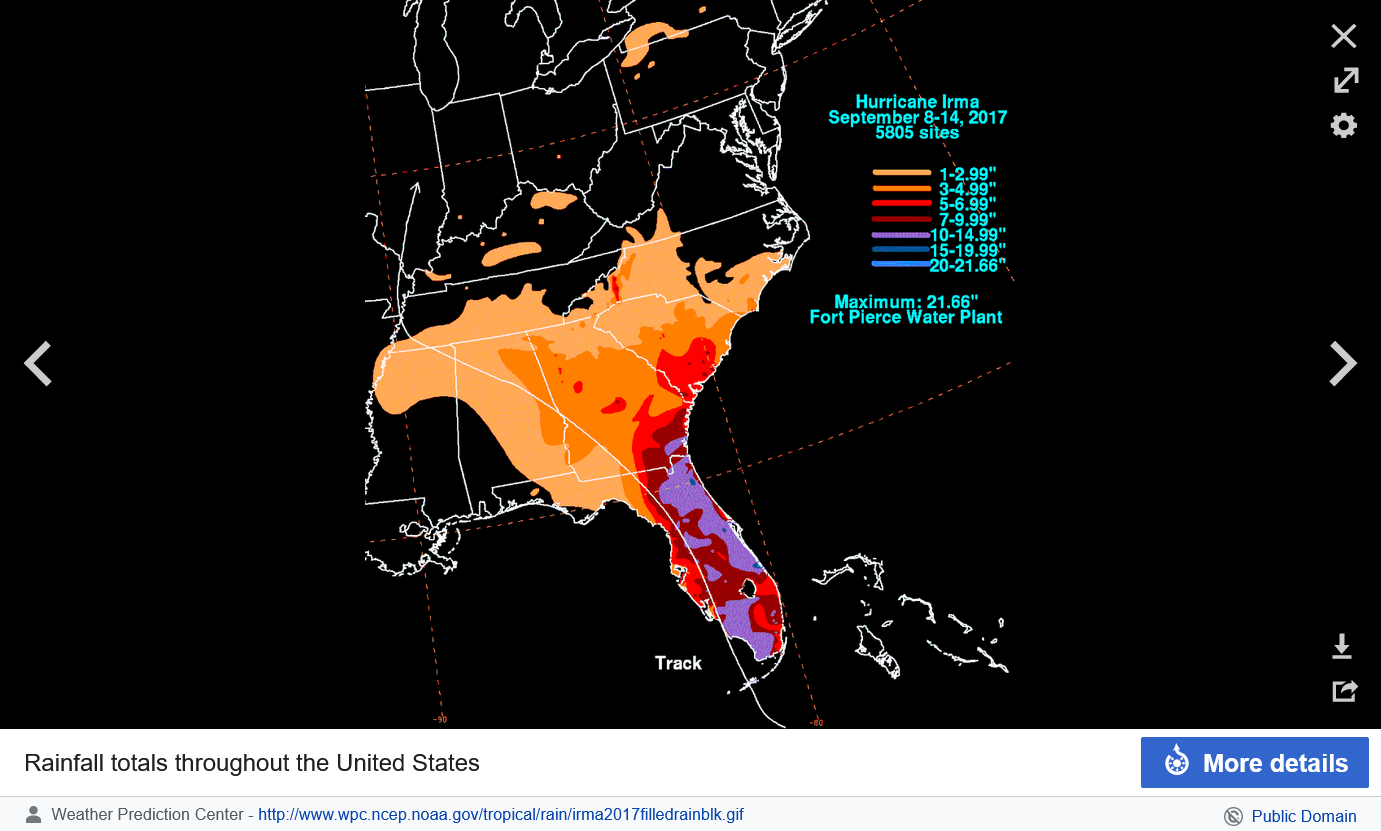
Here's some nice graphics on Irma, related to rain amounts including an awesome radar loop:
https://www.weather.gov/chs/TropicalStormIrma-Sep2017
These were rains from Irma below. Massive area of 10+ inches that included much of the area from the southern border to the northeast border. 50% of the Peninsula. 3 isolated spots with more than 20 inches.
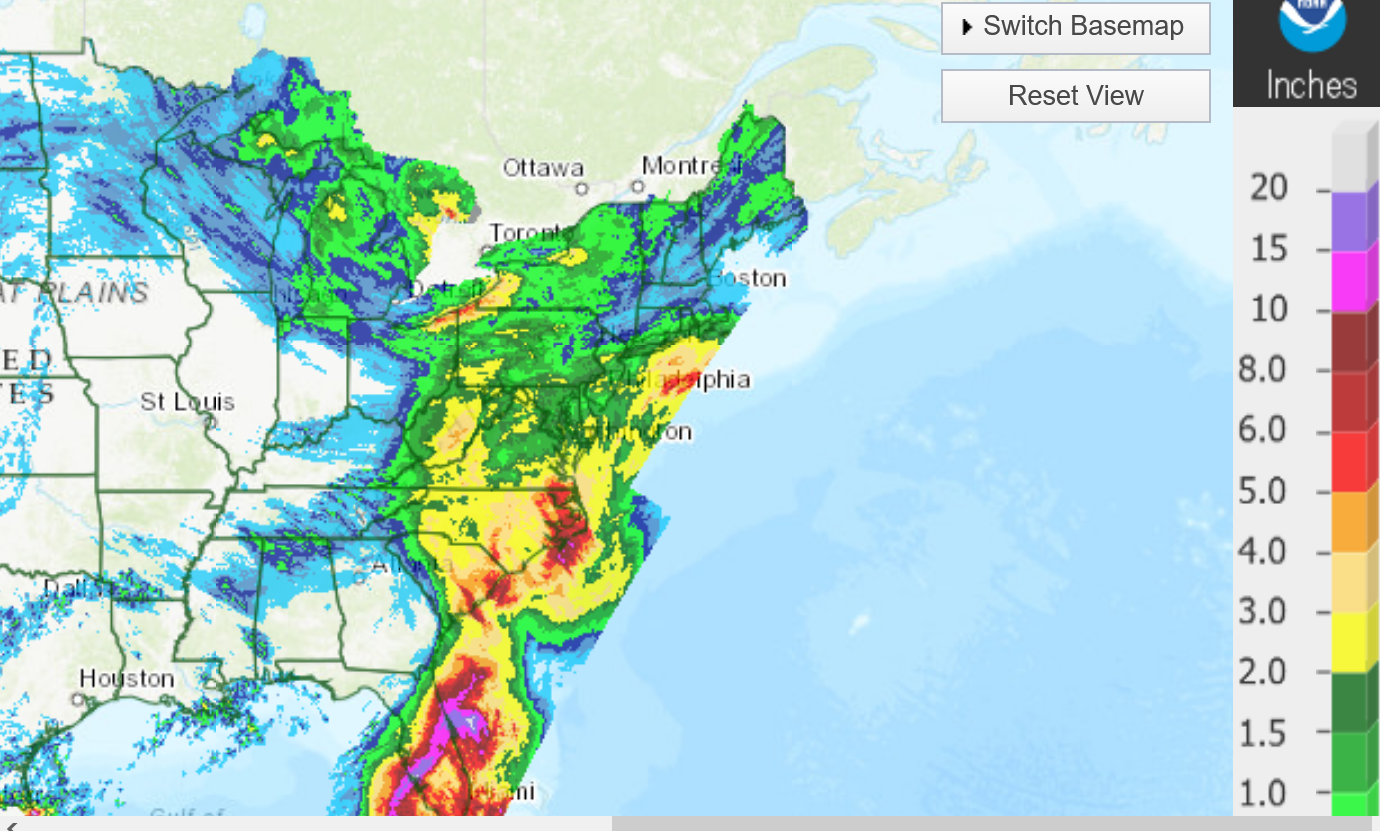
Hurricane Ian rainfall totals below:
Very narrow, west to east band of 10+ inches. maybe 20%? of the peninsula? 1 isolated amount of 20+ inches, just south of Tampa. Not nearly as much rain as Irma.
https://water.weather.gov/precip/
So if Ian didn't have winds as strong as Irma and rains were similar, why are there so many fatalities with Ian?
Great question!
Something called compound flooding. Storm surge and extremely heavy rains.
Ian's death toll/Extreme Storm Surge/Contribution from Climate Change
https://www.marketforum.com/forum/topic/89399/
“Storm surge is gonna be what this storm is remembered for.”
Additionally,
The correlation between barometric pressure and intensity is indisputable. Even better than wind. We should note that on the list below, that 6 of the 10 most intense landfalling hurricanes in Florida happened BEFORE 1961!
https://en.wikipedia.org/wiki/List_of_Florida_hurricanes
| Source: HURDAT,[5] Hurricane Research Division[10] | |||
|---|---|---|---|
| Rank | System | Season | Landfall pressure |
| Most intenselandfalling tropical cyclones in the U.S. state of Florida Intensity is measured solely by central pressure | |||
| 1 | "Labor Day" | 1935 | 892 mbar (hPa) |
| 2 | Michael | 2018 | 919 mbar (hPa) |
| 3 | Andrew | 1992 | 922 mbar (hPa) |
| 4 | "Florida Keys" | 1919 | 927 mbar (hPa) |
| 5 | "Okeechobee" | 1928 | 929 mbar (hPa) |
| 6 | "Great Miami" | 1926 | 930 mbar (hPa) |
| Donna | 1960 | ||
| 8 | Irma | 2017 | 931 mbar (hPa) |
| 9 | "Florida" | 1948 | 940 mbar (hPa) |
| Ian | 2022 | ||
GASP!!! CLIMATE CHANGE IS GONNA KILL US ALL!
THAT IS: IF COVID, NUKES & NATURE DON'T GET US FIRST.
____________________
I LOVE THAT IRMA LOOP
https://wattsupwiththat.com/2022/10/10/hurricane-hype-lies-censorship-and-reality/
Mike Maguire
Reply to Duane
October 10, 2022 11:26 am
The 6 dozen calibrated NWS instruments on the ground all agreed. No SUSTAINED hurricane winds, except for briefly right along the coast.
In fact, even wind GUSTS inland were not hitting hurricane force anymore 2 hours after landfall.
Some of these instruments were exactly in the path of highest winds over land.
To suggest that all 100% of them were wrong for 6 hours and without even 1 land reading as evidence of them being wrong defies logic:
https://www.marketforum.com/forum/topic/89366/#89370
But people decided what they wanted to believe about Ian early on and empircal data, no matter how powerful loses to cognitive bias in most cases.
Almost all the catastrophic damage was right along the coast from the Storm Surge NOT the wind.
https://www.marketforum.com/forum/topic/89399/
If you didn’t already KNOW that and the facts above……….showing them now is a waste of time if it contradicts what you think that you know.
Thanks to new weather data from WxFollower, recently I was able to update the analysis made previously.
Thanks Larry!