 NWS Tampa Bay
Larry advised that this could be the case last week:
https://www.marketforum.com/forum/topic/89011/#89047
Re: Here comes Hurricane Hermine
By WxFollower - Sept. 21, 2022, 11:56 p.m.
If I were still trading commodities, I would have looked at cotton and possibly even OJ for a wx play. But alas with my lost interest, I even forgot about Invest 98L affecting either one. I've become detached from something I was doing for two decades. Besides losing interest in NG, my free time to do any of this is too limited now.
By the way, assuming 98L will become a named storm, it may not become Hermine due to the wave coming off Africa possibly getting the name Hermine first.
Previous thread on this storm:
Here comes Hurricane Hermine
18 responses |
Started by metmike - Sept. 21, 2022, 10:53 a.m.
https://www.marketforum.com/forum/topic/89011/#89047
+++++++++++++++++++++++++++++++++++++++
Now, we'll focus entirely on Ian, which is very likely to become a MAJOR hurricane next week!
M = MAJOR hurricane! = 111 mph+
https://www.nhc.noaa.gov/refresh/graphics_at4+shtml/205737.shtml?cone#contents

Ian forecast to 130 mph on Tue/Wed of next week.
https://www.nhc.noaa.gov/text/refresh/MIATCDAT4+shtml/242056.shtml?
metmike: Ian may weaken to LESS than major hurricane strength before hitting land because of wind shear and some cooler water. The farther southeast it tracks the stronger it will be.
https://www.nhc.noaa.gov/refresh/graphics_at4+shtml/205737.shtml?tswind120#contents
![[Image of probabilities of 34-kt winds]](https://www.nhc.noaa.gov/storm_graphics/AT09/refresh/AL092022_wind_probs_34_F120+png/205737.png)
7 Day Total precipitation below:
http://www.wpc.ncep.noaa.govcdx /qpf/p168i.gif?1530796126
The yellows below are 10"+

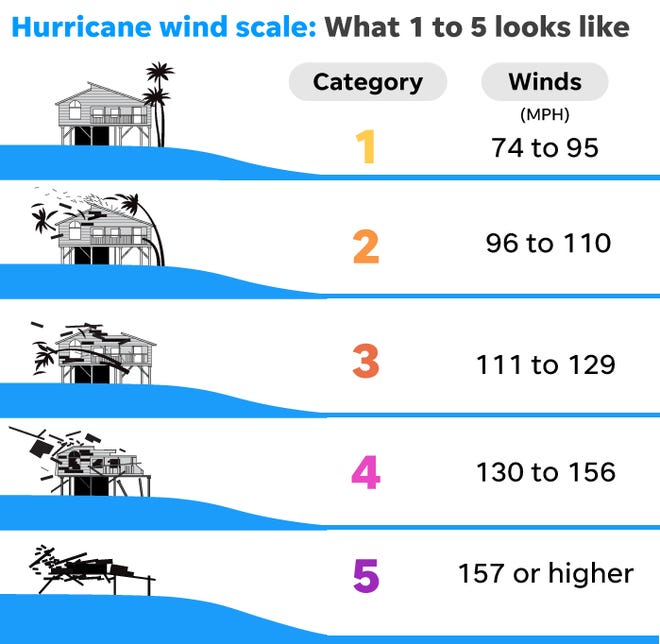
Saffir-Simpson Hurricane Wind Scale
https://www.weather.gov/mfl/saffirsimpson
https://www.weather.gov/hgx/tropical_scale
| CATEGORY | WINDS (MPH) | DAMAGE | STORM EXAMPLE AND YEAR |
|---|---|---|---|
| 1 | 74-95 | Minimal: Damage to building structures possible, primarily to unanchored older model mobile homes. Damage to poorly constructed signs, shrubbery, and trees. Loose outdoor items become projectiles. Numerous power outages. | HUMBERTO 2007 |
| 2 | 96-110 | Widespread from very strong winds: Some roofing material, door, and window damage to buildings. Considerable damage to trees, vegetation, mobile homes, and piers. A number of high rise building glass windows dislodged to become projectiles. Widespread power outages up to several days. | IKE 2008 |
| 3 | 111-129 | Extensive from dangerous winds: Some structural damage to small residences and utility buildings with minor amount of wall failures. Mobile homes destroyed. Many trees uprooted or snapped. Power outages lasting several days or weeks. | ALICIA 1983 |
| 4 | 130-156 | Devastating from extremely dangerous winds: Some wall failures with complete house roof structure failures. Extensive damage to doors, windows, and trees. Electricity unavailable for weeks. | HARVEY 2017 |
| 5 | >156 | Catastrophic: Complete roof failure on many residences and industrial buildings. Some complete building failures with small buildings blown over or away. Power outages for weeks or months. | ANDREW 1992 |
https://obxstuff.com/blogs/guides/hurricane-category-wind-chart-scale
Want to learn what these storms can do with some visuals? Check out the helpful and informative YouTube video below from The Weather Channel!
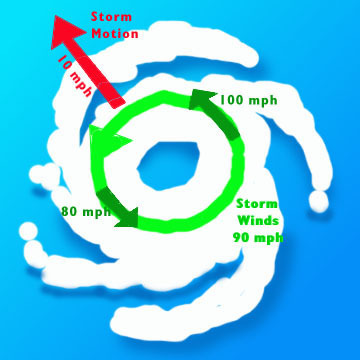
Areas to the east/northeast or right side of Ian or any hurricane(the dirty side of the hurricane) because of the counterclockwise spin, will have the speed of the storm adding to the velocity of the wind.
On the west/southwest/left side of Ian or any hurricane, the opposite occurs. Winds will be less by the amount of forward speed of the hurricane.
If Ian is traveling at 10 mph in the north direction for instance, we subtract 10 mph from the hurricane winds on its west/left side with respect to the ground/ocean. So a 90 mph wind circulation actually becomes 90- 10 = an 80 mph wind.
On the right/east side, the speed ADDS 10 mph to the circulating wind speed and we get 90 +10 =100 mph.
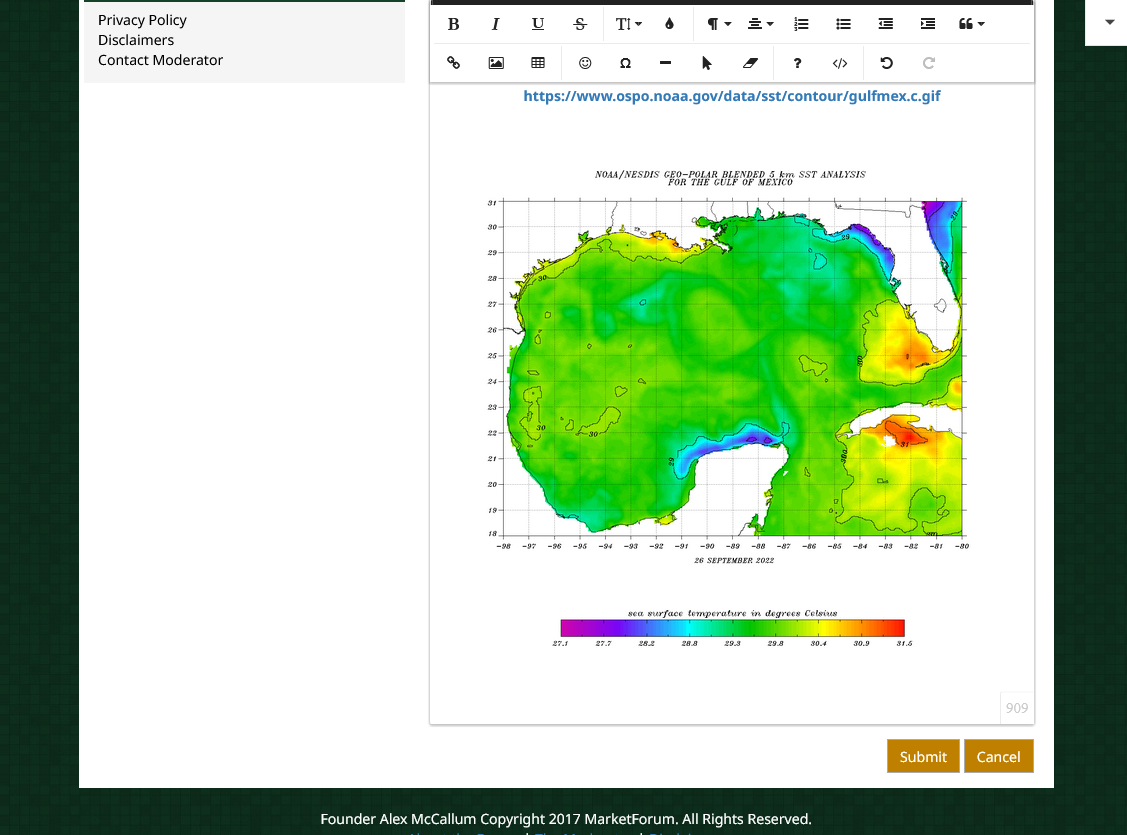
Water temperatures in the Gulf of Mexico are plenty warm.
Note the huge area of cool anomalies in the tropical Pacific. This is the almost record long La Nina(in it's 3rd year) which is causing the drought in the US as well as the global warming pause(which actually started 6 years).
Top map is temp anomalies.
https://www.ospo.noaa.gov/Products/ocean/sst/anomaly/index.html

2nd map is temps in Deg. C. in the Gulf of Mexico.
80 Deg. F = 26.7 Deg. C = Minimal hurricane temp.
29 Deg. C = 84.2 Deg. F = current water temp
30+ Deg. C = 86. Deg. F = current water temp in warm pockets
The blue-ish shades of a bit cooler water should help to weaken Ian, along with more wind sheer farther north, near the end of it's track over water, if Ian hits Northwest FL.
Just the opposite if Ian hit southwest FL with warmer water(yellow/orange) and less wind sheer.
https://www.ospo.noaa.gov/data/sst/contour/gulfmex.c.gif
Frozen image below, the one above updates daily.
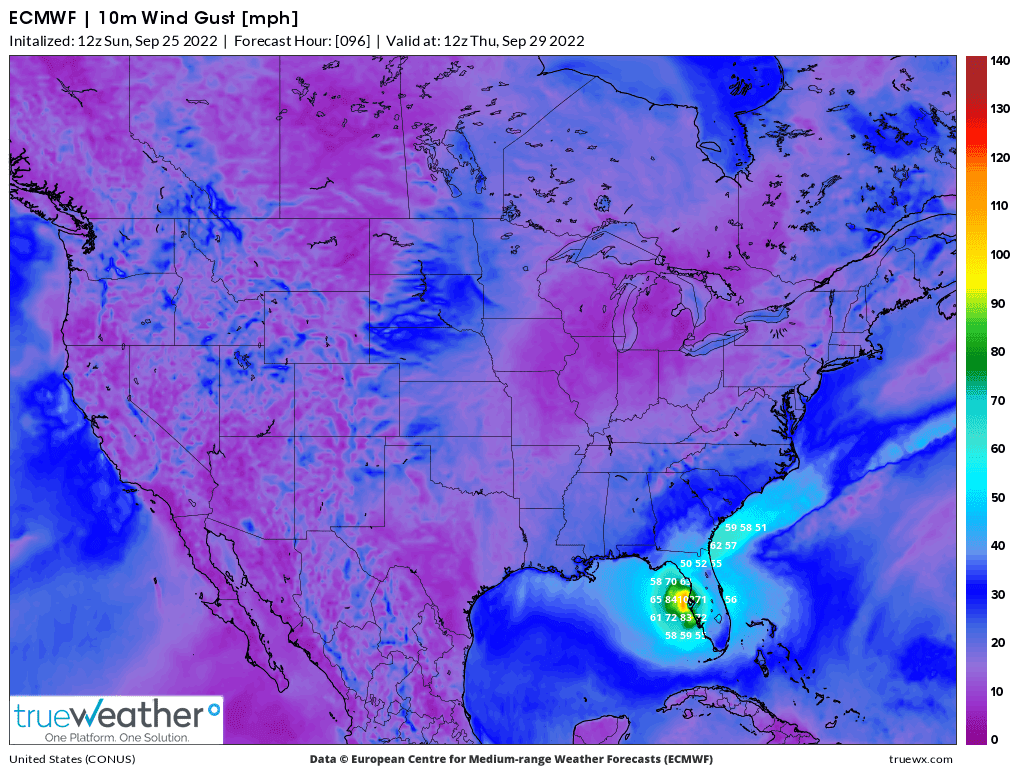
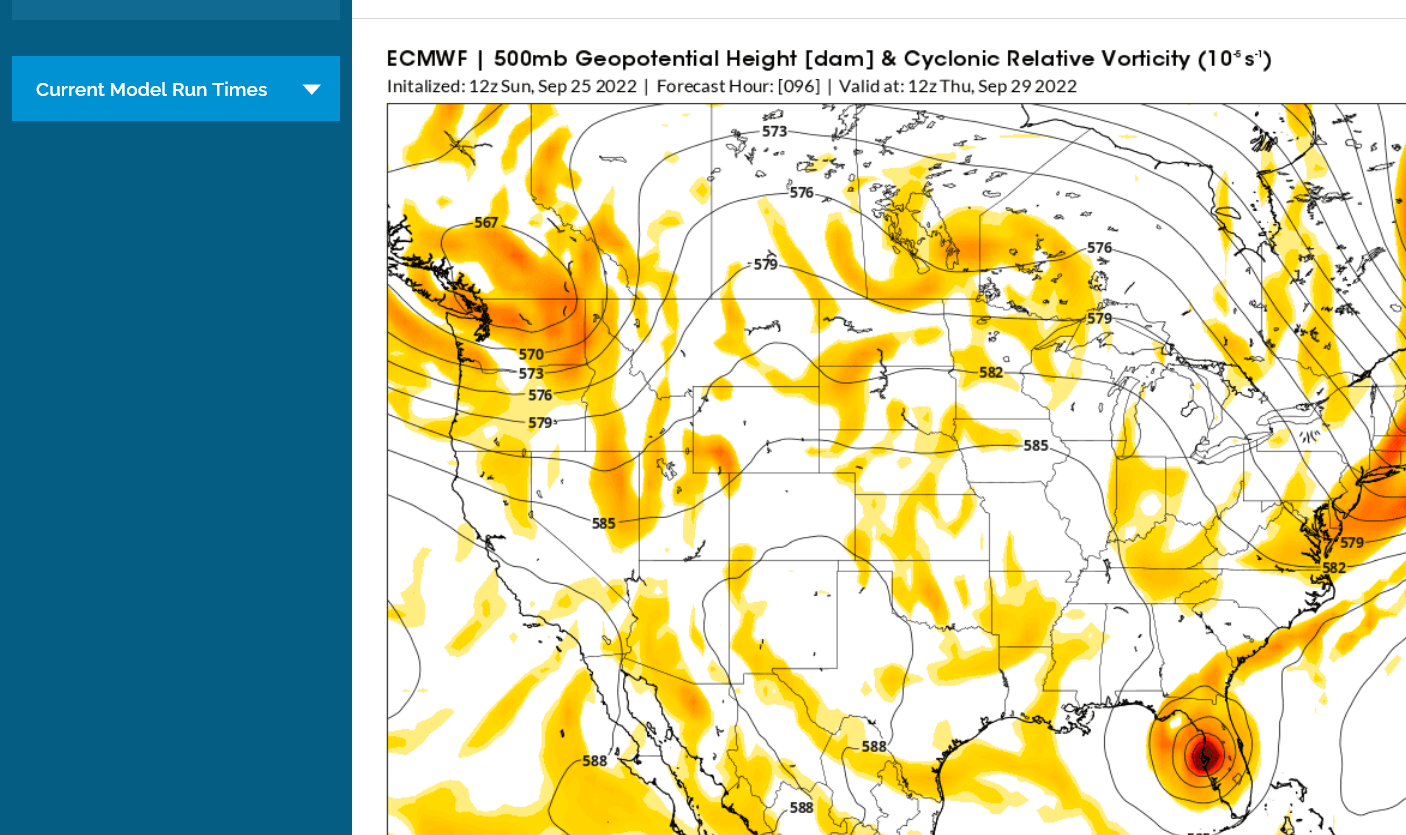
European model continues to be the farthest east, last run from 12z below:
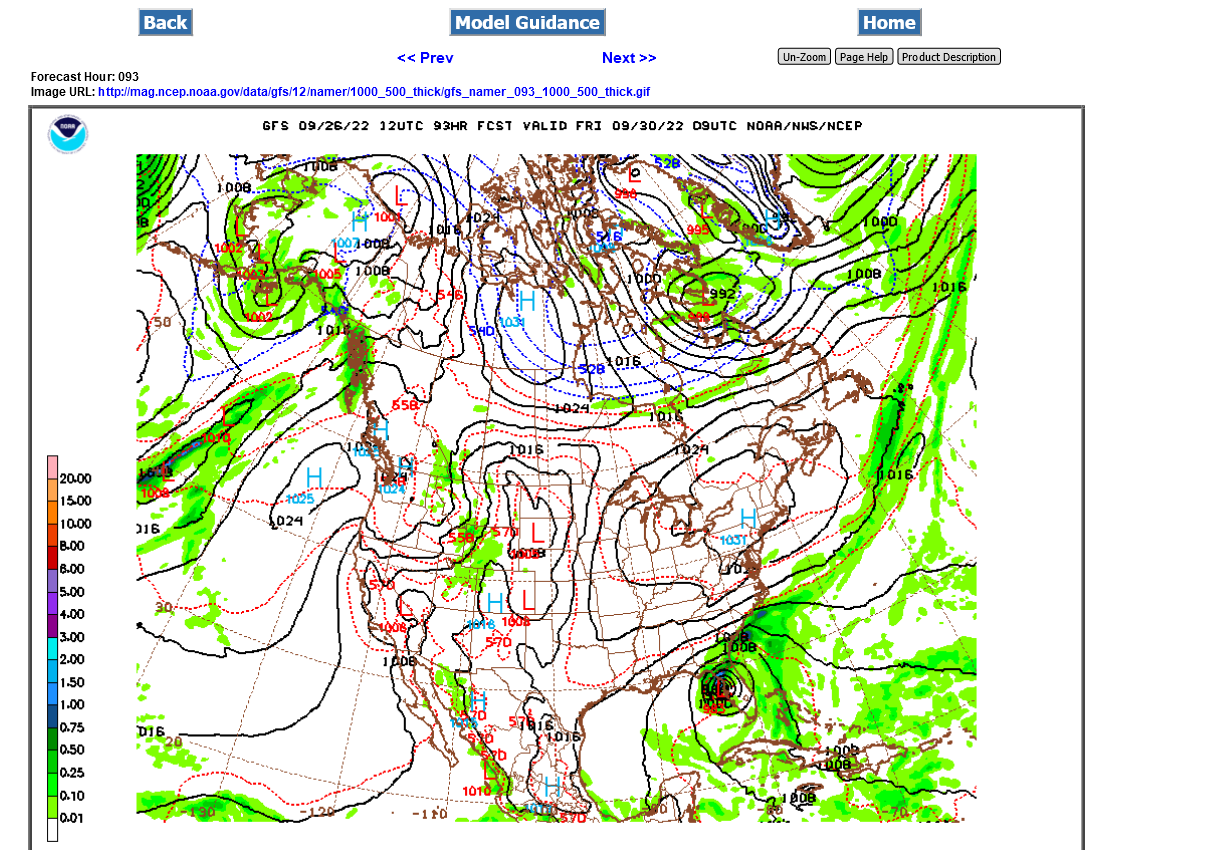
GFS/American model is farthest west: 18z run below
https://mag.ncep.noaa.gov/Image.php

The GFS has been the farthest west, the European farthest east.
The models have shifted slightly farther east, with the 12z GFS, just coming out now being noticeably farther east (compare to yesterdays map above)......but slower too(and slightly weaker). This is Thursday at 18z/late afternoon below. Just 1 solution.......so take it with a grain of salt.
https://mag.ncep.noaa.gov/Image.php
++++++++++++++++++
There were several 12z GFS ensemble members that were farther west than this, so that solution can't be ruled out yet:
http://www.meteo.psu.edu/fxg1/ENSPRS_12z/f120.html
+++++++++++++++++++++++++++
The just out 12z European model continues much farther east. Hitting WestCentral FL early on Thursday morning below:
NHC has just shifted their forecast track eastward(right) around 20 miles on this last 5pm update based on the 12z guidance shown above several hours ago.
https://www.nhc.noaa.gov/text/refresh/MIATCDAT4+shtml/252057.shtml?
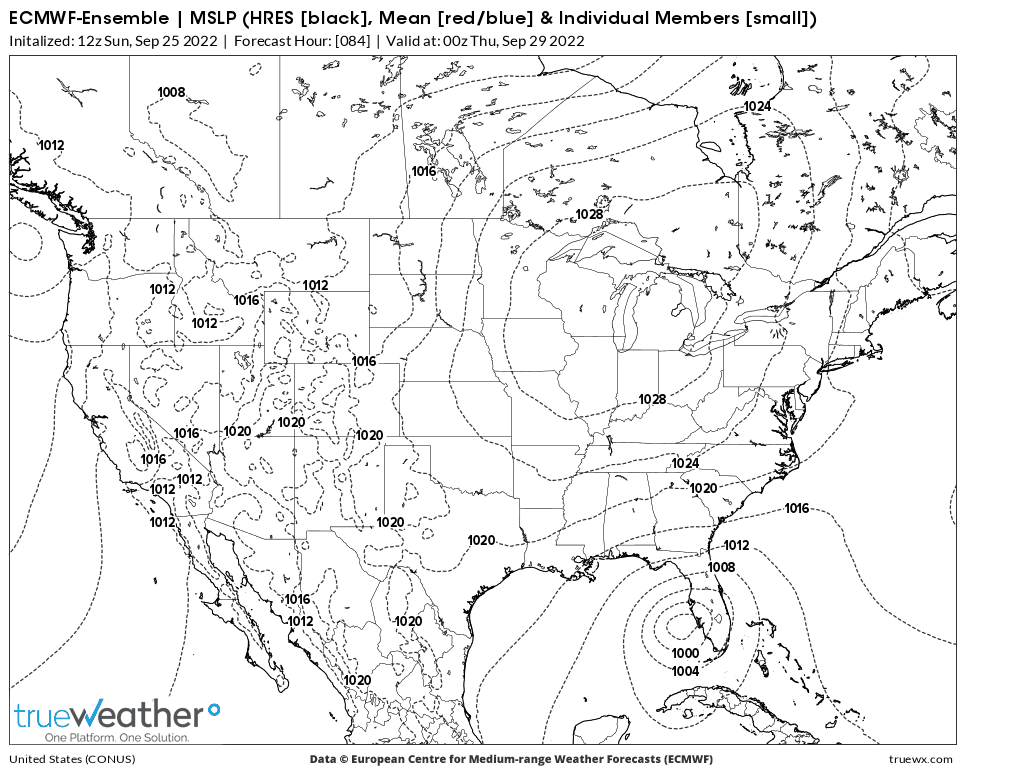
Another view from the 12z European ensemble(lots of European model solutions run at the same time with slight variations averaged together) which is my favorite model. It doesn't look as deep/impressive because the many solutions with centers in different locations averaged together act to cancel each others exact center out. Ensemble averages usually do better than individual operational models on most large scale features, locations and other parameters, especially with consistency but the average is not good at predicting the intensity of hurricane centers.
18z GFS was another smidgen farther east with the track of Ian.
NHC shifted the forecast for Ian a tiny bit more to the east again.
https://www.nhc.noaa.gov/text/refresh/MIATCDAT4+shtml/260300.shtml?
https://www.nhc.noaa.gov/refresh/graphics_at4+shtml/042342.shtml?cone#contents

Thanks Mike.
Your very welcome joj.
I know that you mentioned that you have relatives in FL and have spent time down there since you were a child(and hadn't noticed any changes in the ocean/sea level along the coast-great observation since you were a kid).
Ian is now a hurricane, as expected. OJ, after opening close to unch, is down -5c and all you need to know. The track would be an extremely high threat to OJ but, also as expected, Ian will be weakening from cooler water, wind sheer and drier air as it moves northward and may be just a minimal hurricane by the time it hits land.
Wind has the greatest potential to damage orange groves in C/S Florida.
Everybody in this business will remember Charley from 2004!
Charley had wind gusts to 150 mph, that were still 100+ mph as far inland as Orlando!
Charlie was fairly small and the waters were warm and conditions perfect, which allowed it to rapidly intensify just before turning inland. See the orange/red dot below which is when it turned into a major hurricane.
It knocked much of the green oranges off the trees(obliterating that years crop) and did major damage to the branches and trees.
https://en.wikipedia.org/wiki/Hurricane_Charley

2004 hurricane season. 4 hurricanes hit Florida!
https://en.wikipedia.org/wiki/2004_Atlantic_hurricane_season

http://www.ultimatecitrus.com/Charley/
Orlando Sentinel
Then there was Irma in 2017
https://en.wikipedia.org/wiki/Hurricane_Irma

Latest update from the NHC has no big changes:
https://www.nhc.noaa.gov/text/refresh/MIATCDAT4+shtml/261457.shtml?
https://www.nhc.noaa.gov/refresh/graphics_at4+shtml/102341.shtml?cone#contents

Latest 12z GFS operational model, just coming out has again shifted slightly farther east and is getting VERY close to the European model(which actually shifted slightly west/left overnight-towards the GFS). Potential forecast errors on the track are diminishing rapidly now, although late intensity changes can still be a big surprise. The time frame of this map is just after midnight on Friday.
The hurricane's forward motion speed is likely going to slow down considerably during this time frame.
November OJ, the front month has a total volume of 610 contracts with less than 2 hours of trading left. It's -5c.(-$750/contract)
++++++++++++++++
December cotton is down another -3c (-1,500/contract) after being lock limit down on Friday -4c. There must be an expanded limit on cotton today.
It was +1c for awhile on Sunday evening. CTZ2 shot up early/mid last week when Ian' s threat to the cotton crop was still uncertain.
cotton held up until after the NHC update this morning, then crashed 4c in 2 hours, though it wasn’t much different. Crude plunging $3 during those same 2 hours is likely the bigger reason….although it could have been the last of the hurricane premium draining out.
It's possible to likely that early/mid last week, with an outside major threat to energy operations in the western GOM (platforms in the Gulf refineries along the coast) that helped to keep the energies supported temporarily.
As soon as the coast was clear, eliminating the chance of a weather spike higher, aggressive sellers have faced very little risk/news from other factors or had to fight much buying on technical or other indicators.
So they can trade how "high prices earlier this year, were the cure for high prices now"
OJ is down sharply today from having the POTENTIAL high end of extreme forecasts for wind that were still possible last week...... taken away but the orange crop is not completely out of the woods.
Being on the right side of the hurricane, also increases the wind speeds by the speed of storm(entire entity) that adds to the speed of the wind around the right side of the storm because they're going in the same direction.
https://www.marketforum.com/forum/topic/89131/#89137
Another item is that the later in the hurricane season the orange crop gets hit, the more potential damage.
The oranges are more mature and thus bigger with more surface area and weight. So more will be knocked down in late Sept/October, compared to August with the same wind conditions for instance.
More damage to branches that are carrying the weight of heavier oranges.
FYI, this is also why early Winter freezes do MORE damage to the current crop than late in the season but in reverse.
Early in the season in December is before most of the crop has been harvested, so it has maximum exposure to extreme cold.
A freeze in February, comes after much of the orange crop has already been harvested.
I'm not trading these days. But I'm predicting that OJ will be up sharply tomorrow based on models this afternoon and especially this evening trending SEward with the forecasted track to S of Tampa as well as trending toward more of a crossover of FL peninsula. If I were trading based on what I'm now seeing, I'd be considering a long entry early tomorrow if it weren't to open up too sharply.
Also, with this trend, more of the CT crop would possibly be in the path of higher winds vs how it looked earlier as especially the Carolina crop might be affected. But this is a much lower probability right now as it getting back to strong enough in SC/NC even if it were to track across FL and then into SC/NC is low as of now due to expected dry air entrainment. So, I'm not predicting a rise in CT tomorrow but I wouldn't be surprised by a bounce, especially because of todays big drop.
always awesome to great insight from you Larry!
agree on OJ.
I don’t see this as a threat to cotton with the current forecast.
Track has been adjusted slightly east once again
West-central Florida to be hit pretty hard as Ian doesn't weaken as quickly as previous forecasts.
100 mph wind gusts likely, even inland in OJ country.
NHC track adjusted slightly southeast again at 5am.
Thanks cutworm!
OJ opened up over 1c higher.
I tried to buy some around that price but apparently, my account isn't letting me trade ICE contracts(it would have been just below the low/open). Hadn't traded on that exchange in a few years, so there's something required that I don't know about )-:
OJ is up over +3.45c now.
sept 27 Eric Snpdgrass update
Great stuff cutworm. Eric is the best!
OJ is coming off of its highs but still up +3c. CT was almost limit up early this morning and is lower now.
The NHC update shifts Ian even farther southeast, is faster and is stronger after hitting land which means even more areas to the southeast of Ian will have wind gusts on land HIGHER than 100 mph. This WILL be in the northern tier of the orange orchards.
I would think this is pretty bullish for OJ and we would make new highs but the market must think Ian is still too far north or already have enough hurricane premium in or just not appreciating this and trading it.
The faster speed, however means less excessive rains along and north of the track.
https://www.nhc.noaa.gov/refresh/graphics_at4+shtml/161142.shtml?cone#contents
https://www.nhc.noaa.gov/text/refresh/MIATCDAT4+shtml/271500.shtml?

![[Image of probabilities of 34-kt winds]](https://www.nhc.noaa.gov/storm_graphics/AT09/refresh/AL092022_wind_probs_34_F120+png/161142.png)
This will be updated Tue afternoon and every 12 hours. The darker yellow below is 10" or more of rain. Bright yellow is 15". Again, the faster speed will cut down those rains and they are only on the northern fringe of orange country.
7 Day Total precipitation below:
http://www.wpc.ncep.noaa.govcdx /qpf/p168i.gif?1530796126
++++++++++++++++++++++++++++++++++
Great source of tropical information below:
![]()
https://www.tropicaltidbits.com/analysis/models/
https://www.tropicaltidbits.com/sat/
+++++++++++++++++++++
5pm EDT Tue update NHC
https://www.nhc.noaa.gov/text/refresh/MIATCDAT4+shtml/272059.shtml?
Ian's track shifted a tad farther southeast again, moving a bit faster. Some models slightly stronger but possibly encountering some southwest upper level wind shear that might help weaken it. We'll try to keep the radar/pressure/wind maps at the bottom.
+++++++++++++++++++
11pm EDT NHC
Another very slight shift east for the track. Otherwise, not much change.
+++++++++++++
7am We’d. Ian saw quite a bit of strengthening overnight, despite the wind shear so the stronger models did best. Now at 155mph and a catastrophic cat. 5. Charley in 2004 was similar, intensified very late but was smaller.
Go to this link for more comprehensive information about the OJ market:
https://www.marketforum.com/forum/topic/89232/
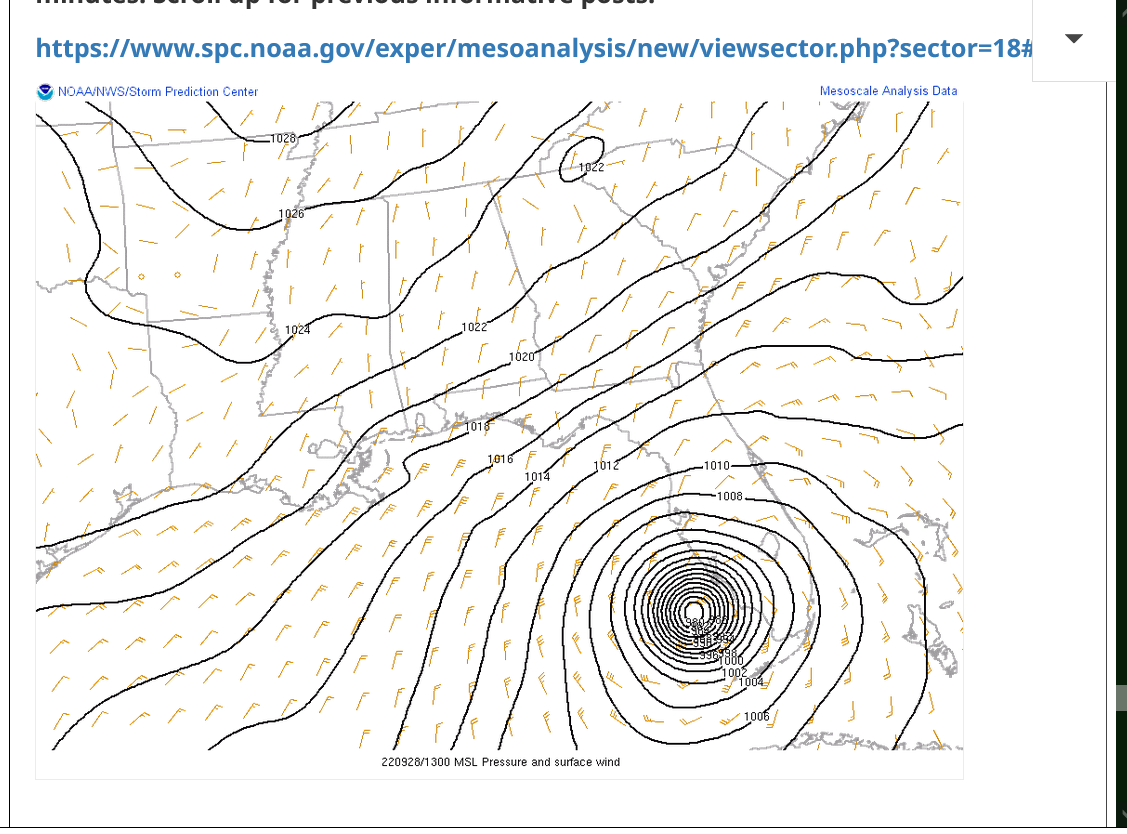
Let's begin actually tracking Hurricane Ian. These maps are updated every few minutes. Scroll up for previous informative posts.
https://www.spc.noaa.gov/exper/mesoanalysis/new/viewsector.php?sector=18#

https://www.sfwmd.gov/weather-radar/current-weather-conditions
Satellite loop
https://www.star.nesdis.noaa.gov/GOES/conus_band.php?sat=G16&band=Sandwich&length=24
Here's our biggest reason for the much stronger than expected hurricane on Wednesday morning:
The pocket of very warm water off the southwest coast of Florida that fueled Ian's intensification overnight/very early am Wednesday!
Cooler temps farther north, closer to the predicted track several days ago, along with more wind shear would have resulted in a weaker hurricane.
https://www.marketforum.com/forum/topic/89131/#89138
Latest frozen images below for future discussions. The ones above update constantly.

11am EDT. Ian still at 155mph and expected to maintain until more of it crosses land in a few hours. The faster speed means the right side will see an additional +10mph in wind gusts, even as it weakens.
It could stay stronger tracking across FL, so now the east coast of FL has hurricane warnings.
https://www.nhc.noaa.gov/text/refresh/MIATCDAT4+shtml/DDHHMM.shtml?
+++++++++++++++
Latest radar loops/data from Ian. https://www.marketforum.com/forum/topic/89131/#89239
OJ opened strongly as I expected. However, I didn't expect the drop back to near the low iof the day late. That may have been a "sell on the bullish news" especially with OJ already pretty high vs recent months+.
Regardless, I expect there will be a lot of damage, at least similar to and quite possibly worse than what Irma caused in 2017 and what each of the 3 hurricanes of 2004 caused.
Thanks Larry!
We have a thread to discuss the OJ market and I'll put your comment there.
Latest from the NHC 5pm EDT
https://www.nhc.noaa.gov/graphics_at4.shtml?start#contents
https://www.nhc.noaa.gov/text/refresh/MIATCDAT4+shtml/282058.shtml?
They were still calling sustained winds at 140 mp.
I would never doubt the NHC, they are the best but am not finding any surface stations along the coast reporting winds anything close to this high. A couple with wind GUSTS above 100 mph is the highest so far on NWS sites.
https://w1.weather.gov/data/obhistory/KPGD.html
Current conditions at
 Heavy Rain Fog and Windy
 75°F
24°C
| Humidity | 96% |
| Wind Speed | E 86 G 123 mph |
| Barometer | NA |
| Dewpoint | 74°F (23°C) |
| Visibility | 0.50 mi |
| Last update | 28 Sep 3:54 pm EDT |
Barometer 983.3( 2 hours previous to that time(2pm))
11pm update from the NHC: https://www.nhc.noaa.gov/text/refresh/MIATCDAT4+shtml/290259.shtml?
They state that Ian still has 90 mph sustained winds. Where the heck are they getting this from? I can't find even 1 place over 50 mph sustained right now and gusts are not even close to 90 mph anywhere right now.
Not even 1 place in the last 2 hours that even had a hurricane force wind gust, let alone 90 mph sustained winds as the NHC just stated.
Surely they must be basing this on winds ABOVE the surface and making guestimates because no surface readings are anywhere close to that and in fact, since the hurricane hit late this afternoon, the stated (guesstimated) wind reports from sources have over inflated the actual measured REAL observed winds on the ground at the many dozens of calibrated NWS instruments by 30-50 mph at times.
Orlando Sentinel
"the still Category 4 hurricane made its second landfall close to Punta Gorda near Pirate Harbor at 4:35 p.m. with sustained winds of 145 mph"
metmike: Where the heck are they getting this 145 mph number from, other than the NHC saying it?
Surface observations didn't support anything close to that high.
Below, was the closest RECORDED observation (4pm) to that landfall from Punta Gorda a half hour earlier when Punta Gorda was in the eye wall, which is where the strongest winds are/were.
https://www.marketforum.com/forum/topic/89131/#89298
East wind 86 mph and gusts of 123 mph.
And that was, by far the strongest wind report all day from Florida(that i found so far-there could have been a higher wind gust somewhere)
I get that some of the instruments failed but that one did not until 4pm(when that location was in the eye wall with the strongest winds on land) and it FAILED to confirm 145 mph sustained winds being reported at that location 30 minutes later.
Get the latest rain totals here:
https://www.iweathernet.com/total-rainfall-map-24-hours-to-72-hours
A narrow band just south of Tampa that has received over a foot of rain the past 24 hours. Some spots in that area, should could end up with more than 20 inches!
Scroll down for explanation/proof for why Ian was only a cat. 2 hurricane when it made landfall(not a strong cat. 4) and weakened after that.
Latest on TROPICAL STORM Ian from 7am NHC. Should bump back up to barely minimum hurricane in Gulf Stream waters for a brief time:
https://www.nhc.noaa.gov/text/refresh/MIATCDAT4+shtml/290259.shtml?
https://www.nhc.noaa.gov/refresh/graphics_at4+shtml/093959.shtml?cone#contents

Heaviest rains just south of Tampa were 20 inches.
https://www.iweathernet.com/total-rainfall-map-24-hours-to-72-hours
Suddenly, Ian is the 4th strongest hurricane in Florida history?
NO IT WASN'T!
Here, let me PROVE that it wasn't. Not even close to a top 10 hurricane for Florida!
They claim the lowest pressure was 940 mb.
https://en.wikipedia.org/wiki/List_of_Florida_hurricanes
| Source: HURDAT,[5] Hurricane Research Division[10] | |||
|---|---|---|---|
| Rank | System | Season | Landfall pressure |
| Most intenselandfalling tropical cyclones in the U.S. state of Florida Intensity is measured solely by central pressure | |||
| 1 | "Labor Day" | 1935 | 892 mbar (hPa) |
| 2 | Michael | 2018 | 919 mbar (hPa) |
| 3 | Andrew | 1992 | 922 mbar (hPa) |
| 4 | "Florida Keys" | 1919 | 927 mbar (hPa) |
| 5 | "Okeechobee" | 1928 | 929 mbar (hPa) |
| 6 | "Great Miami" | 1926 | 930 mbar (hPa) |
| Donna | 1960 | ||
| 8 | Irma | 2017 | 931 mbar (hPa) |
| 9 | "Florida" | 1948 | 940 mbar (hPa) |
| Ian | 2022 | ||
+++++++++++++++++++++++
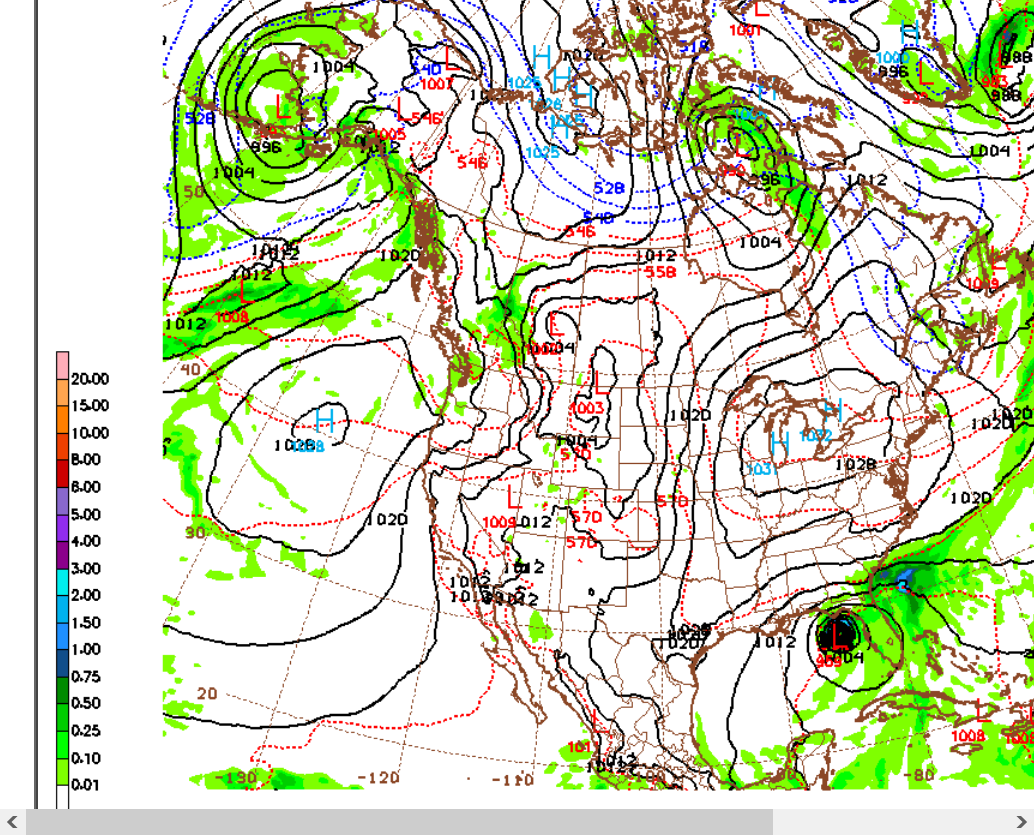
I took a snapshot of the pressure field when Ian was at top strength before weakening, with part of its circulation over land already, as it was being cutoff from the warm waters. The lower the pressure the more intense the cyclone, hurricane:
Sub 980 mb for sure but 940 mb? No way. Maybe I'm missing something but the wind and pressure readings from dozens of calibrated NWS instrumements on the ground that I mentioned earlier, for the 6 hours after Ian made landfall don't match up at all with this.

In addition, the Punta Gorda station was closest to where it made landfall and had the lowest barometer reading. It failed an hour later, when the barometer likely was slightly lower but it's lowest barometer reading was 983 mb. Consistent with the sub 980 mb on the map above but debunking 940 mb at landfall.
+++++++++++++++++++++++++++
https://w1.weather.gov/data/obhistory/KPGD.html
Current conditions at
Heavy Rain Fog and Windy 75°F
24°C
| Humidity | 96% |
| Wind Speed | E 86 G 123 mph |
| Barometer | NA |
| Dewpoint | 74°F (23°C) |
| Visibility | 0.50 mi |
| Last update | 28 Sep 3:54 pm EDT |
Barometer 983.3 the previous reading 2 hours earlier.
++++++++++++++++++++++++++++
Look at their pressure, 983 mb from 2pm, 150 minutes before the eye crossed overhead. The pressure was likely a bit lower than this at the exact bottom, somewhere close to Punta Gorda after the 983 mb OBSERVED/MEASURED reading but 43 mb lower?
Keep in mind that at 2pm, the right, front/northeast quadrant of Ian's circulation was already coming ashore(the eyewall) and it would have been WEAKENING.
Ian had a barometric pressure reading consistent with a cat. 2 hurricane. Barometric pressure is the much more reliable measurement determining the intensity of hurricanes because wind can be affected by terrain elements.
How about wind?
https://en.wikipedia.org/wiki/List_of_Florida_hurricanes
upon striking land. | |||||
|---|---|---|---|---|---|
| Source: HURDAT,[5] Hurricane Research Division,[10] NHC[14] | |||||
| mph | km/h | ||||
| Rank | Hurricane | Season | Wind speed | ||
| Strongest landfalling
tropical cyclones in the U.S. state of Florida | |||||
| 1 | "Labor Day" | 1935 | 185 | 295 | |
| 2 | Andrew | 1992 | 165 | 270 | |
| 3 | Michael | 2018 | 160 | 260 | |
| 4 | "Florida Keys" | 1919 | 150 | 240 | |
| Charley | 2004 | ||||
| Ian | 2022 | ||||
| 7 | "Miami" | 1926 | 145 | 230 | |
| "Okeechobee" | 1928 | ||||
| Donna | 1960 | ||||
| 10 | "Homestead" | 1945 | 130 | 215 | |
| "Fort Lauderdale" | 1947 | ||||
| "Florida" | 1948 | ||||
| "Florida" | 1949 | ||||
| King | 1950 | ||||
| Irma | 2017 | ||||
++++++++++++++++
With regards to 150 mph sustained winds at landfall NO WAY!
Again, we have Punta Gorda clocking in with the highest sustained winds and highest wind gusts, other than a 140 mph wind GUST along the coast in Lee county. This is extremely close to where Hurricane Ida made landfall. The reading above was 40 minutes before Ida made landfall and WHEN THEY WERE IN THE EYE WALL WITH THE HIGHEST WINDS! Winds were sustained at 86 mph and gusting to 123 mph. This is a cat. 1 hurricane and at best a cat. 2 hurricane.
See for yourself:
https://www.aoml.noaa.gov/hrd/hurdat/All_U.S._Hurricanes.html
https://www.nola.com/news/hurricane/article_b15cae08-3f76-11ed-b097-5babf7e4d4f5.html
Going by preliminary measurements of the storm's minimum pressure alone, Ian would be the 22nd strongest storm recorded in the U.S., according to the Atlantic Oceanographic & Meteorological Laboratory and other government agency reports. Although there are several factors that play into the damage a storm can cause, a low minimum central pressure allows for stronger winds.
metmike: I will keep looking for data that, so far isn't there and for somebody else to show me data or reasoning to contradict the empirical data that I have. You got anything, Larry?
Otherwise, Ian might have made a top 50 storm at best and not the 22nd strongest.
Doing more research and it all confirms the posts above:
A sustained wind in a hurricane means one-minute-average maximum sustained winds at 10 m above the surface. Not a wind gust/spike higher in the wind.
Highest wind GUSTS reported below.
A reminder, we hear/read that this hurricane made landfall with 150 mph SUSTAINED winds. It was still being referred to as having 90 mph sustained winds at 11pm, over 6 hours after landfall, when I couldn't find sustained winds greater than 50 mph at even one reporting station.
The first source below was from reports along the coastline that had the HIGHEST wind gusts of the event.
The 2nd source includes highest wind gusts inland. Again, NOT sustained winds but the peak wind that spiked MUCH higher ABOVE sustained winds used to calculate the intensity of hurricanes.
The empirical data below in the form of measurements/observations comes from extremely reliable sources that serve us 24 hours a day, 365 days a year with accurate weather information.
There is no reason to think all those instruments were missing something on such a large scale that somehow, dodged them and only happened in between them because of some unknown flaw.
Keep in mind that the reports below were the HIGHEST wind gusts, not the AVERAGE wind gusts or even average sustained wind, which was obviously lower.
The 2nd link was 15+ hours after the hurricane made landfall. More than enough time for the highest winds to have been measured and reported.
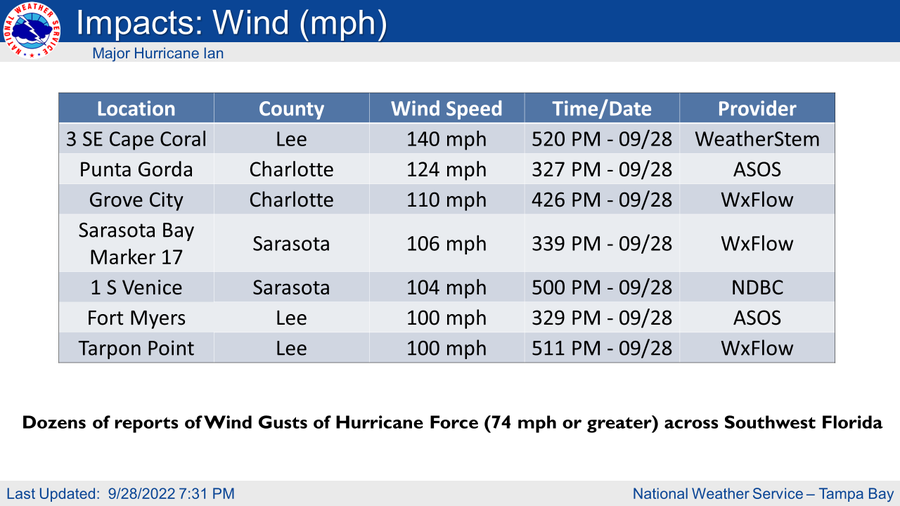
The NWS stated it well last evening. "Dozens of reports of Wind Gusts of Hurricane force( 74 mph or greater) across Southwest Florida.
I agree completely with that!
NWS Tampa BayHere's some of the highest wind gusts we've seen so far. Remember, the event is still ongoing. Hurricane -Force winds continue to be reported. For an additional sampling, see: https://forecast.weather.gov/product.php?site=NWS&issuedby=TBW&product=PNS&glossary=1
Again, these are top wind GUSTS below, not sustained winds:
https://forecast.weather.gov/product.php?site=NWS&issuedby=TBW&product=PNS&glossary=1

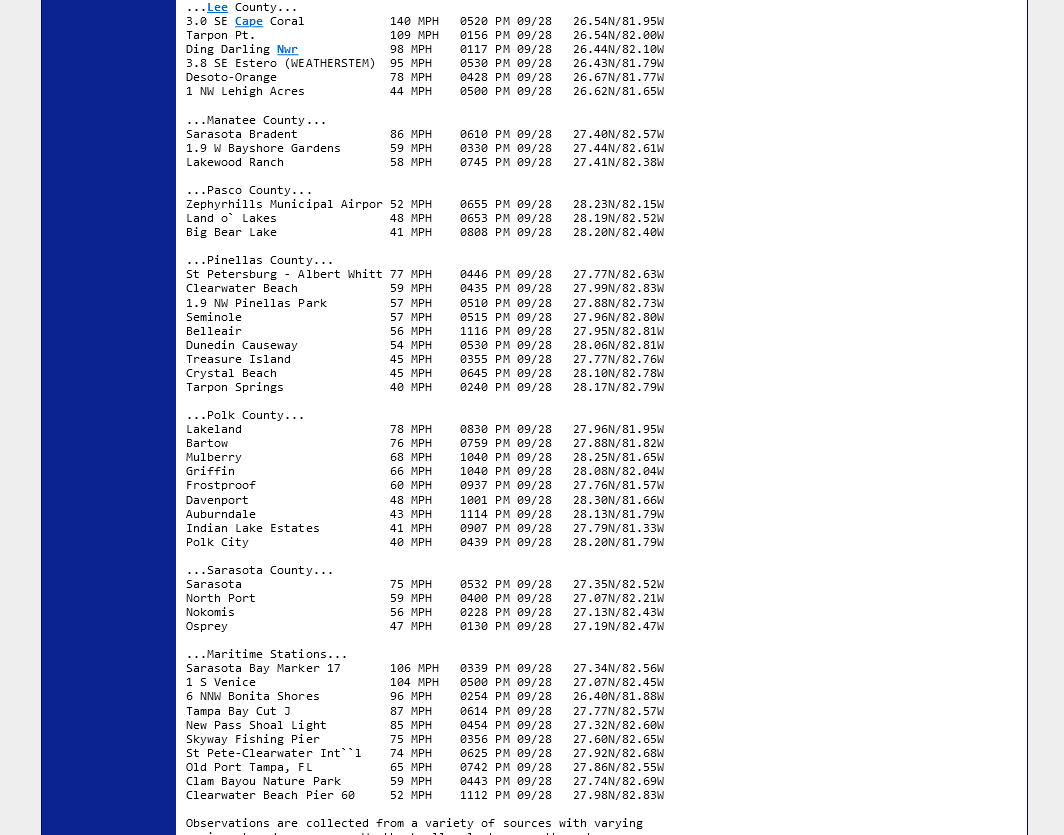
Nobody is disputing that Hurricane Ian did tremendous damage but where is any data to show that winds were 150 mph sustained at landfall or even 120 mph sustained at landfall?
I looked everywhere. A few places along the coast had wind gusts above 100 mph. The measured empirical data is the data. Using data, completely takes out the emotions, sensationalism, embellishment AND any denial or skepticism.
I should also add that this is not intended to bash the NHC. They are greatly under appreciated and have saved 10’s of thousands of lives with their extremely informative and timely reports.
Meteorologists like myself would never be able to do our jobs effectively without their assistance.
I flew into Hurricane Gloria with their meteorologists in a hurricane hunter in September 1985 and am extremely grateful from a personal standpoint.
This is intended to make a specific, authentic point about a massive flaw in how they/we record and communicate wind speeds of hurricanes.
They use a technique to measure wind speed which is independent of land based instrumentation so they can estimate wind speeds over data sparse oceans.
To be consistent, they continue using that technique when hurricanes are over land……….even when much more accurate surface measurements are available from instruments just above the ground that tell us what the wind is……..not estimate it.
This has been going on for many decades. The disparity between NHC estimated winds and actual land instrument winds is very well known. However, in 4 decades of following hurricanes, the disparity between these 2 different methods for obtaining winds this time, with Hurricane Ian was twice as great as any other hurricane that I can remember.
Ian is leaving the far Southeast sector above that we've been using to track it. Here's a new sector to follow it for a couple more days:

https://www.wunderground.com/maps/radar/current
You can follow the remnants on the main weather page:
Mike said:
"Thanks Larry!
We have a thread to discuss the OJ market and I'll put your comment there.
https://www.marketforum.com/forum/topic/89232/ "
-----------
Hey Mike,
I tried that link and it said "forbidden". Why can't I find the OJ thread? I just saw that the December USDA cut the FL orange crop by 29% already from the prior report on oranges, October. This is the first report to incorporate the Ian damage. Thanks in advance.
I got same thing too, Larry.
Wow, somebody doesn't want us to discuss OJ here (-:
I've had this happen a couple of times before with no explanation. There is really no tech team and I don't get paid(and we might not be here forever) but I'll see if I can get creative with some searches to pull that thread up.
However, it could be lost forever for a reason that I can't explain.
Hey Mike,
The link below is to the current page with the OJ thread (as you know the link will keep changing with time so that the link will go out of date within the next couple of weeks or so as the thread gets pushed to the next page) that shows where the thread was at the time it last had a post. You can actually see the thread title, "Orange production Florida/market." But when you click on it, it says "Server Error 403 Forbidden":
Larry,
I did my best but found no way to access that thread with numerous attempts using different commands.
It could be fixed by technical support but earlier this year, when I asked for assistance on another issue with slow loading, the response was that it would cost me $1,485 for them to look into it.
I already provide massive amounts of info for free here that most places charge for and don't make cent, so the last thing I will do is pay technical support to fix issues.
Sorry for the both of us that want to access this thread!
![[Image of cumulative wind history]](https://www.nhc.noaa.gov/storm_graphics/AT09/refresh/AL092022_wind_history+png/211736_wind_history.png)
![[Image of probabilities of 34-kt winds]](https://www.nhc.noaa.gov/storm_graphics/AT09/refresh/AL092022_wind_probs_34_F120+png/211736.png)