Record rain in St. Louis is what climate change looks like?
14 responses | 0 likes
Started by metmike - July 27, 2022, 12:13 p.m.

metmike: Scroll down below this page to see this scary climate change false narrative busted.

Record rain in St. Louis is what climate change looks like

As the stormy pattern that inundated St. Louis shifts east, a multi-day flash flood threat targets the central Appalachians.

https://yaleclimateconnections.org/2022/07/record-rain-in-st-louis-is-what-climate-change-looks-like/

Bob HensonJeff MastersbyBob Henson and  Jeff Masters


Torrents of rain that began before dawn on Tuesday, July 26, gave St. Louis, Missouri, its highest calendar-day total since records began in 1873. And the deadly event is just the latest example of a well-established trend of intensifying downpours in many places across the globe.


The official reporting site at Lambert International Airport received 8.6 inches of rain from midnight to 11 a.m. Central Standard Time on Tuesday. (Standard time is used year-round to separate calendar days for meteorological data purposes.) Another 0.46 inch had been recorded just before midnight CST on Monday, bringing the total for July 25-26 to 9.04 inches as of 11 a.m. CST Tuesday.


  • Heaviest rainfall in a 24-hour period, including periods that straddle calendar days: at least 9.04inches (old record 7.02 inches on August 19-20, 1915, from the remnants of the 1915 Galveston hurricane)
  • Heaviest calendar-day rainfall: at least 8.60inches (old record 6.85 inches on August 20, 1915).
  • Second-heaviest total for two calendar days: at least 9.04 inches (old record 9.54 inches on May 16-17, 1995)

The Midwest is getting more rain — and more extreme rain events


"Although the Midwest climate is naturally drought-prone, recent decades have trended more toward the wet side of the spectrum. “Annual precipitation in the Midwest has increased by 5% to 15% from the first half of the last century (1901–1960) compared to present day (1986–2015),” the Fourth National Climate Assessment observed in 2018."

.
Comments
By metmike - July 27, 2022, 1:08 p.m.
Like Reply


I actually went to school with Jeff Masters at the University of Michigan which is part of the reason to comment. He's really smart, got a PHD and is very outspoken about the fake climate crisis.


However, smart scientists like Jeff,  that were convinced of the climate crisis decades ago keep using data to try to confirm the conclusions of what they are positive that they know, while completely ignoring powerful evidence that contradicts it.  Let's show that happening here.

Scientists should always start with no conclusion and LET THE DATA, followed by analysis and constant skepticism  of everything we find lead us.......until it repeats itself every time....then escorts us to the land of authentic science.


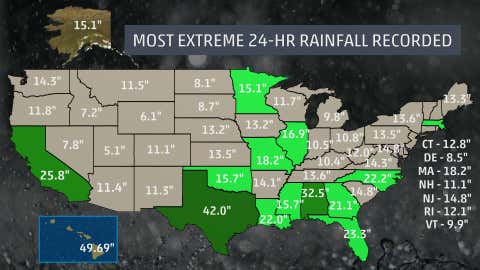
Lets' examine these extreme rains in St. Louis and view them in context to the Summer weather for the Midwest the past 100 years.

1. The atmosphere at +1 Deg. C warmer can hold up to 7% more precipitable water. Because greenhouse gas warming by CO2 mostly affects the driest places and the coldest places at the coldest times of year, it hasn't been as big of a contributor to warm, humid places, which is the Midwest right now and what caused this extreme rain event. 

See my description of  molecular physics for that here:

https://www.marketforum.com/forum/topic/87422/

2. However, outside of the Summer season, CO2 can contribute up to 1 deg. C of warming to a place like St. Louis. Let's pretend that this event happened then. How much additional rain can fall, if all other variables are held constant and we increase the moisture by 7% from an increase in temperature of +1 deg. C? 

The extra moisture equates to roughly an additional .6 inches of rain.  So the 8.60 daily rainfall record would have been around 8.0 inches......all things equal except for global warming/climate change.  Still the rains would have been slightly less if we had the OLD climate.

3. Note that they completely ignore the significance of the HUGE benefits that Summer climate change has bestowed on the Midwest. 

their quote: "Although the Midwest climate is naturally drought-prone, recent decades have trended more toward the wet side of the spectrum."

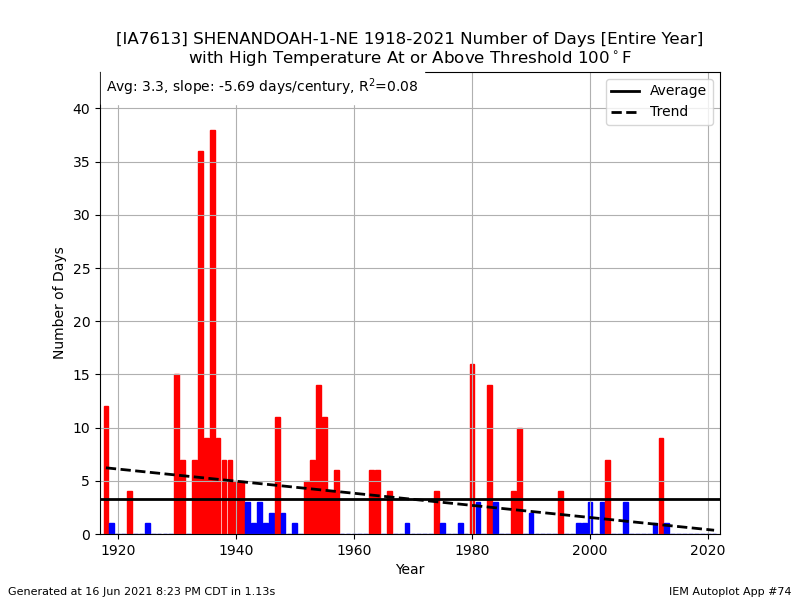
 "Recent decades", as they call them have featured the  BEST growing and year round living conditions in the Midwest in recorded history but a wide margin. The last 2 droughts were in 2012, and 1988 (from natural La Nina's-cold water in the topical Pacific). Before climate change, we averaged more than 1 drought/decade and the 1930's featured more droughts in 6 years BEFORE climate change, than we've had in 30+ years AFTER climate change.

4. So they focus on isolated, heavy rain events like this,  with slightly heavier rains and ignore the other 99% of the weather that's been the same or better in the Midwest compared to before climate change

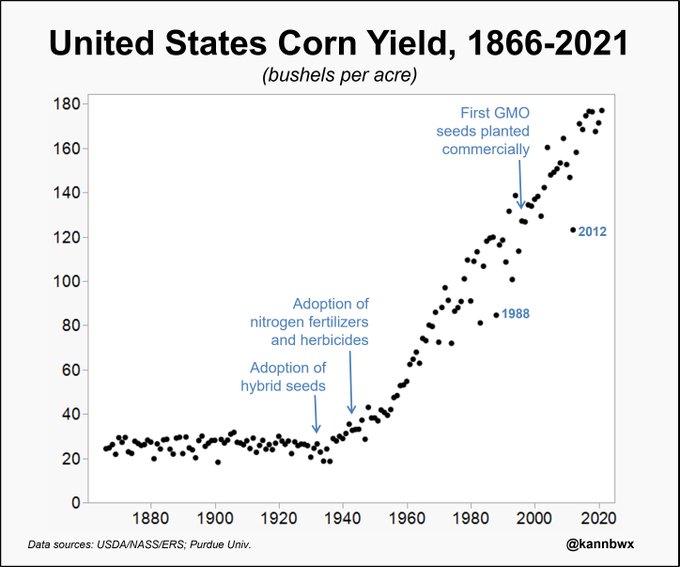
5. The position of this side, is to make us think that the old climate/atmosphere, 100 years ago was better.  What would happen to the growing season weather if we  could actually go back to that OLD climate?  Let's find out if this is true.

a. Crop yields would drop around 35%. On average for every 5 ppm of added CO2, plant growth is +1%. We've gone from 300 ppm to almost 420 ppm, which is 24% just from the extra CO2. https://www.marketforum.com/forum/topic/67877/  

https://www.marketforum.com/forum/topic/62784/

b. Part of that is the longer growing seasons. Around 10 days longer in the Midwest with the NEW climate: https://www.marketforum.com/forum/topic/87422/#87424

c. In addition, the OLD climate featured  frequent widespread severe droughts that caused  very small crops, as mentioned earlier.

d. In addition, the  added CO2 is causing plants in the NEW climate to be more drought tolerant and water efficient. Plants get their CO2 by opening their stomata on the underside of leaves. When they do this, they lose water via transpiration. More CO2 allows them to intake CO2 with a less open stomata and results in  less water losses from transpiration. https://www.marketforum.com/forum/topic/62784/#62797

7. The NEW climate beats the OLD climate in most ways during the growing season by an extremely wide margin. The authentic science shows that we are having a climate OPTIMUM not a crisis.

But they sensationalize high end flooding events like this one with bad science and use no perspective when discussing the big picture of the NEW climate. 

The more extreme a weather event is, the more that natural variation of  weather patterns likely played a role and the less that climate played a role. This is the Golden Rule of Climate Extremes:

https://cliffmass.blogspot.com/2016/03/the-golden-rule-of-climate-extremes.html

In this case, I estimate that:

8.0 inches of rain fell from an extreme, natural variation in the weather pattern those days.

0.6 inches was potentially added from climate change.

By metmike - July 27, 2022, 1:28 p.m.
Like Reply

My old classmate, Jeff Masters received a PhD and made a well deserved  name for himself. Outside of the fake climate crisis, the guy is brilliant.

However, one thing that he and countless brilliant scientists in that field are severely deficient at is SINCERELY practicing the scientific method. They assumed something decades ago and now just find data to support what they are positive that they know.

Scientific humility and practicing the scientific method with an open mind can cause people practicing those principles to leave much smarter scientists in the dust when it comes to the discovery process and understanding NEW science in their fields of expertise.


https://www.marketforum.com/forum/topic/77011/#78974

Intelligence/IQ determines the potential rate that a mind can learn at.

Open mindedness and discernment  are often the biggest determinants of the REAL RATE of learning.

metmike


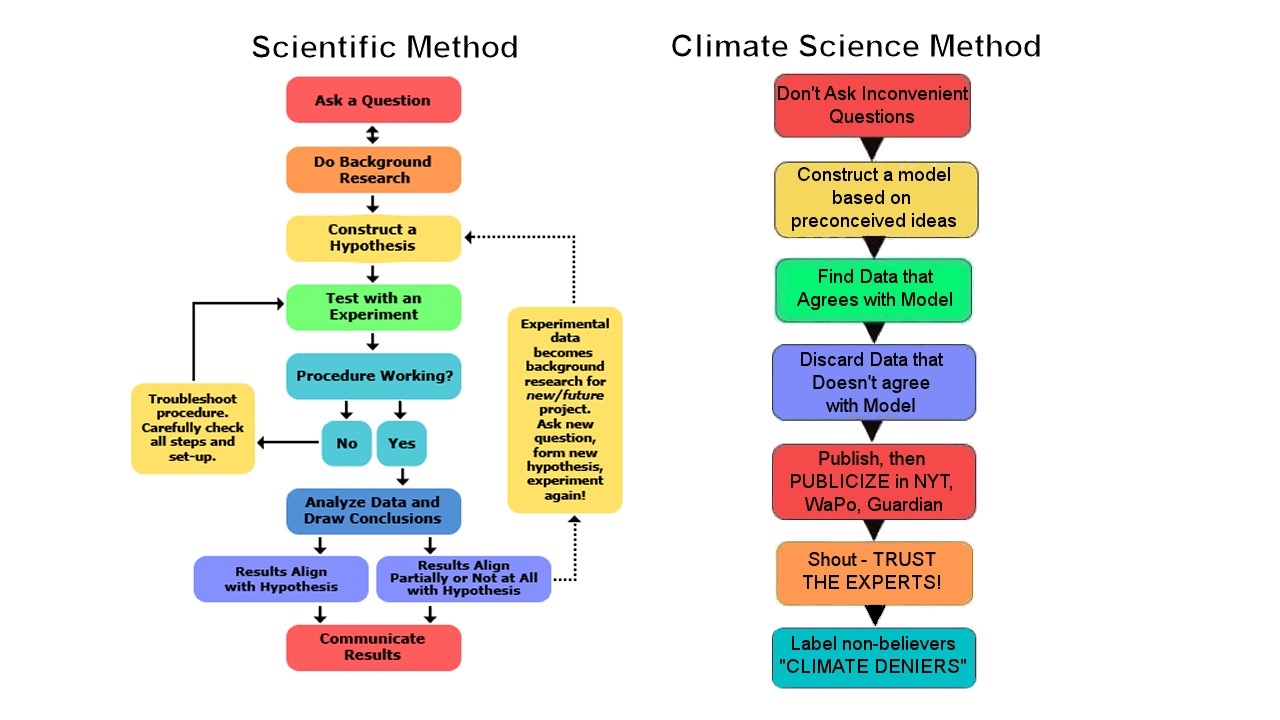
Thanks to "Old Man Winter" at WUWT for the colorful graphic.

By metmike - July 28, 2022, 12:08 p.m.
Like Reply

THIS is actually what climate change looks like to farmers and people looking at the forest and not 1 tree in the Midwest!

https://www.marketforum.com/forum/topic/87500/#87590

@kannbwx

Image

By metmike - July 28, 2022, 4:32 p.m.
Like Reply

US rainfall records.

Note that almost all of them occurred BEFORE climate change and still stand today:

Like was stated earlier in the golden rule of climate extremes. The more extreme the weather record, the more likely the cause was natural weather dynamics, independent of climate and the less likely climate change caused it.

Blaming recent weather extremes on climate change is in violation to this rule based on solid meteorological principles.  

Yes, climate change can add 1 deg. C to heat waves and .60 to record rains but not much more than that.

So the contribution from global warming is very small.

And the positive contributions to Midwest weather from climate change....... just blows away these small negatives.


By metmike - July 28, 2022, 4:41 p.m.
Like Reply

A Summary of U.S. State Historical Precipitation Extremes

https://www.wunderground.com/cat6/Summary-US-State-Historical-Precipitation-Extremes

State 24-hour and monthly precip records


Rocky Mountain states are very deficient when it comes to high precipitable water values needed for record rains but the other states have all exceeded 8.6 inches by a wide margin...........and note the dates.

Most of it happened BEFORE climate change and still stands.

https://weather.com/news/climate/news/extreme-rainfall-precipitation-recorded-50-states


By metmike - July 28, 2022, 4:55 p.m.
Like Reply

World: Greatest Twenty-four-Hour (1 Day) Rainfall

https://wmo.asu.edu/content/world-greatest-twenty-four-hour-1-day-rainfall

Record Value1.825m (71.8")
Date of Record7-8 / 1 [January] / 1966
By metmike - July 28, 2022, 5 p.m.
Like Reply

The Worst Floods in WORLD History

https://www.ranker.com/list/worst-floods-in-history/eric-vega?page=4


1. August 1931 Yangtze River, China  3,700,000 killed

2. September 1887  Yellow River, China 2,000,000 deaths

3. June 1938  Yellow River, China  800,000 deaths

4. August 1975 Banqiao, China 230,000 dead

5. 1935  Yangtze River  145,000 dead

6. November 1530 St. Felix Flood, Holy Roman Empire/Europe 100,000+ killed

7. August 1971, Hanoi/Red Rivers,  North Vietnam 100,000 dead

8. May 1911 Jiangsu-Anhui, China   100,000 dead

9. December 1287  Holy Roman Empire/Europe  50,000+ dead

10. September 1949  Guatemala  40,000 dead

11. June 1954  Yangtze River, China 30,000 dead

12. June 1974  Bangladesh  28,700 dead

13. January 1362 St. Marcellus Flood-Ireland/Britain/N.Germany 25,000+ dead

14. November 1570 All Saints Flood Netherlands 20,000+ killed

15. December 1999 Vargas mudslides Venezuela  20,000 dead  


How many of these events took place in the last 40 years?

Answer= 1

How many were caused by climate change =0


By metmike - July 28, 2022, 5:12 p.m.
Like Reply

St. Louis is on the Mississippi River, so let's look at the worst RIVER flooding on the Mississippi in history.

https://en.wikipedia.org/wiki/Mississippi_River_floods#Flood_of_1788


Worst flooding for the lower Mississippi River.

1. 1927

2. 1973

3. 1937

4. 2011


Worst flooding for the Upper Mississippi River using actual discharge/levels

1. 1844

2. 1993

So although recent rains have been excessive in some places and the atmosphere can hold potentially 7% more moisture at some times......

The worst river flooding on the Mississippi took place BEFORE climate change.

Just more evidence to support the Golden Rule of climate extremes. Thank you Cliff Mass and the National Academy of Sciences!


"The more extreme a climate or weather record is, the greater the contribution of natural variability." (and the less contribution came from climate)

"Or to put it a different way, the larger or more unusual an extreme, the higher proportion of the extreme is due to natural variability."

https://cliffmass.blogspot.com/2016/03/the-golden-rule-of-climate-extremes.html


This Golden Rule of climate extremes is violated much more than followed by many very biased scientists and politicians and by  most news sources that sensationalize extreme weather from natural variability and wrongly blame it on a non existent climate crisis.

By metmike - Aug. 4, 2022, 2:45 a.m.
Like Reply

'Warmer and wetter': US' changing climate helps fuel record Kentucky flooding, experts say

https://www.courier-journal.com/story/news/local/2022/07/29/as-floods-hit-eastern-kentucky-what-else-will-climate-change-bring/65385683007/

"Heat has proven deadly across the U.S. this summer, on track to be the hottest on record, even after last summer saw broken records in some parts of the country."

metmike: Not even close.......but they can say whatever extreme, scary and alarming things they want to with impunity as nobody holds them accountable or does fact checks on their statements, like is being done in this thread/post.


https://www.marketforum.com/forum/topic/87422/

https://www.marketforum.com/forum/topic/87422/#87425


+++++++++++++++++++++++++++++++++++

https://en.wikipedia.org/wiki/U.S._state_and_territory_temperature_extremes

https://c3headlines.typepad.com/.a/6a010536b58035970c0177435a93d5970d-pi

Since this graph above was made, in the last 20 years (since 2000) the following states have made their all time record highs: CO, SD, SC, OR and WA.

++++++++++++++++++++++++++++++


comment image


By WxFollower - Aug. 4, 2022, 1:21 p.m.
Like Reply

 When climate change alarmists or politicians immediately blame individual storms on climate change with 100% certainty even with no proof (I'd love to know how a single event like this can be connected with near certainty to CC), I cringe. This is in stark contrast imho to saying that the intensity of the 2022 European heatwave was very likely partially due to CC, which I strongly believe. Those are two totally different situations.

Remember when Gore blamed Katrina on CC? I cringed then.

So, as regards blaming individual storm effects on CC with certainty, I agree with Mike's view.

By wglassfo - Aug. 5, 2022, 1:03 a.m.
Like Reply

Hi MM

Give me a math lesson please

If I remember your post correctly you said an increase from 300 ppm to 420 is 24 %

I am always confused with numbers like this

A 50 % increase of 300 is 150 ???

So 40% of 300 is 300 x 40% - 420

 I can't come up with 24 %

I get a 40 % increase

300 x 24 % is 72 or 300 + 72 =  372 not 420

Please give me a math lesson

My Algebra days are long forgotten so I can't use that if it would apply

I will try one submit button this time and give it time to do it's thing

Sorry for the 4 post previous

My lap top is infected and acts up at odd times so????

I don't worry as I don't even have an address on this old lap top

That's why your e-mails go to my wife's computer

Ha Ha She get's the nasty e-mails and then asks me what I am doing to stir up such a hornet's nest or some thing like that. She is the sensitive type and easily offended or scared some demon will jump out at her

Always hearing noises in the house and wants me to investigate. Usually just the washing machine or dish washer but I have to find the noise [demon/robber] Heck we don't have any thing in this house worth stealing. Maybe a hand full of money/bills and coins

By metmike - Aug. 5, 2022, 6:05 p.m.
Like Reply

Hi Wayne,

Sorry for not answering earlier, just noticed this.

Glad you asked. Every time that I review this for somebody else, , I often learn a new item that I didn't know before.........and there's still tons more to learn about this for me. 

Here's the science.

As a general rule(each plant is different) for every 5 ppm increase in CO2, that plant will experience around a 1% increase in growth. Going from 300 over a century ago to the current 420 parts per million is an increase of 120 ppm. Divide that by 5 and you get 24%.

Each plant is different. Woody stemmed plants and C3 plants tend to benefit the most from increasing CO2.

One of the biggest benefits to higher CO2 actually occurs when plants are stressed by heat and drought. For instance, the stomata located on the underside of leaves, opens to intake CO2. When this happens, the plants lose water thru transpiration. Elevating CO2 levels allow the plants to get their CO2 without having to open the stomata as wide......thus conserving moisture/water.

These principles have been well known for decades but are completely hidden from the discussion by message gatekeepers.

This is a good discussion of that effect:


CO2 Enrichment and Plant Nutrition

https://buythetruth.wordpress.com/2009/08/15/co2-enrichment-and-plant-nutrition/

ResourceLimited


This thread also discusses it, shows proof and several links, including one  to access massive data(the most online) with thousands of plant studies under elevated CO2 conditions.


https://www.marketforum.com/forum/topic/69258/

By metmike - Aug. 5, 2022, 6:28 p.m.
Like Reply

I always try to think of ways to describe this that can connect with logical thinking in people.

What these alarmists are often doing is comparing today's additional heat and rain from climate change  to a world 100 years ago that was TOO COLD and TOO DRY. 

It's the coldest places in the coldest times of year that have warmed up the most.

Here's an analogy. 

Let's say that you had a large container that had a massive amount of a valuable product that you called "perfect weather" that you wanted to keep inside the container to maintain as much perfect weather as possible.


Let's say the vessel was able to hold 1,000 units of "perfect weather".

100 years ago, let's say that container was losing 100 units of perfect weather/year because of leaks.

On one end, let's say we had a leak called too cold and too dry that was responsible for losing 80 of the 100 units on average every year. 

On the other end, let's say we had a leak called too hot and too wet that was causing a leakage of 20 units of the 100 every year.


Over the next 100 years, there were alterations in the vessel/container that we can call "weather/climate changes"


The "too cold and too dry" leak was partially closed and went from leaking 80 units to leaking just 60 units. A net GAIN of 20 units of perfect weather.

The "too hot and too wet" leak opened up slightly and went from losing 20 units to losing 30 units of perfect weather inside. A net LOSS of 10 units of perfect weather.

Adding the gain of 20 units in benefits from less cold/dry losses to the loss of 10 units from more hot/wet is a net gain of 10 units of perfect weather.

And that, in essence is what we call a weather/climate crisis.

And that's why, every time this happened in the past, 4 lengthy periods in the last 9,000 years of warmer and wetter........ it was called a climate OPTIMUM because they were looking objectively at the net GAIN in perfect weather for life on this planet.

Climate crisis in its current usage is a purely political term when being applied to the massively greening planet, with its booming biosphere that features MOST life doing better because of the higher CO2(which is the building block for life) and slight beneficial warming.


By metmike - Aug. 15, 2022, 1:01 a.m.
Like Reply

Biden falsely links Kentucky floods to ‘climate change’ – Reality Check: Floods ‘have not increased in frequency or intensity’ – White House ignores peer-reviewed studies & IPCC & data

https://wattsupwiththat.com/2022/08/11/biden-falsely-links-kentucky-floods-to-climate-change-reality-check-floods-have-not-increased-in-frequency-or-intensity-white-house-ignores-pee/

metmike: Some good links in that article!