I would dare say that I can find no fundamental reason for NG to have come this far.
12 Rigs running and I have 1.
Factual article about bringing shutin production back on. Predicts all shutin prod back on by Sept 2020; not sure I believe that. Wellhead price ~$32/Bbl
https://pubs.spe.org/en/jpt/jpt-article-detail/?art=7491
From the NDIC
https://www.dmr.nd.gov/oilgas/directorscut/directorscut-2020-08-14.pdf
Oil:
June 2020 prod 890K Bbls/D
May 2020 prod 859K Bbls/D
Nov 2019 prod 1519K Bbls/D (all time high)
Gas
June 2020 prod 1,973MMcf/D
May 2020 prod 1928 MMcf/D
March 2020 prod 2899 MMCF/D (all time high)
Thanks very much Joe!!
As traders shrugged off hotter trends in the latest forecasts amid a mix of other factors weighing on prices heading toward the end of the injection season, natural gas futures pared their recent gains in early trading Wednesday. The September Nymex contract was off 2.0 cents to $2.397/MMBtu at around 8:45 a.m. ET. The latest…
August 19, 2020
Thanks Mark!
Previous discussions on natural gas:
NG 8/9/20+
28 responses |
Started by WxFollower - Aug. 9, 2020, 10:11 p.m.
Here are the temperatures and storage numbers from the last EIA report.
![]()
Weekly Natural Gas Storage Report
for week ending August 7, 2020 | Released: August 13, 2020 at 10:30 a.m. | Next Release: August 20, 2020
+58 BCF Nuetral (a tad bearish)
| Working gas in underground storage, Lower 48 states Summary textCSVJSN | |||||||||||||||||||||||||
|---|---|---|---|---|---|---|---|---|---|---|---|---|---|---|---|---|---|---|---|---|---|---|---|---|---|
| Historical Comparisons | |||||||||||||||||||||||||
| Stocks billion cubic feet (Bcf) | Year ago (08/07/19) | 5-year average (2015-19) | |||||||||||||||||||||||
| Region | 08/07/20 | 07/31/20 | net change | implied flow | Bcf | % change | Bcf | % change | |||||||||||||||||
| East | 738 | 718 | 20 | 20 | 628 | 17.5 | 666 | 10.8 | |||||||||||||||||
| Midwest | 856 | 830 | 26 | 26 | 721 | 18.7 | 732 | 16.9 | |||||||||||||||||
| Mountain | 206 | 202 | 4 | 4 | 163 | 26.4 | 181 | 13.8 | |||||||||||||||||
| Pacific | 314 | 311 | 3 | 3 | 272 | 15.4 | 292 | 7.5 | |||||||||||||||||
| South Central | 1,219 | 1,214 | 5 | 5 | 940 | 29.7 | 1,018 | 19.7 | |||||||||||||||||
| Salt | 337 | 336 | 1 | 1 | 216 | 56.0 | 261 | 29.1 | |||||||||||||||||
| Nonsalt | 883 | 878 | 5 | 5 | 723 | 22.1 | 757 | 16.6 | |||||||||||||||||
| Total | 3,332 | 3,274 | 58 | 58 | 2,724 | 22.3 | 2,889 | 15.3 | |||||||||||||||||
Totals may not equal sum of components because of independent rounding. | |||||||||||||||||||||||||
Working gas in storage was 3,332 Bcf as of Friday, August 7, 2020, according to EIA estimates. This represents a net increase of 58 Bcf from the previous week. Stocks were 608 Bcf higher than last year at this time and 443 Bcf above the five-year average of 2,889 Bcf. At 3,332 Bcf, total working gas is above the five-year historical range.
For information on sampling error in this report, see Estimated Measures of Sampling Variability table below.

Note: The shaded area indicates the range between the historical minimum and maximum values for the weekly series from 2015 through 2019. The dashed vertical lines indicate current and year-ago weekly periods.
https://www.investing.com/economic-calendar/natural-gas-storage-386
| Release Date | Time | Actual | Forecast | Previous | |
|---|---|---|---|---|---|
| Aug 20, 2020 | 10:30 | 58B | |||
| Aug 13, 2020 | 10:30 | 58B | 57B | 33B | |
| Aug 06, 2020 | 10:30 | 33B | 30B | 26B | |
| Jul 30, 2020 | 10:30 | 26B | 26B | 26B | |
| Jul 23, 2020 | 10:30 | 37B | 36B | 45B | |
| Jul 16, 2020 | 10:30 | 45B | 47B | 56B |
These are the temperatures, ending last Friday for tomorrows EIA report. Warmer than the previous week.
There are 2 natural gas seasonal graphs below.
The top one is very updated....1999-2019. The one below that is thru 10 years ago, 1991-2009.
They are almost identical thru early August............then really deviate tremendously!
What are some things we might learn from this? I would appreciate Larry and others chiming in with views.
1. Spring is an extraordinarily strong time frame for NG prices.......always has been. Something like 19 out of 20 years up for some embedded time frames.
2. Despite it being so dependable, in 2020 COVID caused the opposite to happen in unprecedented fashion.
3. Late June, thru July is the weakest period of the year historically. We started that period this year, with near record heat and CDD's being added to the weather forecast making it MORE bullish than the seasonal pressure.
4. That support gave way in early/mid July with the heat dialed in and the forecasts cooling off.
5. The August seasonal has apparently changed in the last 10 years. Used to be very weak and a continuation of the weak July(maybe it was hurricane premium coming out, when most of the production was coming from the Gulf). The more recent seasonal is nuetral for August.
6. Then, we have both graphs lining up together with Sept and Oct being very strong months historically.
7. Then, we have huge divergence which is very surprising to me based on what I "thought" which might be a bias.
I always remember November as being my most profitable month in the 1990's and it was always picking the October high and being short in November. I remember lots of Halloweens, trick or treating with the kids and having an especially fun time checking price quotes on the short positions. However, we had some very mild Novembers in the late 1990's too. ...so it makes sense.2 The 2009 seasonal shows that. However, the 2019 seasonal shows the complete opposite. The biggest difference of the year between these 2 graphs. November from the 2019 graph actually has the greatest % increase of any month. WOW!
Before commenting more, I will still need to look at HDD data for November to see if the Novembers from 2010-2019 were that much colder than the Novembers from 1991-1999 that they replaced on the 20 year chart. Memory tells me yes. Recent Halloweens for me......now trick or treating with the GRAND kids have featured everybody bundled up. Last Thanksgiving featured some major cold.
https://charts.equityclock.com/natural-gas-futures-ng-seasonal-chart
2000-2019 seasonal below

http://www.equityclock.com/charts/natural-gas-futures-ng-seasonal-chart/
 Seasonal Chart")
The above chart represents the seasonality for Natural Gas Futures (NG) Continuous Contract for the past 19 years.
Any comments are appreciated.
Natural Gas rig count was up another 1 from the all time record low of 68 on July 24th.
https://ycharts.com/indicators/us_gas_rotary_rigs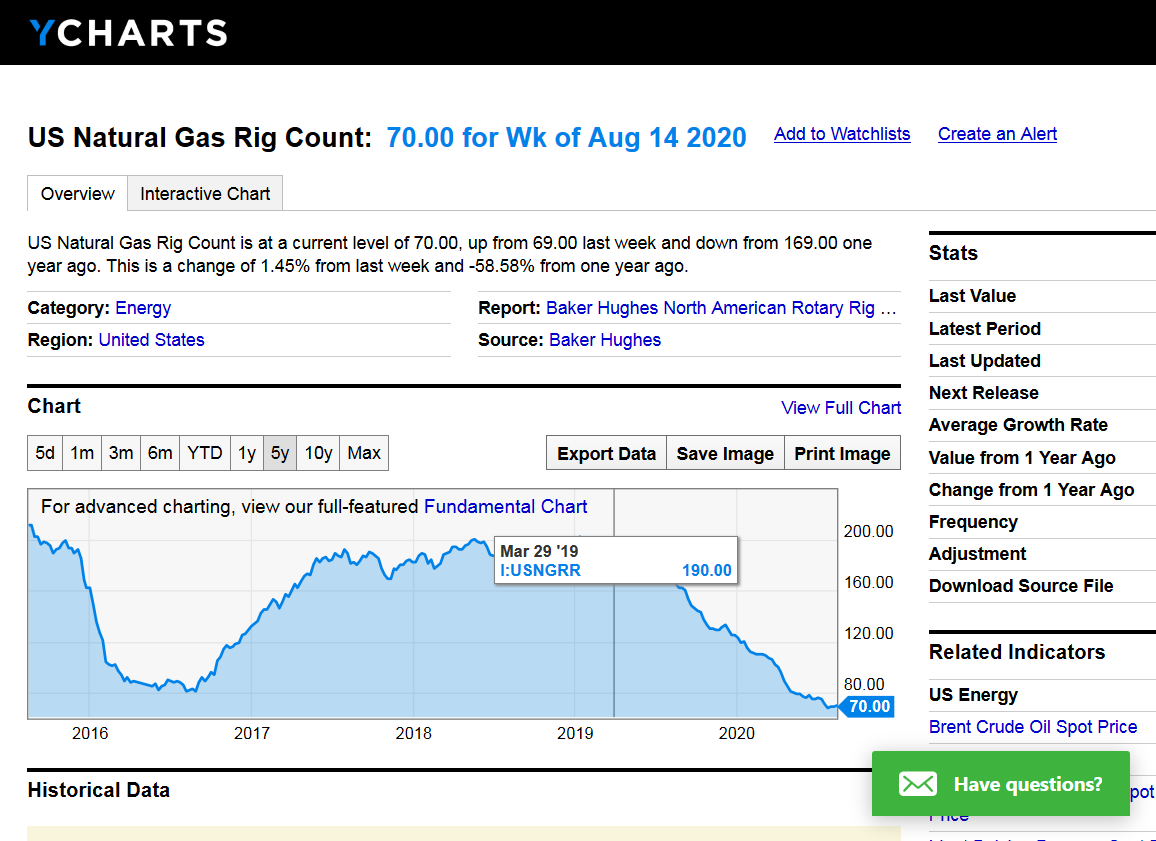
Previous outlook/forecast for prices:
By metmike - Aug. 9, 2020, 11:42 p.m.
Natural gas has broken out to the upside!
But we are overbought. The information below is not a recommendation/advise from me.
https://www.tradingview.com/symbols/NYMEX-NG1%21/
 Daily Analysis")
++++++++++++++++++++++++++++++++
By metmike - Aug. 9, 2020, 11:51 p.m.
Natural Gas Futures(NYMEX:NG1!) 2.2540.0160.71%
ThinkingAntsOk Aug 7

+++++++++++++++++++++++++++++++++++++++++++++++++++++++++++++++++++++++

Main items we can see on the chart:
a) The price was inside a range after reaching a major Support Zone
b) Currently, the price has broken the range with a solid bullish movement
c) Now we are expecting a clear correction about 3 weeks
d) If that happens we will be ready to take long positions based on our weekly perspective
Weekly Perspective
metmike: Note below, that production drops more than consumption in the forecast.
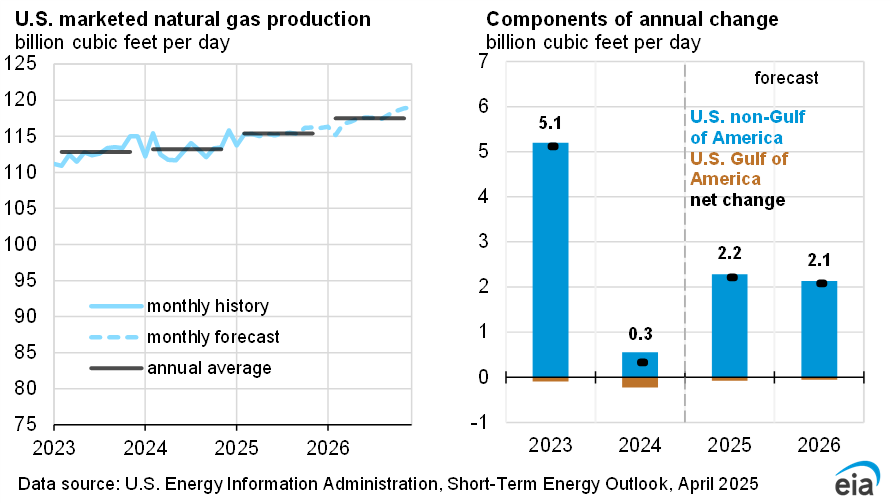
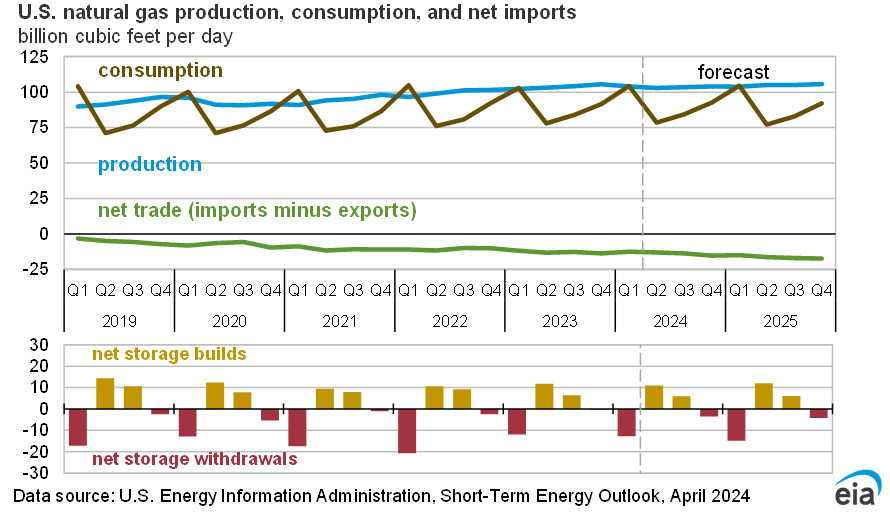
Continued higher prices are expected.
Wednesday weather:
NGI after the close Wednesday:
After pushing above $2.40/MMBtu, natural gas futures steadied a bit Wednesday as traders looked ahead to the newest government storage data for further direction. The September Nymex gas futures contract settled at $2.426, up nine-tenths of a cent from Tuesday’s close. October nudged 0.007 cents higher to $2.563. Spot gas prices were mixed as the…
August 19, 2020
![]()
for week ending August 14, 2020 | Released: August 20, 2020 at 10:30 a.m. | Next Release: August 27, 2020
+43 BCF Bearish
| Working gas in underground storage, Lower 48 states Summary text CSV JSN | |||||||||||||||||||||||||
|---|---|---|---|---|---|---|---|---|---|---|---|---|---|---|---|---|---|---|---|---|---|---|---|---|---|
| Historical Comparisons | |||||||||||||||||||||||||
| Stocks billion cubic feet (Bcf) | Year ago (08/14/19) | 5-year average (2015-19) | |||||||||||||||||||||||
| Region | 08/14/20 | 08/07/20 | net change | implied flow | Bcf | % change | Bcf | % change | |||||||||||||||||
| East | 750 | 738 | 12 | 12 | 653 | 14.9 | 688 | 9.0 | |||||||||||||||||
| Midwest | 880 | 856 | 24 | 24 | 751 | 17.2 | 757 | 16.2 | |||||||||||||||||
| Mountain | 209 | 206 | 3 | 3 | 167 | 25.1 | 184 | 13.6 | |||||||||||||||||
| Pacific | 313 | 314 | -1 | -1 | 273 | 14.7 | 293 | 6.8 | |||||||||||||||||
| South Central | 1,223 | 1,219 | 4 | 4 | 936 | 30.7 | 1,012 | 20.8 | |||||||||||||||||
| Salt | 335 | 337 | -2 | -2 | 208 | 61.1 | 253 | 32.4 | |||||||||||||||||
| Nonsalt | 888 | 883 | 5 | 5 | 729 | 21.8 | 758 | 17.2 | |||||||||||||||||
| Total | 3,375 | 3,332 | 43 | 43 | 2,780 | 21.4 | 2,933 | 15.1 | |||||||||||||||||
Totals may not equal sum of components because of independent rounding. | |||||||||||||||||||||||||
Working gas in storage was 3,375 Bcf as of Friday, August 14, 2020, according to EIA estimates. This represents a net increase of 43 Bcf from the previous week. Stocks were 595 Bcf higher than last year at this time and 442 Bcf above the five-year average of 2,933 Bcf. At 3,375 Bcf, total working gas is above the five-year historical range.
For information on sampling error in this report, see Estimated Measures of Sampling Variability table below.
Note: The shaded area indicates the range between the historical minimum and maximum values for the weekly series from 2015 through 2019. The dashed vertical lines indicate current and year-ago weekly p
https://www.investing.com/economic-calendar/natural-gas-storage-386
| Release Date | Time | Actual | Forecast | Previous | |
|---|---|---|---|---|---|
| Aug 20, 2020 | 10:30 | 43B | 43B | 58B | |
| Aug 13, 2020 | 10:30 | 58B | 57B | 33B | |
| Aug 06, 2020 | 10:30 | 33B | 30B | 26B | |
| Jul 30, 2020 | 10:30 | 26B | 26B | 26B | |
| Jul 23, 2020 | 10:30 | 37B | 36B | 45B | |
| Jul 16, 2020 | 10:30 | 45B | 47B | 56B |
The U.S. Energy Information Administration (EIA) reported a 43 Bcf injection into natural gas storage inventories for the week ending Aug. 14, a figure that was right in line with market expectations. Natural gas futures, which were trading slightly lower ahead of the report, remained in the red after the data was released. At about…
August 20, 2020
metmike: Actually, we saw in knee jerk spike lower on the release of the data, then a quickly recovery to higher, then sold off again to modestly lower.
This is why I've lost more money trading after EIA reports than any other time.
It took some convincing, but traders have woken up to the incredible looseness still penetrating the natural gas market. After a bearish storage report, the September Nymex gas futures contract dropped 7.4 cents to $2.352. October fell 6.0 cents to $2.503. Spot gas prices also were mostly lower, with steep decreases continuing to be seen…
August 20, 2020
As analysts highlighted evidence of potential regional storage constraints heading into the end of the injection season, natural gas futures extended the previous session’s losses in early trading Friday. The September Nymex contract was down 4.4 cents to $2.308/MMBtu at around 8:40 a.m. ET. The Energy Information Administration (EIA) on Thursday reported a 43 Bcf…
metmike: Some hot weather the next 6 days with September possibly being very warm for much of the country.
However, this does not explain the huge reversal up from modestly lower early this morning to sharply higher by the afternoon.
After a bit of choppy trading, natural gas futures closed out the week on stronger footing after an earlier slide into the red. The September Nymex gas futures contract settled Friday at $2.448, up 9.6 cents on the day. October moved up 7.0 cents to $2.573. Spot gas prices were mostly lower despite warmer weather…
August 21, 2020
metmike: I totally forgot earlier about the 2 tropical systems tracking thru the GOM the next week. Surprise NGI did not mention it. This must have had a great deal to do with the huge reversal higher today.
Super Sunday to you! Here's your weather:
https://www.marketforum.com/forum/topic/58036/
Temps are looking COOLER/BEARISH, after the heat for the next several days.
2 hurricanes in the GOM will cause some shut in production...........both tracking over production areas.
https://www.marketforum.com/forum/topic/57763/
Marco is a wimp the next day.
Laura should be stronger in a couple of days.
![[Key Messages]](https://www.nhc.noaa.gov/storm_graphics/AT14/refresh/AL142020_key_messages+png/145755_key_messages_sm.png)
![[Key Messages]](https://www.nhc.noaa.gov/storm_graphics/AT13/refresh/AL132020_key_messages+png/144355_key_messages_sm.png)
++++++++++++++++++++++++++++++++++++++++++++++++++++++++++++++++
https://www.enverus.com/blog/offshore-rigs-primer-offshore-drilling/

https://aoghs.org/offshore-history/offshore-oil-history/
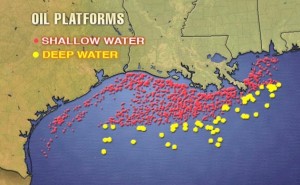
Studies show that offshore platforms attract – and significantly increase – the numbers and species of fish. Today, 75 percent of recreational fishing trips off Louisiana visit one or more rig sites. Photo courtesy Pensacola Fishing Forum.
Natural Gas Intelligence Monday Morning:
Two tropical cyclones threatened the Gulf of Mexico (GOM) Monday, prompting offshore production shut-ins and lifting natural gas futures in early trading. The September Nymex contract was up 4.4 cents to $2.492/MMBtu at around 8:45 a.m. ET. Tropical Storm Marco has weakened, but Tropical Storm Laura is now on course for the Texas and Louisiana…
metmike: All eyes are on Laura which could become a major hurricane on Wednesday:
https://www.marketforum.com/forum/topic/57763/
The temperature forecast is not impressive enough to be the main focus.
The front month, September expires on Thursday. Volatility is often much higher when we get close to contract expiration(and open interest/volume has been whittled down, so large orders don't have as much offsetting size close to the market)